1. Introduction
To satisfy the rapidly increasing demand for more energy supply, one way is to merge several regional power grids into a single massive power system, such as the Super-grids plan in Europe and Ultra-High-Voltage AC/DC (UHV AC/DC) systems in China [
1,
2,
3]. The advantages of such interconnection includes: (1) increasing the penetration of renewable energy resources into the transmission system, which is known to have both economic and environmental benefits; and (2) enabling long-distance power delivery to the load center where the power supply shortage is serious while the potential for increasing local power supply is limited. The increasing integration of renewable energy, especially wind and solar energy, greatly changes the distribution of power supply in aspects of space and time [
4,
5,
6]. Unlike thermal and hydro generation, these renewable sources are relatively uncontrollable and unpredictable, and their generation can change the power flow frequently. These properties could increase the probability of some unexpected emergencies such as overload of transmission lines and under-voltage of buses, which are traditionally the consequences of faults such as line tripping, sudden loss of bulk generation, etc. Due to the increasing probability of these emergency scenarios, utilities are implied to look for active solutions.
Possible ways to erase these emergencies include generation adjustment, load shedding (LS), and corrective switching. Although hydro generation can be adjusted quickly, the adjustment of thermal generation is quite slow for solving these emergencies while the generation of wind and solar energy is hard to adjust. These impede the implementation of generation adjustment for these emergencies. Although LS is an effective measure for these emergencies, some policy is released to ensure the power supply for the users, which imposes constraints on load shedding. Excessively large scale LS, based on its percentage in total load, could lead to high penalty. Thus, the utilities are motivated to investigate more on using corrective switching to help reduce LS amount needed in emergencies, due to its effectiveness and much lower cost. Furthermore, if using certain grid topology over a long time is vulnerable due to the frequent variations of renewable generation, it is reasonable to implement corrective switching to deal with the uncontrollability and unpredictability and thus ensure the secure power supply.
Corrective switching of transmission systems mainly focuses on emergency control for overload and voltage violence, or minimizing losses or costs in normal state for operation planning, with control measures such as tap position of transformers, bus-bar splitting/coupling, shunt and line switching, etc. In both categories, the difficulties in solving corrective switching problem are usually caused by its nonlinearity nature and NP-hardness from the curse of dimension. Therefore, much attention was paid to coordinate the optimality and computational efficiency with different techniques such as linearization, reduction, switching priority, etc. [
7,
8,
9,
10]. In the category of emergency control, AC power flow is commonly used since accurate computation for power flow and voltage is of great concern [
11]. Reference [
12] uses the sensitivity information, which represents the impact of the measures on a margin index, to quickly find a sub-optimal but acceptable solution. It also implements two methods to guarantee the computational accuracy and efficiency for the online application: the sparse inverse technique and fast decoupled power flow (FDPF) with limited iteration count for line and bus-bar switching, and the voltage distribution factor (VDF) method for shunt switching. Reference [
13] seeks to quickly reduce the domains of variables by constraint programming (CP) and thus separate the solving process into two phases: (1) determine the binary variables with CP; and (2) solve the continuous variables with linear programming. On the other hand, in the category of minimizing costs, DC power flow is commonly used for linearizing the problem since only active power is of great interest. The original problem is then modeled as a multivariable mixed-integer programming (MIP) problem with binary switching variables. The results of References [
14,
15] show that pure mathematic programming could be slow in solving the problem (over 30 min). However, online application requires extremely fast solution times [
16]. Therefore, some researches devote to solve corrective switching in a more heuristic way. For example, Reference [
17] use the sensitivity information to select candidate lines to change status while maintaining system connectivity and limiting computational efforts. Recently, new factors are considered in this category, such as Reference [
18], in which seasonal switching is considered and solved by a decomposition method, and References [
19,
20], in which probability is considered to deal with the uncontrollability of renewable generation.
Traditionally, in the category of emergency control, corrective switching is modeled as a single-objective problem (SOP) to meet the security requirement with least cost. The result is solved without considering the performance of the changed topology to defend another possible disturbance, such as line-tripping, or possible variation in renewable generation and load. Hence, a scheme with very low security margin could be obtained by single objective method and thus could be vulnerable under further disturbances, such as quick variations in renewable generation and other subsequent faults. However, since the quick variation in renewable generation and other faults can make the system remain at risk of unexpected emergencies, it is expected to consider renewable generation variations and the possible subsequent disturbances, while the increase in cost is not too much. In this paper, it is realized by extending the number of the objectives to form a multi-objective optimization problem (MOP), with comprehensively considering the economics, security and reliability as objectives. These objectives together could provide a comprehensive evaluation of each corrective switching scheme, and help to obtain a good trade-off among these aspects and guide the decision-making for emergency scenarios. How to model and optimize such a MOP with binary switching variables deserves further investigations. The results of multi-objective switching for normal operating scenarios can be found in [
21]. However, for emergency scenarios, the results of such kind of study are not widely available in open literatures.
The MOP can be transformed into a SOP by weighted summing method and a set of non-dominated solutions can be obtained by adjusting the weight factors. In addition, the lexicographic method is also capable of solving a MOP as a SOP, which deals with the objectives in sequence. The eps-constraint method [
22] and diverse artificial intelligent optimization algorithms, such as the multi-objective genetic algorithm (MOGA) [
23,
24,
25] and the multi-objective particle swarm optimization algorithm (MOPSO) [
26,
27] are widely utilized to search the Pareto optimal solution set. Moreover, some other artificial intelligence algorithms, especially the deep learning [
28], can be effective to solve the problem. The above mathematic programming methods are time consuming and not suitable for online application. Besides, a model with more than five objectives is a high-dimensional MOP, which makes some algorithms, such as the MOGA and the MOPSO, become ineffective.
The corrective switching is implemented as an online control measure of power system to handle unexpected emergencies. Although lots of effort has been made to predict renewable generations, the power grid could still be at risk due to the emergencies caused by quick variations of these resources, especially during extreme weather conditions when the variations are hard to accurately predict and the time left for decision-making could be short. Thus, a fast and acceptable engineering scheme is more significant than an accurate global optimal solution [
11].
Based on the analysis above, the corrective switching problem for emergency scenarios in this paper is built as a MOP, with the objectives extended as a set of evaluation criteria covering economics, security and reliability. Meanwhile, the problem is a 0-1 integer optimization problem, of which the decision variables represent the On/Off states of switching devices. To decrease the computation time, a two-phase optimization approach is proposed using a feasible set silting method and the technique for order preference by similarity to an ideal solution (TOPSIS) method. Firstly, the solution space is reduced to a candidate set of corrective switching schemes by the feasible set silting method. After silting method, the TOPSIS, which is efficient in dealing with the trade-off among multi-objectives and is easy to use, is implemented to determine the ultimate engineering scheme from the candidate set. The validity of the proposed approach and its advantages over single-objective method are testified in both overload and under-voltage scenarios. The result of the proposed approach could help to guide the decision-making in emergency scenarios.
Overall, the main contributions of this paper are summarized as follows:
- (1)
The corrective switching is implemented as an online control measure rather than a part of day-ahead scheduling to tackle unexpected emergencies of power system, such as overload and under-voltage, and guarantee the ability to defend further disturbances. A fast and appropriate online scheme-making framework is developed.
- (2)
A multi-objective optimization model is established, which incorporates six contradictory objectives covering the aspects of economics, security and reliability, and both the control cost and the endurance of subsequent disturbances are taken into account.
- (3)
A two-phase optimization approach is proposed to solve the multi-objective 0-1 integer optimization problem and obtain a fast and acceptable engineering solution, where a feasible set silting method is utilized to reduce the discrete feasible region, and then the TOPSIS method is used to coordinate the contradictory objectives and determine the ultimate scheme.
The rest of this paper is organized as follows. The corrective switching model is established in
Section 2. The two-phase optimization approach is proposed in
Section 3. Cases are studied in
Section 4. Conclusions are drawn in
Section 5.
2. Multi-Objective Model for Corrective Switching
2.1. Model Structure
Corrective switching of transmission system can be modeled as a multi-objective 0-1 integer optimization model:
The objectives include evaluation criteria from the aspects of economics, security and reliability. They are classified into two categories: minimization objectives, including load shedding cost and penalty (LSCP) , switching times (ST) , short-circuit current (SCC) , terminal load (TL) , etc.; and maximization objectives, including system security margin (SSM) , regional ratio of capacity-load ratio (RRCL) , etc.
Constraints include:
Device security constraints, , where is the device security margin of the th device, and is the corresponding threshold of this device. is the total number of the devices.
On/Off state of the switching devices, , where is the On/Off state of the th switching device with On is represented by 1 and Off is represented by 0. is the total number of the switching devices.
The decision variables in this model are the On/Off state variables , which can be 0 or 1, and the problem is a 0-1 optimization problem.
2.2. Evaluation Criteria for Objectives
The evaluation criteria of corrective switching cover economics, security and reliability aspects, which are categorized below:
Economics: LSCP, , and ST, .
Security: SCC, , and SSM, .
Reliability: RRCL, , and TL, .
The definition and computation of these criteria is also given in order, where all the values needed for computation are obtained from AC power flow calculation. These criteria are used to compare the impact of the schemes on these aspects, and, more importantly, help find the optimal scheme that can suitably deal with the trade-off among them. For instance, although less switching times mean less friction losses of the breakers, more switching times could increase the degree of security and enhance the capability in enduring another contingency.
2.2.1. Economics Criteria
(1) Load shedding cost and penalty (LSCP)
Good corrective switching scheme could greatly decrease the load shedding cost and penalty. This criterion,
, is computed by:
where
is the unit load shedding cost of the
th load shedding variable;
and
are load shedding amount of adopting corrective switching or not, respectively; and
and
are the penalty of adopting corrective switching or not, respectively. The first term is the load shedding cost decreased by corrective switching, and the second term is the penalty decreased by corrective switching.
(2) Switching times (ST)
Greater switching times lead to greater switching friction losses, which directly decrease the life length of the breakers. This criterion is represented by .
2.2.2. Security Criteria
(1) Short-circuit current (SSC)
Switching on some devices could increase the short-circuit current, which might cause severe damage to the primary and secondary devices, and make it difficult for breakers to switch off. Therefore, the short-circuit current of all the buses should be less than the rated value of current breaker. This criterion,
, is computed by:
where
and
are the short-circuit current of the
th bus and the rated value of the corresponding circuit breaker, respectively.
(2) System security margin (SSM)
System security margin,
, is to evaluate the overload or under-voltage security of the whole power system. For overload, this criterion is computed by:
where
and
are the apparent power and the rated apparent power of the
th device, respectively.
For under-voltage, this criterion is computed by:
where
and
, denoted in per unit, are the voltage of the
th bus and the lower limit, respectively.
For both scenarios, if , then the system is still insecure; otherwise, the system is secure. A larger could better enhance the degree of security.
2.2.3. Reliability Criteria
(1) Regional ratio of capacity and load (RRCL)
Regional ratio of capacity and load,
, is to evaluate the power supply margin. This criterion is computed by:
where
and
are the power supply capability and the maximum load of the
th region, respectively. The greater this criterion is, the larger the regional power supply margin is.
(2) Terminal load (TL)
Terminal load,
, is to evaluate the reliability of the system, by the ratio of the summary of the load of the terminal substations and the total load of the whole systems. Terminal substation is defined as the ones that will be separated from the power systems due to the faults that trip a device. This criterion is computed by:
where
is the load of the
th terminal substation.
is the total load. The increase in this criterion will decrease the supply reliability.
2.3. Device Security Constraints
In this paper, the emergency scenarios to be focused are overload and under-voltage. How to compute device security margin for these two cases is different, which is listed below.
(1) Overload devices
For transmission line, its
is computed by:
where
is the current of the line, selected as the larger one of the terminal current of the line.
is the rated current.
For transformer, its
is computed by:
where
denotes the
th winding of this transformer.
,
,
and
are apparent power, rated capability, voltage, and rated voltage of the
th winding.
(2) Under-voltage of load bus
The device security margin of the
th under-voltage bus is computed by:
where
and
, denoted in per unit, are the voltage and the lower limit of the
th bus, respectively.
2.4. On/Off State of the Switching Devices
The switching devices for corrective switching can be categorized to switch-off devices such as breakers and switch-on devices such as suspended lines. For the switch-off devices, the execution time is very short, which is usually 1–2 cycles. However, for the switch-on devices, the execution time could be relatively long, which is usually 1–5 min. Therefore, it is important to verify that the execution time of these devices can be less than the tolerance time of the emergency scenarios before they are selected as the available switching devices. For instance, the execution time should be less than the triggering time of the overload relay in overload scenario. The analysis on this time constraint for overload and under-voltage is given below.
Greater overload in transformers and lines leads to shorter tolerance time, and their relation can be calculated based on the environment condition, parameters of devices, etc. For instance, overload-tolerance relation of a typical 220 kV mineral-oil-immersed transformers is shown in
Table 1, with 40 °C environment temperature and full-loading before overload test [
29,
30]. By this table, it can be decided whether a switching device is applicable or not in specific overload scenario. If there are no devices applicable, immediate execution of LS is recommended since overload protection could be triggered, leading to unpredictable events and cascading failure. Similar conclusion can be drawn from the overload-tolerance relation of 500 kV transformers and transmission lines.
When the voltage amplitude is slightly lower than the lower limit, but still higher than the pre-set value of under-voltage load shedding (UVLS), this situation can be tolerated for a relatively long time. If the amplitude is lower enough to trigger UFLS, corrective switching should be omitted.
Another issue for the switching devices to be selected as available is that the phase-angle difference of these switching devices should be a small value, especially for switch-on devices. A guideline from a Chinese utility is defined as: no greater than 20 degree for 500 kV-level transmission devices, and no greater than 25 degree for 220 kV-level transmission devices. This guideline is used in the case studies to test whether a switching device can be selected.
3. Two-Phase Optimization Approach Based on Silting Method and TOPSIS
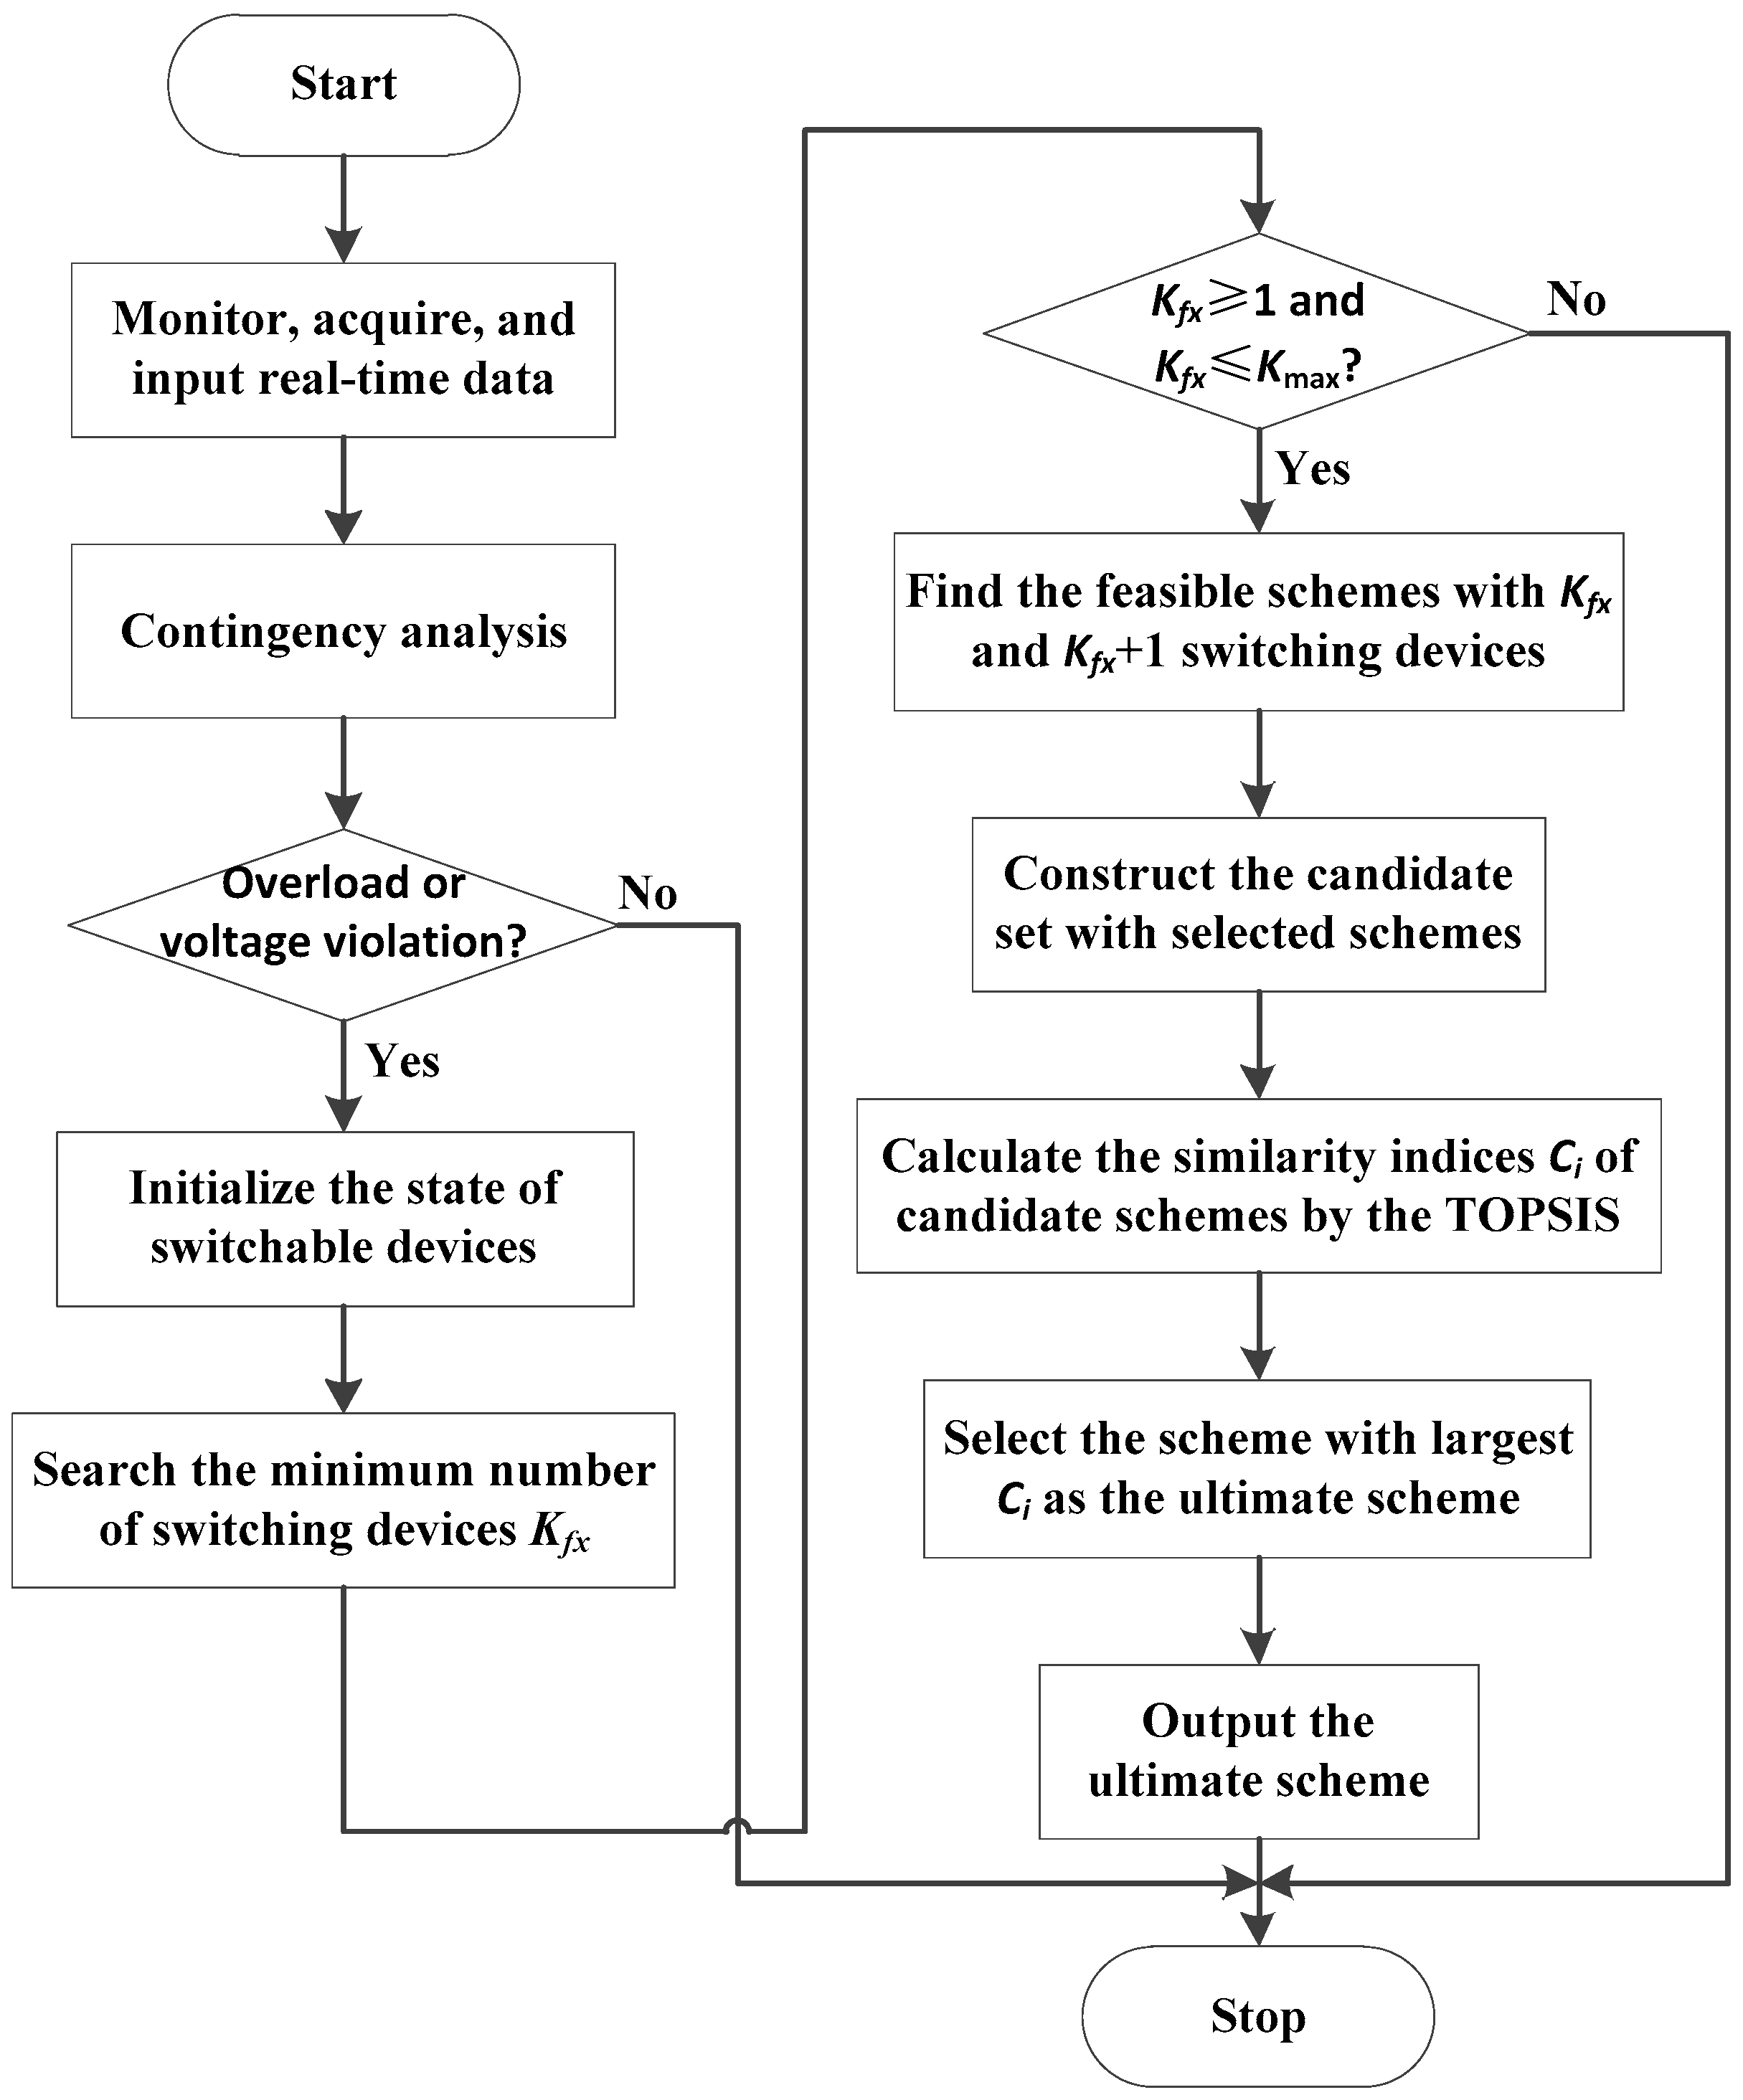
Some issues should be dealt with to provide a good corrective switching scheme. First, contradiction among some objectives makes it difficult to coordinate them in the optimization process. For instance, higher security margin usually requires higher cost. Besides, the computation efficiency rather than a global optimal solution should be guaranteed, especially when the number of the available measures could lead to the curse of dimensionality. Therefore, a two-phase optimization approach is proposed to limit the computation time and obtain an acceptable engineering scheme, as shown in
Figure 1.
From
Figure 1, the two-phase optimization approach is implemented online and the real-time monitoring data of power system is taken as the input. In the first phase, a feasible set silting method is used to reduce the discrete feasible region and quickly construct a candidate set of potential corrective switching schemes. Then, in the second phase, the TOPSIS method is utilized to coordinate different objectives and determine the ultimate engineering scheme from the constructed candidate set.
To better illustrate the effect of corrective switching in decreasing the load shedding cost, the load shedding method is also given at the end of this section, which obtains the optimal load shedding. All the load shedding costs in the Case Studies are obtained via this method.
3.1. Feasible Set Silting Method
Feasible set reduction, such as including additional constraints, is a powerful and useful method to simplify problem and accelerate computation speed [
12,
31]. With regard to the integer optimization problem or subproblem, the effect of simplification and acceleration is more significant, since the feasible set is finite. To decrease computation time of the 0–1 optimization problem, the feasible set silting method is proposed to reduce the solution space and construct a candidate set of feasible corrective switching schemes. Feasible scheme means it can at least eliminate the emergencies and meet the security constraints, and additional performance indices, i.e., the sensitivity of recovering security margin, are defined for silting the feasible set. The performance of each corrective switching scheme is evaluated by comprehensively considering all the insecure devices (i.e., have security margin less than 0). The higher the performance index is, the better it can reduce the degree of emergencies. By comparing the performance index of different corrective switching schemes, a candidate set can be quickly selected which satisfies the device security constraints.
- (1)
Performance index of overload for the
th corrective switching scheme,
, is computed by:
where
is the number of devices that endure overload.
is the device security margin of the
th overload transmission line or transformer, while
is the variation of the margin of
th device after the scheme is implemented.
can be seen as “improvement” of the security margin of the
th overload device.
can been seen as the “weight” of the
th insecure device on the performance index, then the device with lower security margin will have more effect on the performance index.
- (2)
Performance index of under-voltage for the
th corrective switching scheme,
, is computed by:
where
is the number of devices that still endure under-voltage;
is the device security margin of the
th under-voltage bus, while
is the variation of the margin of
th bus after the scheme is implemented;
is the voltage lower limit of the
th bus in terms of p.u.
can be seen as “improvement” of the security margin of the
th under-voltage bus.
can been seen as the “weight” of the
th insecure bus on the performance index, then the bus with lower security margin will have more effect on the performance index.
- (3)
If both overload and under-voltage happen, then the performance index is obtained by adding up the values from Equations (11) and (12):
The sifting procedure is described below. Note that, if at least switching devices should be switched on to satisfy the security requirement, then only candidate schemes that require and switching devices in service are selected. This is to avoid unnecessary switching loss.
- (1)
Set device counter, , as 1. Assume that switching devices have already been put in service, and these devices are included in a set, denoted by .
- (2)
Form a set of schemes with switching devices in service by combining one of the remaining switching devices with , and compute the performance index of these schemes by Equations (11), (12) or (13). If there are feasible schemes existed, include them into the set, , and move to Step 3. If not, then select the one with highest performance index from the remaining switching devices and put it into , and return to Step 2.
- (3)
Set , then at least switching devices are needed to satisfy the security requirement and solve the emergency. If , move to step 4. If not, corrective switching cannot tackle the disturbance.
- (4)
Based on the feasible schemes with switching devices, test the possibility of the schemes with switching devices in service, by combining one of the remaining switching devices with the feasible schemes in , and include schemes that can satisfy the security requirement into .
- (5)
The set comprising the feasible schemes with and switching devices is selected as the candidate set and can be further dealt with by the TOPSIS.
Since too much switching could greatly increase the difficulties in execution process and lead to unpredictable problems, an upper limit, , can be imposed on the switching times. If is greater than and there are still no schemes that can satisfy the security constraints, the optimization should be terminated with no schemes provided for optimization.
3.2. TOPSIS-Based Multi-Objective Optimization
Some objectives of the model are contradicted with each other, such as switching times and system security margin. Moreover, the optimality judgment of a corrective switching scheme relies on its comparison with others. Therefore, technique for TOPSIS method is selected, which is usually used when dealing with a set of contradictory objectives. This method of compensatory aggregation compares a set of alternatives by identifying weights for each criterion, normalizing scores for each criterion and calculating the geometric distance between each alternative and the ideal alternative, which has the best score in each criterion. The optimal alternative should have the shortest geometric distance from the positive ideal solution (PIS) and the longest geometric distance from the negative ideal solution (NIS). The procedure of TOPSIS is listed below [
32,
33].
- (1)
Assume that there are
feasible schemes and
criteria. Create an evaluation matrix,
, with the intersection of each scheme and criteria given as
, expressed by:
where
is the
th criterion of
th scheme. For the purpose of simplification and better understanding, it is recommended to have all the criteria with the same monotonicity by using the reciprocal or negative value of some criteria.
- (2)
Calculate the normalized evaluation matrix to eliminate the effect of different dimension of different criteria, by:
- (3)
Obtain the weight factor of each criterion by Delphi method [
34], which could utilize the knowledge of the experts by repeatedly feedback.
It is implemented via:
- (a)
Every expert individually estimates the weight of each criterion.
- (b)
Return the mean value and variance of the estimated weights to the experts, and request them to individually estimate the weights again.
- (c)
Repeat this feedback process until the variance is lower enough, and set the mean value as the weight of each criterion.
All the weight factors can form the weight matrix
, expressed by:
- (4)
Calculate the weighted evaluation matrix,
, by:
- (5)
Determine the PIS, , and the NIS, , where and are the best and worst value of the th criterion, respectively.
- (6)
Calculate the geometric distances from each feasible scheme to
and to
, represented by
and
, respectively.
- (7)
Calculate the similarity index,
, of each feasible scheme to NIS, by:
- (8)
Select the feasible scheme with largest as the optimal solution.
For the optimization of emergency corrective switching, the objectives of Equation (1) can be taken as the criteria in the TOPSIS method, i.e., , , , , , and . To determine the weights, the Delphi method is utilized, since currently there is no certain way to determine the weights of the criteria of economics, security and reliability and thus it should be done via a decision-making process. Delphi method requires each expert to anonymously provide their decision and reveal their reasoning on their own, and feedbacks all information of the last round to each expert to re-adjust their decision. It has the advantage of better aggregating the information of each case and the knowledge of experts. Since Delphi method is implemented anonymously for each expert, it can encourage experts to openly express their reasoning, and can avoid the shortcoming of conforming too much to the group leader.
3.3. Computational Time Analysis
Since solving process for TOPSIS only consists of matrix computation, their computational time is very short and thus can be reasonably ignored. The computational time of this approach is mainly occupied by the AC power flow computation in feasible set silting method. On a PC computer with 2.33 GHz CPU and 4 GB RAM, with commercial power flow computation software being used, a typical solving time for solving a system with 140 nodes is ≈ 1.2 s.
Note that, in Steps 2 and 4 of the silting method, those candidate schemes are independent from each other, and thus parallel computation can be used to shorten the time needed for solving AC power flow computation for all these candidate schemes. Assume that
cores CPU is used, and
candidate schemes need to be solved in the same step, then the theoretical time for solving them is:
where
is a function of
. The operator [▪] returns the least non-negative integer that is greater than the value in it.
Let the number of the feasible schemes obtained with
switching devices to be
, then
. The total computational time needed for silting method can be approximated by:
where the first and the second terms are the times needed by Steps 2 and 4 of the silting method, respectively.
This is a conceptual upper bound for . If let and (2.33 GHz CPU), and use ≈ 1.2 s, then is bounded by 48 s. Note that if more cores and faster CPU are used and better programming power flow computation package is incorporated, this time can be expected to be less than 1 min, which can meet the online application requirement.
3.4. Load Shedding Method
Load shedding amount is obtained by repeatedly selecting the load shedding variable with largest performance index, and shedding some load at this variable with certain amount. This process is terminated when the security requirement is satisfied. The performance index can be obtained by Equations (11), (12) or (13). Note that the measure here used for performance index computation is not corrective switching scheme, but shedding certain amount of load at each load shedding variable.
4. Case Studies
In this section, two study cases are analyzed to testify the proposed approach. For comparison, a mono-objective method is considered, whose principle is similar to that of [
12], with SSM as the only objective (i.e., only SSM needs to be recovered to an acceptable level). In the method of [
12], fast decoupled power flow is utilized to obtain the power flow information to compute the performance indices. The selected candidates are ranked by the performance indices, and the full AC power flow is applied to the ranked schemes to verify the feasibility sequentially and the first feasible one is determined as the ultimate scheme. Note that only one switching device is allowed to be switched in the switching scheme, which is assumed to avoid negative effects and system instability. Similarly, the mono-objective method in this paper also ranks the candidates by the performance indices as provided by Equations (11) and (12), and selects the device with the largest index as the final corrective switching scheme. Only one device is allowed to be switched.
The optimization variables of the proposed approach and the method used in [
12] are 0-1 integer variables which represent the On/Off states of switching devices. The iteration step size of each method is the inverse of an optimization variable, i.e., the On/Off state inverse of a switching device. Hence, the resolution of each optimization variables is 0 or 1, and the resolution of a feasible scheme is the inverse of an optimization variable.
4.1. Case 1: Overload Emergency
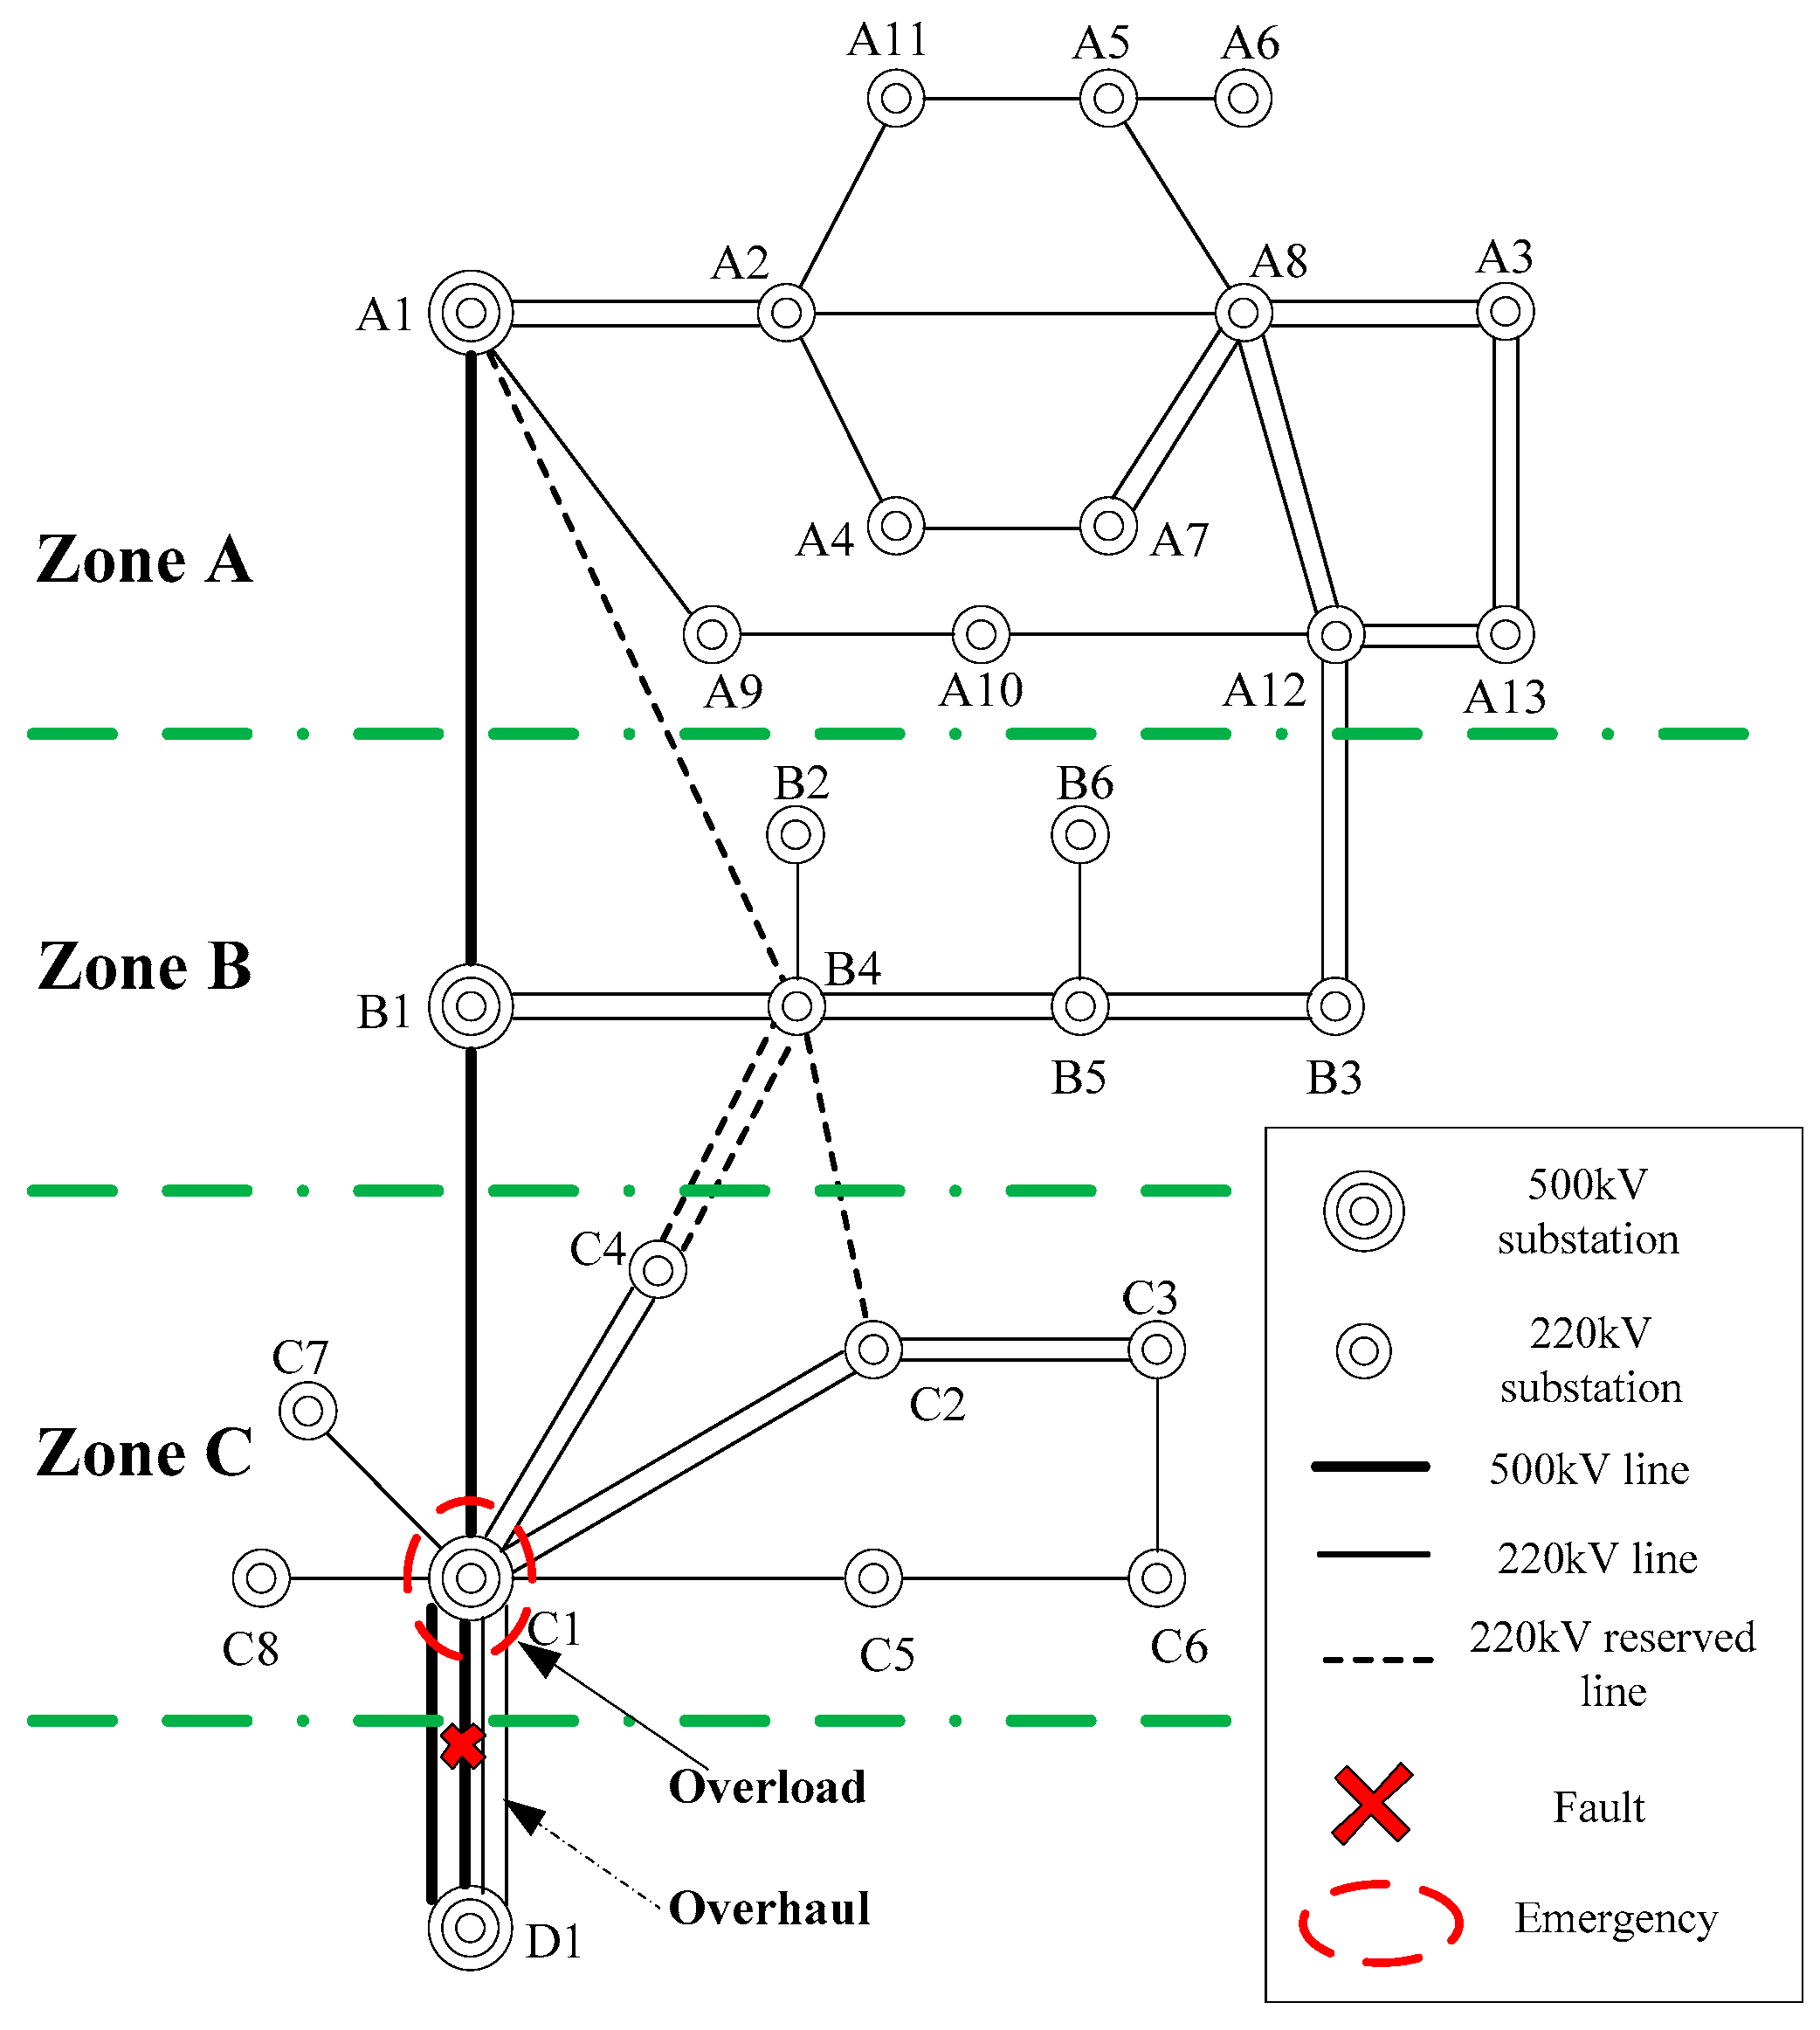
Use a regional power system to testify the validity of the proposed approach. The topology of this system is shown in
Figure 2, with three zones. The lower limit of the voltage is set as 0.9 p.u. The threshold vector,
, is set as 0. The interrupting current of breakers in the 525 kV-level grid is set as 63.0 kA, while for the breakers in the 230 kV-level grid it is set as 50.0 kA. The utilities will undergo 15,000
$ penalty if zonal load shedding percentage is greater than 7%. The system can operate normally when one of the lines between C1 and D1 is under overhaul, the load of all the lines and transformers are still in the allowable range. This is set as the pre-fault scenario.
The following situation is chosen as the emergency scenario: the other line between C1 and D1 is out of service due to fault, and the transformer in C1, which connects the 500 kV bus and 220 kV bus, will endure overload. The rated capacity, apparent power, overload rate and device security margin of the transformer in C1 is 900 MVA, 952.3 MVA, 105.8% and −5.8%, respectively.
Four suspended lines are chosen as the switching devices, as shown in
Table 2. Compute the load shedding cost without corrective switching. The load amount to be shed for computing performance index is set as 10 MW, and the outage price is set as 200
$/MW. Since the performance index of C7 and C8 are the same and larger than that of the rest substations, they are selected as the substations to be shed. The overload is eliminated when the summary of the load to be shed of these two substations is 50 MW, with the cost 10,000
$. Since the load shedding amount only occupies 4.37 percent of the total load of Zone C, there are no penalty.
In the first phase of optimization, a feasible set is obtained, as shown in
Table 3. At least one switching device is needed to satisfy the security requirement, and thus only feasible schemes with one or two switching devices are included. The criteria of each scheme are shown in
Table 4. Since all these schemes can eliminate the entire load shedding cost and penalty,
is omitted.
During the second phase, TOPSIS optimization uses the reciprocal of
,
and
to ensure that all the criteria are maximum objectives. The weights are obtained by Delphi method, as shown in
Table 5. PIS and NIS are also shown in
Table 5. The
and
of each feasible scheme and the similarities
are computed and listed in
Table 6. Sch#6 has the largest similarity (0.7428), and thus is chosen as the optimal solution. This scheme is implemented by switching on L
1, and all load shedding cost is eliminated.
The result of the single-objective method can be found directly in
Table 4, and Sch#6 is selected as the optimal solution, which is the same as the result of multi-objective method. This coincidence is because the weight of
is relatively low compared to that of
. However, if the weights of
and
are changed to 0.1169 and 0.3050, respectively, and keep other weights unchanged, then Sch#1 will be selected as the optimal solution. From this variation in the weights, it can be seen that the weights obtained from Delphi method occupy an important role in the decision-making process. Their values indicate the degree of their corresponding criteria to be emphasized: with the original weights being used (i.e., the economics aspect is emphasized more than security aspect), Sch#6 is selected with less
and less
, while with the changed weights being used (i.e., the security aspect is emphasized more than economics aspect), Sch#1 is selected with greater
and greater
. In this case, since the overload security margin is high enough to burden potential load increase, the original weights are decided in the Delphi method process with the weight of
assigned a relatively low value.
4.2. Case 2: Under-Voltage Emergency
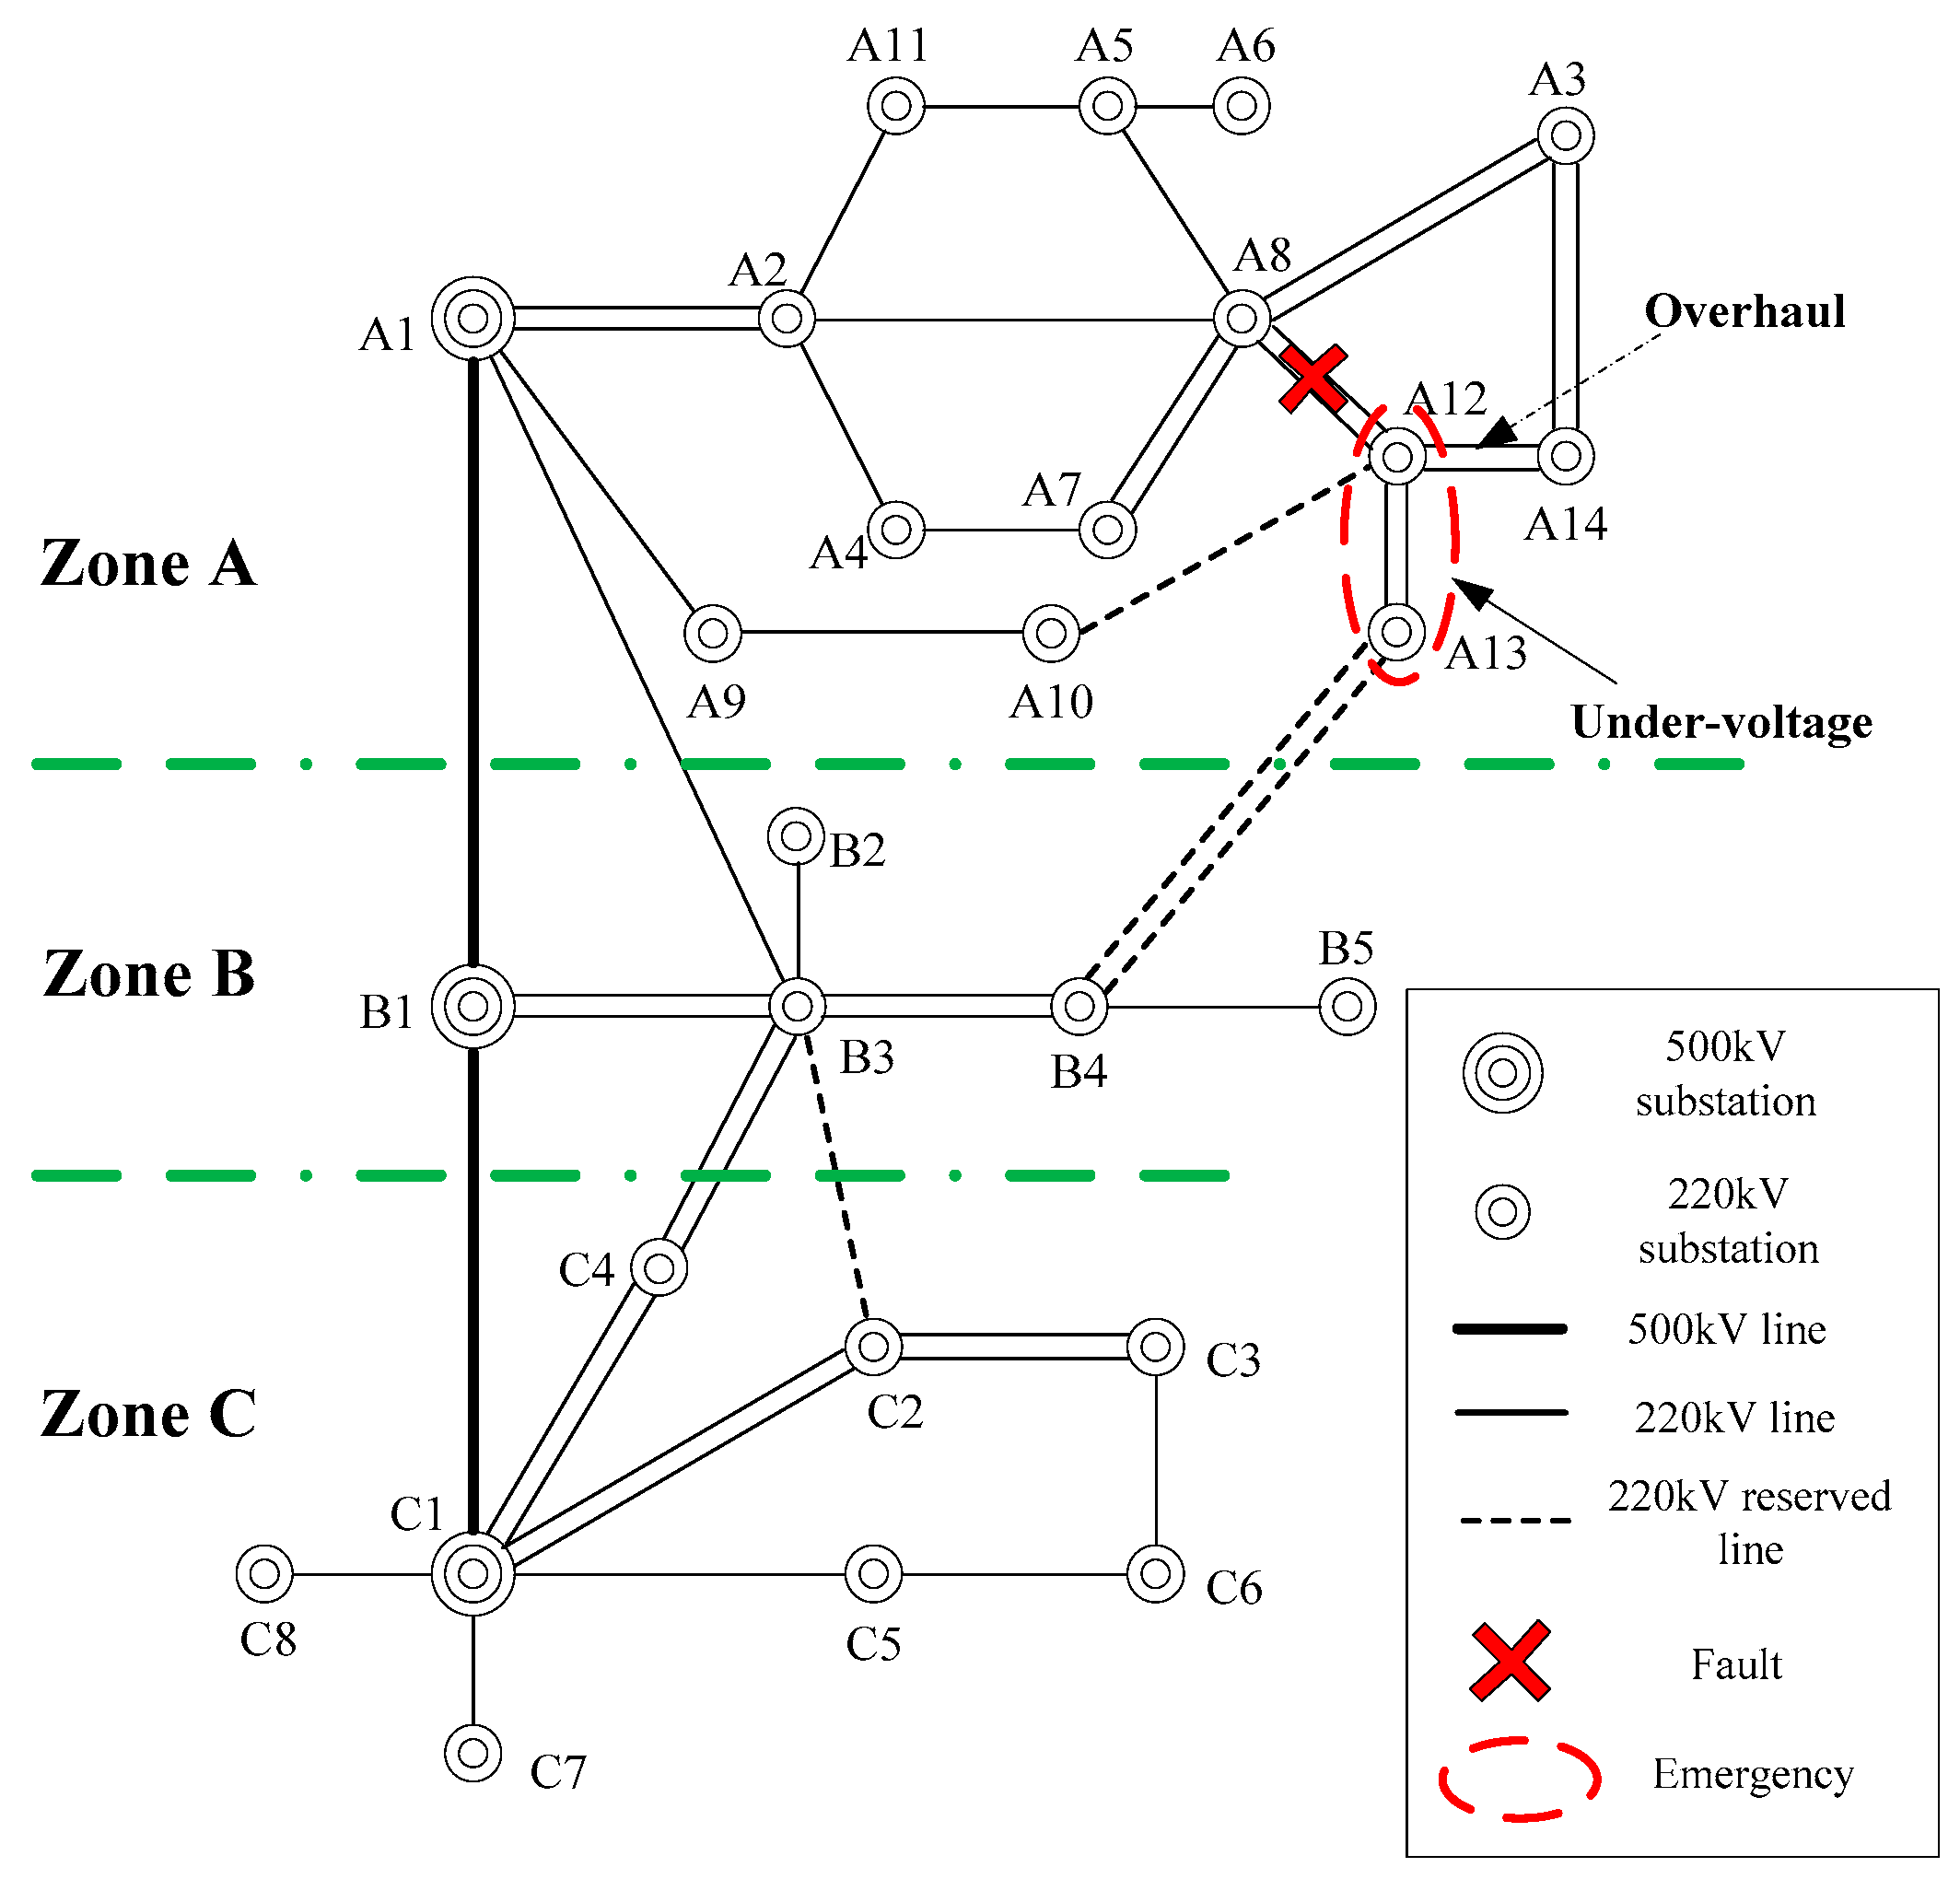
Use a regional power system to testify the validity of the proposed approach in solving the under-voltage emergency. The topology of this system is shown in
Figure 3, with three zones. The lower limit of the voltage is set as 0.9 p.u. The threshold vector,
, is set as 0. The interrupting current of breakers in the 525 kV-level grid is set as 63.0 kA, while, for the breakers in the 230 kV-level grid, it is set as 50.0 kA. The utilities will undergo
$15,000 penalty if zonal load shedding percentage is greater than 7%. The system can operate normally when one of the lines between A12 and A14 is under overhaul. This is set as the pre-fault scenario.
The following situation is selected as the emergency scenario: the parallel lines between A8 and A12 are both out of service due to fault, and the A12 bus and A13 bus will undergo under-voltage emergency:
A12 bus: Rated voltage is 230.0 kV. Voltage is 206.69 kV (0.8986 p.u.). The device security margin is −0.0014.
A13 bus: Rated voltage is 230.0 kV. Voltage is 203.26 kV (0.8838 p.u.). The device security margin is −0.0162.
Four suspended lines are chosen as switching devices, as shown in
Table 7.
The load shedding cost without corrective switching is computed. The load amount to be shed for computing performance index is set as 10 MW, and the outage price is set as $200/MW. Since the performance index of A13 is larger than that of rest substations, it is selected as the substation to be shed. The under-voltage is eliminated when the load to be shed of A13 is 40 MW, with the cost $8000. Since the load shedding amount only occupies 7.81% of the total load of Zone C, there is a $15,000 penalty.
In the first phase of optimization, a feasible set is obtained, as shown in
Table 8. At least one switching device is needed to satisfy the security requirement, and thus only feasible schemes with one or two switching devices are included. The criteria of each scheme are shown in
Table 9. Since all these schemes can eliminate the entire load shedding cost and penalty,
is omitted.
During the second phase, TOPSIS optimization uses the reciprocal of
,
and
to ensure that all the criteria are maximum objectives. The weights are obtained by Delphi method, as shown in
Table 10. PIS and NIS are also shown in
Table 10. The
and
of each feasible scheme and the similarities
are computed and listed in
Table 11. Sch#2 has the largest similarity (0.5906), and thus is chosen as the optimal solution. This scheme is implemented by switching on L
1 and L
3, and all load shedding cost and penalty is eliminated.
The result of the single-objective method can be found directly in
Table 9, and Sch#6 is selected as the optimal solution, which, compared with Sch#2, has less
and
. In this case, the advantage of the multi-objective method over the single-objective method can be shown when the fault that the remaining line between A12 and A14 is out of service is considered. This fault can lead to under-voltage emergency endured by several substations in both Sch#2 and Sch#6, as shown in
Table 12. It is obvious that the network changed by Sch#6 would lead to greater load shedding amount and thus greater load shedding cost and penalty. Some substation would also have seriously low voltage that could lead to stability problem and even voltage collapse. With the multi-objective method, the changed network can better reduce the severe consequence caused by the subsequent fault. Therefore, multi-objective method could provide a comprehensive evaluation of different schemes with various aspects being considered, leading to some beneficial improvement on the optimization process.
5. Conclusions
The corrective switching is a useful control measure, which can be implemented online to tackle unexpected emergencies and defend subsequent disturbances. To comprehensively consider the economics, security and reliability aspects, it is effective to establish a multi-objective model, which takes six evaluation criteria as the objectives. The two-phase optimization approach can reduce the solution space to a small candidate set by a feasible set silting method, and can easily deal with the trade-off of objectives and determine a fast and acceptable engineering scheme by TOPSIS. The results of case studies show that the proposed scheme-making framework, including the above multi-objective model and optimization approach, has some strengths such as the endurance for further disturbances, which is helpful in emergency scenarios.
In actual engineering projects, corrective switching also requires further investigation on other issues, especially the practical ones such as impact current, protection configuration, device setting, etc. This should be based on specific devices and power systems, and deserves investigation in the future study. In the future study, some more effective algorithms, such as deep learning, will be applied to the online control problem.


