
Risk Assessment of Micro Energy Grid Protection Layers


Abstract
1. Introduction
- Enhance the reliability of the system’s performance,
- Enhance customers’ awareness and choices,
- Encourage efficient decisions to be taken by the utility providers,
- Better match between energy generation and energy use, and hence lower cost and/or losses.
1.1. Hazard and Risk Analysis Literature Review
1.2. Definition of Risk
- (1)
- Haimes, in [28], uses accumulate summation of the probability density function of the severity of consequences and a random variable of the severity of consequences; thus, the frequency of occurrence of the hazard is latent.
- (2)
- Bahill, in [29], uses a different method for quantifying the risk by combining the function of frequency of occurrence with the severity of failure consequences. Bahill’s method is commonly used in North American industries.
- (3)
- In [30] two combining functions were illustrated:
- I-
- Linearly combining functions that accumulate the summation of the combined products of the weight of importance with the score variable. Weight of importance is a random variable between 0 and 1.
- II-
- Product combining functions that accumulate the products of the score variable to the power of the weight of importance.
- (4)
- Exponential combining functions [31], that utilizes an exponent of the summation of a linear combining function between the weight of importance and score variable. Hence, a constant variable may used for calibration purpose.
- (5)
- Sum minus product combining function [32], which derived from the probability of unions between independent variables. However, this function is lacking when used to qualify the risk, where if severity or likelihood is 0 then the risk should be 0, which is not the case by using this equation.
- (6)
- Compromised combining function [33], that deploys two weight variables with two different score variables.
- (7)
- Reference [34] presents risk by doubling the severity weight multiplied by the frequency of fault event occurrence.
- (8)
- In [35] the failure modes and effects analysis (FEMA) comprises the difficulty of detection. It consists product of frequency of occurrence, severity of failure consequences and difficulty of detection.
- (9)
- The hazard level can be also a product of the consequences severity and the fault class [36], fault class is a combination of the probability of failure, the fault event frequency and the system’s ability to avoid failure occasion.
2. Problem Definition
3. Research Methodology
- (1)
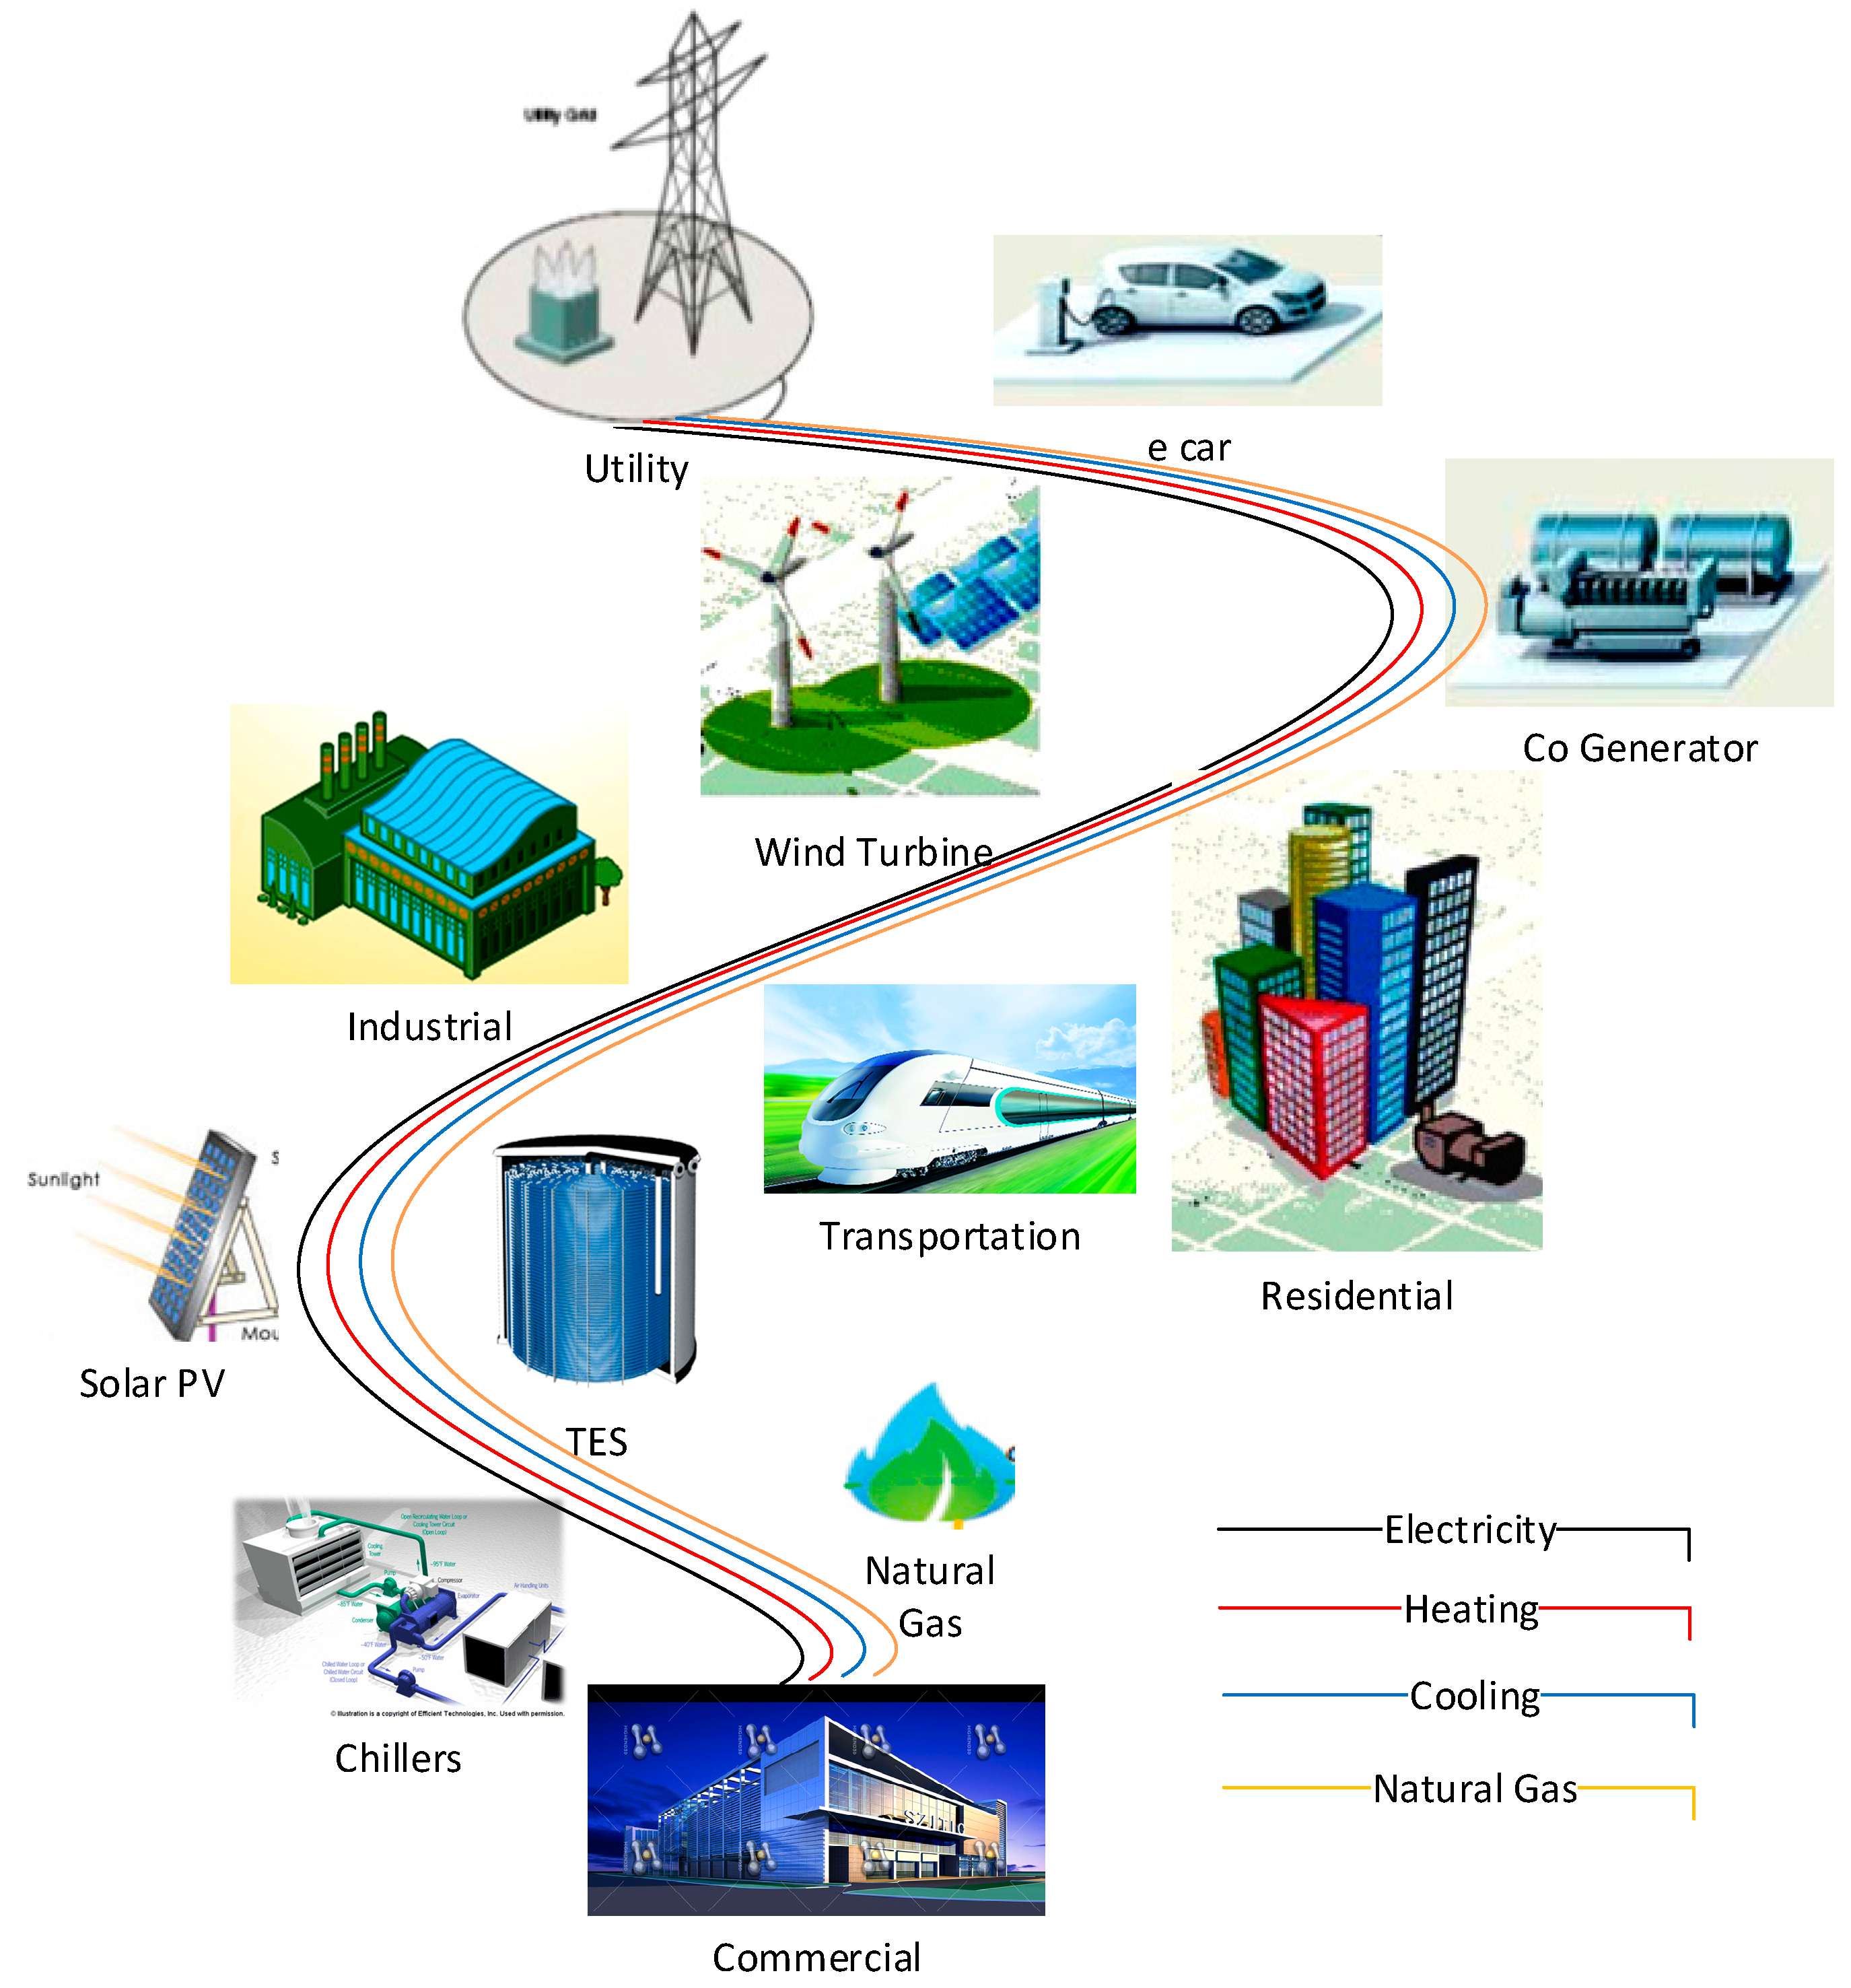
- Study hazards and estimate risks of a MEG such as hazards in electricity, heating, cooling, transportation sectors and hazards due to natural phenomena.
- (2)
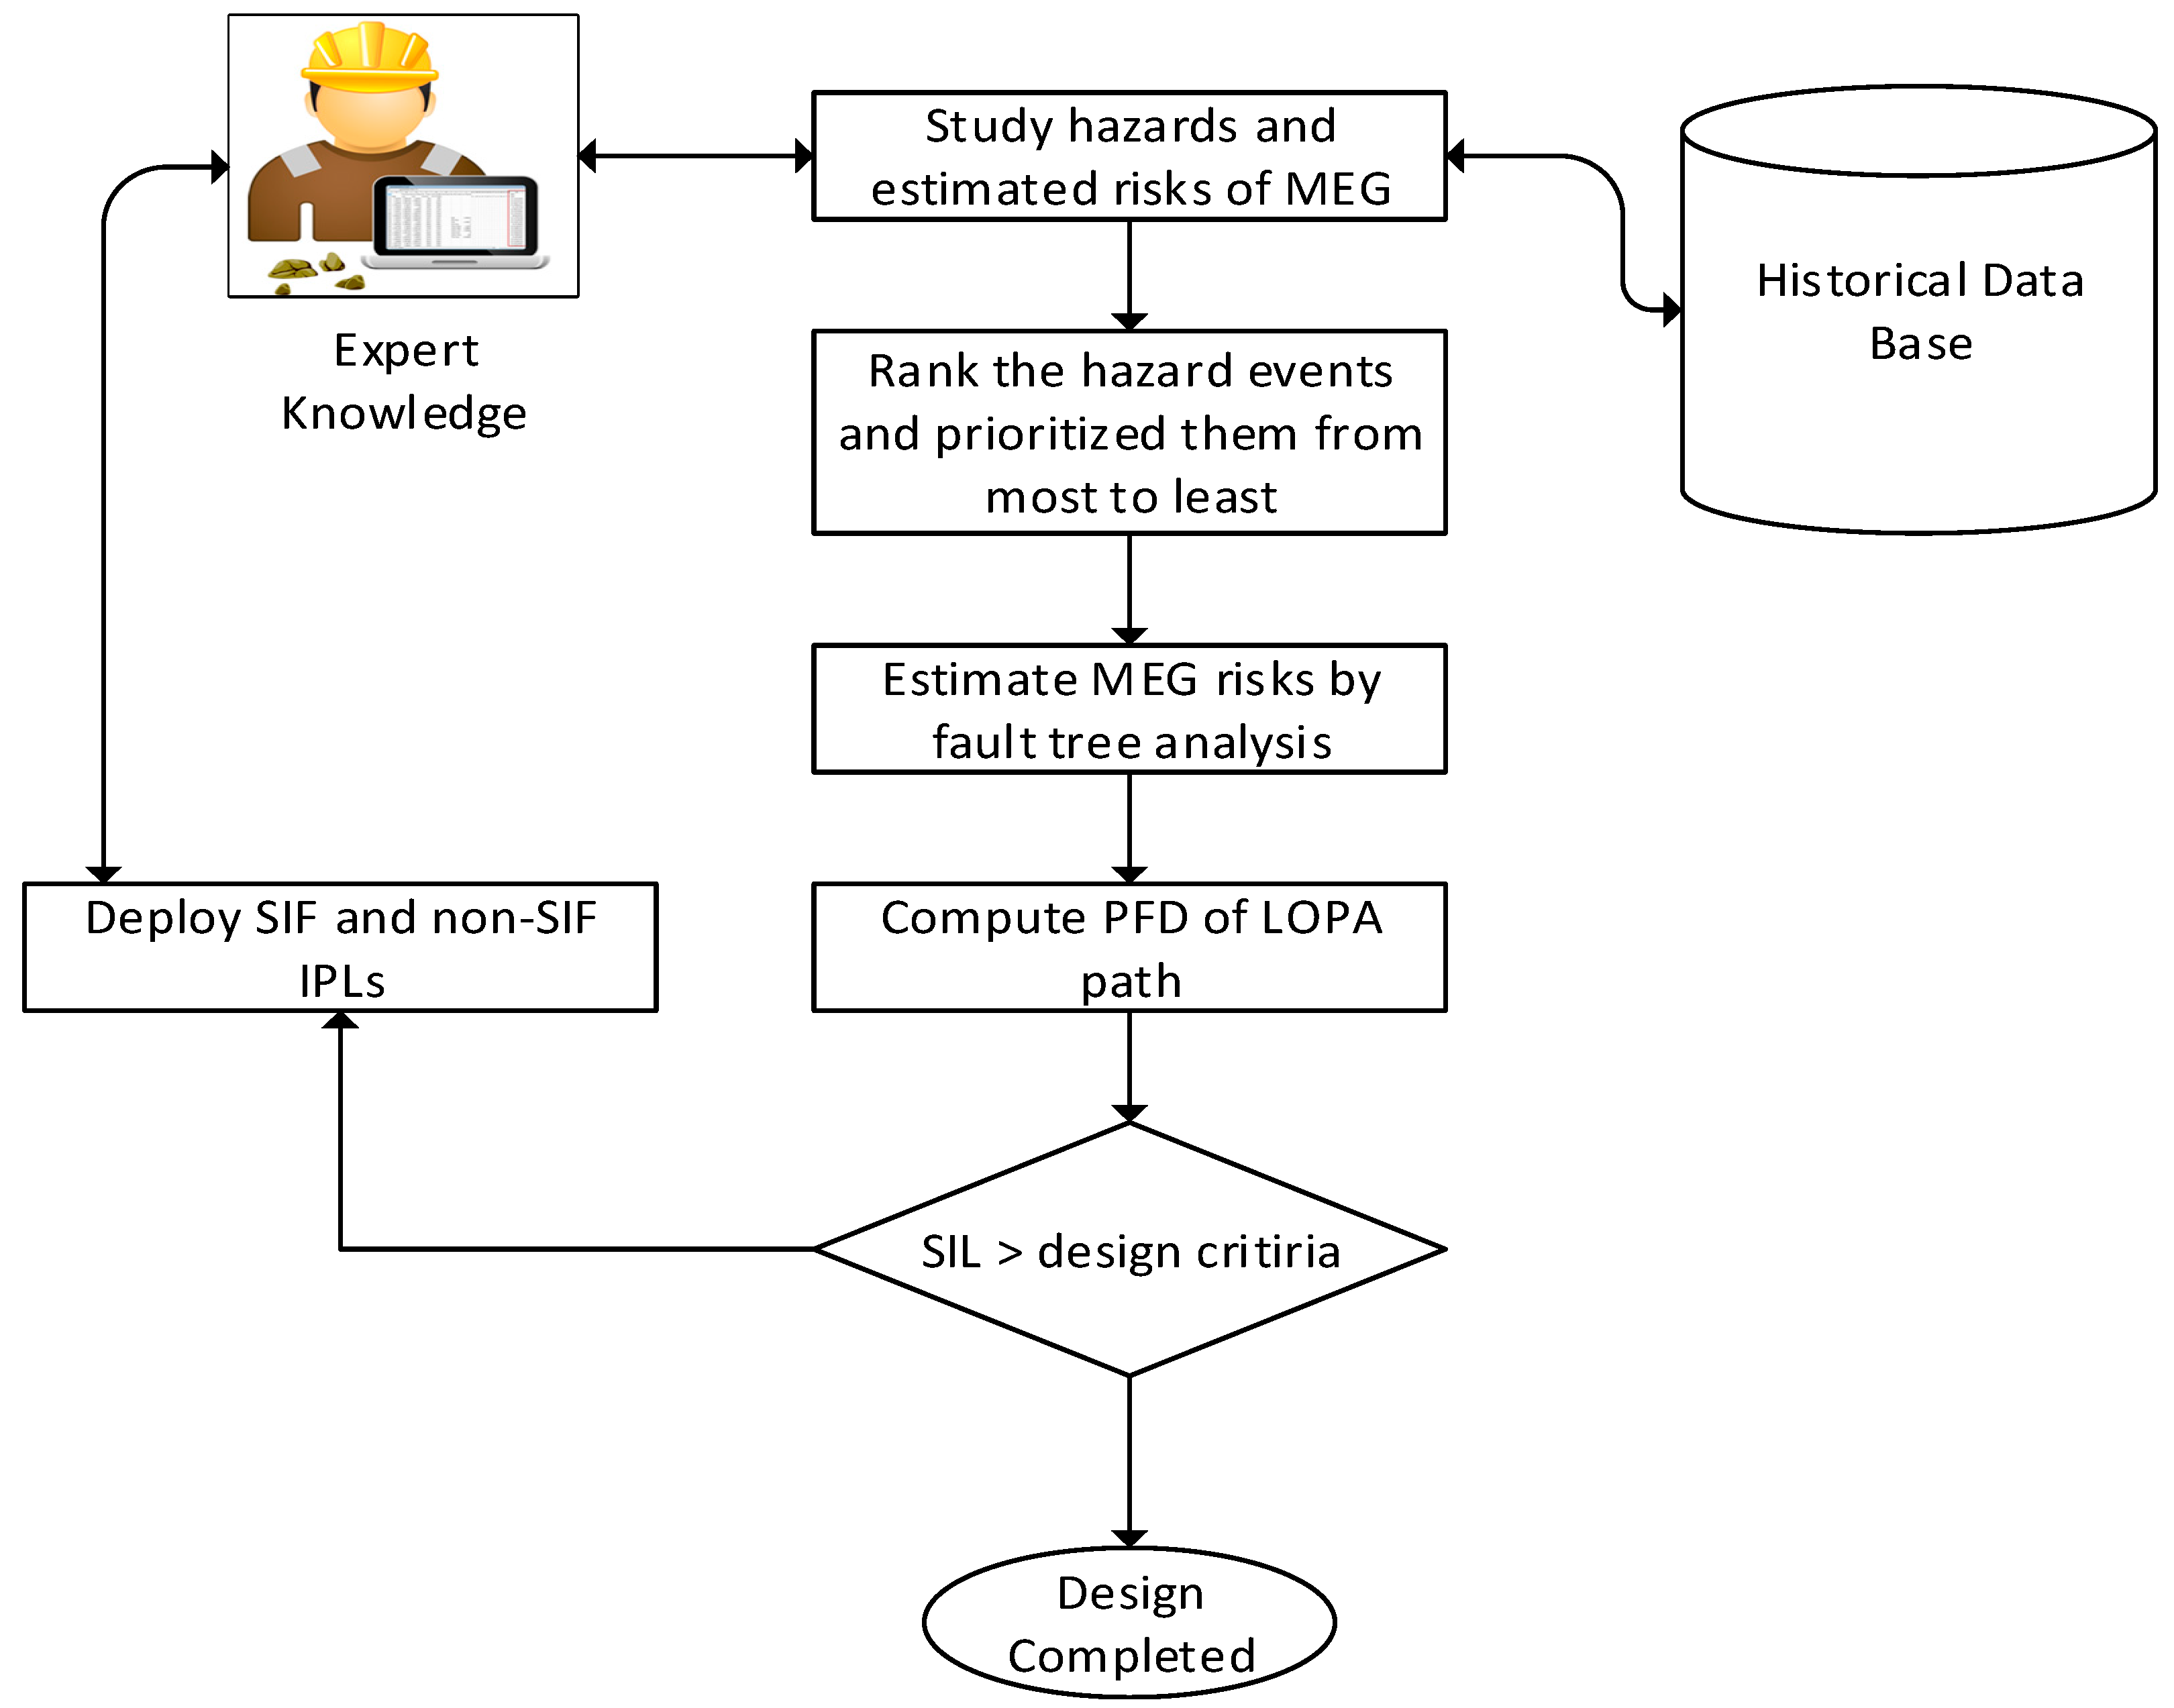
- Rank the hazard events based on the hazard level then prioritize them from most to least significant.
- (3)
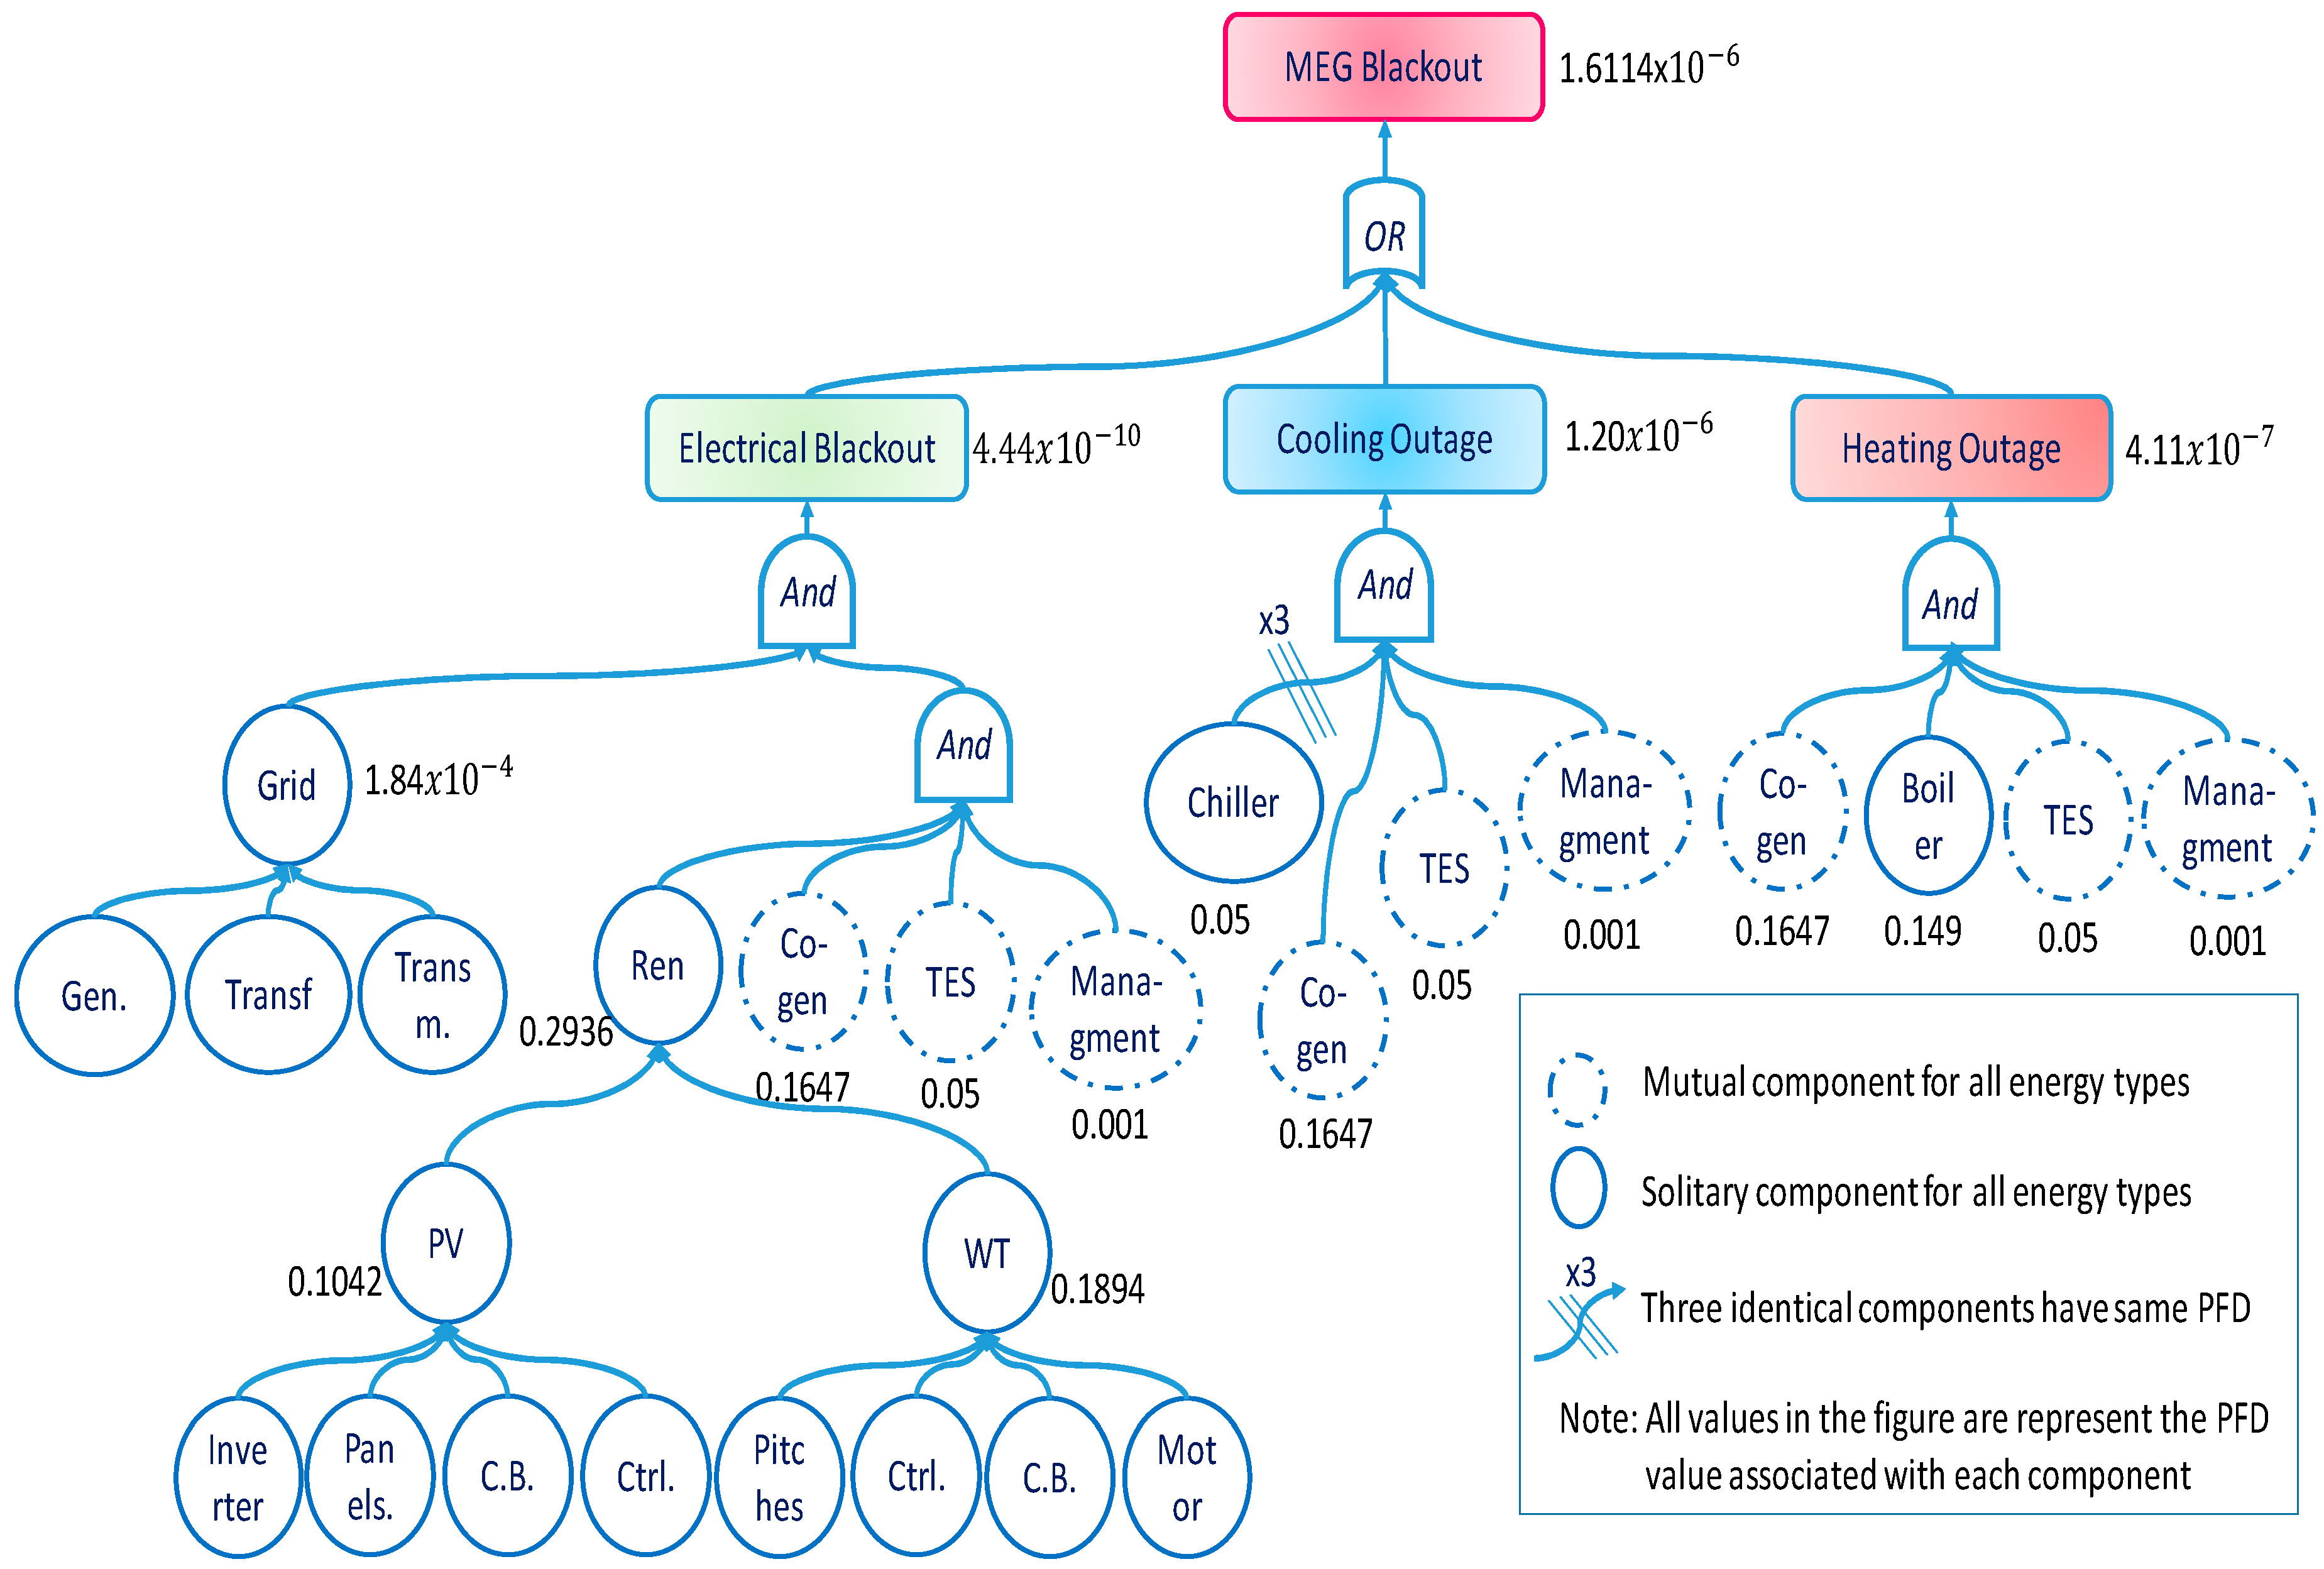
- Estimate MEG risks for all identified scenarios using developed fault tree analysis, and propose safety performance indicators for safety evaluation
- (4)
- Study and develop IPLs for MEG safety design and evaluate SIL using developed LOPA analysis
3.1. Hazard and Risk Analysis Techniques for MEGs
3.2. Safety Design, Risk Assessment and Protection Layers of MEG
- (1)
- Implement the MEG hazard table
- (2)
- Rank the hazards based on the hazard level
- (3)
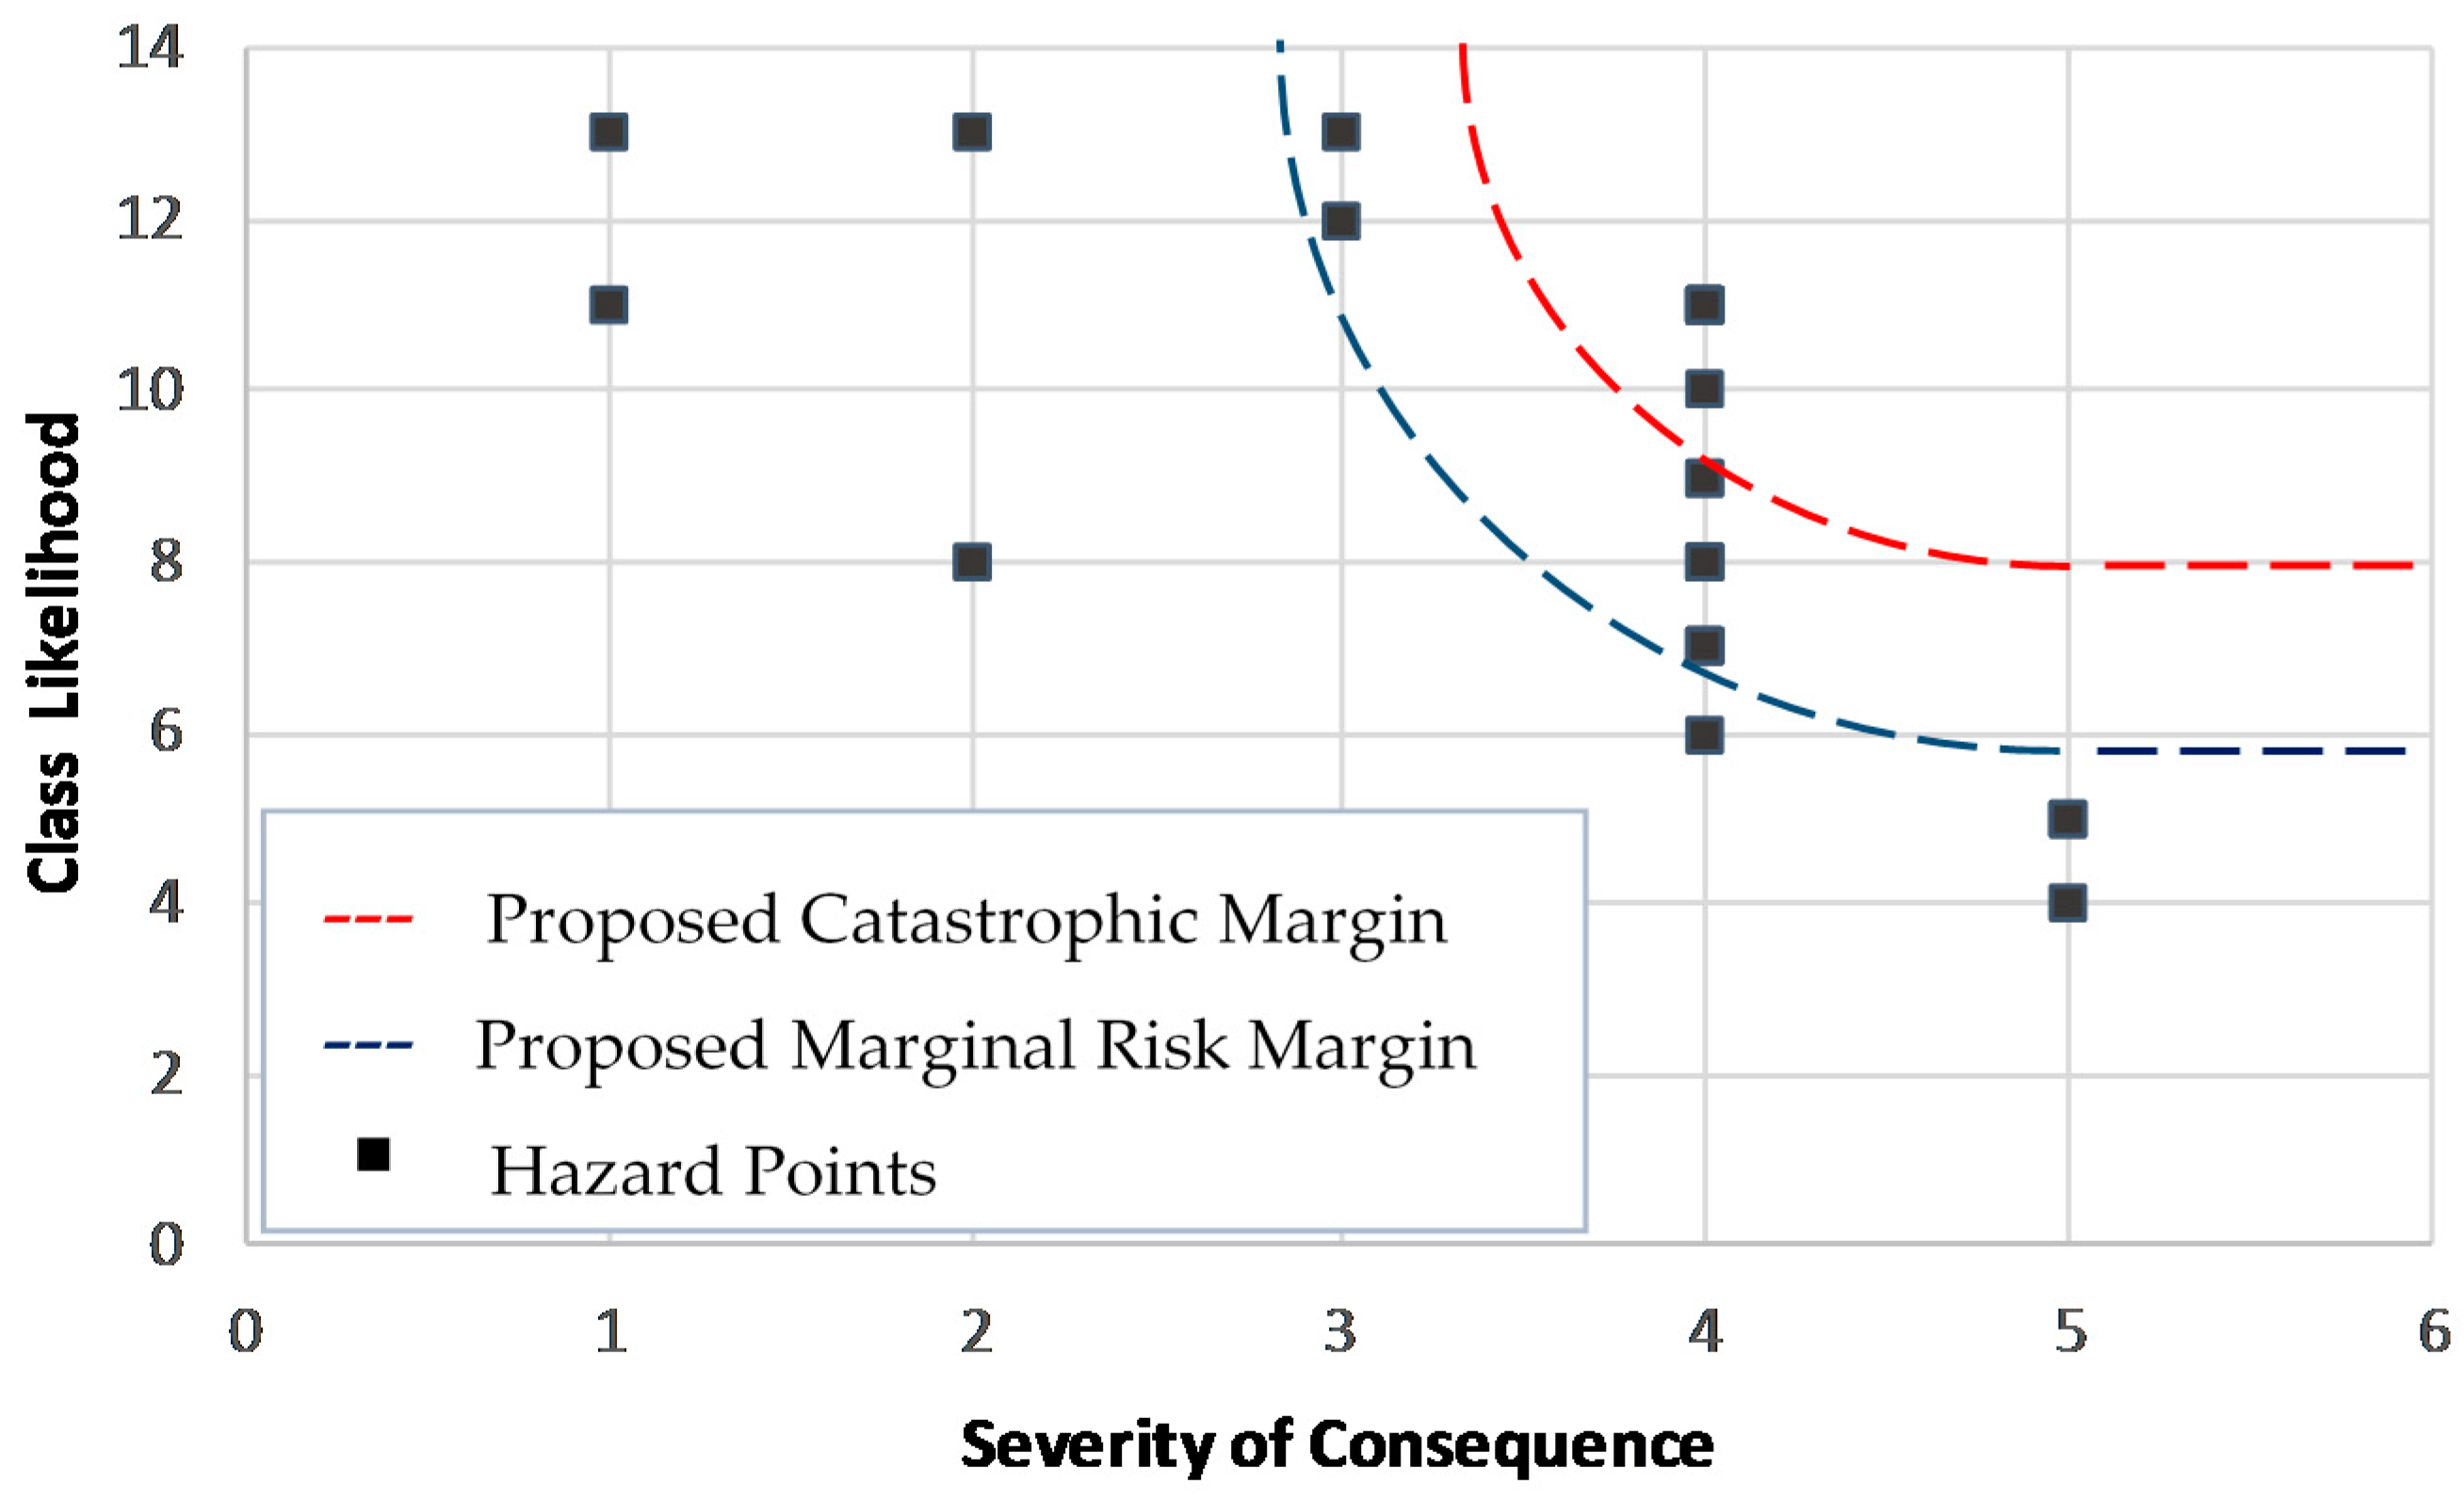
- Filter the hazard events to eliminate hazards with low severity and high class as well as ones with high severity and low class.
- (4)
- Prioritize the filtered hazard events
- (5)
- Set out the feasible prevention and mitigation solutions to discuss the necessary action with the stakeholders.
3.3. Safety Instrumented System Engineering Requirements
- Design to fail-safe
- Design diagnostics to detect fail-danger automatically
- Design manual test procedures to detect fail-danger
- Design to meet international and local standards
3.3.1. Safety Integrity Level
3.3.2. Safety Instrumented Function
3.4. Fault Tree for MEG
- F(PV) = F(Inverter) F(Panels) F(C.B) F(Ctrl)
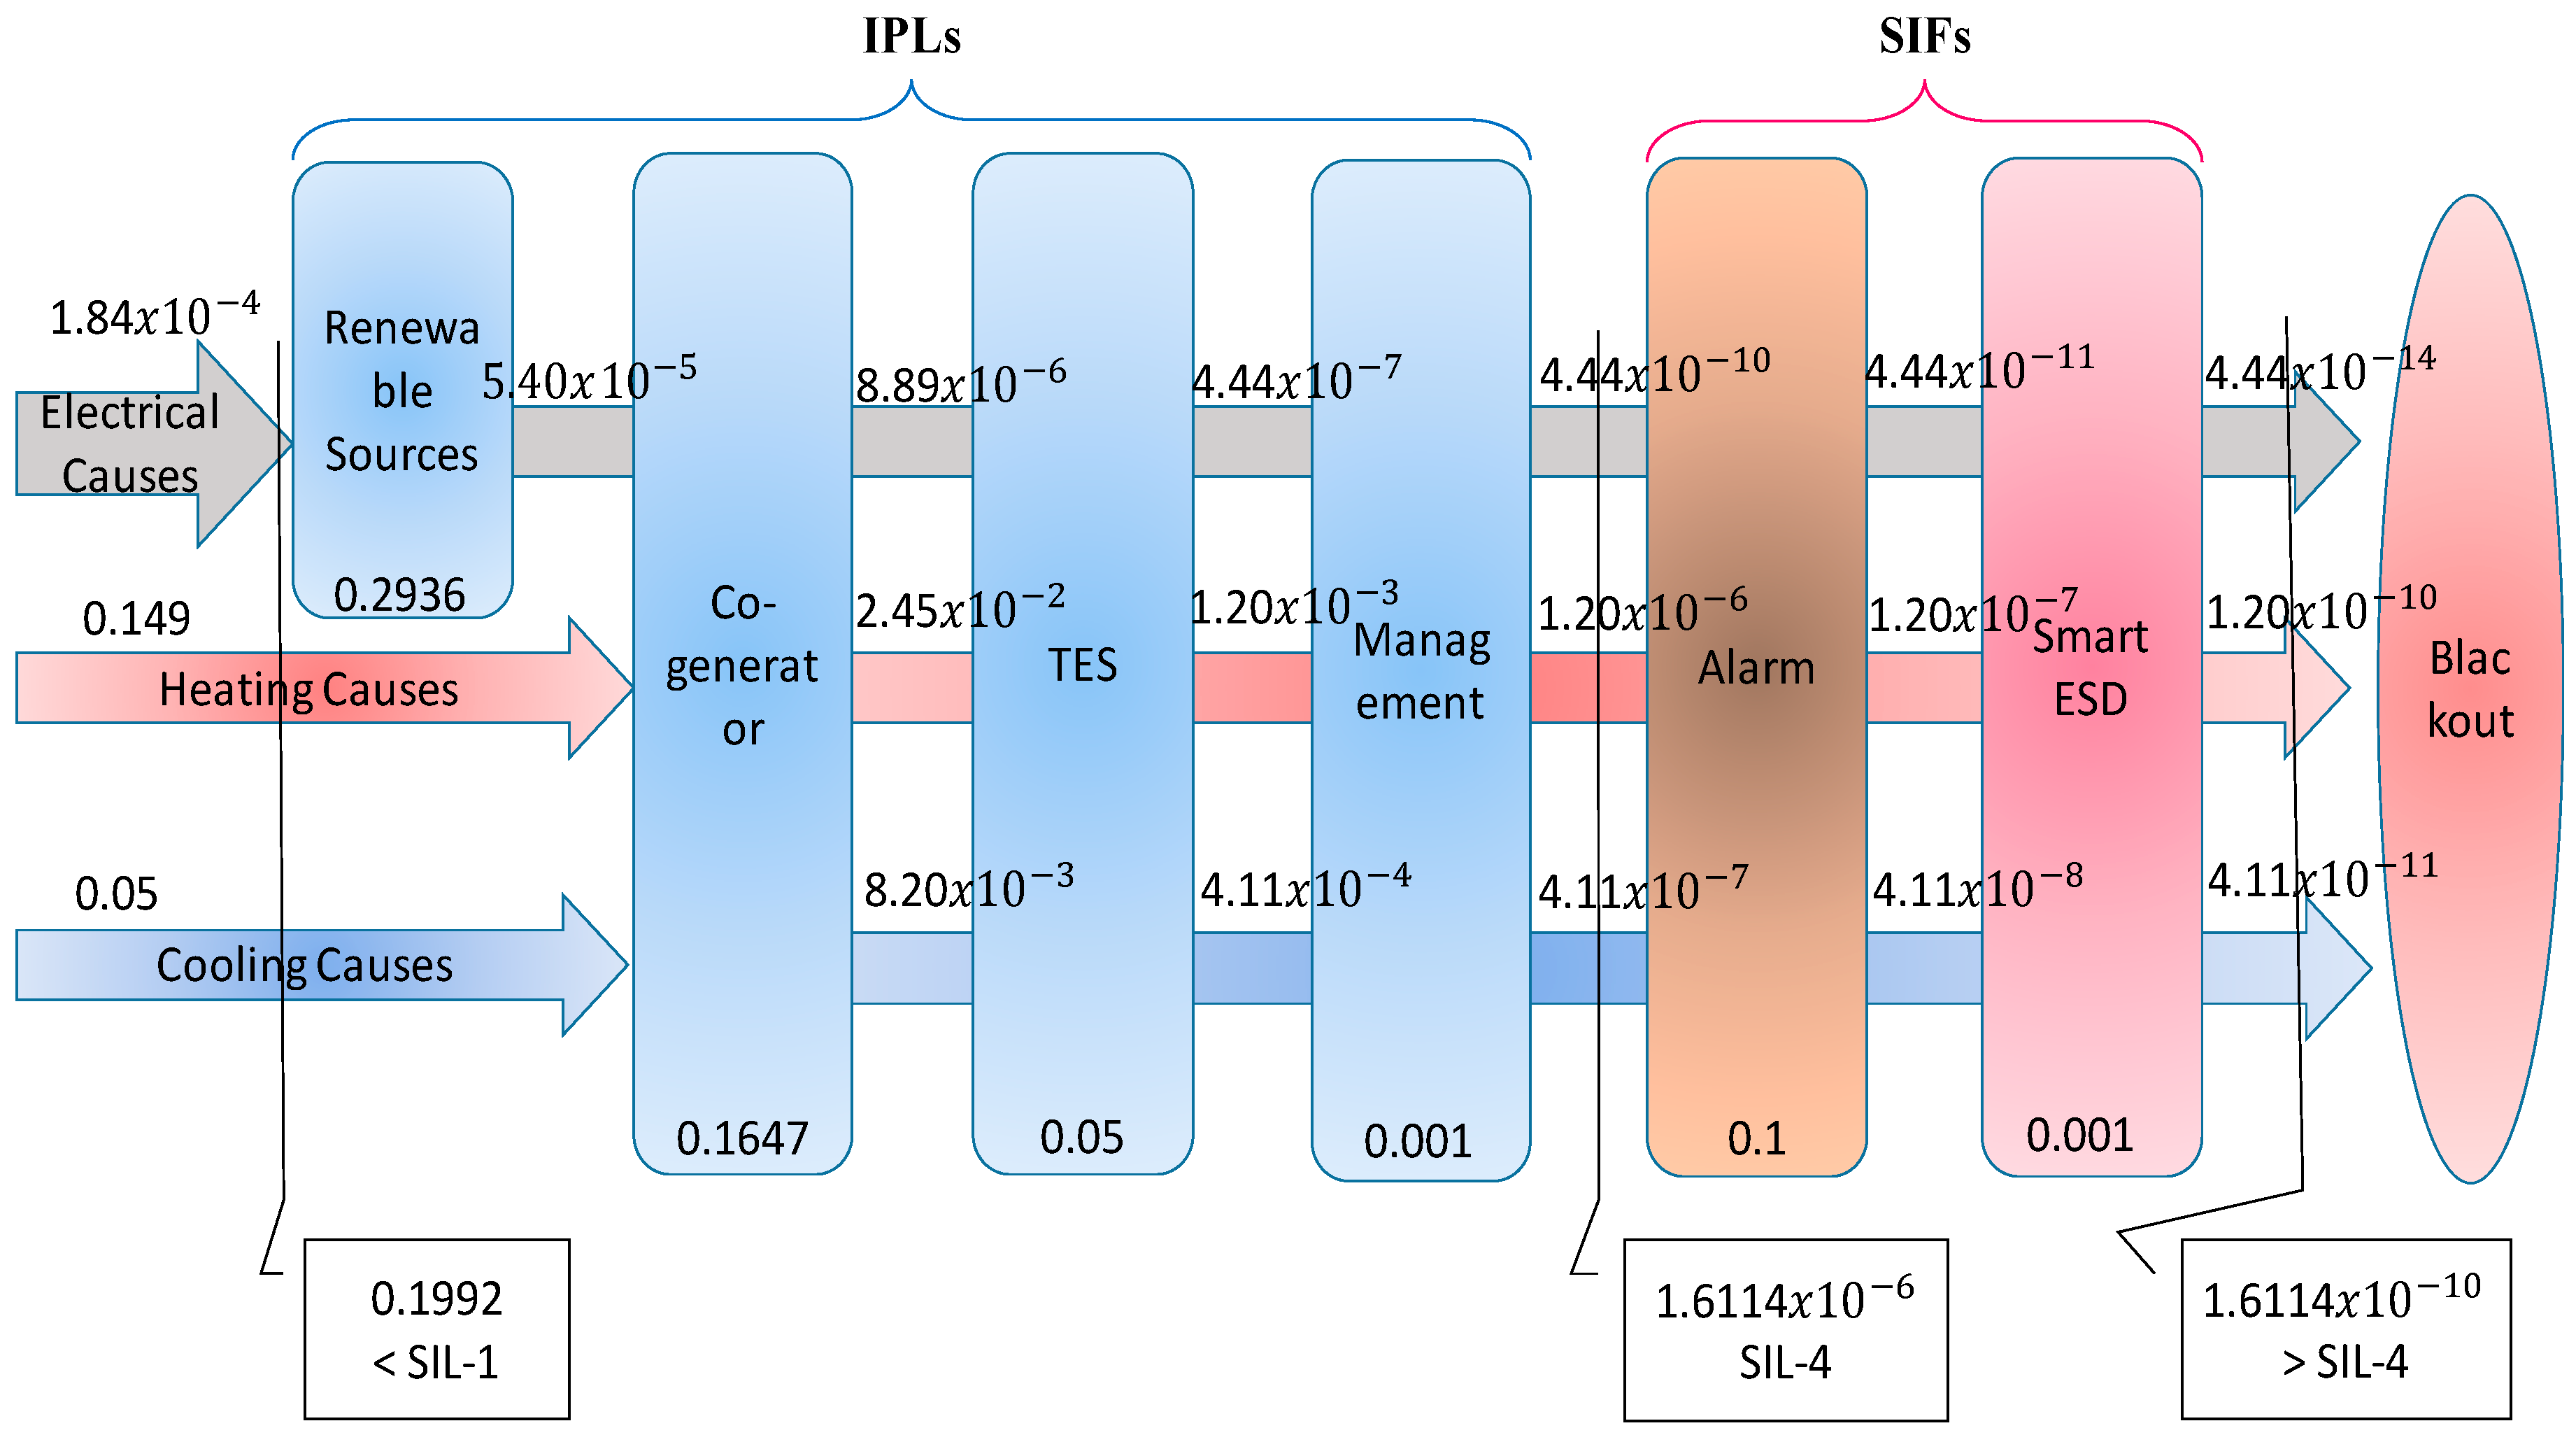
3.5. Independent Protection Layers and Layer of Protection Analysis
- Potential ability on suppressing the propagation of fault consequence, if the IPL functions as intended
- Auditable capability, where it assumed effective in terms of statistical validation of risk indices (by documentation, review or testing)
- ➣
- IPL-1 Co-generators to overcome the lack of power production at peak hours and to cope with the intermittency of renewable resources.
- ➣
- IPL-2 Thermal energy storage as an effective tool for MEG operation due to the following advantages:
- (A)
- Reshaping the energy profile by reserving the off-peak production to be used at on-peak demand hours.
- (B)
- Centralized infrastructure where large thermal reservoirs provide flexibility to manage cooling dynamics, as well as lower emissions and energy failure risks.
- ➣
- IPL-3 Supervisory fault-tolerant energy management (FTEM) controllers play a primary role the MEG reliability, where management of distributed resources near the renewable energy source is the most effective means of decreasing penetration of renewable resources.
- ➣
- IPL-4 Safety alarm system is an important SIF layer, where its main role is to monitor the healthy status of the MEG and to provide real time information about the fault type and location, in case of a fault event.
- ➣
- IPL-5 Emergency shutdown system (ESD) is a paramount SIF layer due to its ability in mitigating the consequences of the fault event when the above IPLs are unable to prevent the fault propagation.
- MEG Storage system (E/T/C): energy storage units are classified based on their technology, the following are the most popular energy storages: batteries, super capacitors, flywheels, hydro tanks, thermal energy storage and superconducting magnetic energy storage
- Prime mover: co-generators, fuel cells, micro gas turbines, geothermal resources and hybrid turbine systems
- Intelligent control systems for normal operation to ensure rigid performance
- Smart energy asset management for both sources and load within the MEG boundary
- Emergency control for resilient systems on abnormal cases
- Risk assessment platform and alarm system
- MEG safety shutdown and restoration systems
- Upper-level centralized / decentralized MEG management with utilities grids.
4. Summary
Author Contributions
Conflicts of Interest
References
- Koraz, Y.; Gabbar, H.A. Hierarchical Safety Control for Micro Energy Grids using adaptive neuro-fuzzy decision making method. In Proceedings of the IEEE International Conference on Smart Energy Grid Engineering, Oshawa, ON, Canada, 21–24 August 2016; pp. 131–136. [Google Scholar]
- Gabbar, H. Design and Planning Support Tool for Interconnected Micro Energy Grids. Br. J. Appl. Sci. Technol. 2016, 12, 1–15. [Google Scholar] [CrossRef]
- Zhang, J.; Yang, Z.; Zhou, Q. Reliability Assessment for Micro-grid with Multi-Energy Demand. In Proceedings of the China international Conference on Electricity Distribution, Shenzhen, China, 23–26 September 2014; pp. 23–26. [Google Scholar]
- Gabbar, H.A.; Koraz, Y. Safety Design of Resilient Micro Energy Grids. In Smart Energy Grid Engineering, 1st ed.; Elsevier: Amsterdam, The Netherlands; Academic Press: Cambridge, MA, USA, 2017; pp. 101–150. [Google Scholar]
- Dieck-Assad, G.; Masada, Y. Optimal Set-point Scheduling in A Boiler-turbine System. IEEE Trans. Energy Convers. 1987, EC-2, 388–395. [Google Scholar] [CrossRef]
- Garduno-ramirez, R.; Lee, K.Y. Multiobjective Optimal Power Plant Operation Through Coordinate Control with Pressure Set Point Scheduling. IEEE Trans. Energy Convers. 2001, 16, 115–122. [Google Scholar] [CrossRef]
- Chandan, V.; Jabbari, F.; Brouwer, J.; Akrotirianakis, I.; Chakraborty, A.; Alleyne, A.; Do, A.; Jin, B.; Jabbari, F.; Brouwer, J. Modeling and optimization of a combined cooling, heating and power plant system. In Proceedings of the 2012 American Control Conference (ACC), Montreal, QC, Canada, 27–29 June 2012; pp. 3069–3074. [Google Scholar]
- Saponara, S.; Bacchillone, T. Network architecture, security issues, and hardware implementation of a home area network for smart grid. J. Comput. Netw. Commun. 2012. [Google Scholar] [CrossRef]
- Chan, D.; Cameron, M.; Yoon, Y. Implementation of micro energy grid: A case study of a sustainable community in China. Energy Build. 2017, 139, 719–731. [Google Scholar] [CrossRef]
- Telecom, K.; Korea, S. Korea Micro Energy Grid Technology The use case of the First-town in Sejong. In Proceedings of the Netwwork Operation Management Symposum (APNOMS), 15th Asia-Pacific, Hiroshima, Japan, 25–27 September 2013. [Google Scholar]
- Song, G.; Chen, H.; Guo, B. A layered fault tree model for reliability evaluation of smart grids. Energies 2014, 7, 4835–4857. [Google Scholar] [CrossRef]
- Chaves, A.; Terry Bahill, A. Comparison of risk analysis approaches and a case study of the risk of incorporating solar photovoltaic systems into a commercial electric power grid. Syst. Eng. 2014, 17, 89–111. [Google Scholar] [CrossRef]
- Bahill, A.T. Diogenes, a process for identifying unintended consequences. Syst. Eng. 2012, 15, 287–306. [Google Scholar] [CrossRef]
- Agrawal, A.B.; Barker, K.; Haimes, Y.Y. Adaptive multiplayer approach for risk-based decision-making: 2006 Virginia Gubernatorial Inauguration. Syst. Eng. 2011, 14, 455–470. [Google Scholar] [CrossRef]
- Bahill, A.T.; Karnavas, W.J. Risk analysis of a pinewood derby: A case study. Syst. Eng. 2000, 3, 143–155. [Google Scholar] [CrossRef]
- Saponara, S.; Fanucci, L.; Bernardo, F.; Falciani, A. Predictive Diagnosis of High-Power Transformer Faults by Networking Vibration Measuring Nodes with Integrated Signal Processing. IEEE Trans. Instrum. Meas. 2016, 65, 1749–1760. [Google Scholar] [CrossRef]
- Saponara, S. Distributed measuring system for predictive diagnosis of uninterruptible power supplies in safety-critical applications. Energies 2016, 9, 327. [Google Scholar] [CrossRef]
- Zidan, A.; Khairalla, M.; Abdrabou, A.M.; Khalifa, T.; Shaban, K.; Abdrabou, A.; El Shatshat, R.; Gaouda, A.M. Fault Detection, Isolation, and Service Restoration in Distribution Systems: State-of-the-Art and Future Trends. IEEE Trans. Smart Grid 2016. [Google Scholar] [CrossRef]
- Costantino, N.; Serventi, R.; Tinfena, F.; D’Abramo, P.; Chassard, P.; Tisserand, P.; Saponara, S.; Fanucci, L. Design and test of an HV-CMOS intelligent power switch with integrated protections and self-diagnostic for harsh automotive applications. IEEE Trans. Ind. Electron. 2011, 58, 2715–2727. [Google Scholar] [CrossRef]
- Friedl, W.; Fickert, L.; Schmautzer, E.; Obkircher, C. Safety and reliability for smart-, micro-and islanded grids. In Proceedings of the CIRED Seminar 2008: SmartGrids for Distribution, Frankfurt, Germany, 23–24 June 2008; p. 15. [Google Scholar]
- Nikkhajoei, H.; Lasseter, R.H. Microgrid Protection. In Proceedings of the 2007 IEEE Power Engineering Society General Meeting, Tampa, FL, USA, 24–28 June 2007; pp. 1–6. [Google Scholar]
- Hooshyar, A.; Iravani, R. Microgrid Protection. Proc. IEEE 2017, 105, 1332–1353. [Google Scholar] [CrossRef]
- Lee, W.S.; Kang, S.H. Protection for distributed generations in the DC micro-grid. In Proceedings of the 2011 2nd IEEE PES International Conference and Exhibition on Innovative Smart Grid Technologies, Manchester, UK, 5–7 December 2011; pp. 1–5. [Google Scholar]
- Lai, K.; Illindala, M.S.; Haj-ahmed, M.A. Comprehensive Protection Strategy for an Islanded Microgrid Using Intelligent Relays. IEEE Trans. Ind. Appl. 2017, 53, 47–55. [Google Scholar] [CrossRef]
- Zhao, X.X.; Xia, M.C.; He, X.H.; Zhou, Y. Study on protection scheme for micro-grid with mobile energy storage units. Procedia Eng. 2011, 16, 192–197. [Google Scholar]
- Deng, W.; Pei, W.; Shen, Z.; Zhao, Z.; Qu, H. Adaptive micro-grid operation based on IEC 61850. Energies 2015, 8, 4455–4475. [Google Scholar] [CrossRef]
- Arnauld, A. Logic, or, the Art of Thinking: Containing, Besides Common Rules, Several New Observations Appropriate for Forming Judgment; Cambridge University Press: New York, NY, USA, 1996. [Google Scholar]
- Haimes, Y.Y. Risk Modeling, Assessment, and Management, 4th ed.; John Wiley & Sons. Inc.: Hoboken, NJ, USA, 2015. [Google Scholar]
- Bahill, A.T. Design and Testing of an Illuminance Management System. ITEA J. 2010, 31, 63–89. [Google Scholar]
- Daniels, J.; Werner, P.W.; Bahill, A.T. Quantitative methods for tradeoff analyses. Syst. Eng. 2001, 4, 190–212. [Google Scholar] [CrossRef]
- Cooper, J.A. Soft Mathematical Aggregation in Safety Assessment and Decision Analysis. In Proceedings of the System Safety Society Conference, Orlando, FL, USA, 16–21 August 1999. [Google Scholar]
- Kerzner, H. Project Management: A Systems Approach to Planning, Scheduling, and Controlling, 11th ed.; John Wiley & Sons, Inc.: New York, NY, USA, 2013. [Google Scholar]
- Bahill, A.T.; Daniels, J. Correction to Quantitative Methods for Tradeoff Analyses. Syst. Eng. 2005, 8, 93. [Google Scholar] [CrossRef]
- Ben-Asher, J.Z. Development Program Risk Assessment Based on Utility Theory. Risk Manag. 2008, 10, 285–299. [Google Scholar] [CrossRef]
- Carbone, T.; Tippett, D. Project risk management using the project risk FMEA. J. Eng. Manag. 2004, 16, 1–8. [Google Scholar] [CrossRef]
- McManus, T.N. Management of Hazardous Energy Deactivation, De-Energization, Isolation, and Lockout; CRC Press: Boca Raton, FL, USA; Taylor & Francis Group: New York, NY, USA, 2013. [Google Scholar]
- Ma, T.; Wu, J.; Hao, L. Energy flow modeling and optimal operation analysis of the micro energy grid based on energy hub. Energy Convers. Manag. 2017, 133, 292–306. [Google Scholar] [CrossRef]
- Abdelsamad, S.F.; Morsi, W.G.; Sidhu, T.S. Impact of wind-based distributed generation on electric energy in distribution systems embedded with electric vehicles. IEEE Trans. Sustain. Energy 2015, 6, 79–87. [Google Scholar] [CrossRef]
- Zio, E.; Golea, L.R. Analyzing the topological, electrical and reliability characteristics of a power transmission system for identifying its critical elements. Reliab. Eng. Syst. Saf. 2012, 101, 67–74. [Google Scholar] [CrossRef]
- Liu, Z.; Liu, Y.; Zhang, D.; Cai, B.; Zheng, C. Fault diagnosis for a solar assisted heat pump system under incomplete data and expert knowledge. Energy 2015, 87, 41–48. [Google Scholar] [CrossRef]
- Zhao, Y.; Xiao, F.; Wang, S. An intelligent chiller fault detection and diagnosis methodology using Bayesian belief network. Energy Build. 2013, 57, 278–288. [Google Scholar] [CrossRef]
- US Department of Defense. Military Standard 882B System Safety Program Requirements; US Department of Defense: Washington, DC, USA, 1984. Available online: http://sunnyday.mit.edu/safety-club/882b.htm (accessed on 8 August 2017).
- Pradhan, D.K.; Mathew, J.; Shafik, R. Energy-Efficient Fault-Tolerant Systems; Springer Publishing Company: New York, NY, USA, 2014. [Google Scholar]
- Goble, W.M.; Cheddie, H. Safety Instrumented Systems Verification: Practical Probabilistic Calculations; ISA-The Instrumentation, Systems, and Automation Society: Research Triangle Park, NC, USA, 2005. [Google Scholar]
- Wolter, K. Stochastic Models for Fault Tolerance: Restart, Rejuvenation and Checkpointing; Springer: New York, NY, USA, 2010. [Google Scholar]
- Abbasi, A.R.; Seifi, A.R. Considering cost and reliability in electrical and thermal distribution networks reinforcement planning. Energy 2015, 84, 25–35. [Google Scholar] [CrossRef]
- Piesik, E.; Śliwiński, M.; Barnert, T. Determining and verifying the safety integrity level of the safety instrumented systems with the uncertainty and security aspects. Reliab. Eng. Syst. Saf. 2016, 152, 259–272. [Google Scholar] [CrossRef]
- Dubrova, E. Fault-Tolerant Design; Springer: Berlin, Germany, 2013; pp. 55–65. [Google Scholar]
- Baybutt, P. Risk tolerance criteria and the IEC 61511/ISA 84 standard on safety instrumented systems. Process Saf. Prog. 2013, 32, 307–310. [Google Scholar] [CrossRef]
- Koraz, Y.; Gabbar, H.A.; Gabbar, A. Risk Analysis and Self-Healing Approach for Resilient Interconnect Micro Energy Grids. Sustain. Cities Soc. 2017, 32, 638–653. [Google Scholar] [CrossRef]
- Danesh, H.K.-Z.H. Microgrid Energy Management System: A Study of Reliability and Economic Issues. In Proceedings of the 2012 IEEE Power and Energy Society General Meeting, San Diego, CA, USA, 22–26 July 2012; pp. 1–5. [Google Scholar]
- Schroeder, A. Modeling storage and demand management in power distribution grids. Appl. Energy 2011, 88, 4700–4712. [Google Scholar] [CrossRef]
- Eeh Power Systems Laboratory. UCTE System Adequacy Forecast. 2007. Available online: https://www.entsoe.eu/news-events/former-associations/ucte/system-adequacy/Pages/default.aspx (accessed on 8 August 2017).
- Islam, M.R.; Gabbar, H.A. Study of Micro Grid Safety & Protection Strategies with Control System Infrastructures. Smart Grid Renew. Energy 2012, 3, 1–9. [Google Scholar]


| SI | Grid Type | Hazard Mode | Hazard Event | Severity | Frequency | Probability | Avoidance | Class | Hazard Level | Hazard Rank | Adverse Effects/Consequences | Action (Remedial, Prevention or Mitigation) | Proposed Solutions and IPLs | |
| SCORE | 1 = Negligible 2 = Marginal 3 = Critical 4 = Catastrophic | 1 = Less 2 = yearly 3 = Monthly 4 = Weekly 5 = Daily | 1 = Negligible 2 = Rarely 3 = Possible 4 = Likely 5 = Common | 1 = Likely 3 = Possible 5 = Impossible | 3–4 = Very Low 5–7 = Low 8–10 = Moderate 11–13 = High 14–15 = Extremely High | HL = S*C | 1 = Low 2 = Moderate 3 = High | Higher rank means higher risk | (1) On Human | |||||
| (2) On Facility | ||||||||||||||
| (3) On Environment | ||||||||||||||
| 1 | Electrical MEG | Power Blackout | Over load (above the grid capability) | 4 | 3 | 3 | 5 | 11 | 44 | H | 24 | (1) Demand not Served (DNS) | 1—Upgrade grid capacity 2—Shift on-peak power demand 3—Dynamic grid mapping based on load demand and priority | 1—Intelligent Energy Storage System (super capacitor, Fly Wheel, TES and pumped hydro, or hydrogen storage. 2—Intelligent Fault Tolerant Controller. 3—Ranking the loads as per its prioritization level. |
| (2) Overheated transmission and distribution cables, Asset Damage, fire and power blackout | ||||||||||||||
| (3) Fire cause CO2 Emission | ||||||||||||||
| 2 | MEG has lack of DER | 4 | 3 | 3 | 3 | 9 | 36 | H | 16 | (1) Interruption on service | High dynamic performance from the distributed power and energy system by • Store off-peak power production for using at on-peak demand • Utilize Gas Generator • Connect to Capital Grid (Utility) | 1—Intelligent Energy Storage System (super capacitor, Fly Wheel, TES and pumped hydro, or hydrogen storage). 2—Load Following or dispatchable generator (fuel cells, micro-gas turbines, and hybrid fuel cell gas turbine systems) 3—Higher level Self-Healing Management Controller | ||
| (2) Power interruption and/or blackout | ||||||||||||||
| (3) Lack of DER = more demand on Fossil fuel generators which cause Emission | ||||||||||||||
| 3 | Intermittency of on site renewable sources | 3 | 5 | 5 | 3 | 13 | 39 | H | 18 | (1) Disturbance on service | ||||
| (2) Intermittency and non-coincidence of power production | ||||||||||||||
| (3) Lack of DER = more demand on Fossil fuel generators | ||||||||||||||
| 4 | Integration of multi sources DERs | 2 | 5 | 5 | 3 | 13 | 26 | M | 8 | (1) Operation Failure of Sensitive Devices | 1—Full utilization of DERs to increase energy efficiency 2—Improve power quality 3—Enhance system stability | 1—Advanced D-FACTS system on AC/DC MEG to achieve resilient MEG 2—Create Robust KPI parameters able to optimize feedback control coefficients | ||
| (2) Negative impacts on grid parameters such as active power (P), reactive power (Q), voltage (V), phase shift (α) and frequency (f). In other words, poor power quality | ||||||||||||||
| (3) Excessive on Energy Resources and Emission | ||||||||||||||
| 5 | Faults in the power systems (generation, transmission or distribution) systems | 4 | 2 | 4 | 5 | 11 | 44 | H | 25 | (1) Unsatisfied condition for customers | 1—Isolate the minimal affected branch 2—Switch off and isolate the DERs allocated in the affected zone | 1—Wide area monitoring and alarm systems 2—Utilizing numerical smart relays 3—Emergency Shutdown system ESD 4—Periodical testing and maintenance procedure | ||
| (2) Power failure and/or outage may cause loss of business and production | ||||||||||||||
| (3) Fire cause CO2 Emission | ||||||||||||||
| 6 | Utility grid failure | 4 | 2 | 2 | 2 | 6 | 24 | M | 5 | (1) Unsatisfied condition for customers | 1—Open the main switch gear (islanded mode) 2—Standby all available DERs 3—Reduce the load based on priority and power production availability | 1—Monitoring and Alarm systems for Utility grid energy quality and status 2—Safety management controller dealing with hazards scenarios 3—Emergency Shutdown system ESD | ||
| (2) Power failure and/or outage may cause loss of business and production | ||||||||||||||
| (3) More demand on Fossil fuel generators | ||||||||||||||
| 7 | Solar Farm Outage | Solar Panel output drops by 60 MW in a 15 min. | 4 | 3 | 4 | 3 | 10 | 40 | H | 19 | (1) Breakers could trip leaving customers without electric power. | 1—Store off-peak power production for using at on-peak demand 2—Dynamic grid mapping based on load demand and priority | 1—Adopt advanced power storage units such as super capacitor | |
| (2) Voltage on the grid could drop and frequency of main generators could change | ||||||||||||||
| (3) Increase the demand on coal-fired generators | ||||||||||||||
| 8 | Feeder circuit disconnects from substation | 1 | 5 | 5 | 3 | 13 | 13 | M | 2 | (1) The customer can no longer sell electricity to utility grid | 1—Dynamic network based on load demand and priority 2—Reduce the load based on priority and power production availability | 1—Intelligent Alarm systems for panel power quality and status 2—Adopt SIS management dealing with hazards scenarios | ||
| (2) Feeder circuit voltage could get out of phase with the grid | ||||||||||||||
| (3) Increase the demand on coal-fired generators | ||||||||||||||
| 9 | Short to ground on distribution grid | 2 | 1 | 2 | 5 | 8 | 16 | M | 3 | (1) Unsatisfied condition for customers | 1—Dynamic network based on load demand and priority 2—Reduce the load based on priority and power production availability | 1—Intelligent Alarm systems for panel power quality and status 2—Adopt SIS management dealing with hazards scenarios | ||
| (2) Equipment could be damaged, particularly transformers and capacitor banks. | ||||||||||||||
| (3) Increase the demand on coal-fired generators | ||||||||||||||
| 10 | Failure of DC to AC inverters | 1 | 4 | 4 | 3 | 11 | 11 | M | 1 | (1) The customer can no longer sell electricity to utility grid | 1—Isolate the minimal affected branches 2—Switch off and isolate the affected inverters | 1—Utilizing numerical smart relays 2—Periodical testing and maintenance procedure | ||
| (2) Power failure and/or outage may cause loss of business and production | ||||||||||||||
| (3) Increase the demand on coal-fired generators | ||||||||||||||
| 11 | Cooling MEG | Cooling Outage | High correlation of cooling demand with electricity demand | 4 | 5 | 3 | 3 | 11 | 44 | H | 23 | (1) Demand not served | Shift on-peak cooling demand to off-peak demand | 1—Utilize TES tanks 2—Predictive energy management 3—Ranking the cooling demand as per its prioritization level |
| (2) Increase on-peak electricity demand could cause interruption and/or blackout | ||||||||||||||
| (3) Increase demand on Fossil Fuel generation | ||||||||||||||
| 12 | MEG cooling contingency load with lack of Chiller units | 4 | 3 | 3 | 3 | 9 | 36 | H | 17 | (1) Uncomfortable condition for human | 1—Isolate the affected chiller unit from both electrical and cooling network 2—Stand by all absorption chiller units for compensation purpose 3—Update the management control to reschedule storage strategies by store off-peak cooling production for using at on-peak demand | 1—Utilize TES tanks 2—Intelligent contingency energy management (for emergency procedure) 3—Utilizing numerical smart valves | ||
| (2) Can’t meet the on-peak cooling demand | ||||||||||||||
| (3) Using individual A/C units lead to increase Global Worming | ||||||||||||||
| 13 | Faults in the Cooling system (Chiller, TES, Pumps or Pipes and valves) systems | 4 | 2 | 4 | 5 | 11 | 44 | H | 22 | (1) Unsatisfied condition for customers | 1—Isolate the minimal affected branch 2—Switch off and isolate the cooling DERs allocated in the affected zone | 1—Utilizing numerical smart meters 2—Emergency Shutdown system ESD 3—Periodical testing and maintenance procedure | ||
| (2) Cooling energy failure may cause loss of business and production | ||||||||||||||
| 14 | Leak in the cooling pipe branch | (3) May cause pollution by liquid and gases spreads or by direct fire | ||||||||||||
| 15 | Cooling Overload | 4 | 3 | 4 | 1 | 8 | 32 | H | 13 | (1) Uncomfortable condition for human | 1—reduce the load as per priority index to match the production capacity 2—peak shave management for dispatchable loads to balance between power production and demand 3—Convert heating to cooling energy | 1—Utilizing numerical smart meters 2—Emergency Shutdown system ESD 3—Utilize absorption chillers | ||
| (2) Can’t meet the on-peak cooling demand | ||||||||||||||
| (3) Using individual A/C units lead to increase Global Worming | ||||||||||||||
| 16 | Heating MEG | Heating Outage | Irregular hot-water demand | 3 | 5 | 4 | 3 | 12 | 36 | H | 16 | (1) Uncomfortable condition for human | 1—Store off-peak hot water production for using at on-peak demand | 1—Utilize TES tanks 2—Predictive energy management |
| (2) Failure to meet the Hot water on-peak demand | ||||||||||||||
| (3) Alternative heat sources like furnace produce emission | ||||||||||||||
| 17 | Thermal over load | 4 | 2 | 2 | 3 | 7 | 28 | M | 9 | (1) Uncomfortable condition for human | 1—reduce the load as per priority index to match the production capacity 2—peak shave management for dispatchable loads to balance between power production and demand 3—discharge the thermal storage energy 4—switch off the absorption chillers | 1—Utilizing numerical smart meters 2—Emergency Shutdown system ESD 3—Safety management controller dealing with hazards scenarios | ||
| (2) Failure to meet the Hot water on-peak demand | ||||||||||||||
| (3) Alternative heat sources like furnace produce more emission | ||||||||||||||
| 18 | Faults in the Heating system (Cogen, Boiler, TES, Pumps or Pipes and valves) systems | 4 | 2 | 4 | 5 | 11 | 44 | H | 21 | (1) Unsatisfied condition for customers | 1—isolate the minimal affected branch 2—switch off and isolate the thermal DERs allocated in the affected zone | 1—Wide area monitoring and alarm systems 2—Emergency shutdown system ESD 3—Periodical testing and maintenance procedure | ||
| (2) Heating energy failure may cause loss of business and production | ||||||||||||||
| (3) Fire cause CO2 Emission | ||||||||||||||
| 19 | Loss of electrical boiler | 4 | 2 | 2 | 3 | 7 | 28 | M | 10 | (1) Unsatisfied condition for customers | 1—Isolate the Electrical boiler from power and thermal networks 2—Standby Co-gen and gas boiler to cover the thermal deficiency 3—Update the management control to reschedule storage strategies | 1—Wide area monitoring and alarm systems 2—Emergency shutdown system ESD 3—Periodical testing and maintenance procedure | ||
| (2) Heating energy failure may cause loss of business and production | ||||||||||||||
| (3) Alternative heat sources like furnace produce emission | ||||||||||||||
| 20 | Loss of gas boiler | 4 | 2 | 2 | 3 | 7 | 28 | M | 11 | (1) Unsatisfied condition for customers | 1—Isolate the Electrical boiler from power and thermal networks 2—Standby Co-gen and electrical boiler to cover the thermal deficiency 3—Update the management control to reschedule storage strategies | 1—Wide area monitoring and alarm systems 2—Emergency shutdown system ESD 3—Periodical testing and maintenance procedure | ||
| (2) Heating energy failure may cause loss of business and production | ||||||||||||||
| (3) Alternative heat sources like furnace produce more emission | ||||||||||||||
| 21 | Natural Gas | Natural Gas Outage | Gas Leak in Co-gen’s feeder pipe | 4 | 3 | 2 | 3 | 8 | 32 | H | 14 | (1) Loss of life’s, injury and suffocation | 1—Close the affected branch 2—switch off and isolate the Co-gen from electrical and heating networks 3—switch to grid connected mode to cover the deficit in power production 4—standby boiler furnace to serve the thermal demand | 1—Wide area monitoring and alarm systems 2—Emergency shutdown system ESD |
| Gas Leak in boiler’s feeder pipe | 4 | 3 | 2 | 3 | 8 | 32 | H | 15 | (2) Damage in assets and loss of business | 1—Close the affected branch 2—switch off and isolate the gas boiler from gas and heating networks 3—standby electrical boiler to serve the thermal demand 4—switch to grid connected mode to cover the deficit in power production | ||||
| Gas Leak in the Main Pipes | 4 | 2 | 2 | 3 | 7 | 28 | M | 12 | (3) Toxic gases and CO2 Emission | 1—Isolate the affected pipes 2—switch off all systems feed by affected pipes | ||||
| 22 | Transportation | Transportation Breakdown | Transportation energy demand | 4 | 5 | 5 | 1 | 11 | 44 | H | 20 | (1) Loss of life’s , injury and suffocation | 1—Achieve energy management balance between transportation units and MEG for more reliability and security enhancement, reduced emissions and improved energy quality. | 1—Energy storage system (super capacitor, flywheel, TES and pumped hydro, or hydrogen storage). 2—Following generator (fuel cells, micro-gas turbines, and hybrid fuel cell gas turbine systems) 3—Intelligent management controller |
| (2) Failure in energy threaten the safety for properties and the public | ||||||||||||||
| (3) Back-up engines works using fossil fuel which increase emission | ||||||||||||||
| 23 | May affect all energy types | Natural Phenomenon | Earth quake | 5 | 1 | 2 | 2 | 5 | 25 | L | 6 | (1) Loss of life's, injury and delay | Isolate the affected area from the service | 1—Intelligent Management Controller 2—Smart Relays and metering |
| (2) Failure in energy threaten the safety for properties and the public | ||||||||||||||
| (3) Spreading the damages and may initiate new hazards | ||||||||||||||
| 24 | Water flood | 5 | 1 | 3 | 1 | 5 | 25 | L | 7 | (1) Loss of life's, injury and delay | Isolate the affected area from the service | 1—Intelligent Management Controller 2—Smart Relays and metering | ||
| (2) failure in energy threaten the safety for properties and the public | ||||||||||||||
| (3) Spreading the damages and may initiate new hazards | ||||||||||||||
| 25 | Thunder storm and lightning | 5 | 1 | 2 | 1 | 4 | 20 | L | 4 | (1) Loss of Life’s , Injury and delay | Isolate the affected area from the service | 1—Intelligent Management Controller 2—Smart Relays and metering | ||
| (2) Electrical devices might be damaged | ||||||||||||||
| (3) Spreading of the damages and may initiate new hazards | ||||||||||||||
| SIS Operating Condition | Process | Protection Available | Failure Indication |
|---|---|---|---|
| Normal | Operating Normally | Yes | N/A |
| Fail-Safe | Falsely Operating | N/A | Yes |
| Fail-Danger | Operating Normally | No | Without Diagnosis |
| SI | Hazard Mode | Hazard Events |
|---|---|---|
| 1 | Power blackout mode | Over load (above the grid capability) |
| 2 | Faults in the power systems (generation, transmission or distribution) | |
| 3 | Solar farm outage | Solar panel output drops by 60 MW in 15 min time. |
| 4 | Cooling outage | Faults in the cooling system (chiller, TES, pumps or pipes and valves) systems |
| 5 | Leak in the cooling pipe branch | |
| 6 | High correlation of cooling demand with electricity demand | |
| 7 | Heating outage | Faults in the heating system (Cogen, boiler, TES, pumps or pipes and valves) systems |
| 8 | Transportation breakdown | Transportation energy demand |
| SI | Hazard Mode | Hazard Events |
|---|---|---|
| 1 | Power blackout mode | Intermittency of on site renewable sources |
| 2 | MEG has lack of DER | |
| 3 | Cooling outage | MEG cooling contingency load with lack of chiller units |
| 4 | Cooling overload | |
| 5 | Heating outage | Irregular hot-water demand |
| 6 | Thermal over load | |
| 7 | Loss of electrical boiler | |
| 8 | Loss of gas boiler | |
| 9 | Natural gas outage | Gas Leak in Co-gen’s feeder pipe |
| 10 | Gas Leak in boiler’s feeder pipe | |
| 11 | Gas Leak in the main pipes |
| SIL | General Description | PFD Avg. | Risk Reduction Factor (RRF) | Availability (%) |
|---|---|---|---|---|
| 4 | Catastrophic community impact | 10−4 to 10−5 | 10,000 to 100,000 | 99.99 to 99.999 |
| 3 | Employee and community impact | 10−3 to 10−4 | 1000 to 10,000 | 99.9 to 99.99 |
| 2 | Major property and production impact; Possible injury to employee | 10−2 to 10−3 | 100 to 1000 | 99 to 99.9 |
| 1 | Minor property and production impact | 10−1 to 10−2 | 10 to 100 | 90 to 99 |
| Type | Failure Rate (f/year) | Reliability | PFD | Repair Time (h) |
|---|---|---|---|---|
| Solar Panel | 0.11 | 0.8958 | 0.1042 | 72 |
| Wind Turbine | 0.21 | 0.8106 | 0.1894 | 60 |
| Co-generator | 0.18 | 0.8353 | 0.1647 | 12 |
| Capital grid | 0.000184 | 0.9998 | 0.000184 | n/a |
| Chiller Unit | n/a | 0.95 [52] | 0.05 | n/a |
| Fuel Cell | 0.11 | 0.8958 | 0.1042 | 72 |
| Battery | 0.22 | 0.8025 | 0.1975 | 60 |
| Micro Turbine/HRSG | 0.16 | 0.8521 | 0.1479 | 16 |
| Contributor | Minutes/Year | % |
|---|---|---|
| Generation/transmission | 0.5 | 0.5 |
| 132 KV | 2.3 | 2.4 |
| 66 KV and 33 KV | 8 | 8.3 |
| 11KV and 6.6KV | 58.8 | 60.7 |
| Low voltage | 11.5 | 11.9 |
| Scheduled shutdown | 15.7 | 16.2 |
| Total | 96.8 | 100 |
© 2017 by the authors. Licensee MDPI, Basel, Switzerland. This article is an open access article distributed under the terms and conditions of the Creative Commons Attribution (CC BY) license (http://creativecommons.org/licenses/by/4.0/).
Share and Cite
Gabbar, H.A.; Koraz, Y. Risk Assessment of Micro Energy Grid Protection Layers. Energies 2017, 10, 1176. https://doi.org/10.3390/en10081176
Gabbar HA, Koraz Y. Risk Assessment of Micro Energy Grid Protection Layers. Energies. 2017; 10(8):1176. https://doi.org/10.3390/en10081176
Chicago/Turabian StyleGabbar, Hossam A., and Yahya Koraz. 2017. "Risk Assessment of Micro Energy Grid Protection Layers" Energies 10, no. 8: 1176. https://doi.org/10.3390/en10081176
APA StyleGabbar, H. A., & Koraz, Y. (2017). Risk Assessment of Micro Energy Grid Protection Layers. Energies, 10(8), 1176. https://doi.org/10.3390/en10081176