Article

Energy Refurbishment of an Office Building with Hybrid Photovoltaic System and Demand-Side Management

by
Giovani Almeida Dávi
1,*,
José López de Asiain
2,
Juan Solano
1,
Estefanía Caamaño-Martín
1 and
César Bedoya
2
1
Instituto de Energía Solar, Universidad Politécnica de Madrid, Av. Complutense 30, 28040 Madrid, Spain
2
ETS Arquitectura, Universidad Politécnica de Madrid, Av. Juan de Herrera 4, 28040 Madrid, Spain
*
Author to whom correspondence should be addressed.
Energies 2017, 10(8), 1117; https://doi.org/10.3390/en10081117
Submission received: 16 June 2017 / Revised: 25 July 2017 / Accepted: 26 July 2017 / Published: 1 August 2017
(This article belongs to the Special Issue Energy Conservation in Infrastructures 2016)

Abstract

:
On-site photovoltaic (PV) and battery systems intend to improve buildings energy performance, however battery costs and monetary incentives are a major drawback for the introduction of these technologies into the electricity grids. This paper proposes an energy refurbishment of an office building based on multi-objective simulations. An innovative demand-side management approach is analyzed through the PV and battery control with the purpose of reducing grid power peaks and grid imported energy, as well as improving the project economy. Optimization results of load matching and grid interaction parameters, complemented with an economic analysis, are investigated in different scenarios. By means of battery use, the equivalent use of the grid connection is reduced by 12%, enhancing the grid interaction potential, and 10% of load matching rates can be increased. Project improvements indicate the grid connection capacity can be reduced by 13% and significant savings of up to 48% are achieved on yearly bills. The economy demonstrates the grid parity is only achieved for battery costs below 100 €/kWh and the payback period is large: 28 years. In the case with only PV system, the grid parity achieves better outcomes and the payback time is reduced by a half, making this a more attractive option.

1. Introduction

Office buildings are one of the most energy consuming building types [1] and consequently are in need of energy refurbishment actions. In 2014, a total of 226 TWh of electricity was consumed in Spain, where office buildings consumed about 10% [1]. In a typical office building, artificial lighting and Heating, Ventilation and Air Conditioning (HVAC) systems are considered as major contributors to the building’s energy consumption, making these loads the best targets for energy savings [2]. Office buildings have the advantage that the electrical demand occurs mainly during the day so that load supply can also be performed by on-site photovoltaic (PV) solar system. Moreover, hybrid renewable energy systems can combine several technologies, such as photovoltaics, thermal photovoltaic, wind turbine and electrical storage [3]. Photovoltaics is one of the most promising renewable energy technologies because it provides electricity locally, is free of greenhouse gas emissions and pollution during operation and can be widely applied in the urban context. As PV generation is an intermittent power source, Demand-Side Management (DSM) with electrical storage becomes increasingly challenging. The added value of power and energy services that can be provided by PV hybrid systems combined with intelligent management strategies is an interesting topic, especially for the increasing number of markets where electricity supply can be rendered by renewable energy technologies [4]. DSM refers to the ability of consumers to adjust their electricity demand to facilitate a better matching with supply [5,6]. In the present context of electricity markets with an increasing penetration of Distributed Generation (DG), PV hybrid systems can play a major role in increasing electricity bill savings and the profitability of the associated investment by means of reducing peak power and electricity demand from the grid [7]. In addition, coordinated control of building loads (i.e., daylight harvesting and dimming strategies), can provide energy consumption reductions, aggregating value to local Renewable Energy Sources (RES) as providers of buildings energy requirements.
Battery Energy Storage Systems (BESS) combined with PV technology can increase energy supply reliability in urban buildings because: (1) they optimize PV generation use by local self-consumption; (2) they can limit injected power into the grid during PV peak periods, avoiding potential negative grid effects (i.e., grid instability, feeder voltage-rise [8]); and (3) they can also reduce grid electricity costs when responding to grid signals, such as electricity tariffs. Several energy storage technologies are available nowadays (i.e., lead-acid, ion-lithium, redox-flow, and flywheel), being Valve-Regulated Lead-Acid (VRLA) technology one of the most mature, safe and widespread. Nowadays, VRLA batteries have relatively high efficiency and the lowest initial costs, which make them a common choice for new applications [9,10]. Several authors have also focused their research based on lead–acid batteries, citing this technology as currently the most cost-effective for use, although most articles are focused for uninterruptible power supply, stand-alone and residential installations [3,9,11]. Recent forward-looking market analyses indicate that lead-acid battery costs will be reduced by around 65% by 2030 through improved technologies that are of interest in combination with smart management strategies [12].
Retail electricity prices for commercial buildings are increasingly getting closer to the Levelized Cost of Electricity generated by PV systems (PV-LCOE), a situation defined as “grid parity” condition [13]. However, PV self-consumption will only be encouraged if grid parity is combined with regulatory support. With the PV costs reductions observed over the last years, grid parity has already been reached in many countries [4,13]. In developed solar markets such as in Germany and in Italy, low PV installations costs together with low discount rates and high retail electricity prices have contributed to reach full grid parity. For example, in Germany, as feed-in tariff (FIT) for PV electricity is decreasing fast, the Renewable Energy Sources Act of has provided means to maximize the self-sufficiency of buildings through the installation of subsidized of battery systems and limited feed-in power [9,10]. Chile has improved its grid parity context mainly due to financial incentives for Photovoltaics, sponsored by the Energy Ministry, however, a high discount rate and low electricity prices still hinder grid parity. In Brazil, high PV prices and high discount rate (10% in the commercial sector) still prevent grid parity proximity, but with the current PV industry development in the country, allied with an attractive net-metering support [14], PV grid parity is expected to be reached soon. In Spain, solar energy and Photovoltaics are considered to have one of the greatest potential in Europe besides competitive system prices. However, poor regulatory mechanisms and significant changes introduced in the last years in the electricity tariff structure (mostly increases in the capacity charge) still prevent grid parity. Under the current regulation of Spain, any electricity consumer can generate PV electricity for self-consumption. The PV electricity excess can be valued in the spot market directly or through an intermediary, receiving compensation at the pool price, but this only applies for PV installed capacities higher than 100 kW [15]. In addition, it is only permitted a PV installed capacity equal or lower than the maximum power contracted, as equally established in other countries (i.e., Brazil and Portugal).
In a regime with no net-metering scheme or similar, a local RES allied with DSM may become favorable on the consumer side and this prompts questions about the implications for the building load matching capability and for the grid impacts, quantified with the so called Load Matching and Grid Interaction indicators (LMGI). In particular, load matching indicators lead to the characterization of the PV hybrid-load correlation [16,17,18] and provide responses about system design and operation. Grid interaction indicators take into account the unmatched parts of generated or load profiles (i.e., electricity exchanges magnitude between the building and the grid) [19]. The investigations of LMGI parameters proposed in this paper are useful for a range of applications involving Net-Zero Energy Buildings (NZEB) [16,18]. Most of the researches on LMGI and PV systems profitability assessments found in the literature deal with residential buildings provided with small scale PV-battery systems [20,21], including or not BESS and DSM, or else BESS propositions are granted for stand-alone PV installations or for grid support applications, such as frequency regulation, peak shaving and management of wind and solar variability for renewables integration [22]. Cao et al. in [3] described different hybrid renewable energy systems (solar, ground source heat pump) for office buildings under distinct climatic conditions in order to analyze extended indices of load matching. Key results considering a PV array allied with electrical storage based on lead-acid technology showed the BESS technically improves load matching by 20% but a rough estimation showed the electrical battery was not cost effective in the considered application. Isa et al. in [23] investigated a cogeneration system (PV, fuel cell and flooded lead-acid battery) in a hospital building in Malaysia. Simulation results showed due to the high initial investment cost, the system only became profitable when FIT incentives were promoted, providing savings up to 30% on the generation costs. Merei et al. in [24] proposed a PV hybrid system (PV in combination with electrical storage) in a supermarket building in Germany. The results showed high direct self-consumption rates and load matching indicators dependent on the battery size. Furthermore, the PV hybrid system was able to reduce electricity costs, however the battery costs should be reduced down to 200 €/kWh to the system be profitable. The economic viability is frequently evaluated through metrics such as the LCOE, grid parity and payback time, considering distinct support mechanisms such as feed-in tariffs [17,25,26]. However, it remains unclear what is the optimal economic configuration of the PV and storage, its economic viability when no support policies are considered, and further which implications the revenues valued in a specific spot market can affect cash flows. Furthermore, BESS operation constraints, such as battery replacement over time, are often considered as fixed values not taking into account the battery cycling which directly affects the battery degradation.
With regard to grid interaction aspects, the scientific literature has proposed that the PV hybrid installations can enhance the performance of the grid by improving the voltage stability and reducing distribution losses, thus providing the required security for consumers [27]. In this way, grid interaction indicators are suitable for grid designers and operators in order to analyze grid operation effected with PV penetration and to evaluate DG expansion in urban areas. Results presented in [8] showed that, by using an appropriate battery scheduling and priority applied to the reduction of energy flowing to and from the grid during peak pricing periods, it is possible to mitigate potential voltage rise associated with reserve power flows and still provide financial benefits to the consumers.
As follows from the previous paragraphs, an in-depth assessment of PV hybrid system combined with DSM has been poorly explored in commercial buildings (i.e., offices, schools, and hospitals). The expected steady increase of electricity prices worldwide, together with the continuous decrease of PV-battery costs highlights the interest of an in-depth assessment of the economic value of PV hybrid systems applied for commercial buildings.
Energy refurbishment of existing buildings involves mostly the modernization of energy systems and the only manner to fulfill the NZEB targets is through the integration of energy supply by renewables. The Directive 2010/31/UE [28], which establishes that from 1 January 2021 all new buildings shall be nearly NZEBs, recommends that both new buildings and existing buildings under major renovations, should achieve minimal energy requirements [29]. Several studies regarding building energy retrofit through simulation facilities have focused on energy efficiency of building components, building envelope design optimizations, operational cost analysis and the PV integration toward NZEB requirements [30,31,32].
In this paper we propose the use of a grid-connected PV system equipped with battery storage system and DSM in an office building installation, specifically in the commercial sector, in which an energy refurbishment is proposed following the principles of NZEB [33] and aiming at: (1) reducing building electricity consumption by means of building energy efficiency techniques; (2) introducing an architectural integration of PV modules on the building’s roof; (3) increasing electricity bill savings through intelligent management of the PV hybrid system; and (4) improving the building energy performance in terms of load matching and grid interaction. Simulations have been carried out for Central Spain climatology and typical Spanish commercial consumption. An economic analysis complements the study under the current Spanish distributed generation regulation conditions in order to investigate profitability scenarios of the proposed solutions.

2. Methodology

This paper proposes a methodology for energy refurbishment based on real characteristics of an office building and occupancy patters under Madrid climatic conditions. Firstly, the reference office building characteristics are presented. A virtual model used to simulate the building electricity consumption is presented in Section 2.2, indicating the building components and electrical systems, including a daylight control system with high efficient lights proper to minimize the use of electricity. Based on extensive energy simulations, investigations of a roof-integrated PV system combined with a BESS and DSM are performed to meet remaining energy needs, as described in Section 2.3 and Section 2.4. As a PV hybrid system is a useful solution that can improve building self-generated rates, mitigates high PV penetrations on the local distribution grid and provides energy/financial savings for customers, relevant LMGI indicators are evaluated to assess the effects of load management strategies (Section 2.5). Moreover, through the comparisons between two cases with different strategies it is possible to assess the building flexibility derived from LMGI indicator responses. An economic analysis method is described in Section 2.6 to access the benefits of DG and DSM. Even though the paper presents the analysis results for the particular conditions of Madrid, it is important to emphasize the work methodology can be applied to any location by taking into account the local conditions, such as energy resources (i.e., solar and wind), electricity market conditions, financial incentives for PV/battery acquisition, discount rates, policies encouraging self-consumption (i.e., net-metering and net-billing) and regulations relating to building energy efficiency and retrofit.

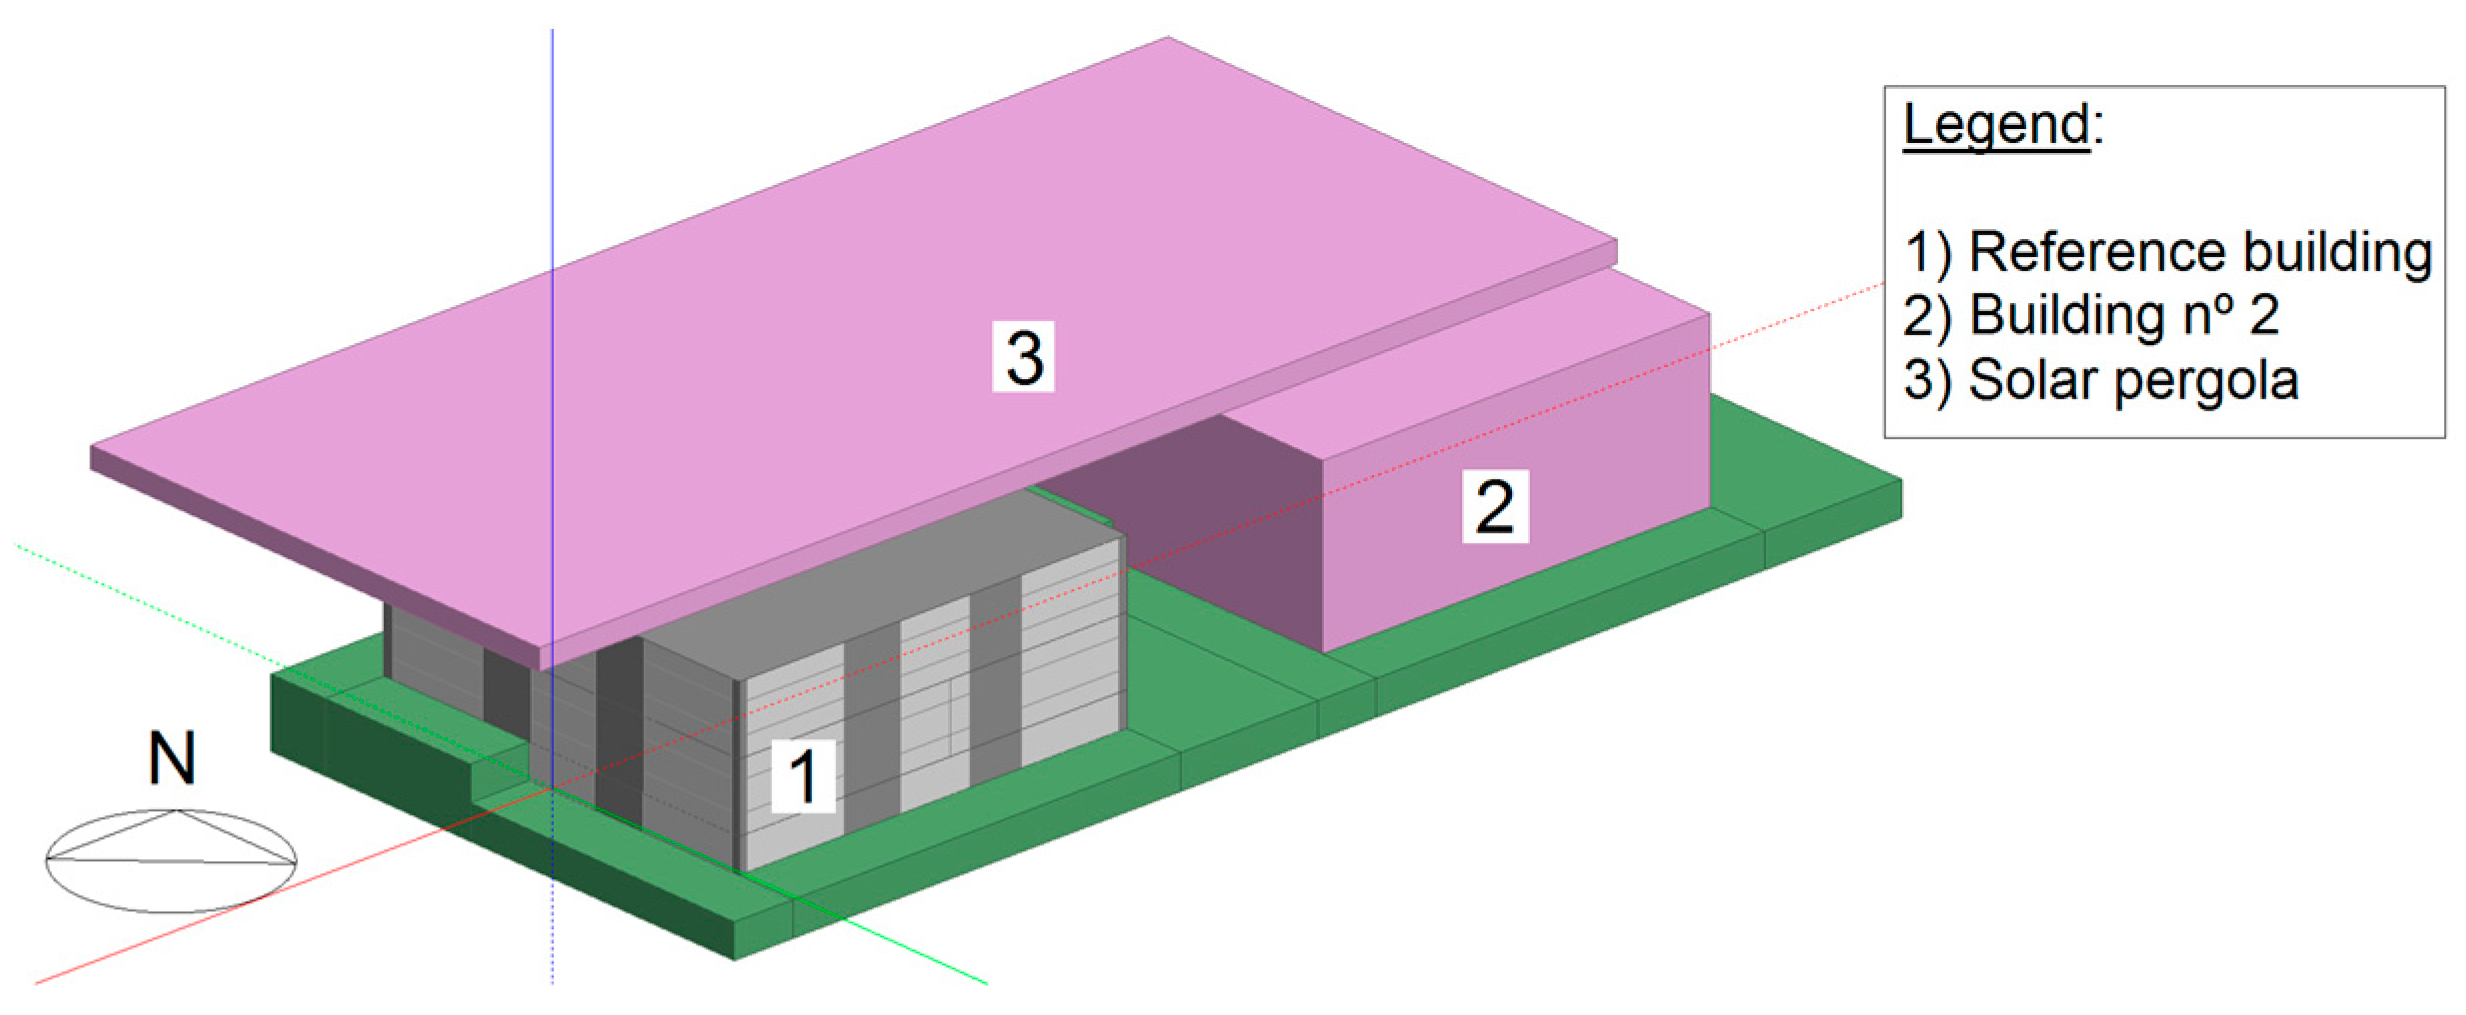
2.1. Reference Office Building and Weather Conditions

The investigated reference office building (Figure 1) consists of a cubic shape building with three floors located in a business park in Madrid with a total area of 1091 m2, 852 m2 of conditioned area and 392 m2 of gross roof area. The building was built in the late 1990s with a total annual electricity consumption of 122 MWh in 2016. The building has an energy efficiency label certified by the Building Technical Code of the Ministry of Development [34], with 225 kWh/m2y of primary energy consumption rating and 34.3 kg/m2y of CO2 emissions (class D). The building was built with prefabricated systems and a glass curtain wall covers part of the external envelope. Table 1 presents characteristics of building construction, including U-values of the envelope elements, materials thickness, density and thermal conductivity. Glass wool thermal insulation promotes the ability to retain heat during the warm seasons and prevents the release of unwanted heat through the building envelope during the cooler seasons [35]. The building is constructed with precast concrete planks in the walls, ground floor and roof. Due to the thermal performance of insulation materials, the U-value of the external walls and the roof are, respectively, 0.49 W/m2 K and 0.31 W/m2 K. The U-values requirements vary greatly from country to country due to the climatic conditions (i.e., the objective U-value of walls in Croatia is 1.2 W/m2 K whereas is only 0.15 W/m2 K in Slovenia [36]) and the main interest of using high insulation materials in Madrid is clearly to reduce air-conditioning electrical consumption in both, cooler and hotter seasons.
The investigations are carried out under Madrid weather conditions. Madrid has a cold semiarid climate of type BSk under the Köppen-Geiger climate classification [37]. The daily annual average of global horizontal irradiation (GHI) is 5.11 kWh/m2 and the annual mean temperature and relative humidity are 15 °C and 54%, respectively, obtained from an Actual Meteorological Year (AMY) weather file of Madrid in 2016 [38]. The differences of solar irradiation between winter and summer are noticeable (i.e., the GHI increases from 2 kWh/m2 in December to around 8 kWh/m2 in August), as well as the dry bulb temperature (the daily mean temperature grows 25 °C from the lowest to the highest annual mean value).

2.2. Modeling Office Building

Modeling of plug loads, lighting system, HVAC system, office hot water and PV system were done in DesignBuilder/EnergyPlus environment [39]. EnergyPlus is a building energy modeling tool based on the best features of DOE-2 and BLAST which conducts annual building energy simulations under realistic weather conditions. Simulation capabilities include extensive daylighting, more robust HVAC equipment models and photovoltaic simulation. The three-dimensional model was generated in DesignBuilder platform (Figure 2) used to create an EnergyPlus input file. The study performs electricity consumption simulations for the reference building, according to Figure 2. Due to the fact that a similar building (in terms of area, constructive characteristics and working schedule) is located at the north-east of the building under study (see Figure 2, building No. 2), this study considers the electricity consumption of the entire facility assuming the consumption of the building No. 2 similar to that of the reference building.
Taking into account the building required power and the high local solar radiation levels, the solar energy was selected as the most suitable renewable source. Furthermore, considering the location of the building within a business park, this enlarges the perspective of using PV from a single-building architectural scale to a wider scale (cluster of buildings) [40]. Accordingly, the study proposes a roof-integrated solar PV pergola that covers the two blocks with the aim of assessing the potential of PV hybrid systems to cover the energy needs of both buildings (see Figure 2). The construction of the solar pergola can be made using the structure of the building itself and placing a complementary structure on the surrounding terrain. A solar pergola is a particularly interesting solution for commercial buildings in hot climates. In particular, nearly horizontal and low tilted roofs are commonly used in buildings located within ±23.5° latitudes, due to the Sun position in most part of the year.
During the summer in Madrid, direct incident sunlight occurs more frequently over the west and northwest building’s façades from midday until sunset. Thus, the solar pergola was stretched beyond the roof perimeter to provide shadowing and to reduce solar heat gains through the curtain wall. Additionally, the solar pergola performs as a building constructive system that reduces solar heat gains that match the internal zones through the roof, therefore reducing cooling loads.
The assessment of the building energy refurbishment concept proposed here compares three different cases, as described in Table 2. The first corresponds to building-level without RES, however a lighting system optimal model is accessed, by means of Light-Emitting Diode (LED) dimming control to improve building’s energy efficiency level. The second case addresses the building-level with roof-integrated PV system (solar pergola) in order to provide local renewable electricity and to increase building’s energy performance. The third case addresses the two previous targets but with the influence of the DSM method that stores electricity in the batteries as a complementary energy source for load supply. Therefore, a coordinated battery control model has been proposed to improve the electrical load matching, the grid interaction and the electricity bill savings (see Section 2.4.). Multi-objective simulations were carried out using 1 min-resolution over one year period. The building model characteristics used in the simulations and discussed in this paper are shown in Table 3.

2.2.1. Building Operation

The lighting, plug loads, HVAC system operation schedules and occupancy patterns on a typical weekday are shown in Figure 3. The building occupancy starts to increase at 7 a.m. and reaches its maximum at about 8 a.m. The lighting and plug load operation start at 8 a.m. and at 1 p.m. their operation start to decrease gradually until lunchtime (2 p.m.), when the occupancy and plug load fractions are reduced to zero and the fraction of lighting is reduced to 75%. The HVAC system is activated one hour before occupants arrive at the building to bring the desired temperature to the space [7], reaching its maximum from about 8 a.m. to 6 p.m.

2.2.2. Lighting System

A daylighting control with LED lighting was modeled on EnergyPlus in order to increase efficiency and therefore to reduce electricity consumption. When lighting level at reference points (work plane) exceeds a set point, the lights are dimmed until the lighting set point is met and when there is enough daylight to maintain illumination levels all electric lights can shut down [7]. The light control operates as follows:
  • In each perimeter zones, which do not receive daylight, electric lights levels are reduced if the electric illuminance is greater than 700 Lux, according to the Spanish building code (500 Lux–1000 Lux) [22];
  • If the daylight illuminance is less than 700 Lux, electric light levels are controlled in order to achieve the set point illuminance of 700 Lux [7];
  • Electric lights are completely shut down if daylight illuminance exceeds 700 Lux.

2.2.3. HVAC System and Hot Water

The HVAC system consists of a (multi) split system available in EnergyPlus through an Ideal Load Air System component by which it is not connected to a central air system, instead it supplies cooling or heating air to the zones in sufficient quantity to meet the zone load [39]. The Ideal Load Air System component can be thought as an ideal unit that mixes air at the zone exhaust condition and then adds or removes heat and moisture at high efficiency in order to produce a supply air stream at the specified conditions [43]. This component is modeled as an ideal Variable-Air-Volume (VAV) terminal unit, which varies air volume supplied to the zones [39]. The VAV system reduces the air flow rates in the zone and consequently lowers energy consumption [2]. Based on European Standards of the comfort zone [44], the indoor operative temperature was kept at 21 °C to 23.5 °C in winter and 22.5 °C to 25.5 °C in summer.
An electric immersion water heater was employed by using hot water consumption rates based on the activity in each zone. Table 3 displays the characteristics of the HVAC system and hot water used in the simulations.

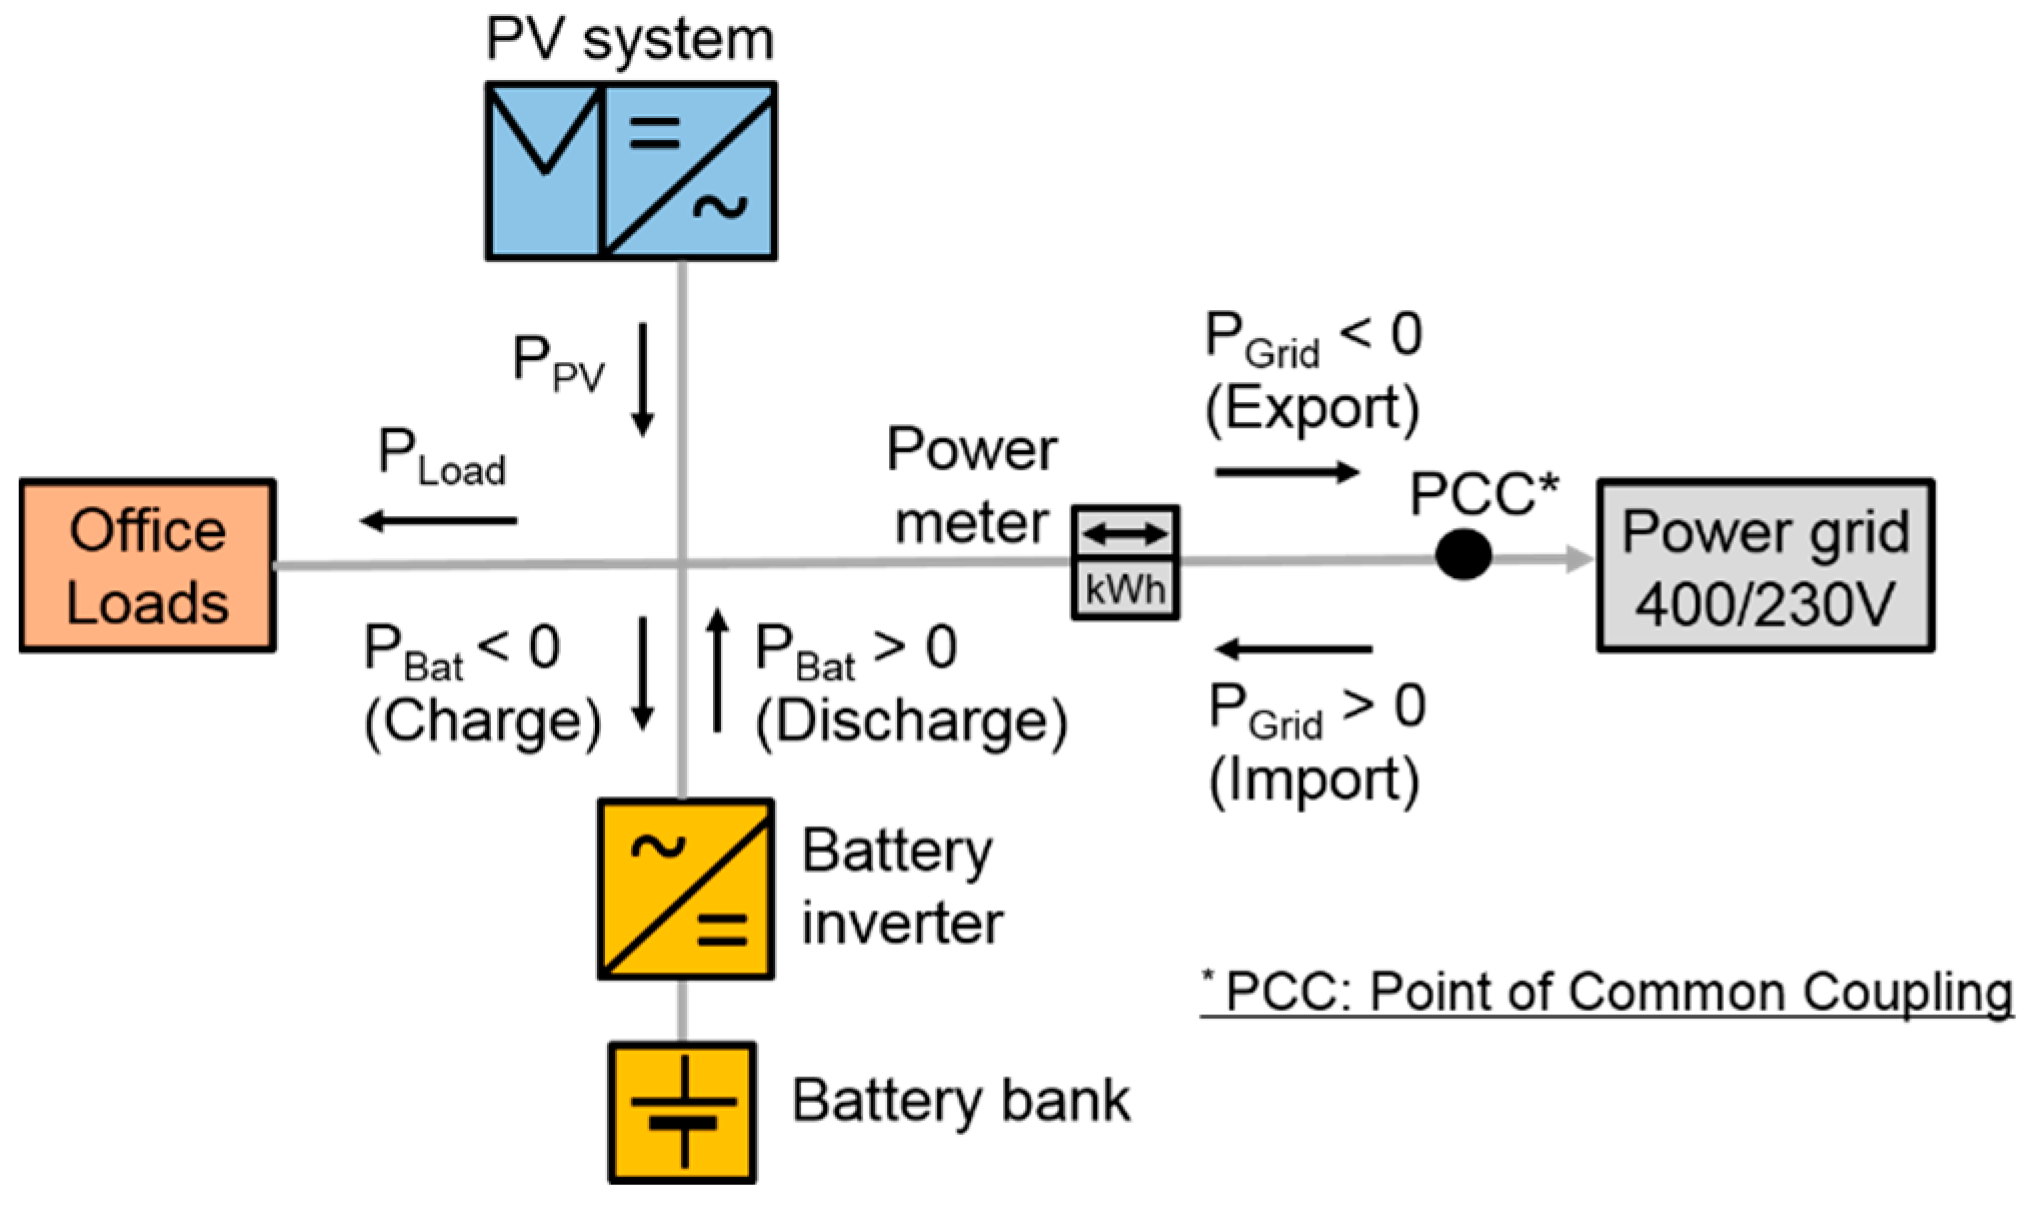
2.3. On-site Photovoltaic Hybrid System

A grid-connected PV system was modeled on EnergyPlus with a nominal installed capacity (PNomPV) of 120.32 kWp, covering 70% of the solar pergola. Due to the limitation of PV installed capacity with respect to the contracted power (PNomPV must be equal or lower than the contracted power, according to Spanish regulations), the PV capacity was designed equal to the maximum load demand (PLoad,Max = 120 kW). The PV generator is expressed by a mathematical model of Sandia Laboratory from EnergyPlus [39]. The “Look up Table” PV inverter model was selected, in which the inverter efficiency is interpolated using a look up table and the produced AC power is normalized by the inverter input power in DC. According to the building ground conditions, built in a business park with open areas between buildings, the building is not surrounded by any structure or other buildings that can provide shade on the solar modules. The PV modules were oriented at a 70° deviation from the south towards the west and tilted 5°, which favors PV production during summer periods, enabling supply cooling load peaks and minimizing wind load.
The Battery Energy Storage System nominal capacity (CBat) was normalized according to the daily load consumption as a “virtual” autonomy” (in practical terms, it would be a virtual autonomy since the building never disconnects from the power grid), as typically done in stand-alone PV systems. Here, a normalized battery capacity of 0.5 days of autonomy was selected, according to related studies [45], corresponding to 250 kWh nominal capacity. Table 3 shows PV and storage systems main characteristics.
Figure 4 illustrates the PV hybrid system components representing the commercial building that is connected to the local low-voltage grid, indicating the electricity flows with an overview of relevant nomenclature: PPV is the PV generation power, PLoad is the load consumption power, PGrid is the grid power (PGrid < 0 means that the building exports power to the grid, PGrid > 0 means the building imports power from the grid), PBat is the power exchanged with the BESS (PBat < 0 when the battery is charged, PBat > 0 when the battery is discharged). The corresponding energy balances are the integral to the related power flows (EPV, ELoad, EGrid and EBat). In this configuration, the system is connected in “self-consumption” mode, which is inside the building electrical installation, providing the highest energy efficiency (on-site generation close to local consumption).

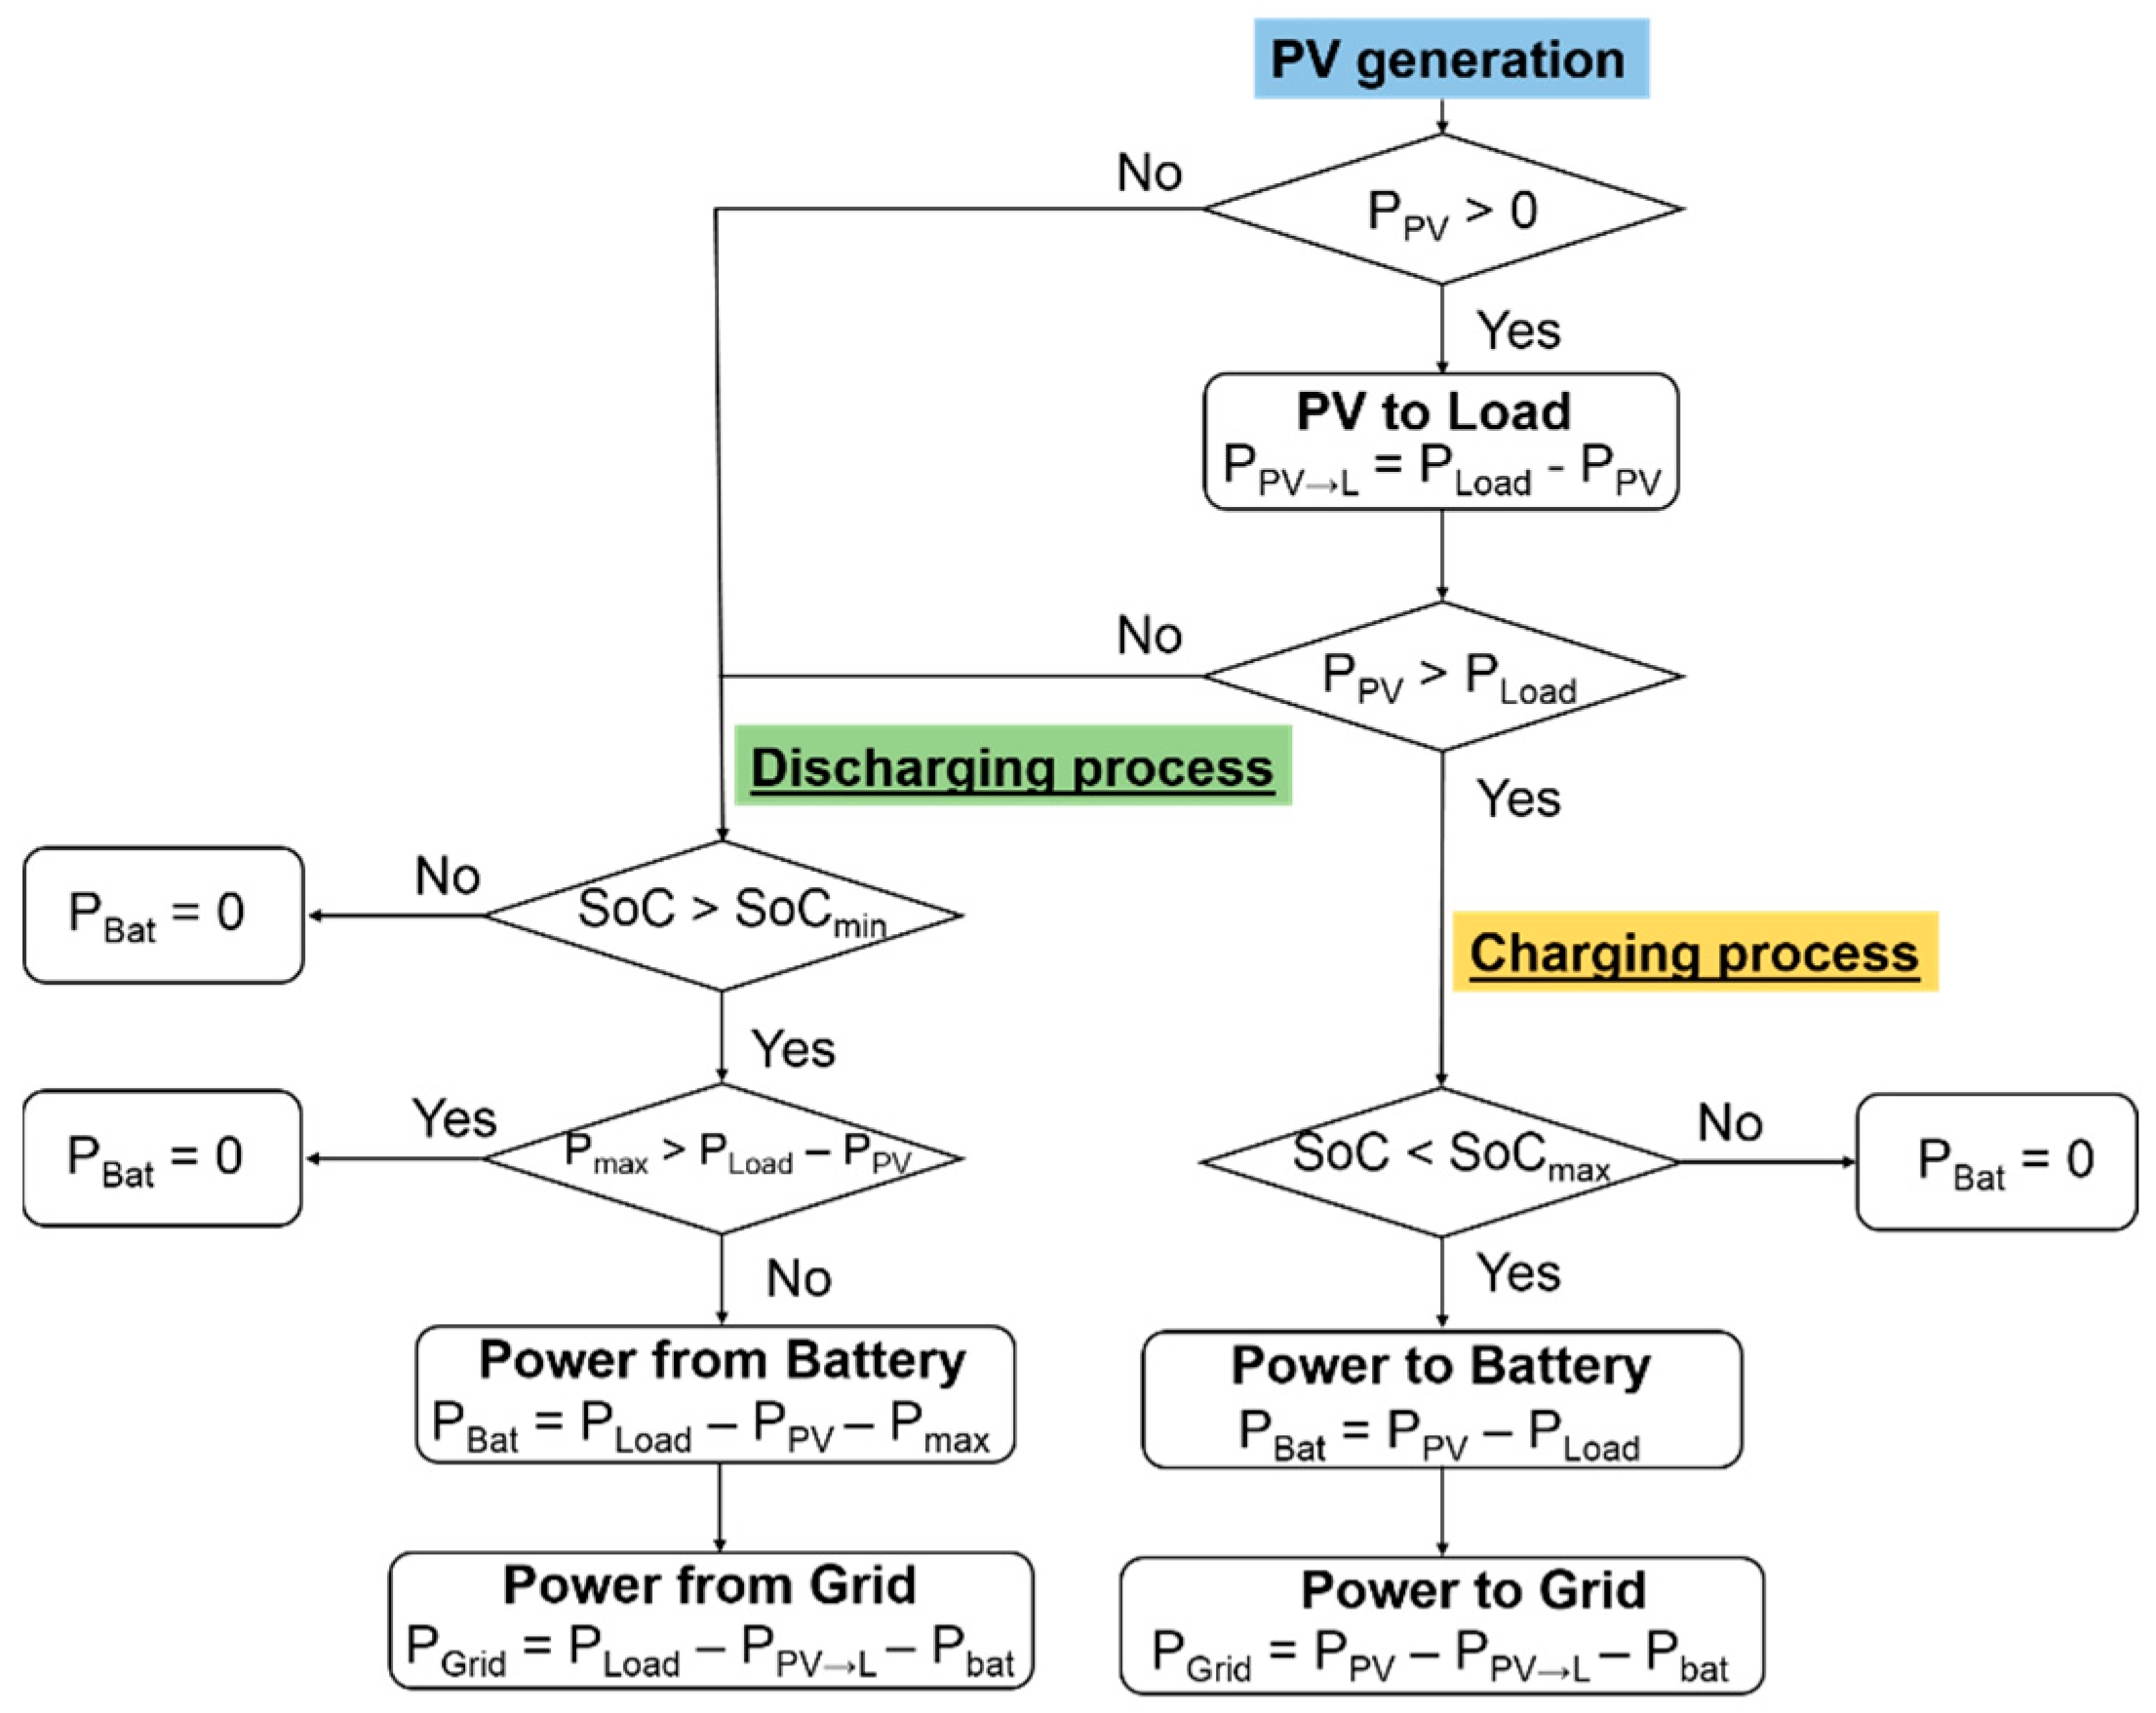
2.4. Energy Management with BESS

MATLAB software tool (version 2015) was used to simulate the dynamic behavior of a control system based on a battery controller previously developed in [45]. In the control strategy, the PV system first supplies the load in self-consumption mode, as expressed by the PPV→L parameter (Figure 5). The batteries are only used to store PV surplus (PPV > PLoad) and discharged to meet the load later on (no power exchanges between the BESS and the grid). The battery state of charge (SoC) is restricted to a range between SoCmin and SoCmax of the nominal battery capacity to preserve battery lifetime, otherwise no energy is exchanged with the battery. Battery lifetime is estimated according to [46], which calculates the useful lifetime of lead-acid batteries as a function of the battery size and particular usage. Two different Demand Side Management strategies were investigated:
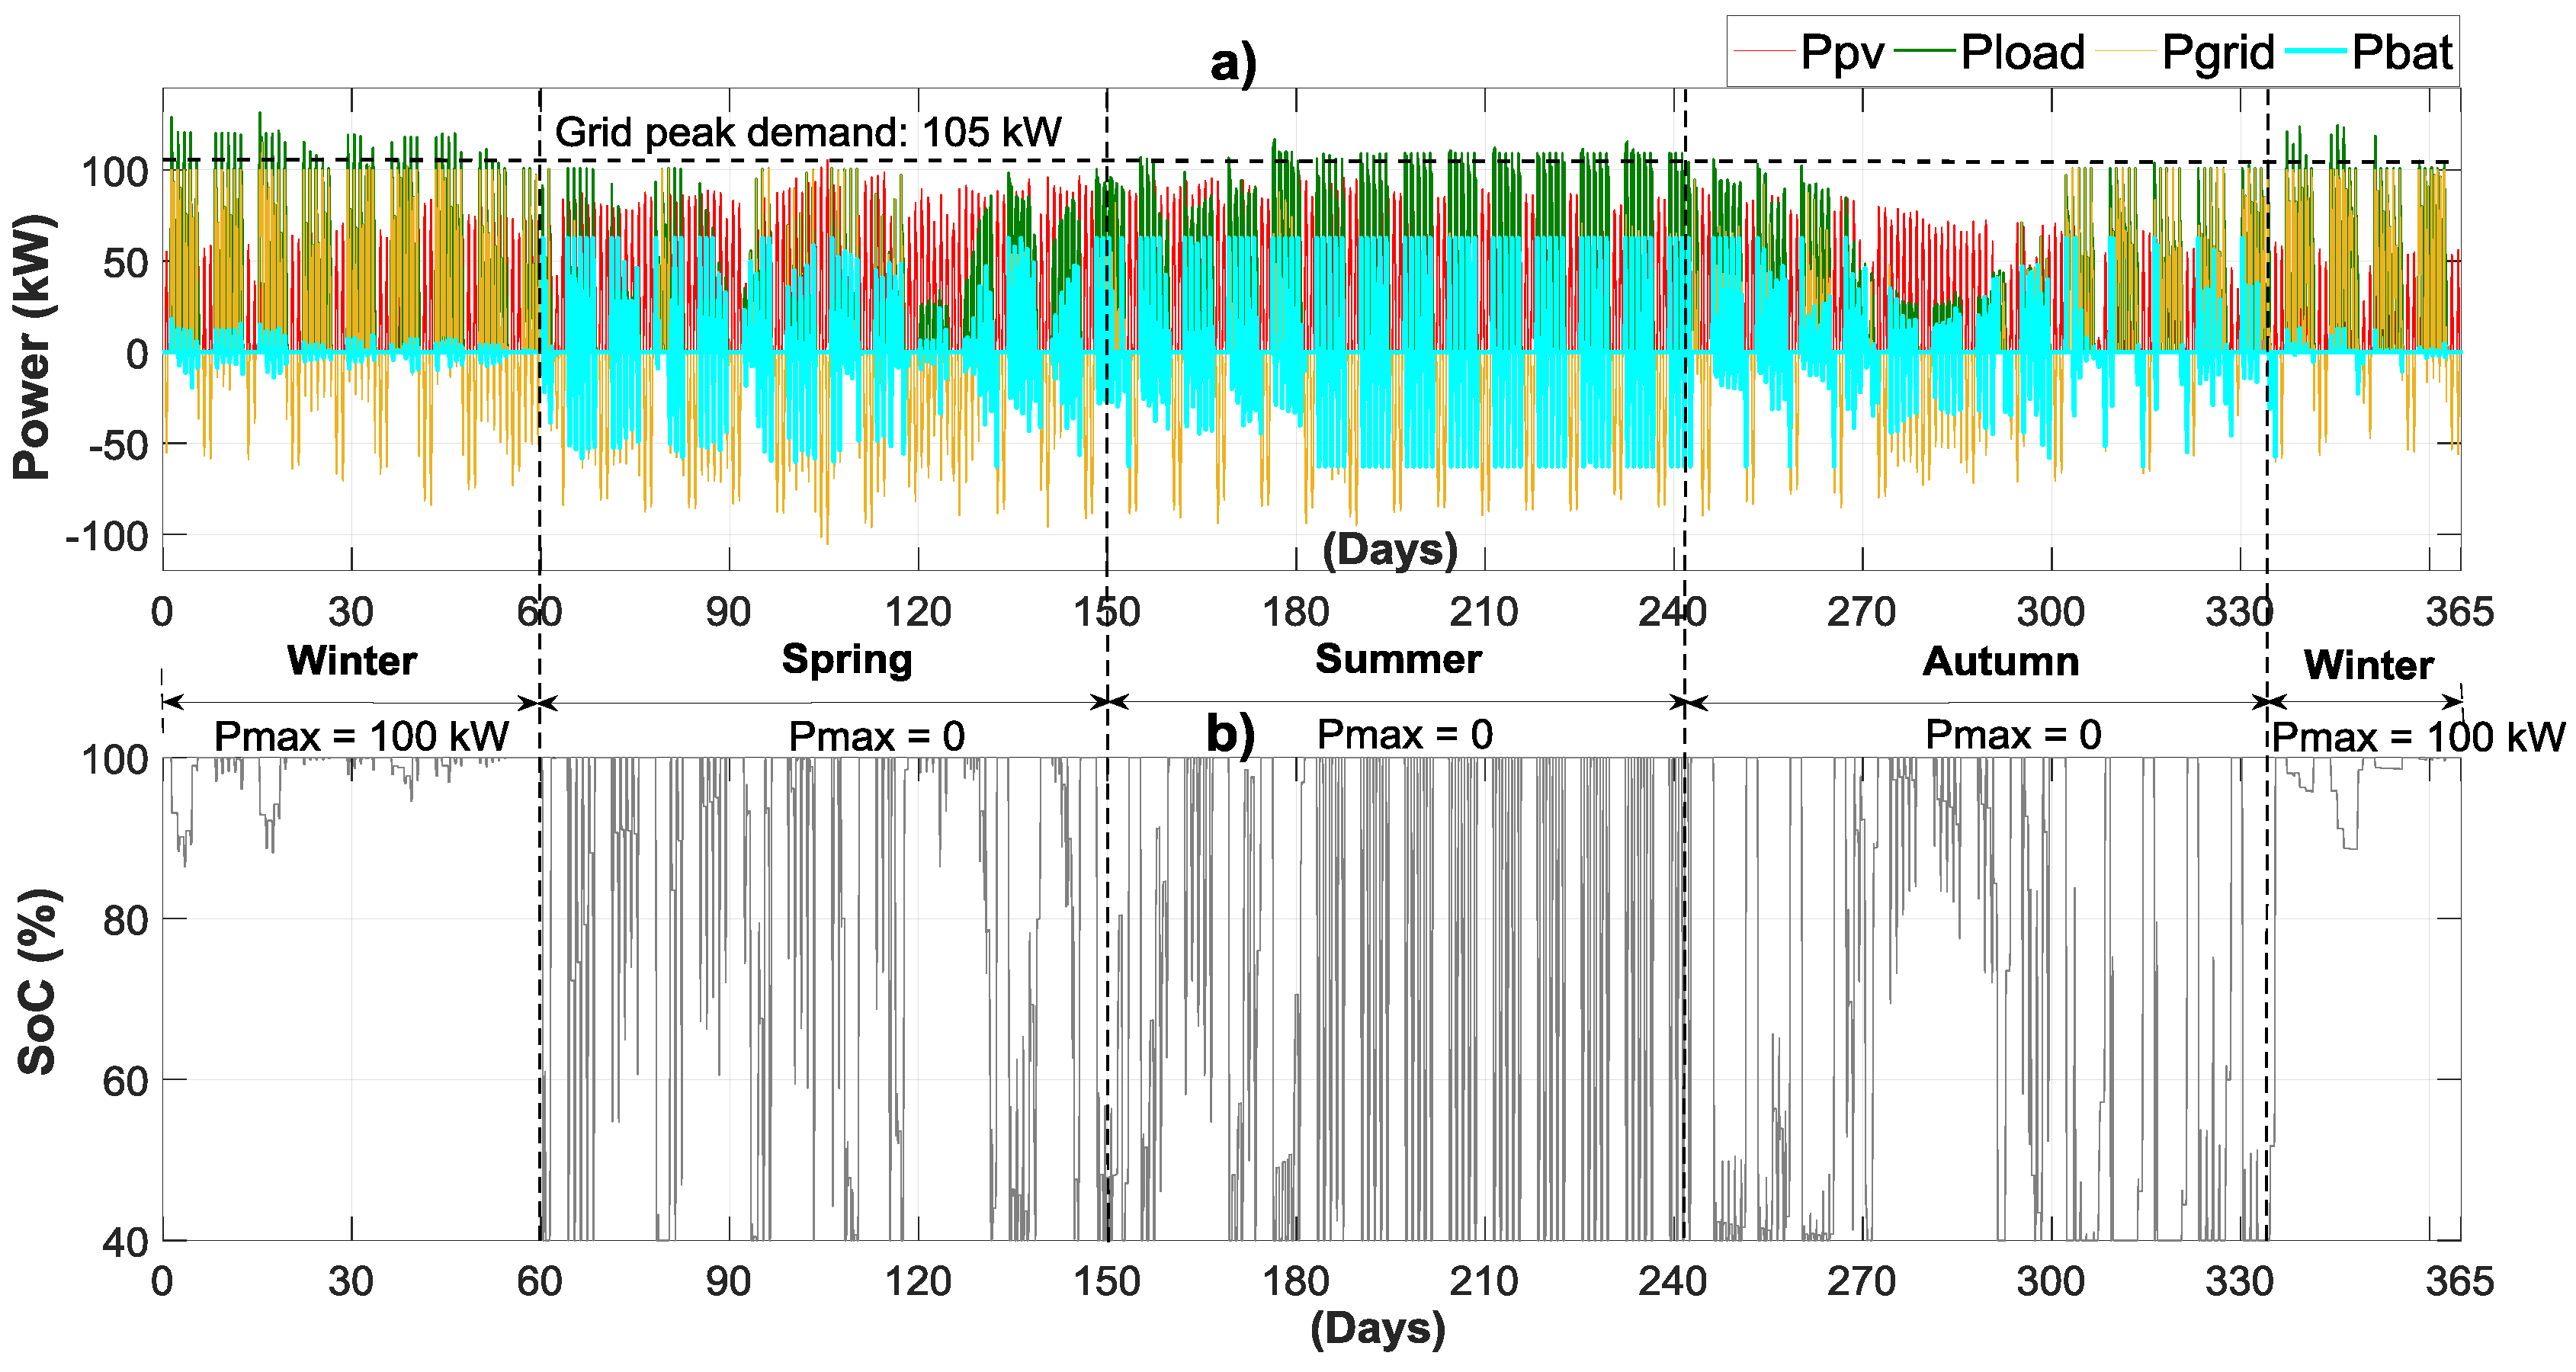
  • Peak shaving: In this strategy, the battery comes into operation only to supply load powers that surpass a predetermined maximum power limit (Pmax). The limit Pmax is applied with the aim of reducing grid power peaks and eventually, the nominal grid connection capacity ( P GCC ) and the associated electricity bill capacity charges, although Pmax and P GCC are not necessarily equivalents.
  • Energy cutback: Here, the main purpose is to reduce electricity imports and, therefore, the electricity bill energy charges. Note that this case is equivalent to the previous strategy with Pmax = 0, allowing the battery to discharge when PPV < PLoad and SoC > SoCmin. If the SoCmax is reached, the PV surplus is fed into the grid. The equations of the BESS and the grid power flows (PGrid) can be seen in Figure 5.
The efficiency of the battery inverter ( η inv ) has been modeled using the widely employed inverse quadratic expression [47]:
η inv = p p + ( k 0 + k 1 · p + k 2 · p 2 )
where k 0 , k 1 and k 2 are characteristic parameters related to the inverter’s self-consumption, ohmic and switching losses, respectively, and p is the ratio between the inverter output Pout and the inverter nominal output power Pn ( p = Pout/Pn). The values used in the simulations, typical of commercial inverters, are: k 0 = 1.024, k 1 = − 1.021 and k 2 = 0.018. These lead to a maximum efficiency of 98.4%. Inverter sizing was done according to the Energy to Power Ratio (E2P) or the discharge time at rated power which depends on each storage technology [12].

2.5. Load Matching and Capacity Factor

With the intention of analyzing the utilization degree of the on-site PV hybrid system related to the local building demand the following load matching indicators are proposed. The self-sufficiency index,   ƺ L , represents the fraction of electrical demand covered by the PV hybrid system [45]. A ƺ L closer or equal one means the local generation matches the local consumption. The self-consumption index,   ƺ G , is defined as the PV-generated electricity that supplies the loads with respect to the total generated electricity [18]. A PV hybrid system operating with ƺ G values closer one means that it does not export large amounts of energy to the grid and the PPV-PLoad correlation is suitable to improve the self-consumption capability.
ƺ L = E PV L + E Bat E Load   ,   E Bat > 0
ƺ G = E PV L + E Bat E PV   ,   E Bat > 0
where E PV L is the PV electricity directly consumed by the load.
To assess the bi-directional usage of the Point of Common Coupling (PCC) (see Figure 4), two different capacity factors are used. The capacity factor of imported electricity ( CF Imp ) and capacity factor of exported electricity ( CF Exp ) measure the magnitude of the imported energy and the exported energy with the grid, respectively, evaluated under a period T and normalized with respect to the nominal grid connection capacity ( P GCC ) between the building and the power grid [48]:
CF Imp = | E Grid | P GCC   ·   T   ,   E Grid > 0
CF Exp = | E Grid | P GCC   ·   T   ,   E Grid < 0

2.6. Economic Assessment

The Levelized Cost of Electricity ( LCOE ) is the most common parameter used to assess the actual cost of generating one basic unit (i.e., 1 kWh) using a particular technology. The calculation is based on the discount of different expenses to the same reference year [26], including initial investment, operation and maintenance costs and system components replacements:
LCOE = I + I + t = 1 T C O & M · ( 1 TR ) ( 1 + γ ) t t = 1 T d t · TR ( 1 + γ ) t t = 1 T E PV ( 1 + γ ) t
where I represents the initial investment of the PV system (PV modules, inverters and Balance of the System (BoS)), I represents the initial investment of the BESS (VRLA batteries and battery inverter), C O & M is the operation and maintenance costs in the tth year, TR is the corporate tax rate, d t represents a depreciation tax shield, γ is the yearly discount rate and E PV is the total energy produced in the tth year. The discount rate is related to a return required from investing in a PV system, which reflects the perception of the investor on the risk of investing in a particular market/country [13]. Risk plays a major role in the value of the discount rate since returns are much less assured when no policy support is assumed, demonstrating how strongly the policies influence the project viability [9]. In this study, the lifetime of the PV hybrid system was assumed to be 30 years, which represents the expected PV generator lifetime (T) currently considered in profitability analyses [13]. The PV yield decrease caused by crystalline silicon solar cells degradation losses was estimated at 0.5% per year [49].
The Net Present Value (NPV) is the most widely used parameter to estimate the profitability of an investment and it is the optimal method to deduce the time at which the initial investment begins to generate economic benefits (payback time). To calculate the NPV, are considered as annual incomes the electricity bill savings that the building achieves using RES, plus the savings obtained by the PV surplus electricity valued in the spot market at pool prices, compared to the electricity costs without RES.
The annual operational electricity bill savings ( ) allow a determination of the effectiveness of the proposed investment:
= 100 [ ( α β ) · 100 α ] ( % )
where α is the billing cost with RES, α   is the billing cost without RES and β represents the revenue earned by PV excess electricity which is rewarded in the spot market. The billing cost calculations include national taxes and electricity meter rental prices.
The annual savings on electricity bill in energy charge ( e ) and in capacity charge ( c ) are obtained comparing the related charges between the case without RES (Case 1) with the cases with RES (Cases 2 and 3), excluding taxes and revenues:
e = 100 [ μ · 100 μ ] ( % )
c = 100 [ φ · 100 φ ] ( % )
where μ is the energy charge with RES, μ is the energy charge without RES, φ is the capacity charge with RES and φ is the capacity charge without RES. Table 4 displays the billing structure in three time-of-use (TOU) electricity prices and billing costs which were obtained from the actual contract with the power utility applicable to low voltage consumers (<1 kV). The billing structure combines energy costs, capacity costs and taxes. For the considered commercial consumer income taxes and capacity are also relevant costs, as they affect billing costs and cash flows (NPV). Considering different electricity market structures, the billing periods and the TOU electricity prices heavily influence DSM strategies decisions when one aims to discharge the battery on specific periods in response to high grid tariffs.

3. Results

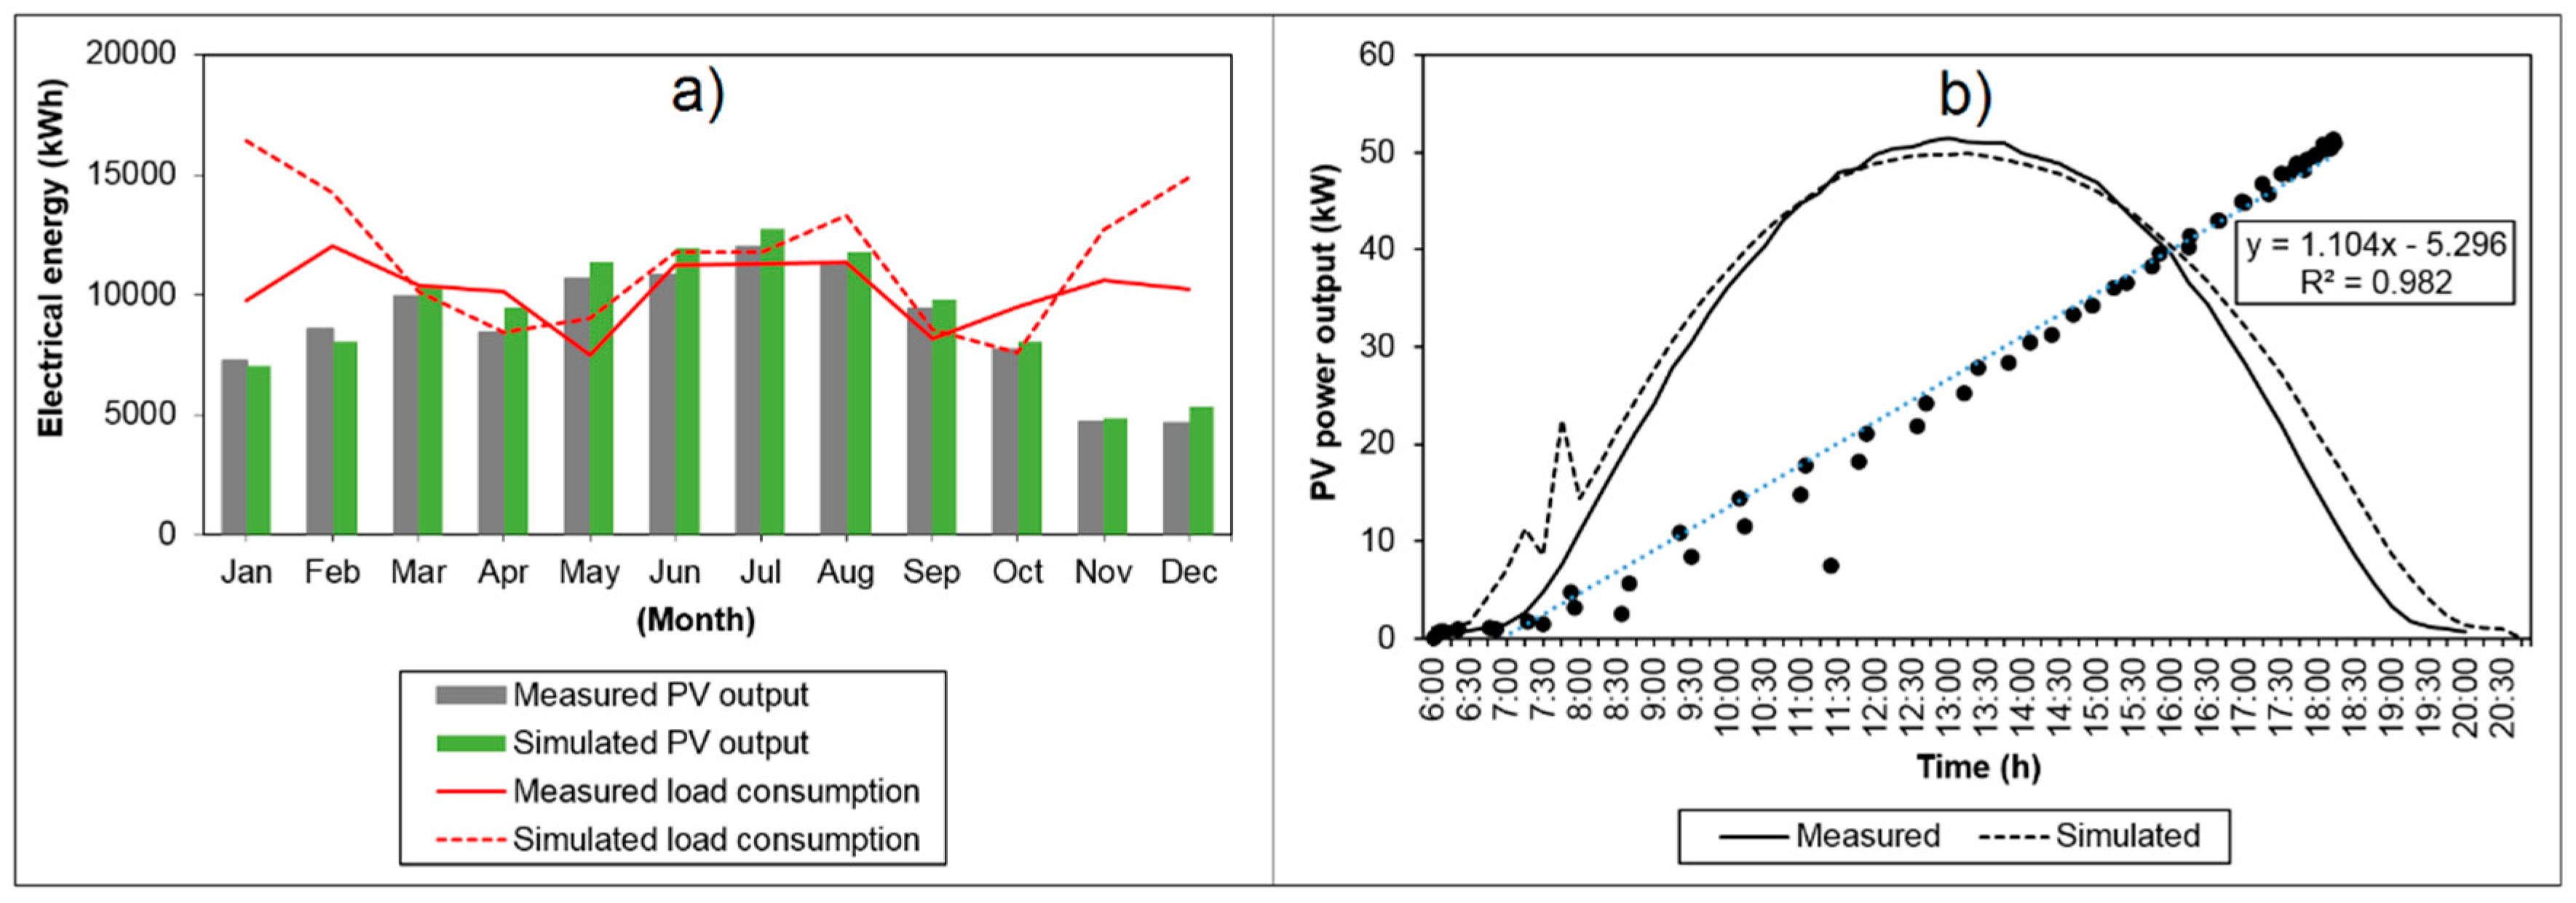
3.1. Building End-Use Loads Consumption and PV Generation

The total annual energy consumption for the entire facility displayed in Table 5 addresses three different simulation models: the first model corresponds to the building with original constructive characteristics equipped with fluorescent bulbs and without solar pergola, thus influencing the HVAC consumption; the second model addresses the building after lighting renovation with LED dimming bulbs, thus reducing the lighting electricity consumption, the indoor heat gains and consequently the cooling demand; the third model represents an optimized case of refurbished building considering LED dimming bulbs and the building integrated solar pergola that further contributes to the reduction of the electrical demand. Space cooling and heating are the main electricity loads based on energy usage, representing 65%, 70% and 68%, respectively, of the models 1, 2 and 3. After lighting renovation, the corresponding electricity demand represents only 11% of the building load, although it is slightly increased (~5%) when the solar pergola is added due to the pergola shading effect (it reduces the daylight illuminance, increasing electric lighting demand). When replacing fluorescent with LED bulbs, the Lighting Power Density (LPD) decreases because the efficiency of the lighting source is higher, allowing savings on lighting demand in the order of 45%. In addition, LED bulbs reduce indoor heat gains inside the building compared to less efficient fluorescent lamps. Consequently, the heating demand is increased by 3% and cooling demand is decreased by 4%; therefore, the total building demand decreases by 9%. With the complementary shading effect on the building envelope performed by the pergola, radiation heating from outside the building is reduced, thus cooling demand decreases 25% and heating load increases by 10%; therefore, the total building energy use is reduced by 15%. Moreover, simulation results performed on typical sunny days showed the solar pergola can reduce solar heat gains by 30%. The validation of the simulations compared with measured data can be found in the Appendix A.
Simulation results of monthly building end-use loads consumption of the refurbished building model provided with LED and dimming lighting and solar pergola are displayed in Figure 6. The monthly PV output is equally showed to compare the PV generation magnitude with the load categories. For example, during the cooler months (May to September) the PV electricity is able to supply the cooling demand. Nevertheless, the heating demand cannot be met with solar energy. In this assumption, it realizes the need of storing PV excess for later use, according to a specific strategy, beneficial to optimize the value of PV generation.
Figure 7 displays daily results of electricity flows with PV system only. The PV generation plays an important role in flattening the building load shape, however, it does not effectively mitigate potential voltage rise associated with reverse power flows due to high export power levels flowing at the point of common coupling. In addition, the building power demand cannot be highly reduced by virtue of the load peaks that the PV system is not able to supply. This clearly suggests the interest of exploring the Demand Side Management possibilities provided by an intelligent use of a BESS. Several combinations of DSM strategies have been simulated with the PV hybrid system, in what follows the strategy leading to the decrease of both, imported energy and power demand from the grid.

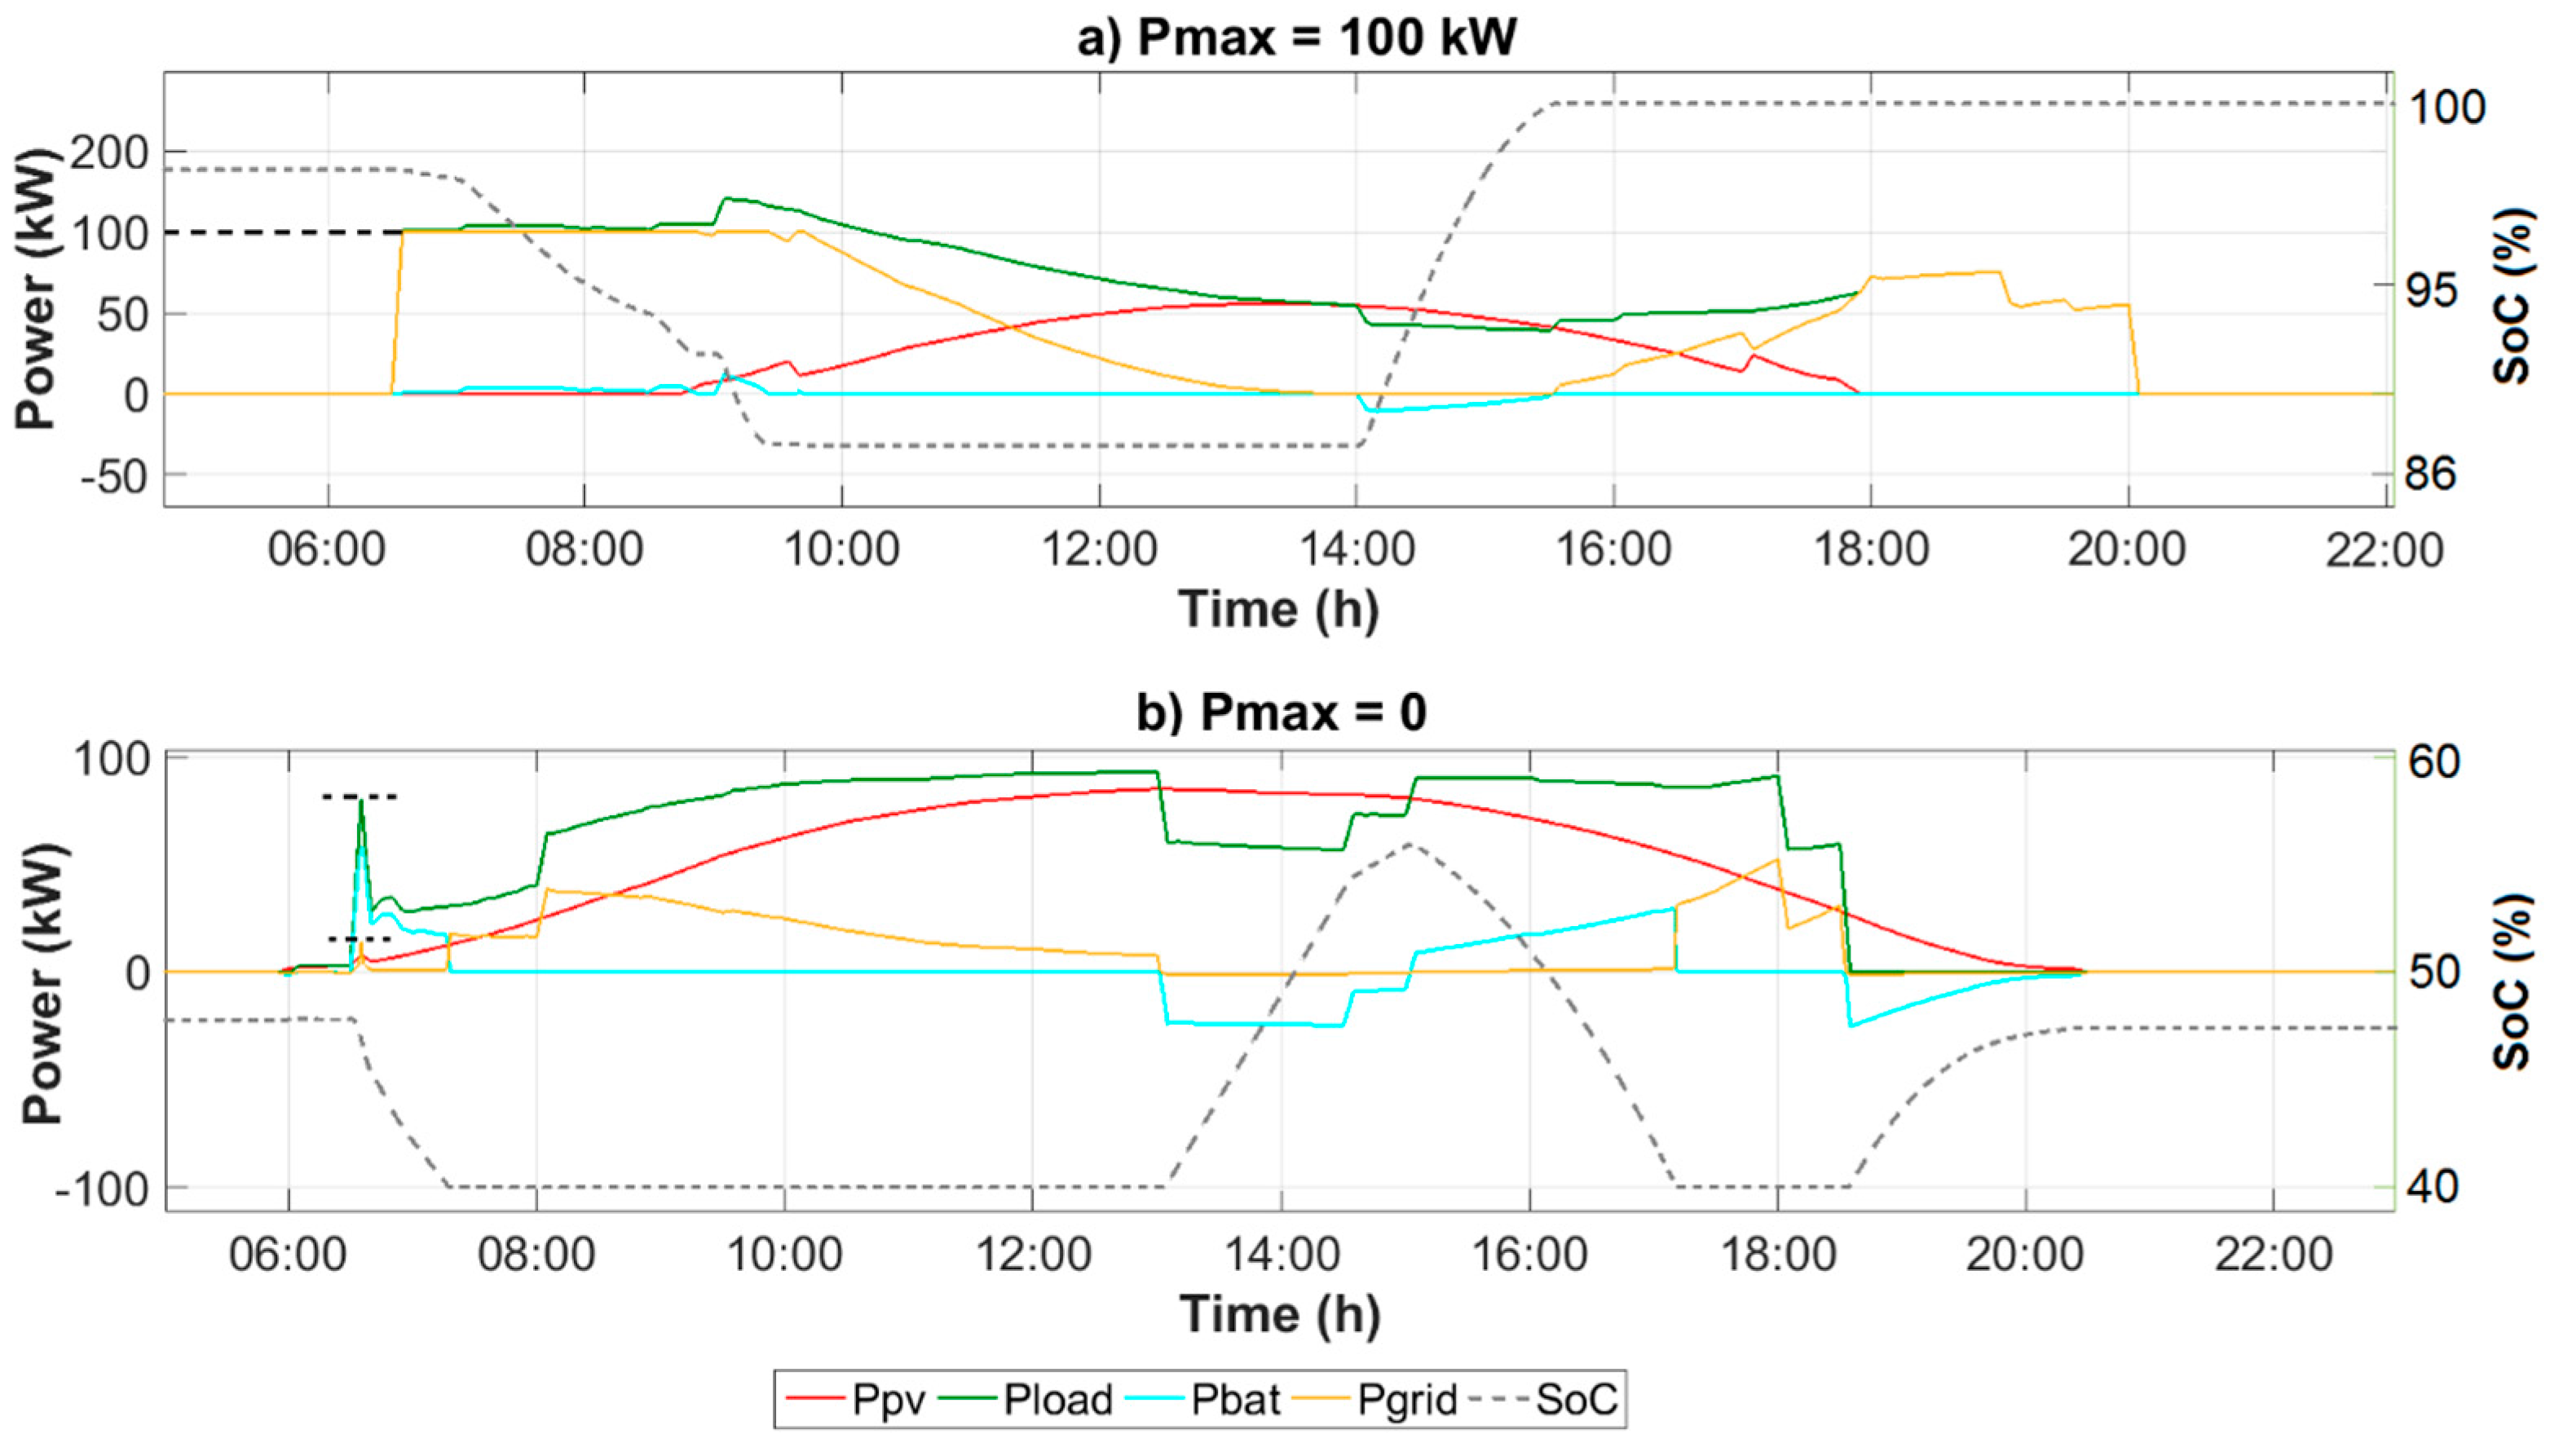
3.2. Demand-side Management with BESS

A frequency distribution of the highest grid power peaks was precisely performed to analyze the P GCC reduction with PV hybrid system in different scenarios of Pmax, according to Figure 8. Taking the case of Pmax = 100 kW, it can be noted that, for grid power peaks up to 100 kW the absolute frequency is around 6000 (96 h of grid power request). For grid power peaks higher than 100 kW the BESS comes into operation. In the case of 105 kW peaks, the absolute frequency decreases to around 100 (only 1.5 h of grid power request), as can be seen by the green bars, which would allow to re-size a reduced grid connection capacity ( P GCC = 105 kW). Compared to the other cases, the contracted power could be reduced by 13%, providing reductions in electricity bill capacity charges (see Section 3.4), although, according to Spanish DG regulations, P GCC must be equal or higher than the PV generator installed capacity (PNomPV). In fact, the previous results could be useful for future DG regulations where the P GCC could be lower than PNomPV, as is the case in other countries [4].
In the winter season (from 1 December to 28 February), PV output is frequently far lower and the load consumption presents the highest annual peaks due to the demand for heated space in the early morning. In this way, the battery discharge was designed to operate following the peak shaving DSM strategy from 6 a.m. with Pmax = 100 kW. According to Figure 9, PPV is frequently higher than PLoad during lunch times by virtue of the decrease in both, HVAC load and plug loads-lighting operation, providing the means for the battery charging process. According to Figure 9a, on a typical winter day the demand for heated space starts at 6:30 a.m. and PGrid is shaved at the limit of Pmax, reducing grid power peaks.
In the other seasons, simulation analyses showed that for Pmax = 100 kW the battery use is quite low due to the load demand being generally lower than 100 kW. Thus, the energy cutback DSM strategy was applied and the BESS was designed to discharge during load operation periods (from 6 a.m. to 8 p.m.). As an example of this approach, Figure 9b shows that on a typical summer day the imported power from the grid is fairly reduced; hence, the daily demand that is covered by the PV hybrid system is fairly high (82%). At 1 p.m. the occupancy starts to decrease, reducing the cooling demand and the total consumption from 90 kW to 60 kW. The battery operation reduces PGrid at 6:30 a.m. from 80 kW to 12 kW. At about 1 p.m. the battery is charged with solar energy achieving a maximum SoC of 56%. From 3 p.m. to 5:10 p.m. battery electricity reduces PGrid to zero when there is an increase of the load consumption, reducing the battery SoC to 40%.
Daily electricity flows, together with the designed Pmax levels, are shown in Figure 10a. From Spring to Autumn, the battery use increases as a result of the battery discharging process set to complement the PV generation (energy cutback: Pmax = 0). In the summer and spring seasons, the PV generation and the battery discharge increase due to greater solar activity and, from the 270th to the 300th day of the year, PPV is regularly higher than PLoad, decreasing battery use.
Figure 11 summarizes the monthly energy balances for the analyzed cases. In annual terms the results are: Case 1: EGrid (imported) = 183 MWh; Case 2: EGrid (imported) = 86.5 MWh, EGrid (exported) = 94.8 MWh; and Case 3: EGrid (imported) = 68.1 MWh, EGrid (exported) = 76.4 MWh. As can be seen, the PV energy directly consumed by the loads is quite high in this application (annual E PV L   = 96.4 MWh). The annual reduction of imported energy, compared to the Case 1 (without solar system), is well pronounced: 53% in Case 2 (solar pergola effect over the load consumption and PV-load natural correlation) and around 63% in Case 3 due to the additional influence of the energy storage. In addition, the BESS reduces the exported energy by 20% when compared to Case 2.

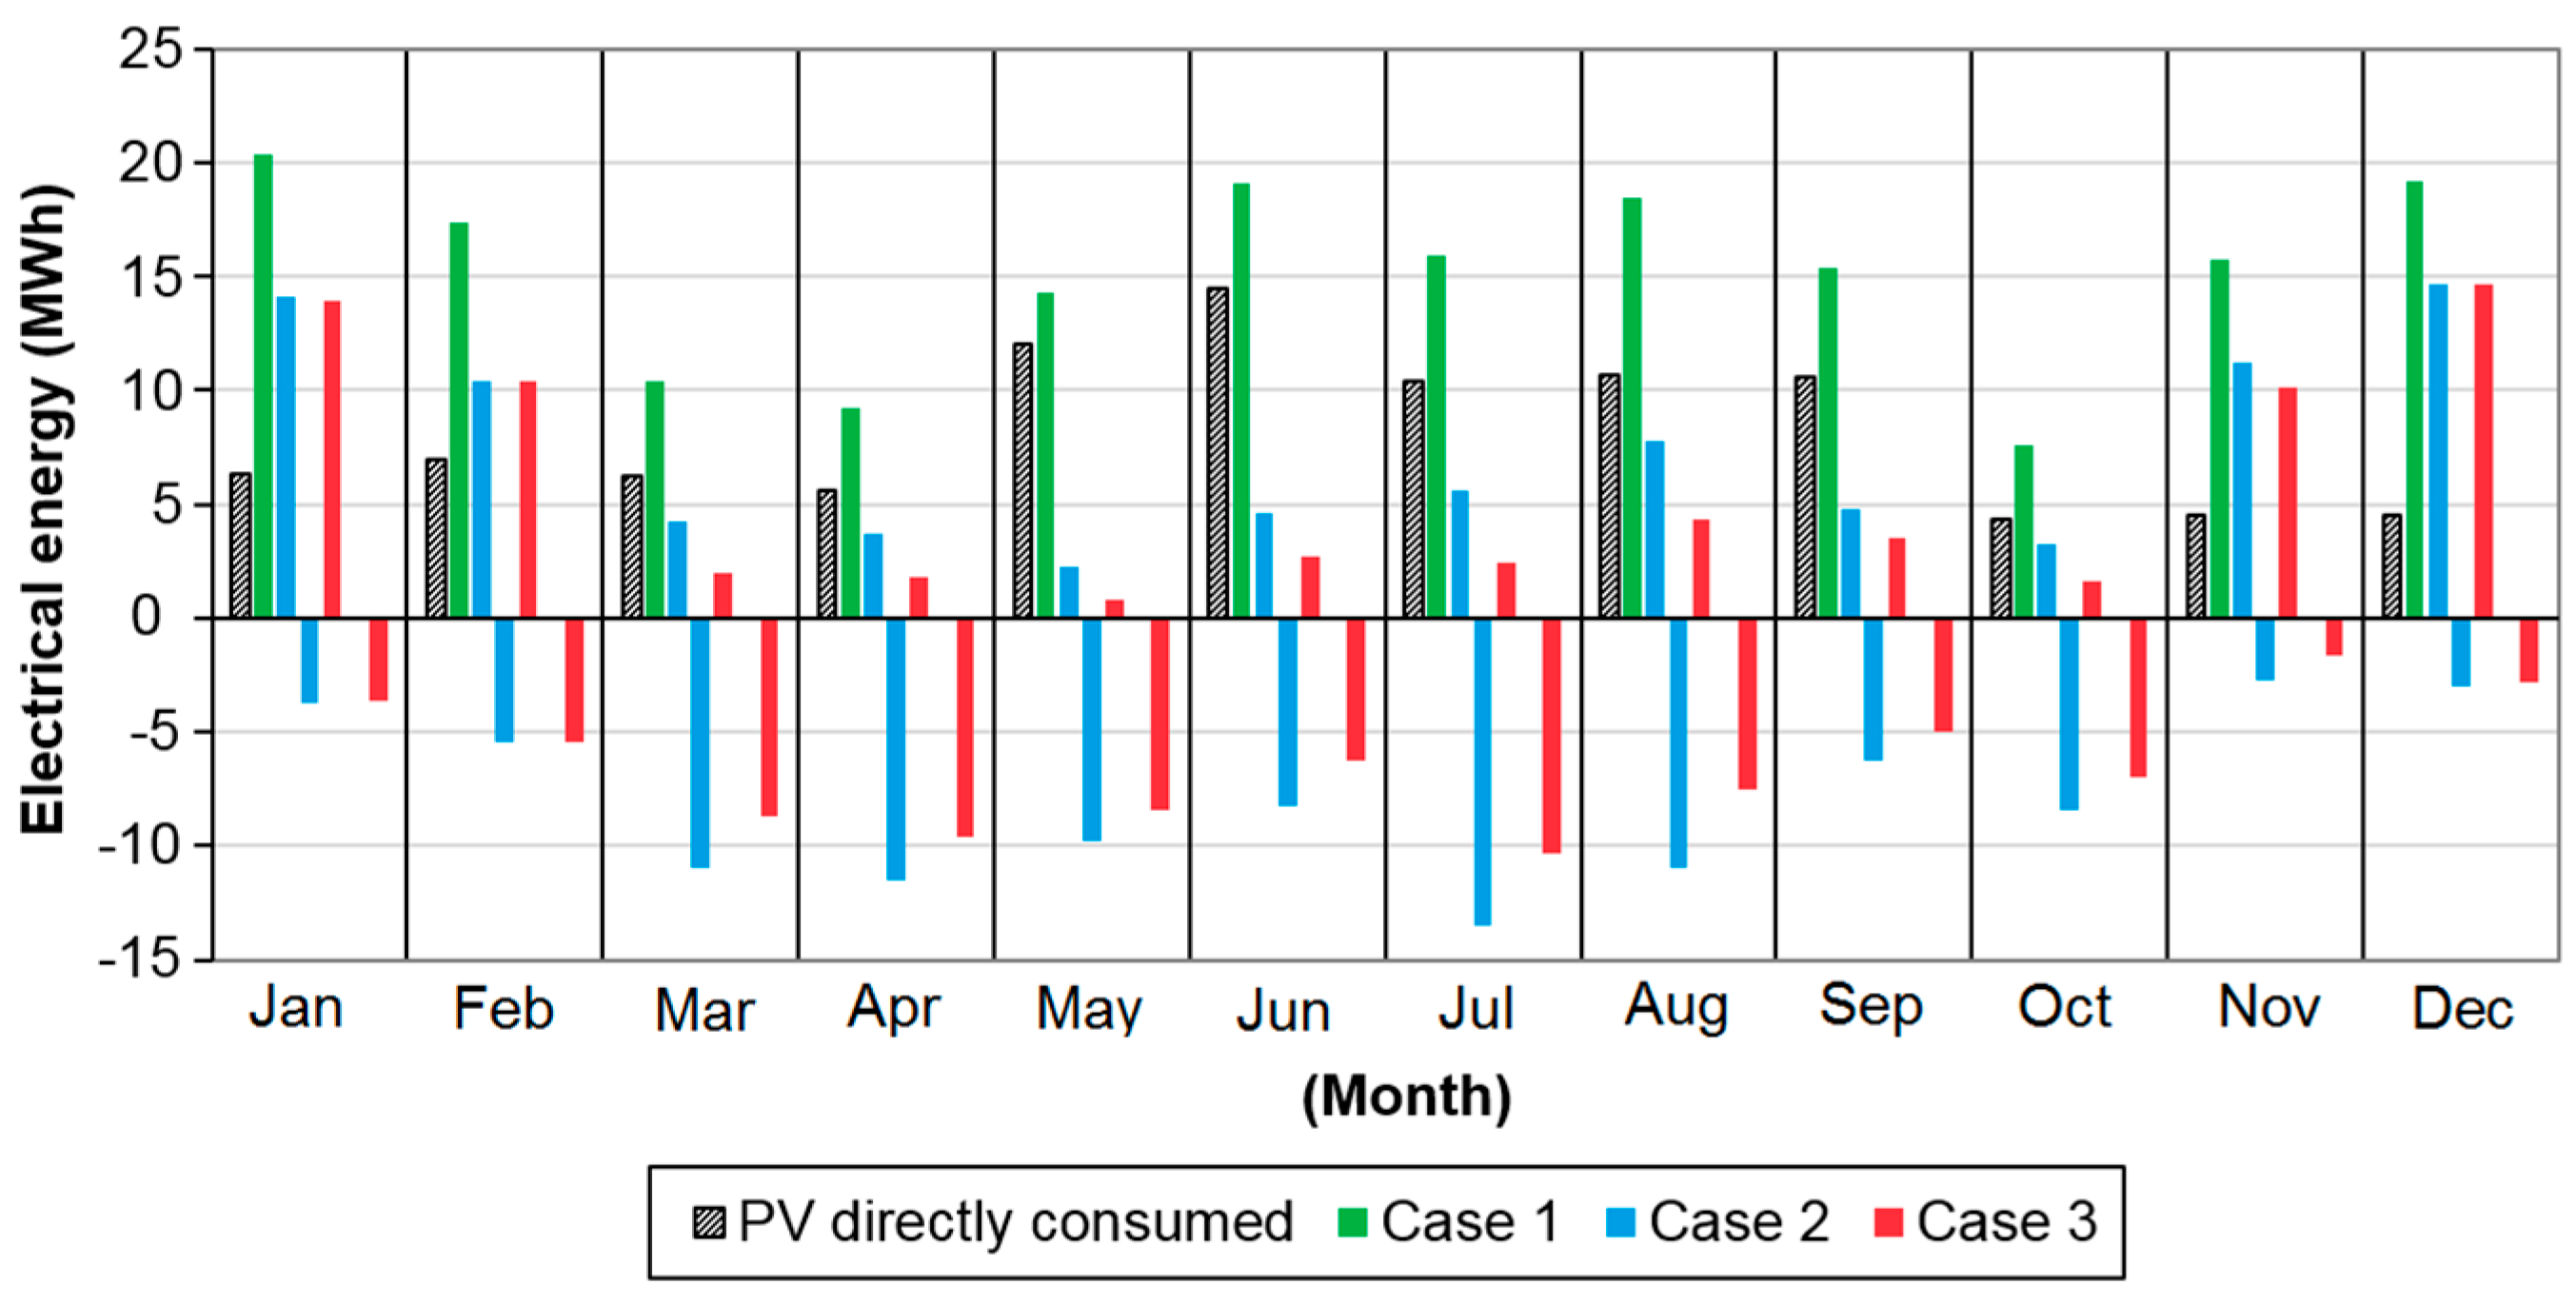
3.3. Load Matching and Grid Interaction

When using BESS the question arises of the optimal size (capacity) for a particular storage management strategy. To investigate the effect of BESS size in the building’s electrical performance, Figure 12 illustrates self-consumption ( ƺ G ) and self-sufficiency ( ƺ L ) for different battery sizes in Case 3. As expected, the higher the battery capacity is, the higher the load matching rates are due to the additional storage availability which supplies the loads with PV electricity. Furthermore, the increase in battery use by applying Pmax = 0 in the spring, summer and autumn seasons (see Figure 10) potentially enhances load matching rates. It is demonstrated that a battery system sized higher than 0.5 days of autonomy does not increase the load matching capability significantly (see the saturation tendency of the curves). In particular, by increasing battery capacity from 0.5 days of autonomy to one day of autonomy (equivalent to 500 kWh), ƺ G and ƺ L only grow by 4%.
Figure 13 displays the annual development of the capacity factor of imported electricity ( CF Imp ) and exported electricity ( CF Exp ) in the different scenarios. A grid connection capacity ( P GCC ) corresponding to PLoad,Max was assigned in the calculations, and in Case 3 the analyses were performed with the optimized value ( P GCC = 105 kW). In the periods the PV production grows, especially from April to September, the differences of CF Imp are well pronounced between Case 1 and the Cases 2–3. CF Imp is generally lower in Case 3 due to the fact that PGrid is mitigated by PV-BESS. The seasonal variations are more pronounced in the winter months when the heating demand increases electricity consumption and the PV generation potential is lower than the remainder of the year ( CF Imp is around 22% in Case 1 and around 15% in the other cases). In cooler periods (i.e., from May to September) CF Imp is substantially lower in Cases 2 and 3 (ranges of 2.5–9% and 1–5.5%, respectively), and also relatively low are the values in intermediate months (March, April and October). The annual daily mean equivalent use of the exported electricity ( CF Exp ) ranges from 3% to 15% in Case 2 and from 2% to 13% in Case 3. The index is higher with the increase of solar resource (i.e., from March to October) and is generally inferior in Case 3 due to the influence of the BESS which reduces the export power levels flowing at the PCC.
The investigated indexes are summarized in Table 6. The yearly results of load matching indexes show that ƺ G and ƺ L are 50.4% and 52.7%, respectively, in Case 2 and the battery effect (Case 3) technically improves electrical matching by 10%. This improvement is one of the targets of the grid load control, which also explains the drop in capacity factor. The high direct self-consumption rates and the effect of the solar pergola over the cooling load in Case 2 decreases CF Imp by 10% in relation to Case 1, bringing significant reduction on the degree of grid power exchanges. The effect of the battery system reduces CF Imp further (12%), as well as reducing CF Exp by 2%. It is important to mention that the reduction of P GCC obtained in Case 3 implies an increasing of the energy exchanges (consumption from or supply to the grid) over the designed P GCC .

3.4. Photovoltaic Hybrid System Economic Analysis

The investment cost of the PV system considered is 1.2 €/Wp, that includes m-Si modules, PV inverter and BoS costs, representative of the current market [50]. When considering the BESS, the following costs are included: 0.3 €/Wp for the battery inverter and 250 €/kWh for VRLA batteries [51]. The yearly operational savings on bills shown in Table 7, obviously depend on the amount of electricity imports reduced with the PV hybrid system and the savings obtained by the PV surplus electricity valued at pool prices. In Case 2, the annual operational savings are 42%, mainly influenced by the PV generation that supplies directly the load. With electrical storage, the savings increase to 48%, and further the yearly savings on bills in energy charge ( e ) and in capacity charge ( c ) are, respectively, 60% and 12%. When looking at the table, it is clear that e and c are 9% higher in Case 3. However, the amount of PV surplus electricity is reduced with the BESS, demonstrating an annual revenue ( β ) lower than the Case 2.
Figure 14 displays the annual final retail electricity prices for commercial consumers in Spain, which includes all electricity price components in the different TOU pricing periods [52]. In Spain, the electricity tariff structure is complex: in addition to power and energy charges, it includes a set of taxes and levies (i.e., network tariffs, policy charges, renewable support charges and tariff deficit annuities). In other countries, especially in Europe, taxes may also significantly influence the final electricity costs [53]. Depending on the country, electricity pricing may include marginal costs, such as tiered rates (rates which increase with amount of purchased electricity), fixed charges and time-of-use pricing rates.
The weighted average of retail electricity prices is compared with the Levelized Cost of Electricity ( LCOE ) to access the grid parity proximity. Under the current financial conditions in Spain, the electricity generation costs is 0.05 €/kWh in Case 2, matching with the retail electricity prices by a margin of 3%. However, in the case with BESS the levelized cost of producing solar electricity is 0.115 €/kWh, still far to be competitive against retail electricity tariffs. In this case, the electricity generation costs should be reduced by 54% in order to achieve grid parity.

3.4.1. Economic Assessment without BESS

Variations on the country-specific risk rates and interest rates (when financed through a corporate loan), reflects the importance of accessing long-term and low-cost financing for the economic viability of the investment. Whereas the discount rate is a variable difficult to predict, the PV system costs have shown an impressive decrease over the last decade and are expected to continue furthermore in the future [50]. This suggests the convenience to perform simulations to assess the levelized cost of electricity ( LCOE ) and the Net Present Value (NPV) considering discount rates ( γ ) ranging from 1% to 10% and PV costs ranging between 1 €/Wp to 2 €/Wp, assuming an increase in the annual mean electricity tariff of 5%. As presented in Figure 15, the analysis reports that low PV system prices combined with low γ can result in a reduction of the generation costs and in the investment return period. The LCOE increases with higher discount rates since the total costs have to be divided by a steady amount of generated electricity. The PV-generated electricity costs range from 0.03 €/kWh to 0.13 €/kWh. Discount rates lower than 5% would be required under the current financial scenarios for the system to be profitable, but adopting an optimistic scenario (i.e., 1.1 €/Wp) discount rates lower than 6.4% are needed.
The higher is the PV surplus rewarded at pool prices when no energy storage is considered, the higher the yearly savings will be, leading to shorter return of the PV investment. In contrast, the inverters replacement which may require a significant amount of money, can delay the payback time. According to Figure 15b, the payback time scenarios range from 10 to 30 years. Considering the same previous financial conditions (PV costs = 1.2 €/Wp and γ = 5%), the payback time is reached in 14 years. The relative low discount rate applied in the country reflects low local inflation rates, which compensate investors, and thus lower return expectations. For the scenarios of highest PV investment costs and discount rates (yellow plotted area), the payback time approaches or is above the PV generator lifetime, and the investment does not become profitable.

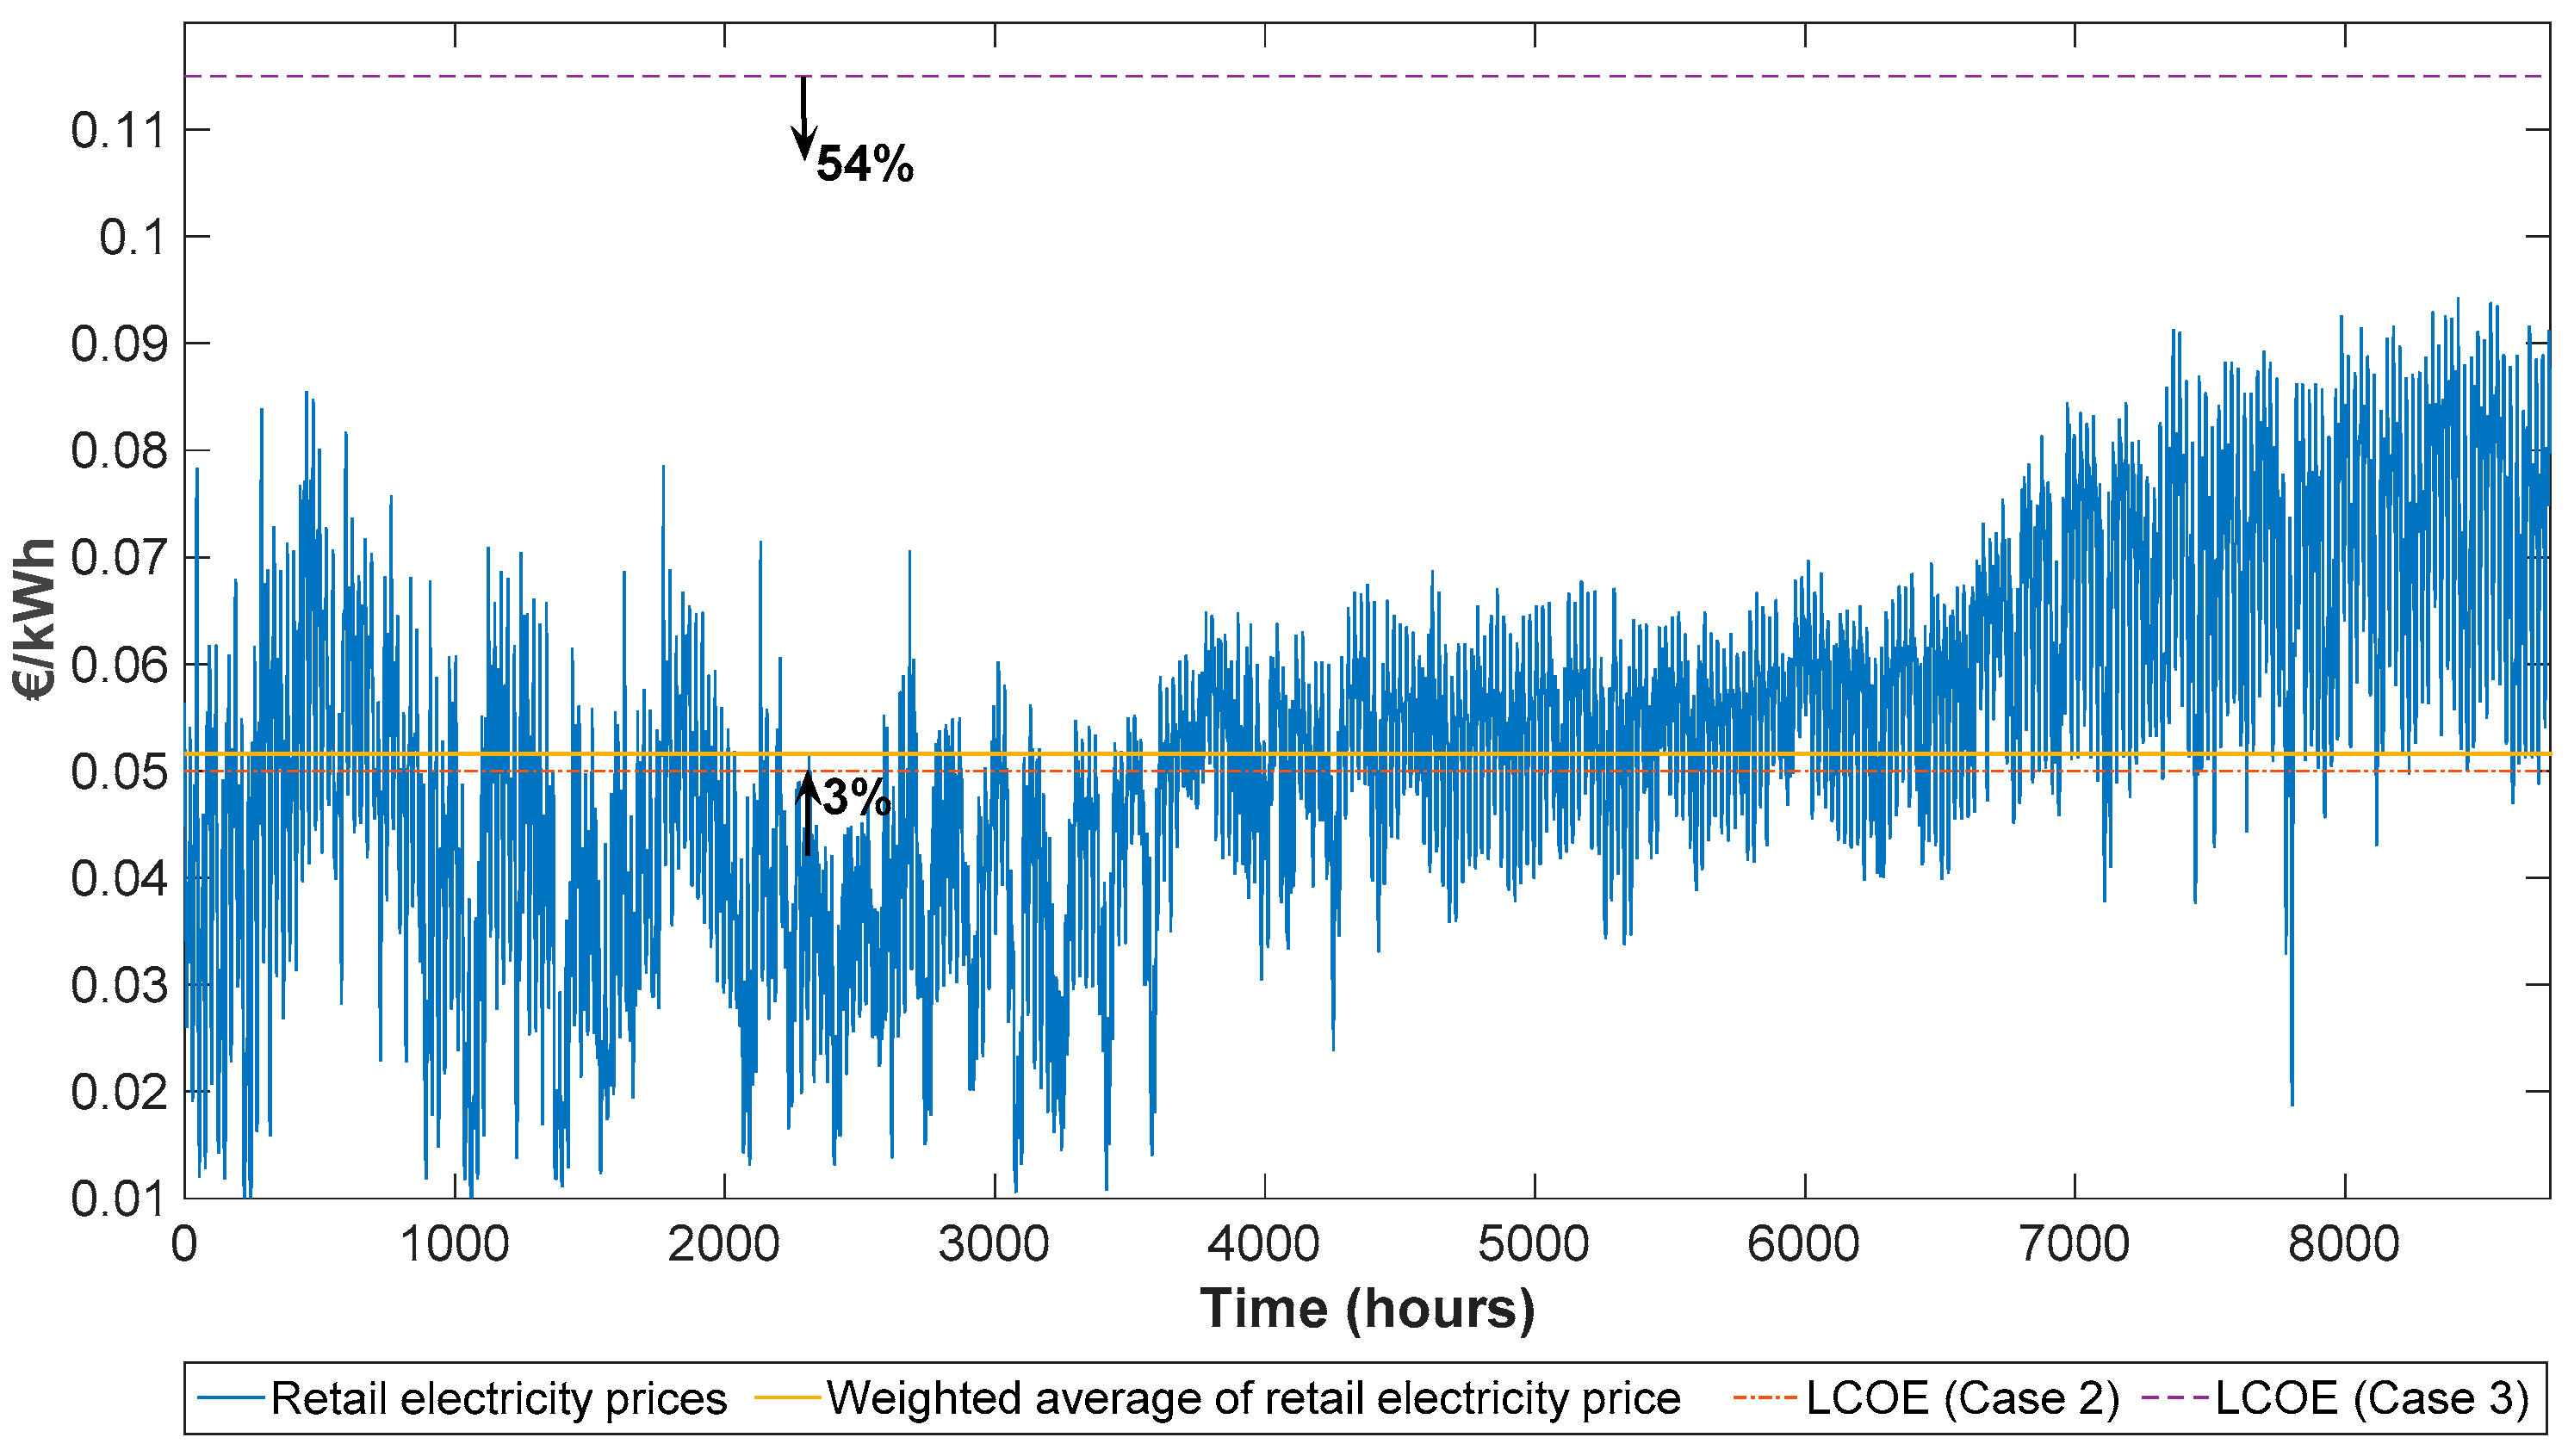
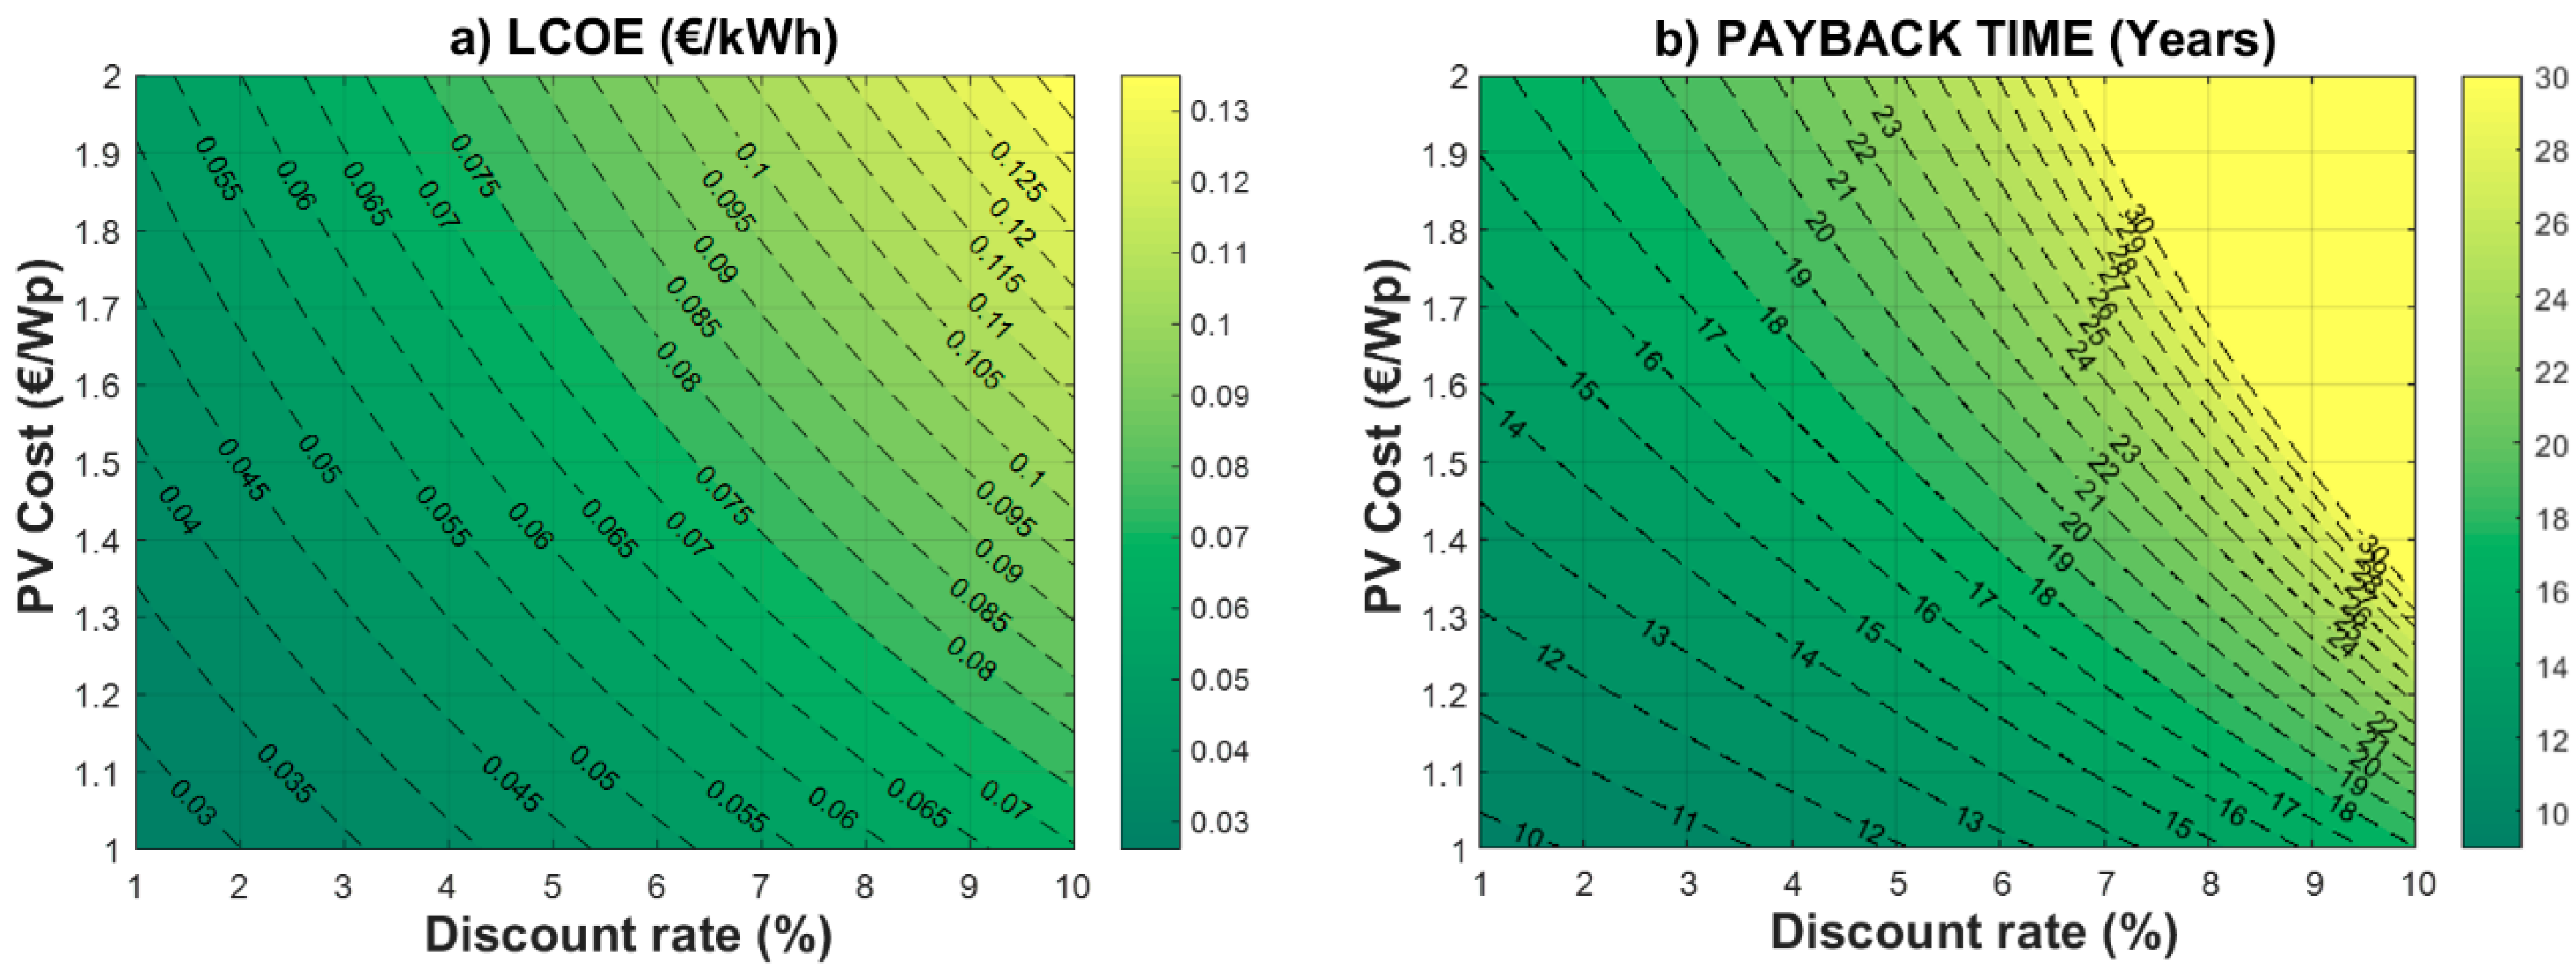
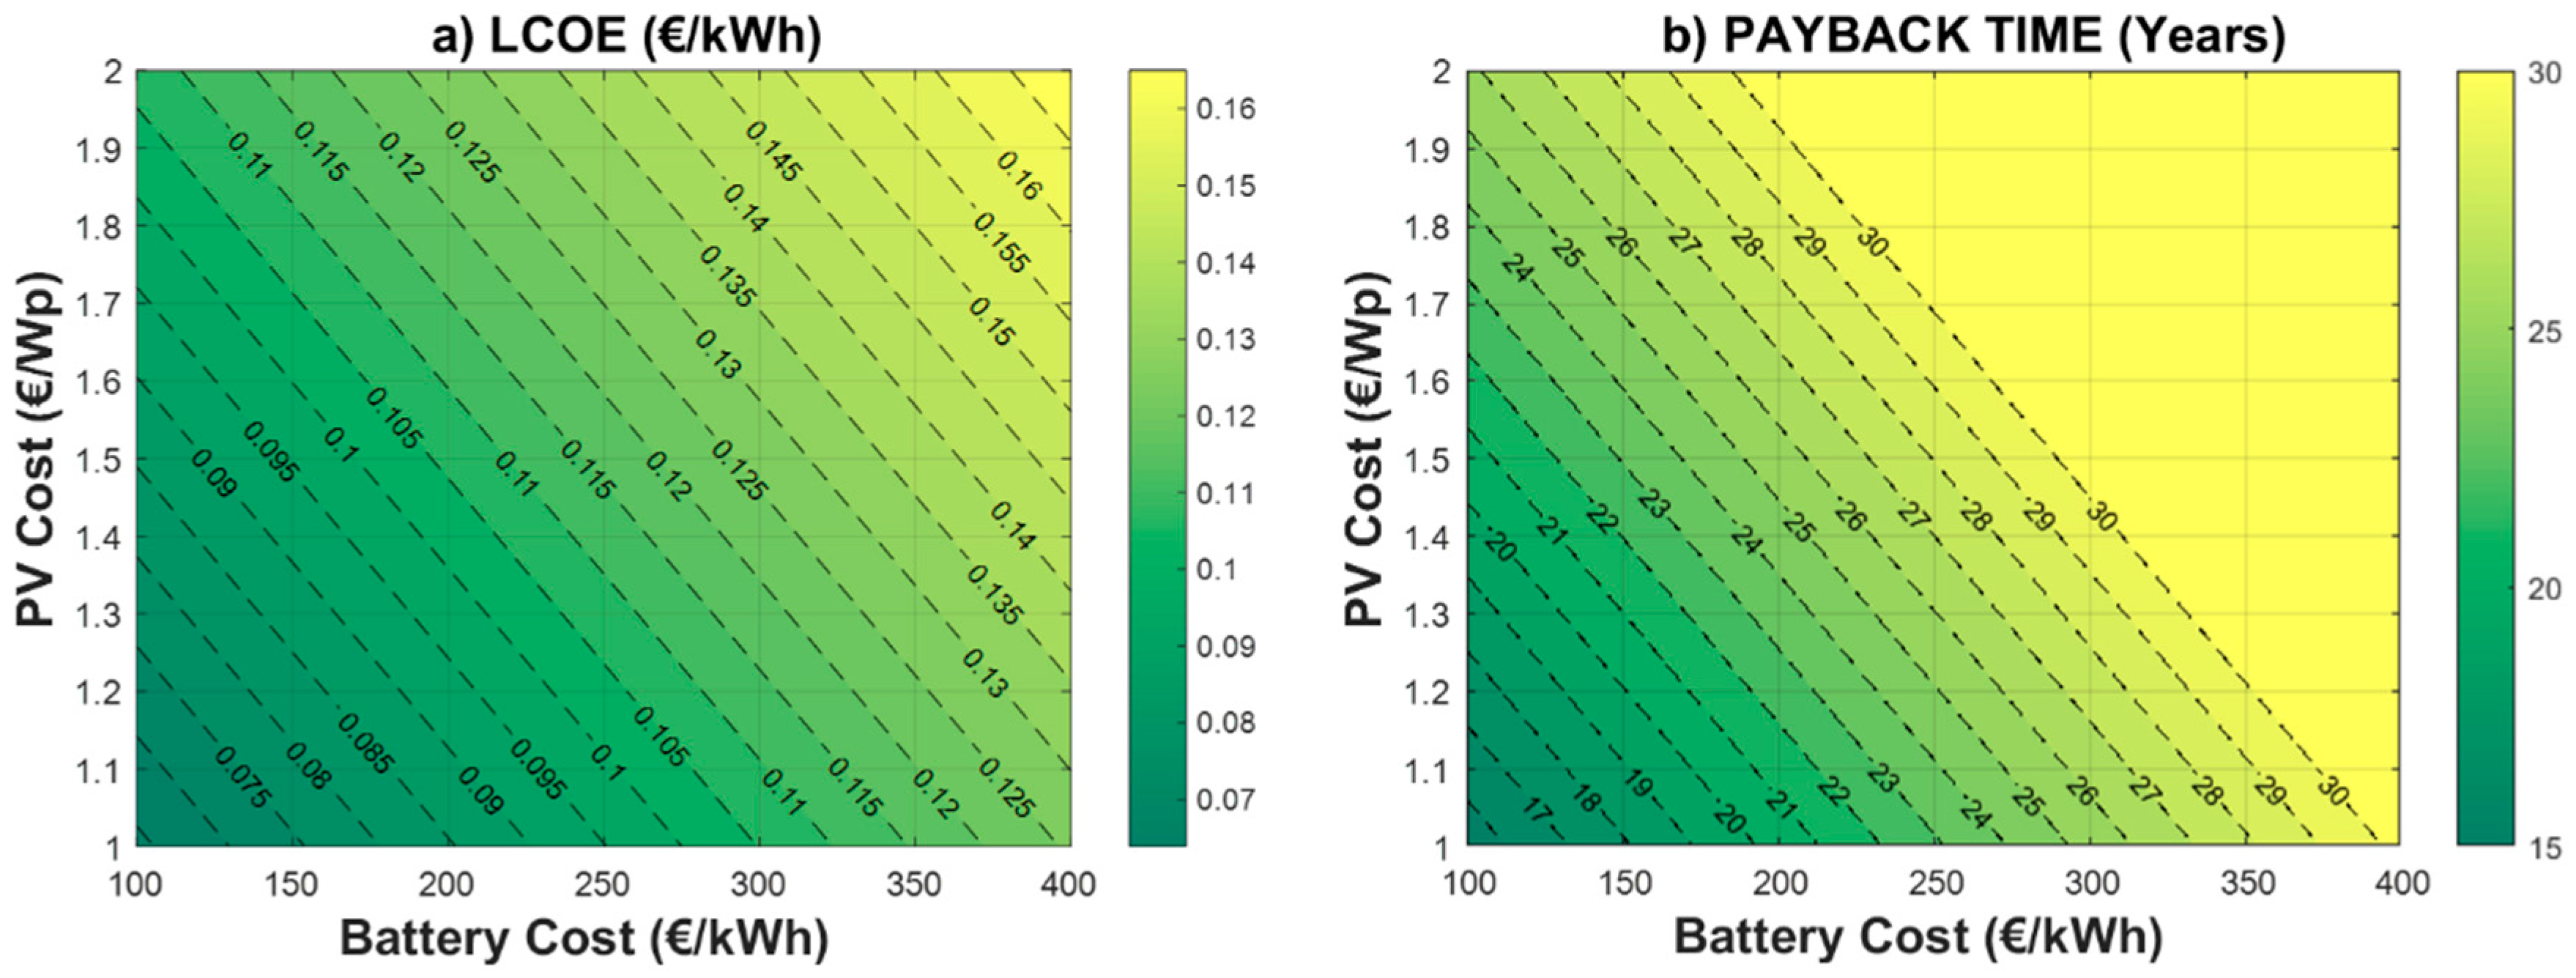
3.4.2. Economic Assessment with BESS

Analogous to PV costs, the cost of energy batteries are in constant reduction [12]. Thus, to analyze the system economically with BESS, it was performed battery costs ranging from 100 €/kWh to 400 €/kWh (Figure 16). In this case, the PV-generated electricity costs are higher than the case without BESS (ranges of 0.07 €/kWh–0.16 €/kWh). According to Figure 14, grid parity is not reached with BESS under current financial conditions in Spain, suggesting that a decrease in battery costs would be required for the investment to be profitable. The battery cost should be lower than 100 €/kWh to achieve grid parity, which is far from current prices in the country. In turn, the payback time can only be achieved in the long term (28 years). Figure 16b shows the payback time perspective with BESS which is extended compared to the case without BESS (ranging from 15 to 30 years). The main reason for that is the high initial investment and the short term battery replacement, due to the battery cycling that is relatively high, where typically have larger impact on the battery lifetime and degradation [27]. For battery costs above 400 €/kWh the payback approaches or is above the PV generator lifetime not being economic.

4. Conclusions

In this paper, energy refurbishment alternatives of a real office building have been analyzed through multi-objective simulations. The methodology, proposed for the commercial sector, can be applied when one aims to reduce electricity consumption, especially for lighting and HVAC needs, and to manage the generation and storage energy systems taking into account technical-economic aspects. The proposal of replacing the original lighting system with LED dimming control and incorporating a building integrated PV pergola demonstrated a remarked reduction of the lighting and cooling energy use by 45% and 25%, respectively, mainly due to the decreasing of lighting power density and solar heat gains. The work proposed an innovative Demand Side Management approach with the aim of increasing electricity bill savings, improving load matching and optimizing the grid connection interface. In the analyzed scenarios, the yearly self-consumption ( ƺ G ) ranged from 50% to 60% and the yearly self-sufficiency ( ƺ L ) ranged from 53% to 63%, being the increase with BESS compared to the case without BESS of 10%. The increase of load matching rates indicates that an excess of on-site renewable electricity is effectively stored and utilized by the system. Apart from that, compared with Case 1 (without RES), yearly results showed that the PV hybrid system can reduce the equivalent use of the grid connection by 12%, results that should be taken into account from the grid interface (point of common coupling) sizing point of view. Similarly, the use of BESS was able to reduce active power injection to the grid (20% in annual electrical energy terms).
The optimized case with BESS has proved to be efficient in reducing the imported electricity from the grid significantly (63% yearly reduction potential), equivalent to 60% savings in energy charges on annual bills. In addition, the proposed control strategy was able to reduce grid demand peaks, decreasing P GCC by 13% and providing 12% savings in capacity charges on annual bills. This information may be useful for building owners and grid designers, as well as for future DG regulations where P GCC could be lower than the installed PV capacity.
The paper has demonstrated the importance of electricity costs, macroeconomic parameters (especially interest rates), PV and BESS costs for a proper assessment of the economic benefits. Under current technical market conditions (especially those related to BESS) the PV hybrid investment has not yet reached the profitability level of “grid parity” definition, with payback times slightly smaller than the assumed PV hybrid system lifetime. Although the study has shown the economy presents better perspectives in the case with only PV, it has verified the PV being competitive against retail electricity prices and the payback time is decreased by a half, as a result of the high PPV-PLoad correlation and the fact that the savings are obtained from lower initial investment. Notwithstanding that, annual electricity bill savings are a significant 48% with BESS, but only 6% higher than the case with only PV. Again, this result means that the electrical storage is not yet significantly profitable in the considered office applications, which is consistent with results obtained in previous studies [24,26,54]. In different cases, project improvements with PV and BESS will depend of the regulatory markets, climatic conditions, building characteristics and consumer needs, all of which impact the PV hybrid system profitability, especially when financial incentives for RES are proposed by the authorities. With the intention of improving the PV hybrid systems economy and providing a positive impact on the grid parity proximity in Spain, regulation changes are still required to support the PV self-consumption market, allowing the profitableness of battery storage application.

Acknowledgments

Giovani Almeida Dávi wishes to acknowledge the Brazilian National Research Council (CNPQ) for financial support to carry out the studies which led to this article. Juan Solano gratefully acknowledges the financial support by the National Secretary of Higher Education, Science, Technology and Innovation of Ecuador (SENESCYT). The authors acknowledge the support of the project “DEMS: Sistema distribuido de gestión de energía en redes eléctricas inteligentes” (TEC2015-66126-R), cofounded by the Spanish Ministry of Economy and Competitiveness.

Author Contributions

Giovani Almeida Dávi performed the research and wrote the paper; José López de Asiain contributed to the building model design; Juan Solano contributed to the economic analysis and battery controller model; and Estefanía Caamaño-Martín and César Bedoya proofread and analyzed the data.

Conflicts of Interest

The authors declare no conflict of interest.

Appendix A

A quantitative analysis to determine modeling uncertainties was effected, based on the maximum deviation of the measured and simulated data of PV generation and load consumption, according to Figure A1. The electricity consumption simulations were carried out with the original building characteristics to quantify simulation model accuracy. Using this approach, the model accuracy is 88%. Compared to the utility measurements, the major differences occur in winter months and could be attributed to uncertainties in accounting real heat gains from people, plug loads and lights, heat gains and losses arising from windows and fenestrations, which influence the heating load. The PV modeling was validated with real measurements taken from a 65.78 kWp PV system installed on the roof of another building located in the same business park. The PV output performed with AMY weather data reaches 95% yearly accuracy and, according to a typical sunny day, the simulated PV power approaches to the measured values in 98% (Figure A1).
Figure A1. (a) Annual simulated and measured data comparisons of end-use load consumption and PV output in 2016; and (b) daily comparison of PV output. Installed PV power: 65.78 kWp. PV modules tilt angle: 30°. Weather file: Actual Meteorological Year of 2016 (AMY).
Energies 10 01117 g017

References

  1. European Commission—Eurostat Unit ESTAT 5: Electricity Consumption by Industry, Transport Activities and Households/Services. Energy L-2920. Luxembourg. Available online: http://ec.europa.eu/eurostat (accessed on 26 July 2017).
  2. Fasi, M.A.; Budaiwi, I.M. Energy performance of windows in office buildings considering daylight integration and visual comfort in hot climates. Energy Build. 2015, 108, 307–316. [Google Scholar] [CrossRef]
  3. Cao, S.; Hasan, A.; Sirén, K. Matching analysis for on-site hybrid renewable energy systems of office buildings with extended indices. Appl. Energy 2014, 113, 230–247. [Google Scholar] [CrossRef]
  4. International Energy Agency (IEA); Photovoltaic Power Systems Programme (PVPS). Review and Analysis of Self-Consumption Policies; International Energy Agency (IEA): Paris, France, 2016. [Google Scholar]
  5. Strbac, G. Demand side management: Benefits and challenges. Energy Policy 2008, 36, 4419–4426. [Google Scholar] [CrossRef]
  6. Staats, M.R.; de Boer-Meulman, P.D.M.; Van Sark, W.G.J.H.M. Experimental determination of demand side management potential of wet appliances in the Netherlands. Sustain. Energy Grid Netw. 2017, 9, 80–94. [Google Scholar] [CrossRef]
  7. Sehar, F.; Pipattanasomporn, M.; Rahman, S. An energy management model to study energy and peak power savings from PV and storage in demand responsive buildings. Appl. Energy 2016, 173, 406–417. [Google Scholar] [CrossRef]
  8. Ratnam, E.L.; Weller, S.R.; Kellett, C.M. Scheduling residential battery storage with solar PV: Assessing the benefits of net metering. Appl. Energy 2015, 155, 881–891. [Google Scholar] [CrossRef]
  9. Oliveira e Silva, G.; Hendrick, P. Lead–acid batteries coupled with photovoltaics for increased electricity self-sufficiency in households. Appl. Energy 2016, 178, 856–867. [Google Scholar] [CrossRef]
  10. Balcombe, P.; Rigby, D.; Azapagic, A. Energy self-sufficiency, grid demand variability and consumer costs: Integrating solar PV, Stirling engine CHP and battery storage. Appl. Energy 2015, 155, 393–408. [Google Scholar] [CrossRef]
  11. Luthander, R.; Widén, J.; Nilsson, D.; Palm, J. Photovoltaic self-consumption in buildings: A review. Appl. Energy 2015, 142, 80–94. [Google Scholar] [CrossRef]
  12. World Energy Resources Report 2016: E-storage: Shifting from Cost to Value Wind and Solar Applications; World Energy Council: London, UK, 2016.
  13. Briano, J.I.; Pardo, I.P.; García, M.V. PV Grid Parity Monitor: Commercial Sector 3rd Issue; Creara: Madrid, Spain, 2016. [Google Scholar]
  14. Agência Nacional de Energia Elétrica (ANEEL). Resolução Aneel n° 687. 2015. Available online: www.aneel.gov.br/cedoc/ren2015687.pdf (accessed on 26 July 2017).
  15. Ministry of Industry, Energy and Tourism Royal Decree 900. Boletín Oficial del Estado. Number 243. Spain, 10 October 2015; p. 94874. Available online: https://www.boe.es/boe/dias/2015/10/10/pdfs/BOE-A-2015-10927.pdf (accessed on 26 July 2017).
  16. Lopes, R.A.; Martins, J.; Aelenei, D.; Lima, C.P. A cooperative net zero energy community to improve load matching. Renew. Energy 2016, 93, 1–13. [Google Scholar] [CrossRef]
  17. Dávi, G.A.; Caamaño-Martín, E.; Rüther, R.; Solano, J. Energy performance evaluation of a net plus-energy residential building with grid-connected photovoltaic system in Brazil. Energy Build. 2016, 120, 19–29. [Google Scholar] [CrossRef]
  18. Salom, J.; Marszal, A.J.; Widén, J.; Candanedo, J.; Lindberg, K.B. Analysis of load match and grid interaction indicators in net zero energy buildings with simulated and monitored data. Appl. Energy 2014, 136, 119–131. [Google Scholar] [CrossRef]
  19. Salom, J.; Widén, J.; Candanedo, J.; Sartori, I.; Voss, K.; Marszal, A. Understanding net zero energy buildings: Evaluation of load matching and grid interaction indicators. In Proceedings of the 12th Conference of International Building Performance Simulation, Sydney, Australia, 14–16 November 2011. [Google Scholar]
  20. Weniger, J.; Tjaden, T.; Quaschning, V. Sizing of Residential PV Battery Systems. Energy Procedia 2014, 46, 78–87. [Google Scholar] [CrossRef]
  21. Cucchiella, F.; D’Adamo, I.; Gastaldi, M. A profitability assessment of small-scale photovoltaic systems in an electricity market without subsidies. Energy Conver. Manag. 2016, 129, 62–74. [Google Scholar] [CrossRef]
  22. Miller, N.; Manz, D.; Roedel, J.; Marken, P.; Kronbeck, E. Utility scale Battery Energy Storage Systems. In Proceedings of the Power and Energy Society General Meeting, Providence, RI, USA, 25–29 July 2010. [Google Scholar]
  23. Isa, N.M.; Das, H.S.; Tan, C.W.; Yatim, A.H.M.; Lau, K.Y. A techno-economic assessment of a combined heat and power photovoltaic/fuel cell/battery energy system in Malaysia hospital. Energy 2016, 112, 75–90. [Google Scholar] [CrossRef]
  24. Merei, G.; Moshövel, J.; Magnor, D.; Sauer, D.U. Optimization of self-consumption and techno-economic analysis of PV-battery systems in commercial applications. Appl. Energy 2016, 168, 171–178. [Google Scholar] [CrossRef]
  25. Orioli, A.; Di Gangi, A. Six-years-long effects of the Italian policies for photovoltaics on the grid parity of grid-connected photovoltaic systems installed in urban contexts. Energy 2017, 130, 55–75. [Google Scholar] [CrossRef]
  26. Thygesen, R.; Karlsson, B. Simulation and analysis of a solar assisted heat pump system with two different storage types for high levels of PV electricity self-consumption. Sol. Energy 2014, 103, 19–27. [Google Scholar] [CrossRef]
  27. Jayasekara, N.; Wolfs, P.; Masoum, M.A.S. An optimal management strategy for distributed storages in distribution networks with high penetrations of PV. Electr. Power Syst. Res. 2014, 116, 147–157. [Google Scholar] [CrossRef]
  28. European Union Directive 2010/31/EU of the European Parliament and of the Council of 19 May 2010 on the Energy Performance of Buildings. Available online: http://eur-lex.europa.eu/legal-content/EN/TXT/?uri=CELEX%3A32010L0031 (accessed on 26 July 2017).
  29. Ferrari, S.; Beccali, M. Energy-environmental and cost assessment of a set of strategies for retrofitting a public building toward nearly zero-energy building target. Sustain. Cities Soc. 2017, 32, 226–234. [Google Scholar] [CrossRef]
  30. Österreicher, D.; Geissler, S. Refurbishment in Educational Buildings—Methodological Approach for High Performance Integrated School Refurbishment Actions. Energy Procedia 2016, 96, 375–385. [Google Scholar] [CrossRef]
  31. Ascione, F.; Bianco, N.; De Masi, R.F.; Mauro, G.M.; Vanoli, G.P. Energy retrofit of educational buildings: Transient energy simulations, model calibration and multi-objective optimization towards nearly zero-energy performance. Energy Build. 2017, 144, 303–319. [Google Scholar] [CrossRef]
  32. Bánóczy, E.; Szemes, P.T. Simulation-based optimization in energy efficiency retrofit for office building. In Proceedings of the 2014 IEEE/SICE International Symposium on System Integration (SII), Tokyo, Japan, 13–15 December 2014. [Google Scholar]
  33. Marszal, A.J.; Heiselberg, P.; Bourrelle, J.S.; Musall, E.; Voss, K.; Sartori, I.; Napolitano, A. Zero Energy Building—A review of definitions and calculation methodologies. Energy Build. 2011, 43, 971–979. [Google Scholar] [CrossRef]
  34. Instituto Para La Diversificación y Ahorro de la Energía (IDAE). Código técnico de la Edificación (CTE). Documento Básico HE: Ahorro de Energía. 2013. Available online: http://www.codigotecnico.org/images/stories/pdf/ahorroEnergia/DBHE.pdf (accessed on 26 July 2017).
  35. Wang, L.; Gwilliam, J.; Jones, P. Case study of zero energy house design in UK. Energy Build. 2009, 41, 1215–1222. [Google Scholar] [CrossRef]
  36. Cuce, E.; Cuce, P.M.; Wood, C.J.; Riffat, S.B. Optimizing insulation thickness and analysing environmental impacts of aerogel-based thermal superinsulation in buildings. Energy Build. 2014, 77, 28–39. [Google Scholar] [CrossRef]
  37. Kottek, M. World map of the Köppen-Geiger climate classification updated. Meteorel. Z. 2006, 15, 259–263. [Google Scholar] [CrossRef]
  38. Weather Analytics. Available online: http://www.weatheranalytics.com/wa (accessed on 26 July 2017).
  39. EnergyPlus Engineering Reference. The Reference to EnergyPlus Calculations in EnergyPlus Version 8.3. Lawrence Berkeley National Laboratory: Berkely, CA, USA. Available online: https://energyplus.net (accessed on 26 July 2017).
  40. Scognamiglio, A.; Rostvik, H. hotovoltaics and zero energy buildings: A new opportunity and challenge for design. In Proceedings of the 27th EU PVSEC, Frankfurt, Germany, 24–28 September 2012. [Google Scholar]
  41. Li, Y.; Rezgui, Y. A novel concept to measure envelope thermal transmittance and air infiltration using a combined simulation and experimental approach. Energy Build. 2017, 140, 380–387. [Google Scholar] [CrossRef]
  42. Ahn, B.; Jang, C.; Leigh, S.; Yoo, S.; Jeong, H. Effect of LED lighting on the cooling and heating loads in office buildings. Appl. Energy 2014, 113, 1484–1489. [Google Scholar] [CrossRef]
  43. EnergyPlus Input-Output Reference. Reference for Input-Output Data in EnergyPlus Version 8.3. Lawrence Berkeley National Laboratory: Berkely, CA, USA. Available online: https://energyplus.net (accessed on 26 July 2017).
  44. European Committee for Standardization (CEN). Indoor Environmental Input Parameters for Design and Assessment of Energy Performance of Buildings Addressing Indoor Air Quality, Thermal Environment, Lighting and Acoustics; EN 15251:2007; European Committee for Standardization (CEN): Brussels, Belgium, 2007. [Google Scholar]
  45. Castillo-Cagigal, M.; Caamaño-Martín, E.; Matallanas, E.; Masa-Bote, D.; Gutiérrez, A.; Monasterio-Huelin, F.; Jiménez-Leube, J. PV self-consumption optimization with storage and Active DSM for the residential sector. Sol. Energy 2011, 85, 2338–2348. [Google Scholar] [CrossRef] [Green Version]
  46. Schiffer, J.; Sauer, D.U.; Bindner, H.; Cronin, T.; Lundsager, P.; Kaiser, R. Model prediction for ranking lead-acid batteries according to expected lifetime in renewable energy systems and autonomous power-supply systems. J. Power Sources 2007, 168, 66–78. [Google Scholar] [CrossRef]
  47. Schmidt, H.; Sauer, D.U. Praxisgerechte und praezise Modellierung von Wechselrichter-Wirkungsgraden. In Proceedings of the IX International Solar Forum, Stuttgart, Germany, 1997. [Google Scholar]
  48. Verbruggen, B.; De Coninck, R.; Baetens, R.; Saelens, D.; Helsen, L.; Driesen, J. Grid impact indicators for active building simulation. In Proceedings of the 2011 IEEE PES Innovative Smart Grid Technologies (ISGT), Anaheim, CA, USA, 17–19 January 2011. [Google Scholar]
  49. Jordan, D.C.; Kurtz, S.R. Photovoltaic Degradation Rates: An Analytical Review. Prog. Photovolt. Res. Appl. 2013, 21, 12–29. [Google Scholar] [CrossRef]
  50. International Energy Agency (IEA); Photovoltaic Power Systems Programme (PVPS). Trends 2016 in Photovoltaic Applications; International Energy Agency (IEA): Paris, France, 2016. [Google Scholar]
  51. Techno Sun. Available online: http://www.technosun.com/es/index.php (accessed on 26 July 2017).
  52. Red Eléctrica de España Sistema de información del operador del sistema. Available online: http://www.esios.ree.es (accessed on 26 July 2017).
  53. Aragonés, V.; Barquín, J.; Alba, J. The New Spanish Self-consumption Regulation. Energy Procedia 2016, 106, 245–257. [Google Scholar] [CrossRef]
  54. Berrada, A.; Loudiyi, K.; Zorkani, I. Valuation of energy storage in energy and regulation markets. Energy 2016, 115, 1109–1118. [Google Scholar] [CrossRef]
Figure 1. Office reference building under investigation. Latitude: 40.31°N, Longitude: 3.38°W. Location: Madrid, Spain.
Energies 10 01117 g001
Figure 2. Virtual model of the entire facility with roof-integrated solar pergola. Solar pergola total area: 1231 m2.
Energies 10 01117 g002
Figure 3. Loads operation schedules in a typical weekday.
Energies 10 01117 g003
Figure 4. Grid-connected PV hybrid system components and topology.
Energies 10 01117 g004
Figure 5. Proposed battery model for PV hybrid system.
Energies 10 01117 g005
Figure 6. Refurbished building: end-use loads consumption and PV generation.
Energies 10 01117 g006
Figure 7. Electricity flows in office building with PV system during a year (Case 2).
Energies 10 01117 g007
Figure 8. Histogram of yearly absolute frequency of grid power peaks with Pmax variations, CBat: 250 kWh.
Energies 10 01117 g008
Figure 9. Daily electricity flows in office building with demand-side management: (a) typical winter day; and (b) typical summer day.
Energies 10 01117 g009
Figure 10. (a) Electricity flows in office building with BESS during a year (Case 3); and (b) Battery State of Charge (SoC).
Energies 10 01117 g010
Figure 11. Yearly electricity balance in the different cases considered in the study (Positive axis: imported electricity from the grid (EGrid > 0); Negative axis: exported electricity to the grid (EGrid < 0)).
Energies 10 01117 g011
Figure 12. Yearly load matching parameters as function of BESS capacity size. Average daily electricity consumption: 500 kWh.
Energies 10 01117 g012
Figure 13. Yearly capacity factors in the investigated cases.
Energies 10 01117 g013
Figure 14. Annual retail electricity pricing for the commercial sector in 2016 and levelized cost of electricity ( LCOE ) in the studied application cases.
Energies 10 01117 g014
Figure 15. Economic analysis of Case 2: (a) levelized cost of electricity as function of discount rates and PV investment costs; and (b) payback time as function of discount rates and PV investment costs.
Energies 10 01117 g015
Figure 16. Economic analysis of Case 3: (a) levelized cost of electricity as function of PV investment costs and battery investment costs; and (b) payback time as function of PV investment costs and battery investment costs.
Energies 10 01117 g016
Table 1. Building envelope.
ComponentBuilding Envelope Characteristics
External Walls
U = 0.49 W/m2 K
0.02 m Plasterboard (900 kg/m3, 0.25 W/m K), 0.06 m MW Glass wool (40 kg/m3, 0.04 W/m K), 0.1 m Air gap (1000 kg/m3, 0.026 W/m K), 0.12 m Precast concrete planks (1700 kg/m3)
Ground floor
U = 0.96 W/m2 K
0.03 m Wood board (480 kg/m3, 0.15 W/m K), 0.05 m Air gap, 0.25 m Precast concrete planks (1580 kg/m3, 1.56 W/m K), 0.1 m Air gap
Roof and ceiling
U = 0.31 W/m2 K
0.02 m Plasterboard, 0.1 m Air gap, 0.25 m Precast concrete planks, 0.1 m Leveling mortar (1000 kg/m3, 0.41 W/m K), 0.002 m Bituminous membrane, 0.08 m XPS extruded polystyrene (38 kg/m3, 0.032W/m K), 0.1 m Gravel (1450 kg/m3, 2.0 W/m K)
Glazing
U = 2.71 W/m2 K
0.006 m SGG Parsol, 0.012 m Air gap, 0.006 m SGG Planilux, SHGC = 0.05
Table 2. Summary description of the cases considered in the study.
CaseBuilding Energy Refurbishment
1LED dimming control: the building electricity demand is modified by means of the reduction of LED power requirements, LED heating properties and LED dimming control, according to the daylighting illuminance that reaches the indoor environment. Renewable energy sources are not considered in the analysis.
2LED dimming control + Roof-integrated PV system (solar pergola): In addition to lighting performance, the solar pergola affects the air conditioning electrical consumption by providing shadowing on the roof and on the curtain walls. The PV system provides local electricity to supply directly the load, however the load supplying is effected by natural correlation between PV and load consumption.
3LED dimming control + Roof-integrated PV system (solar pergola) + BESS: Besides the building electricity reduction, this represents an optimized case due to the PV surplus electricity can be stored in the batteries to be used at later times when the solar electricity does not cover the load demand.
Table 3. Input data for multi-objective simulations performed in the study.
Modeled Office BuildingDescription
Building orientation70° Southwest
Gross Window-Wall Ratio (WWR)52%
Weather fileActual Meteorological Year (AMY) of Madrid in 2016 [38]
Modeled thermal zones10 (7 conditioned thermal zones)
Occupancy16.6 m2 per person
Radiant heat gain: 30%
InfiltrationInfiltration air change: 0.7 ACH [41]
Maximum infiltration flow rate: 0.75 m3/s
Lighting systemLuminaire type: recessed
Light type—fluorescent (original reference building):
Lighting power density (LPD): 21.6 W/m2
Installed power: 23.57 kW
Light type—LED with daylight control (refurbished reference building):
LPD: 14.8 W/m2. Installed power: 16.10 kW
Radiant heat: Fluorescent: 0.37, LED: 0 [42]
Visible light: Fluorescent: 0.18, LED: 0.2 [42]
Convective heat: Fluorescent: 0.42, LED: 0.75 [42]
Plug loadsTotal power density: 7.15 W/m2
Installed power: 7.8 kW
Radiant heat gain: 30%
HVAC systemMaximum supply air temperature for heating: 35 °C
Minimum supply air temperature for cooling: 12 °C
Designed load: 5736.8 W (cooling), 5543.7 W (heating)
Designed air flow rate: 0.7 m3/s (cooling), 0.55 m3/s (heating)
Maximum humidity ratio of the hot supply air: 0.016 kg/DryAir
Minimum humidity ratio of the cool supply air: 0.008 kg/DryAir
Hot waterType: Instantaneous hot water (electricity)
Supply temperature: 10 °C
Temperature delivered to the building: 65 °C
Consumption rate: 0.2 L/m2-day
Grid-connected photovoltaic systemPV modules type: monocrystalline silicon
Nominal conversion efficiency at standard test conditions: 18%
PV array granted area: 850 m2
PV installed capacity: 120 kWp (16 strings of 16 modules in series by subsystem)
02 inverters of 60 kW AC rated output power
Inverter efficiency: 96%
Storage system
(MATLAB-based modeling)
Type: Electric
Battery type: Valve Regulated Lead Acid (VRLA)
Minimum battery state of charge (SoCmin): 40%
Maximum battery state of charge (SoCmax): 100%
Battery inverter nominal power: 62 kW
Energy to Power Ratio (E2P): 4 h
Table 4. Billing structure and billing costs for commercial consumer in Spain.
Electricity Prices (€/kW.y)On-Peak: 40.72, Mid-Peak: 24.43, Off-Peak: 16.29
Electricity prices (€/kWh)On-peak: 0.1038, Mid-peak: 0.0857, Off-peak: 0.0125
Winter Billing periods
(31 October to 26 March)
On-peak: 6 p.m.–10 p.m., Mid-peak: 10 p.m.–12 a.m. and 8 a.m.–6 p.m., Off-peak: 12 a.m.–8 a.m.
Summer Billing periods
(27 March to 30 October)
On-peak: 11 a.m.–3 p.m., Mid-peak: 8 a.m.–11 a.m. and 3 p.m.–12 a.m., Off-peak: 12 a.m.–8 a.m.
Annual billing costs in 201625,420 € (Energy charge: 42%, Capacity charge: 38%, Taxes: 20%)
Table 5. Energy consumption of the original/refurbished building models and energy savings.
LoadEnergy Consumption 1
(Original Building)
Energy Consumption 2
(LED Lighting)
Energy Savings
2–1
Energy Consumption 3
(LED and Solar Pergola)
Energy Savings
3–1
Plug loads
(% total)
36,527 kWh
17%
36,527 kWh
19%
0%36,527 kWh
20%
0%
Lighting
(% total)
38,684 kWh
18%
20,852 kWh
11%
46%21,705 kWh
12%
45%
Heating *
(% total)
57,500 kWh
27%
59,217 kWh
30%
−3%63,402 kWh
35%
−10%
Cooling
(% total)
81,870 kWh
38%
78,604 kWh
40%
4%61,200 kWh
33%
25%
Total214,582 kWh195,202 kWh9%182,835 kWh15%
* Heating: HVAC and hot water.
Table 6. Grid connection capacity, load matching and capacity factors in the analyzed cases.
Application CaseCase 1Case 2Case 3
Grid connection capacity, P GCC 120 kW120 kW105 kW
P GCC reduction potential0%0%13%
Self-consumption, ƺ G 0%50.4%60%
Self-sufficiency, ƺ L 0%52.7%63%
Capacity Factor of imported electricity, CF Imp 18%8%6%
Capacity Factor of exported electricity, CF Exp 0%9%7%
Table 7. Economic analysis: cost structure, investment assumptions and results.
ApplicationOffice Building 2016
PV costsCase 2: 1.2 €/Wp, Case 3: 1.5 €/Wp
Battery costs250 €/kWh
Operation and Maintenance costs, CO&M4 €/kWp [13]
Corporate tax rate, TR 25%
Equipment’s replacementLead-acid batteries: 10 years 1, Inverters: 15 years
Discount rate ( γ )5% [13]
Annual increase in electricity prices5%
Yearly spot market revenue, β Case 1: 0 €, Case 2: 3692 €, Case 3: 2970 €
Yearly operational electricity bill savings, Case 1: 0%, Case 2: 42%, Case 3: 48%
Yearly energy charge savings on electricity bill, ( e )Case 1: 0%, Case 2: 51%, Case 3: 60%
Yearly capacity charge savings on electricity bill, ( c )Case 1: 0%, Case 2: 3%, Case 3: 12%
Levelized cost of electricity, LCOE Case 1: 0%, Case 2: 0.05 €/kWh,
Case 3: 0.115 €/kWh
Payback timeCase 1: 0%, Case 2: 14 years, Case 3: 28 years
1 The battery lifetime is in accordance to the literature that estimates lead-acid battery lifetime ranging 5–15 years [12], depending on the battery size and usage of the considered application.

