Abstract
With the significant decrease in natural gas prices in many parts of the world, the employment of gas turbine (GT) units has increased steadily in recent years. The ever-increasing deployment of GT units is strengthening the interconnections between electric power and natural gas systems, which could provide a higher level of operational flexibility and reliability. As a result, the planning and operation issues in the interconnected electric power and natural gas systems have aroused concern. In these circumstances, the impacts of increasing deployment of GT units in power system operation are studied and evaluated through well-being analysis (WBA). The fast responsive characteristics of GT units are analyzed first, and the definition and adaption of WBA in a power system with increasing deployment of GT units are addressed. Then the equivalent reserve capacity of GT units is estimated, taking demand fluctuations, commitment plans, and operational risks of GT units into account. The WBA of a power system with increasing deployment of GT units is conducted considering the uncertainties of system operation states and renewable energy sources. Finally, the proposed methods are validated through an integrated version of the IEEE 118-bus power system and a 10-bus natural gas system, and the impacts of GT units on power system security under various penetration levels are examined. Simulation results demonstrate that the role of a GT unit as a low-cost electricity producer may conflict with its role as a reserve provider, but through maintaining a proper proportion of idle GT capacities for reserve, the well-being performance of the power system concerned can be significantly improved.
1. Introduction
The coupling of power systems and other energy systems is becoming more common, along with the development of various renewable energy sources and energy conversion devices. Among various energy systems, the electric power and natural gas system are believed to constitute the major structure of future energy systems as electricity and natural gas are reliable and low-carbon-emission energy carriers [1]. Gas turbine (GT) units have been employed more and more widely in power systems owing to their affordability and outstanding scheduling flexibility [2]. GT units have gained increasing attention in mitigating the power fluctuations caused by intermittent power outputs from variable renewable energy sources (VRES), load forecast errors, and equipment failures. In addition, the rapid start-up and fast ramping characteristics of GT units make them competitive for peak shaving, frequency adjustment, and spinning and non-spinning reserves [3,4]. However, the impacts of increasing GT capacity and the interactions between the natural gas and electric power systems on the secure operation of the concerned power system have not yet been given much attention. The increasing deployment of GT units and newly emerged power-to-gas (P2G) infrastructures has strengthened the interconnections between the electric power and natural gas systems more than ever before, which means the natural gas network will be under significant pressure when both GT’s natural gas demands and direct natural gas consumption are high [5], and supply limitations and element failures may have significant impacts on the security of the integrated energy system. Therefore, it is necessary to analyze the impacts of the ever-increasing deployment of GT units on the secure operation of energy systems.
Coordination initiatives among multiple energy sectors have been emerging around the globe [6,7], and many existing publications are devoted to the planning and operation of the integrated energy system [8,9]. An expansion co-planning framework is proposed in [10] to address the uncertainties introduced by the increasing utilization of natural gas in the power system, and a planning strategy with the highest benefit/cost ratio is developed to reduce the operational cost, the carbon emissions cost, and the unreliability cost. The optimal expansion planning of multiple energy infrastructures is studied in [11] from the perspective of an energy hub. A security-constrained co-optimization planning model that considers long-term interdependency and natural gas transportation planning is proposed in [12]. An integrated stochastic day-ahead scheduling model is proposed in [4] to explore flexible ramping so as to accommodate stochastic VRES. A mixed-integer linear programming (MILP) formulation that considers the gas traveling velocity and compressibility in the integrated electric power and natural gas system is developed in [13], which attempts to assure energy adequacy in short-term operations. The P2G infrastructures are intensively studied in [14] to explore their transmission and utilization characteristics as well as their impacts on the natural gas network. Stochastic programming approaches are employed in the planning and operation of P2G energy hubs for evaluating the benefits of P2G storage with uncertainties of electricity price and hydrogen demand considered [15]. The dynamic modeling and interaction between two energy networks are studied in [16] under the microgrid frame, and the improved models of micro turbines are presented. However, the abovementioned publications generally focus on the modeling of integrated energy systems, while the operational risks are not systematically addressed. At the same time, the increasing popularity of natural gas usage, especially by GT units, will lead to more frequent occurrence of natural gas scarcity and inadequacy. Thus, the energy integration will eventually be hindered when the secure and reliable operation of the integrated electric power and natural gas system cannot be guaranteed.
In addition, the dynamic performance of GT units may severely disturb power system stability even though they outweigh conventional generating units in terms of emissions reduction [17,18]. Much research has been done on the state analysis of GT units. For instance, a detailed model for a heavy-duty GT unit that considers the ambient temperature and frequency dependence of the turbine power output is derived in [19] based on field testing, whereas [20] estimates the parameters of a heavy-duty GT unit model for dynamic studies with recourse to the available operational and performance data. In [18], operation issues of a heavy-duty GT unit are addressed and some methods such as back-tracing and feed-forward employed to prevent the wind-up phenomenon and improve the stability and response time of a GT unit.
So far, the well-being analysis (WBA) has been applied to generating systems [21] and large-scale power systems [22] through Monto Carlo simulations. The integrations of wind power generation [23,24], electric vehicles [25,26], and energy storage equipment [27] are also analyzed. The WBA of a power system is observed and analyzed from a global perspective, and the risks from the whole system are identified and evaluated. However, the impacts of the natural gas system on the well-being of the power system have been underestimated, and the integration of GT units has not been systematically addressed. As the share of GT units in total power generation is increasing, systematic investigations on the integrated system will not only help avoid potential risks, but also ensure secure and economic operation of the power system. In this paper, the actual available capacity of GT units is evaluated based on the characteristics of GT units and the status of the natural gas system concerned. Afterwards, the well-being of the integrated power and natural gas system is evaluated and analyzed. It should be noted that the proposed methodological framework is also applicable to the planning and operation of other bi-energy or multi-energy systems.
The remainder of this paper is organized as follows. In Section 2, the background and development of WBA are reviewed. In Section 3, the impacts of the natural gas system on the secure operation of the power system concerned are studied and the equivalent reserve capacity of GT units is calculated. The capacity limitations and transmission constraints are reasonably embedded into the proposed model. Section 4 demonstrates the procedures of WBA on analyzing the power system considering the impacts of the natural gas system. The feasibility of the developed model and method are validated by an integrated version of the IEEE 118-bus power system and a 10-bus natural gas system in Section 5, with impacts on power system security under various GT penetration levels examined. Finally, conclusions are presented in Section 6.
2. Background and Development of Well-Being Analysis
The reserve capacity determined by the traditional “N–1” or “N–2” contingency guidelines cannot estimate dynamic system parameters, which normally leads to over or insufficient reserve provision. As the uncertainty level in the power system operation keeps ascending, the selection of proper risk indicators with the probability method becomes more important. The WBA method is proposed in [28,29], which introduce the concept of the probability of different generation insufficiency levels during the lead time. In the WBA method, components such as rapid start units and interruptible loads are employed to alleviate the reserve gap, and their effects in terms of well-being improvement are analyzed. The risk indicators frequently used in the power system analysis are unit commitment risk (UCR) and response risk [30].
2.1. Well-Being Analysis (WBA)
The adequacy of the reserve capacity is of great importance to system reliability and risk resistance. In WBA, a system can be in three states: healthy, marginal, and at risk. System being states are categorized according to the system reserve capacity level:
- The system is healthy when the system reserve capacity level is sufficient to meet the required indicators.
- The system is marginal when the system reserve capacity level fails to meet all the required indicators but can fully serve the demand.
- The system is at risk when the system reserve capacity level cannot fully serve the demand [31].
The three states are dynamic and can transform between each other. Denote the probabilities of the healthy, marginal, and risky states as PH, PM, and PR, respectively. Their relationships can be depicted as in Equation (1):
The probabilities of the three states can be obtained from the historical statistics according to their definitions. It is easy to determine from the definitions that PR is the frequently used loss of load probability (LOLP). In most cases, PR and PH can be calculated by employing a capacity outage probability table (COPT) [32]. Then PM can be calculated according to Equation (1).
For a generating unit in a normal operation state at moment t = 0, its failure rate is denoted as λ (which is the number of failures per year) and the repair rate as μ. Its outage replacement rate (ORR) during the lead period time T, denoted as Pd(T), can be calculated as:
In general, the fault elements in power and natural gas systems cannot be repaired within the lead time, which means μ = 0; if T normally lasts for 1–2 h, then generally holds [30]. Thus it can be derived that:
As a result, the ORR of a normal unit can be obtained first and the unit commitment plan can be generated at the same time considering VRES units and rapid start units; then the COPT will be developed for the WBA. In WBA, the COPT is created employing ORR instead of the forced outage rate (FOR), and UCR calculated from COPT is naturally discrete as a result of the individual unit capacities [23]. A detailed description of COPT can be found in [30], and will not be further explained as it is outside the scope of this paper. The outputs of VRES are usually hard to predict precisely, thus their failures can be estimated through their inherent characteristics that are restricted by the external environment or the internal faults.
2.2. Effect of Rapid Start Units on Power System Well-Being
Traditional system operation state evaluation categorizes the gas-fired and hydro-driven units as rapid start units. In general, the system equivalent reserve is comprised of traditional spinning reserve, rapid start units, interruptible loads, and the external support [30]. Various equivalent reserve providers possess similar efficacy and mechanisms, and the discrepancies mainly lie in their distinctive lead time properties. The contribution of a certain equivalent reserve provider to the power system well-being can be quantified by the reduction of UCR for its integration, as in the risk functions f(R) shown in Figure 1.
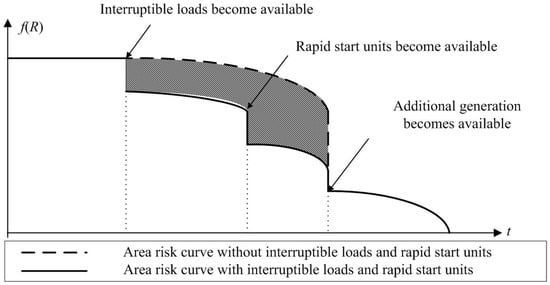
Figure 1.
The area risk curves with and without rapid start units and other equivalent reserve.
The participation of the equivalent reserve such as rapid start units significantly reduces the system risk. The shaded area in Figure 1 is the decreased probability of risk state. Denote the probabilities of the three states after rapid start unit integration as PEH, PEM, and PER, respectively, with their relationships shown in Equation (4):
2.3. Effect of GT Units on Power System Well-Being
Various sources of equivalent reserve discussed in Section 2.2 can contribute to system reserve provision and enhance power system well-being. The GT units belong to the rapid start units, whose lead time is only slightly longer than the interruptible loads with direct load control. The four-state model demonstrated in Figure 2 is employed to represent the rapid start unit in WBA, with ζij (i, j ∈ {1, 2, 3, 4}, i ≠ j) indicating the transfer rate from state i to j. The transfer rates can be obtained through rated parameters or historical statistics on the GT units concerned. The probabilities of unit states can be evaluated using Markov techniques and matrix multiplication techniques [30]. As the GT penetration level keeps deepening, the GT units may not only participate in the reserve service, but also take peak or off-peak loads. It should be noted that the future power system will need to constantly deal with multiple disturbance sources introduced by the intermittences of VRES and state variations of GT units. Therefore, this paper extends the scope from one disturbance source and its lead time to an operational period (i.e., a day). The WBA through the operation period is evaluated to reflect the effects of GT generation on power system security.
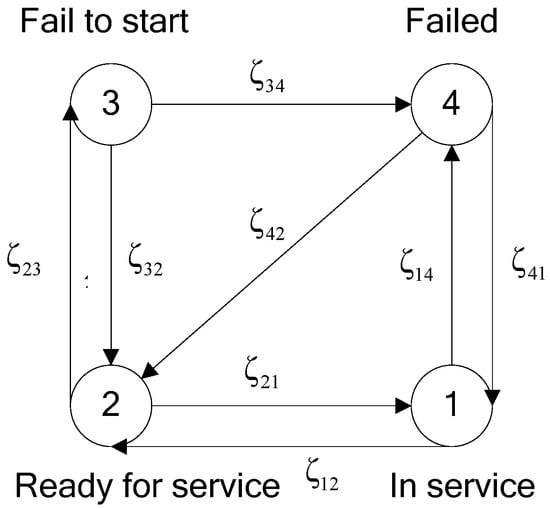
Figure 2.
Four-state model of rapid start units.
The availability of a GT unit is evaluated based on the four-state model shown in Figure 2. Assuming the number of integrated GT units is NG, and the k-th GT unit (k = 1, 2, …, NG) resides in state 2 (ready for service) of Figure 2 before contributing to the system generation. The k-th GT unit may transfer into state 1 or 4 when assigned by a probability of and 1 − , which determines the state probability at the initial moment Pk(0), as described in Equation (5). The availability of a GT unit is evaluated based on the four-state model shown in Figure 2. The state probability of the k-th GT unit at moment t, denoted as Pk(t), will be obtained based on the state probability at a predecessor state (moment tp), the transfer matrix P, and the step number z, as shown in Equation (6). The transfer matrix is defined in Equation (7) and the step length is normally set to 10 min to attain a competent state estimation within a satisfactory computational time that meets the requirements for most practical power systems, as stated in [30]. The step number z is calculated in Equation (8) with the ceiling function .
When the state probability of the k-th GT unit at moment t is obtained, the conditional availability probability can be easily calculated based on Equations (9) and (10). For an idle unit (at state 2), the probability of its availability equals its probability of a successful start-up, which is denoted as pss(k, t) and can be calculated as in Equation (9). For a generating GT unit (at state 1), the probability that it will continue to work, denoted as pcw(k, t), can be calculated as in Equation (10). The overall available idle capacity will be counted as reserve, forming an equivalent reserve together with other sources.
3. Impacts of Natural Gas System and Equivalent Reserve Capacity Estimation
Since GT units consume natural gas as the main energy fuel, an increase in GT capacity will strengthen the coupling between the power and natural gas system [13]. Therefore, observing and analyzing the corresponding influence on the power system’s operational state is not only helpful for reasonable resource allocation, but also essential to prevent cascading failures.
3.1. Operational Risks of GT units
In existing research, GT units and hydro-driven generators are regarded as ordinary rapid start units whose share in the total system capacity is very limited. Compared to the latter ones, the proportion of GT units has grown significantly due to its outstanding scheduling flexibilities and fast construction period. Its impact is therefore aggravated and expanded. Key sources of operational risk in a high GT penetration power system are unit outage, fuel scarcity, and the fuel transmission limit.
The unit outage is a long-standing threat, and its impact is aggravated and complicated as the installation capacity grows. Unavailability of a generating unit is another problem due to the same cause. As the installation capacity of GT units keeps ascending, the GT units will become more occupied and a higher demand for fuel (natural gas) can be expected. Thus, the phenomena of fuel scarcity and transmission congestion will be aggregated. The natural gas demand fluctuation has impacts on the fuel scarcity and transmission limit, as most GT units are supplied after residential natural gas users according to the flexible natural gas contracts so as to take advantage of the surplus fuel. The fuel scarcity is usually related to the production rate of natural gas and the consumption patterns of residential natural gas loads. GT units are on flexible contracts and are entitled to get natural gas supply when there is any surplus. Thus, the combined uncertainty of the natural gas production rate and the residential natural gas consumption patterns will increase the fuel risks for GT units. Natural gas transmission limitations such as pressure, velocity, and flow balance may also keep GT units from being available in the power system. These two risk sources will be reflected by fuel composite limitations in the WBA process.
3.2. Energy Demand and Unit Commitment
Consumption peaks from both the natural gas system and the power system will affect the fuel supply adequacy when GT units are widely installed in the power system. In this paper, the natural gas load is expressed in a generalized way that applies to various coupling levels.
Suppose that there are NR VRES generators and NC conventional units. The node set of the power system and the natural gas network are ΩE and ΩG, respectively. Then ΩE ∩ ΩG is the node set of energy conversion devices, such as GT units and P2G plants. The generation cost of VRES generators is much lower than that of conventional units (including GT units), and is normally scheduled first in commitment planning. Assume that the generation costs of GT units are lower than those of other types of conventional units, and all other natural gas consumption is included in the natural gas load prediction, denoted as q(t). Denote the electric power generation from VRES units, conventional units, and GT units as QR(t), QC(t), and QG(t), respectively. By ignoring the energy transmission loss, the total electricity load Le(t) and natural gas load Lg(t) can be calculated via Equations (11) and (12). The conversion coefficient μge equals the product of the GT unit efficiency multiplied by the fuel energy converting rate. The fuel energy converting rate is a unit conversion factor (1 MWh = 3.413 MMBtu) that converts the thermal output to its equivalent electricity output [33]. The electricity load, conventional natural gas load, and VRES units are supposed to behave based on the forecast data, whereas the controllable conventional units and GT units are operated according to real-time balance status. The conventional unit generation constraints, natural gas transmission limitation qT, and daily natural gas production limitation qD are described in Equations (13)–(15), respectively. The natural gas transmission limitation is derived considering the relief on pressure constraints by ancillary equipment such as compressors, valves, and natural gas storage in the pipeline system. The parameter denotes the maximum output of the j-th conventional unit, and πab denotes the hourly net natural gas flow on the pipeline from node a to node b in the natural gas network.
When the natural gas supply is abundant, the generation of GT units will be selected prior to conventional units in the unit commitment plan. On the other hand, the available fuel level and the GT unit status should be taken into consideration if the natural gas supply is insufficient. The schedule GT generation capacity in the commitment plan is denoted as ρ1.
3.3. Equivalent Reserve Capacity Estimation of GT Generation
The flexible responsive characteristics of GT units will benefit the security of the power system. On the other hand, the increasing deployment of GT units also introduces two major drawbacks. One is the feasibility problem caused by fuel scarcity and transmission constraint; the other is the frequent state changes of scheduled GT units.
The percentage of GT units involved in the commitment planning is settled considering energy demands, fuel limitations, and the GT unit states. The surplus of natural gas (the fuel amount can be consumed by GT units) is determined by qT, qD, and residential natural gas consumption. Denote the number of committed GT units as NGC, then the number of idle GT units is NG − NGC, and assume that all GT units share the identical nominal capacity qG. Let Gk(t) denote the dispatched generation of the k-th GT unit (k = 1, 2, … NGC) at moment t, then , and the available generation capacity of the k-th GT unit at the initial moment t = 0 and after z steps, denoted as Qk(t) and Qk(t + z), can be expressed as in Equations (16) and (17). If the m-th GT unit serves as the reserve, it stays at state 2 and will be able to start up when fuel is sufficient. Taking the influences of the natural gas system into account, the available generation of the m-th GT unit when it is required at the moment t, denoted as Qm(t + θ), can be described as in Equation (18). The parameter θ represents the lead time of a GT unit, and is set as 10 min in this paper.
The frequent state changes lead to inevitable exit of certain GT units, making the operational dynamic of the power system with GT units more complicated. It should be noticed that the state transfer of each GT unit and the fuel scarcity phenomenon are independent of each other. The actual outputs of the committed GT units QER1(t + z) can be approximated as their generation expectation, as shown in Equation (19). The step number z is an integer variable which varies on (0, Z), Z = T/, and the state of the committed GT units is subjected to changes at each step. The merging gap caused by the GT unit exit phenomenon is being filled with other available GT units. The equivalent reserve capacity of other GT units, denoted as QER2(t), can be obtained via Equation (20). Denote the converted GT generation limitation under regular and contingency situations as ρ0 and ρC, respectively. Then ρ1 ≤ ρ0. As long as the overall natural gas consumption does not exceed the contingency upper limit qTC (which is normally determined by the daily production and the gas network conditions), the equivalent reserve can be considered reliable. The actual result will be analyzed through the WBA, as demonstrated in Figure 3.
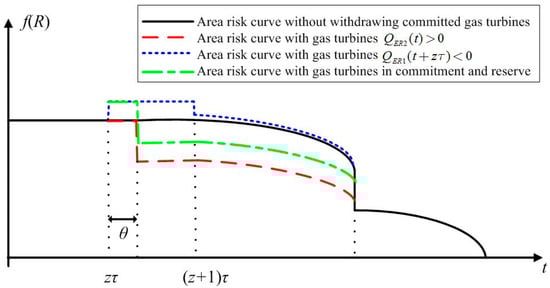
Figure 3.
The area risk curves under the impacts of instantaneous output changes and available reserve of GT units.
4. Well-Being Analysis of a Power System Considering Natural Gas System Integration
4.1. Outage of Conventional Units and Output Fluctuations of VRES
In this paper, the generating units will be categorized into conventional units, GT units, and VRES units based on the controllability and outage rate as well as the response speed. Although the share of GT units is growing, the total capacity of conventional generating units is usually larger than that of GT units. Thus, the base load consumptions are normally served by conventional generators as they are of high reliability and low flexibility. The possible outage scenarios are generated based on the ORR information of generating units. As for the GT units, the commitment plans and system operation status will be utilized to calculate their state probabilities. The VERS units are described by their power forecast and deviation, and a maximum fluctuation of three times the standard deviation is employed for evaluating the system well-being. Different types of VRES units will be distinguished and characterized by their output uncertainties in this paper.
4.2. WBA Considering Increasing Deployment of GT Units
The WBA in a power system with conventional generators, GT units and VRES units is conducted by comparing all possible combinations of the unit commitment and outage/fluctuation events. The probability of each combination and the corresponding equivalent reserve capacity is then calculated according to the definitions of three states of being and Equations (19) and (20). The WBA procedure is as follows:
- (1)
- Obtain the electricity and natural gas load, the renewable generation forecast, ORR of the units, and the period lead time.
- (2)
- Obtain transition rates and step length , and characterize the operational state of GT units with the transfer matrix based on Equations (5)–(8).
- (3)
- Conduct unit commitment planning according to unit states and properties according to the constraints in Equations (11)–(15).
- (4)
- In each period (period length equals to period lead time T), calculate the outage probabilities of conventional units (per T), evaluate output fluctuations of VRES units (per T) and update the states of committed GT units (per ).
- (5)
- Estimate the available generation capability of the committed GT units and the equivalent reserve capacity of the idle GT units based on Equations (9), (10), (19) and (20) under two scenarios: (i) considering the impact of fuel scarcity; (ii) neglecting the impact of fuel scarcity.
- (6)
- Conduct WBA for both scenarios (i) and (ii), employing COPT, and attain PEH, PEM and PER accordingly.
- (7)
- Compare the WBA results for two scenarios and GT penetration levels, and suggest a method to facilitate the integration of the two energy systems.
5. Case Studies
5.1. Case Description
An integrated version of the IEEE 118-bus power system and a 10-bus natural gas system is employed to demonstrate the proposed method and analyze the impacts of natural gas system integration on the operation of the power system [34]. In this paper, the acceptable maximum risk level (probability) is specified as 0.001, and the required minimum healthy state probability is specified as 0.99 [25]. Two simulation scenarios with different GT installation proportions are arranged: (1) the considered power system contains 34 generating units (25 conventional units, six GT units, and three VRES units); (2) the considered power system contains 38 generating units (19 conventional units, 16 GT units, and three VRES units). The allocation of generating units and power loads is depicted in Figure 4. L1–L4 are the residential natural gas load, whereas L5–L20 are consumed by GT units when allocated. The installation capacities of different generating units can be found in Table 1. The natural gas load curve, electricity load curve, and total VRES generation forecast curve are identical in both scenarios, as shown in Figure 5. The daily natural gas production limit is 1100 MMcf, and the equivalent hourly natural gas transmission limit is 50 MMcf. The contingency gas upper limit is set at 55 MMcf. In 2015, the average heat content of natural gas was about 1032 Btu per cf [35]. The installation proportions of GT units in the two scenarios are (1) 11.33% and (2) 30.21%; the efficiency ratio of a GT unit is assumed to be 50%. The WBA is conducted on a typical day (24 h). The period lead time T is set as 1 h, and the probability of a GT unit start-up failure is set to 10%. The ORR of conventional units is two failures per year, and the transfer matrix of the GT unit is demonstrated in Table 2.
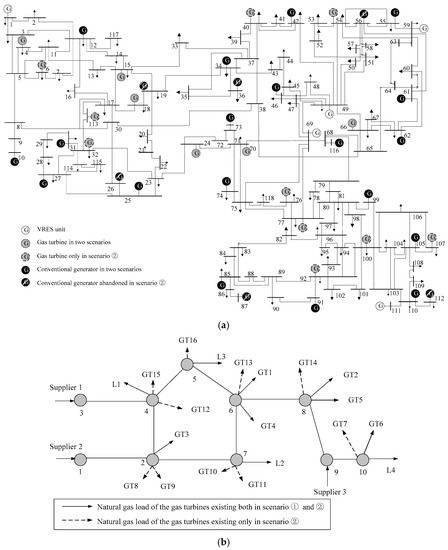
Figure 4.
The allocations of units and loads: (a) the IEEE 118-bus power system; (b) the 10-bus natural gas system.

Table 1.
Installation capacities of different types of generators.
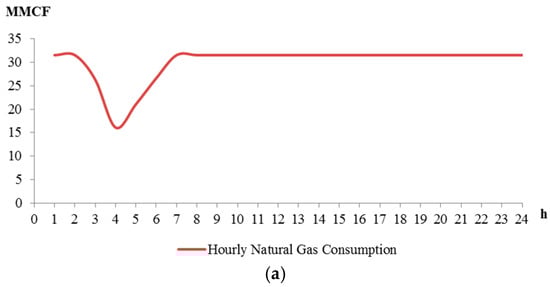
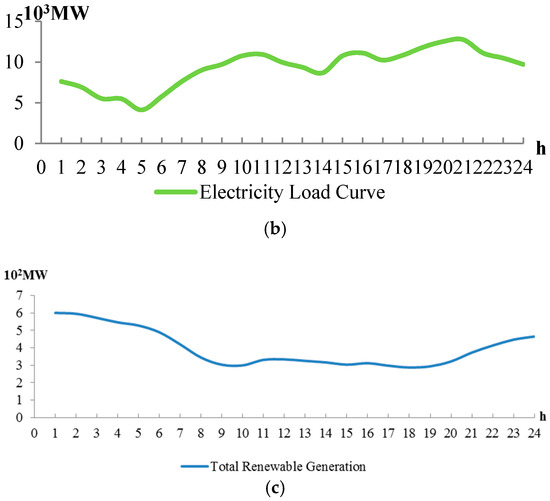
Figure 5.
Load and generation curves: (a) Natural gas load curve; (b) Electricity load curve; (c) VRES generation curve.
Table 2.
Transition matrix of the GT unit [26].
5.2. Results and Comparisons
The fact that GT units are employed as low-cost generating units keeps them from being competent reserve providers. In fact, both the probabilities of risk and healthy state do not meet the required levels, no matter whether qTC is considered or neglected in scenario (1). The results confirm that the power system cannot rely on a small number of GT units as reserve providers without specific planning. In scenario (1), the GT installation capacity is actually sufficient for the required reserve, but the GT units will be committed prior to most conventional units as there is always surplus natural gas. When the vast generation capabilities of GT units are scheduled by unit commitment, the equivalent reserve capacity they can provide is thus limited. When the natural gas production rate varies, the GT consumption margin will be further compressed. In the worst case scenario, when the natural gas production rate is extremely low and the overall residential natural gas load is high, the consumption margin available for the GT units may not even be sufficient for the reserve requirement. Therefore, the production and consumption rates of natural gas should be examined for a power system that depends on GT units for reserve provision, and other reserve sources should be equipped if necessary.
In scenario (1), the GT units’ functions as low-cost generating units and as peak/reserve units will conflict due to their limited capacities. When GT units are taken as reserve providers, one way to guarantee the sufficient reserve capacity is to keep a certain number of GT units from the energy commitment. The probabilities of risk with different numbers of reserved GT units are shown in Table 3. It can be found that the probability of risk decreases as the number of reserved GT units increases. The probabilities of health with various number of reserved GT units are shown in Table 4. From Table 3, it can be found that, regardless of the number of reserve units, the risk probabilities are distinct at some moments, especially for hour 6. This is because the specific energy production and consumption conditions at hour 6 make the unit commitment at that moment different from at other hours. From Figure 5a, the residential natural gas consumption rebounds after hour 5 and the bounce rate is the highest at hour 6, which indicates that the committed GT units are likely to shut down so that the natural gas consumption of the residential load can be guaranteed. However, they are still able to provide reserve services under the contingency offers if there is a reserve gap threatening the system’s well-being. At the same time, more conventional units will be committed as the electric load is also going to rise according to Figure 5b, which strengthens the total reserve capacity of the system. Thus, the risk metric is considerably lowered at hour 6 due to the start-up of plentiful conventional units, large reserve capacities provided by GT units, and the relatively low load level. However, this does not indicate that the reserve is unnecessary at hour 6. In fact, the health metric at hour 6 does not meet the requirement unless five GT units are providing reserve services. In general, the abnormal probability value at hour 6 is an occasional event that is the result of many factors and cannot guarantee the well-being performance even for minor fluctuations. In scenario (1), the qTC constraint does not affect the WBA results, which indicates that the fuel scarcity and transmission constraints will not influence the operation of GT units when the installation proportion of GT units is low and the interconnections between the electric power and the natural gas system are loose.
Table 3.
Probabilities of risk under scenario (1) with a certain number of GT units set aside as reserves.
Table 4.
Probabilities of health under scenario (1) with a certain number of GT units set aside as reserves.
When five GT units are reserved, the well-being states of the power system will meet the proposed requirements, as shown in Table 5. It should be mentioned that when the actual output of VRES decreases by 85.56 MW from the forecasted one, the results in Table 5 remain the same, indicating that the reserved GT units are sufficient to cover the impact of the intermittent VERS without extra reserve cost.
Table 5.
System well-being with five reserved units.
Table 6 shows the results of WBA with and without the natural gas contingency constraints considered in scenario (2). In this case, qTC is of great significance to the well-being of the power system. The differences in WBA results reflect the impacts of fuel scarcity and transmission limit on the operation of GT units. For certain operation periods (e.g., t = 11, 12, 18…), the results in Table 6 present significant gaps, indicating that the fuel scarcity and transmission limit is hindering the ordinary operation of GT units. Limited impact of fuel constraints can be found at periods such as t = 8, 10, 15 and 16, whereas the impact becomes trivial at periods such as t = 1, 2 and 7. The availability of GT units is another factor that affects the well-being requirements of the power system. It is worth noticing that, when qTC is neglected, the well-being performance still cannot be completely fulfilled throughout the observation period, which is due to the high percentage occupation of installed GT units as electricity suppliers. Though the GT penetration level under scenario (2) is significantly higher than under (1), the system operator may still run out of reserve capacity during the original valley of the natural gas demand, as the installed GT units are scheduled due to the natural gas surplus. Similar to the analysis for scenario (1), the system well-being can be improved through discounting some economic benefit for risk aversion. Therefore, both the fuel insufficiency and the availabilities of GT units should be taken care of to simultaneously reduce the energy supply risk and enhance the system’s well-being level.
Table 6.
Probabilities of health and margin under scenario (2).
To enhance the well-being level of the energy system operation, the conventional unit commitment planning should be revised considering the installation capacity of GT units and the fuel constraints. Denote the reserved unit number as nr, the suggested generation capacity of GT units for unit commitment denoted as as shown below, will replace ρ1.
Obviously, the total generation cost will increase if < ρ1, but the improvements in well-being level are far more significant. By setting nr = 4, the suggested GT capacities for unit commitment are illustrated in Figure 6. The corresponding system well-being indicators are shown in Table 7.
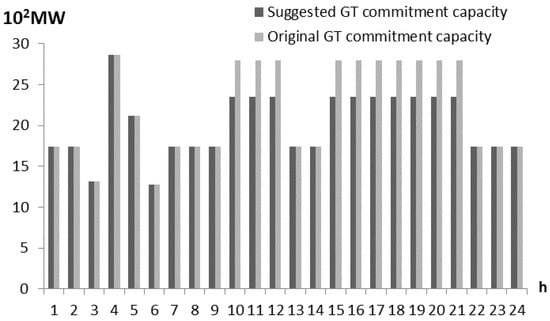
Figure 6.
Suggested GT commitment capacity when nr = 4.
Table 7.
System well-being when nr = 4.
As can be observed from Table 7, the acceptable risk level (below 0.001) can be fully reached, and the required healthy state probability (above 0.99) is also accomplished. The system well-being performance will not be affected by a VRES fluctuation of three times the standard deviation as well. As the failure rate and transition probability of GT units are much higher than other generators, the risks they introduce (especially when the installation capacity is high) must be dealt with carefully. From the above analyses, proper revision of GT unit commitment schedules will make the GT units competent not only to mitigate their own risks, but also to cover the demand of system reserve capacity.
6. Conclusions
The integration of VRES is escalating along with the promotion of energy conservation and emissions reduction policies. The required regulation and reserve levels of the power system are thus increased due to the increasing uncertain factors and degrees. The integration of GT units in the daily unit commitment conforms to the trend of ascending installation proportion of GT units. Given that GT units may serve peak and off-peak loads, the well-being of the power system is analyzed considering their influence. The frequent state changes and exits of GT units also introduce additional risk factors to the secure operation of power systems. Therefore, an equivalent reserve capacity considering the probabilities of successful start and frequent exits are calculated to evaluate the actual available operational reserve. The analysis shows that the role of GT units as low-price generators may conflict with its role as a reserve provider, and the performance as a reserve provider is not satisfactory without specific planning due to fuel insufficiency. Through keeping a proper proportion of idle GT units for reserve capacities, the well-being performance of a power system can be significantly improved. Future studies will further explore the market risks from the two energy systems, as well as the risks from integration of other energy conversion equipment, such as P2G and combined heat and power.
Acknowledgments
This work was jointly supported by the National Key R&D Program of China (No. 2017YFB0902903) and Postdoctoral Innovation Talent Support Program of China (No. BX201700211).
Author Contributions
Bomiao Liang proposed the methodological framework and implementation algorithm, performed the simulations, and drafted the manuscript; Weijia Liu reviewed and improved the methodological framework and implementation algorithm; Fushuan Wen organized the research team and reviewed and improved the methodological framework and implementation algorithm; Md. Abdus Salam reviewed and polished the manuscript. All authors discussed the simulation results and agreed on submission.
Conflicts of Interest
The authors declare no conflict of interest.
References
- Heinen, S.; Hewicker, C.; Jenkins, N.; McCalley, J.; O’Malley, M.; Pasini, S.; Simoncini, S. Unleashing the flexibility of gas: innovating gas systems to meet the electricity system’s flexibility requirements. IEEE Power Energy Mag. 2017, 15, 16–24. [Google Scholar] [CrossRef]
- Pan, K.; Guan, Y.; Watson, J.P.; Wang, J. Strengthened MILP formulation for certain gas turbine unit commitment problems. IEEE Trans. Power Syst. 2016, 31, 1440–1448. [Google Scholar] [CrossRef]
- Alabdulwahab, A.; Abusorrah, A.; Zhang, X.; Shahidehpour, M. Coordination of interdependent natural gas and electricity infrastructures for firming the variability of wind energy in stochastic day-ahead scheduling. IEEE Trans. Sustain. Energy 2015, 6, 606–615. [Google Scholar] [CrossRef]
- Zhang, X.; Liang, C.; Shahidehpour, M.; Alabdulwahab, A.; Abusorrah, A. Electricity-natural gas operation planning with hourly demand response for deployment of flexible ramp. IEEE Trans. Sustain. Energy 2016, 7, 996–1004. [Google Scholar] [CrossRef]
- Clegg, S.; Mancarella, P. Integrated electrical and gas network flexibility assessment in low-carbon multi-energy systems. IEEE Trans. Sustain. Energy 2016, 7, 718–731. [Google Scholar] [CrossRef]
- Good, N.; Ceseña, E.M.; Liu, X.; Mancarella, P. A business case modelling framework for smart multi-energy districts. In Proceedings of the CIRED Workshop 2016, Helsinki, Finland, 14–15 June 2016. [Google Scholar] [CrossRef]
- Guo, Y.; Zhang, L.; Zhao, J.; Wen, F.; Salam, A.; Mao, J.; Li, L. Networked control of electric vehicles for power system frequency regulation with random communication time delay. Energies 2017, 10, 621. [Google Scholar] [CrossRef]
- Guo, Y.; Liu, W.; Wen, F.; Salam, A.; Mao, J.; Li, L. Bidding strategy for aggregators of electric vehicles in day-ahead electricity markets. Energies 2017, 10, 144. [Google Scholar] [CrossRef]
- Li, P.; Wang, H.; Lu, Q.; Li, W. Combined heat and power dispatch considering heat storage of both buildings and pipelines in district heating system for wind power integration. Energies 2017, 10, 893. [Google Scholar] [CrossRef]
- Qiu, J.; Dong, Z.; Zhao, J.; Meng, K.; Zheng, Y.; Hill, D.J. Low carbon oriented expansion planning of integrated gas and power systems. IEEE Trans. Power Syst. 2015, 30, 1035–1046. [Google Scholar] [CrossRef]
- Zhang, X.; Shahidehpour, M.; Alabdulwahab, A.; Abusorrah, A. Optimal expansion planning of energy hub with multiple energy infrastructures. IEEE Trans. Smart Grid 2015, 6, 2302–2311. [Google Scholar] [CrossRef]
- Zhang, X.; Shahidehpour, M.; Alabdulwahab, A.; Abusorrah, A. Security-constrained co-optimization planning of electricity and natural gas transportation infrastructures. IEEE Trans. Power Syst. 2015, 30, 2984–2993. [Google Scholar] [CrossRef]
- Correa-Posada, C.; Sánchez-Martín, P. Integrated power and natural gas model for energy adequacy in short-term operation. IEEE Trans. Power Syst. 2015, 30, 3347–3355. [Google Scholar] [CrossRef]
- Clegg, S.; Mancarella, P. Integrated modeling and assessment of the operational impact of power-to-gas (P2G) on electrical and gas transmission networks. IEEE Trans. Sustain. Energy 2015, 6, 1234–1244. [Google Scholar] [CrossRef]
- Mukherjee, U.; Maroufmashat, A.; Narayan, A.; Elkamel, A.; Fowler, M. A stochastic programming approach for the planning and operation of a power to gas energy hub with multiple energy recovery pathways. Energies 2017, 10, 868. [Google Scholar] [CrossRef]
- Xu, X.; Jia, H.; Chiang, H.D.; Yu, D.C.; Wang, D. Dynamic modeling and interaction of hybrid natural gas and electricity supply system in microgrid. IEEE Trans. Power Syst. 2015, 30, 1212–1221. [Google Scholar] [CrossRef]
- Meegahapola, L.; Flynn, D. Characterization of gas turbine lean blowout during frequency excursions in power networks. IEEE Trans. Power Syst. 2015, 30, 1877–1887. [Google Scholar] [CrossRef]
- Balaghi, E.H.; Abbasi, S.E. A detailed governor-turbine model for heavy-duty gas turbines with a careful scrutiny of governor features. IEEE Trans. Power Syst. 2015, 30, 1435–1441. [Google Scholar] [CrossRef]
- Pourbeik, P.; Modau, F. Model development and field testing of a heavy-duty gas-turbine generator. IEEE Trans. Power Syst. 2008, 23, 664–672. [Google Scholar] [CrossRef]
- Tavakoli, M.R.; Vahidi, B.; Gawlik, W. An educational guide to extract the parameters of heavy duty gas turbines model in dynamic studies based on operational data. IEEE Trans. Power Syst. 2009, 24, 1366–1374. [Google Scholar] [CrossRef]
- Billinton, R.; Karki, R. Application of Monte Carlo simulation to generating system well-being analysis. IEEE Trans. Power Syst. 1999, 14, 1172–1177. [Google Scholar] [CrossRef]
- Wangdee, W.; Billinton, R. Bulk electric system well-being analysis using sequential Monte Carlo simulation. IEEE Trans. Power Syst. 2006, 21, 188–193. [Google Scholar] [CrossRef]
- Billinton, R.; Karki, B. Well-being analysis of wind integrated power systems. IEEE Trans. Power Syst. 2011, 26, 2101–2108. [Google Scholar] [CrossRef]
- Billinton, R.; Karki, B.; Karki, R.; Ramakrishna, G. Unit commitment risk analysis of wind integrated power systems. IEEE Trans. Power Syst. 2009, 24, 930–939. [Google Scholar] [CrossRef]
- Xu, N.; Chung, C. Well-being analysis of generating systems considering electric vehicle charging. IEEE Trans. Power Syst. 2014, 29, 2311–2320. [Google Scholar] [CrossRef]
- Xu, N.; Chung, C. Uncertainties of EV charging and effects on well-being analysis of generating systems. IEEE Trans. Power Syst. 2015, 30, 2547–2557. [Google Scholar] [CrossRef]
- Bagen, R.; Billinton, R. Incorporating well-being considerations in generating systems using energy storage. IEEE Trans. Energy Convers. 2005, 20, 225–230. [Google Scholar] [CrossRef]
- Billinton, R.; Fotuhi-Firuzabad, M. Generating system operating health analysis considering standby units, interruptible load and postponable outages. IEEE Trans. Power Syst. 1994, 9, 1618–1625. [Google Scholar] [CrossRef]
- Fotuhi-Firuzabad, M.; Billinton, R. Impact of load management on composite system reliability evaluation short-term operating benefits. IEEE Trans. Power Syst. 2000, 15, 858–864. [Google Scholar] [CrossRef]
- Billinton, R.; Allan, R.N. Reliability Evaluation of Power Systems, 2nd ed.; Plenum: New York, NY, USA, 1996. [Google Scholar]
- Karki, R.; Billinton, R. Cost-effective wind energy utilization for reliable power supply. IEEE Trans. Power Syst. 2004, 19, 435–440. [Google Scholar] [CrossRef]
- Billinton, R.; Karki, R. Capacity reserve assessment using system well-being analysis. IEEE Trans. Power Syst. 1999, 14, 433–438. [Google Scholar] [CrossRef]
- U.S. Environmental Protection Agency. Output-Based Regulations: A Handbook for Air Regulators. Available online: https://www.epa.gov/sites/production/files/2015-07/documents/output-based_regulations_a_handbook_for_air_regulators.pdf (accessed on 5 July 2017).
- Li, T.; Eremia, M.; Shahidehpour, M. Interdependency of natural gas network and power system security. IEEE Trans. Power Syst. 2008, 23, 1817–1824. [Google Scholar] [CrossRef]
- U.S. Energy Information Administration’s (EIA). Monthly Energy Review. Available online: https://www.eia.gov/totalenergy/data/monthly/archive/00351701.pdf (accessed on 5 July 2017).
© 2017 by the authors. Licensee MDPI, Basel, Switzerland. This article is an open access article distributed under the terms and conditions of the Creative Commons Attribution (CC BY) license (http://creativecommons.org/licenses/by/4.0/).