1. Introduction
Biofuels face a growing demand fostered by fossil fuels depletion, while providing mitigation of the climate change determined by fossil fuel combustion [
1]. Biomass crops for biofuels need to be produced with low inputs while maintaining high productivity, in order to attain high energy efficiency [
2]. Biomass sorghum (
Sorghum bicolor (L.) Moench) featuring high, thick stems with small panicles, is much praised due to a low need of agricultural inputs, high resistance to drought, and high biomass production [
3,
4,
5]. This is supported by specific sources in the literature, indicating that biomass sorghum has a higher ratio of energy output to energy input compared to sugarcane, sugar beet, maize, and wheat [
6,
7]. Moreover, in the same sources [
6,
7], the fermentation efficiency of sorghum juice is reported to be higher than 90%.
Depletion of water resources is claimed to be a major consequence of climate change affecting many world areas [
8,
9]. As a result, water is becoming a costly and much-debated resource in the management of bio-energy crops [
10], which is accompanied by a growing fear that irrigating such crops would exacerbate the competition with food crops under limited water resources [
11]. Thus, it has become a crucial point of debate to assess water use efficiency (WUE), i.e., the amount of biomass or biomass-derived biofuels per unit water used for plant growth [
12], as the premise for efficient energy production.
Several studies addressed sorghum resistance to water stress and biomass reduction under drought conditions [
13,
14,
15], while a few authors related water availability and harvest time to the characteristics of structural carbohydrates in view of energy conversion (biogas and ethanol) [
15,
16]. However, in these works no conversion of biomass into ethanol was actually carried out; the authors only produced indirect assessments of ethanol output based on formulas not specifically developed for their experimental conditions.
It is generally acknowledged that biomass suitability for ethanol not only depends on cellulose content, but also on biomass physical and chemical properties as lignin cross-links with cell wall carbohydrates [
17]. Thus, proper assessment of potential ethanol output from any kind of biomass cannot rely on the sole fiber composition; it involves actual conversion into ethanol by means of a specific assay.
More to this, some works focused the maximum accumulation of sugars in plant stems [
18], and the proportion of juice extracted from the stem at different crop stages [
14]. Some other studies determined the most suitable stage for harvest based on juice content [
7], i.e., considering only juice for energy purposes. In contrast to this, no investigation has focused on crop management and harvest stage in view of using the residual bagasse for additional ethanol production.
This leaves unanswered questions concerning sorghum as a potential source of biomass for ethanol production, alternatively to other crops (e.g., maize) currently used as feedstocks for ethanol plants. The answers reflect the efficiency of the whole production chain, and address two delicate issues arising from the above discussion: the amount of cropland and the quantity of water needed to supply an ethanol plant, to the expenses of alternative uses [
19,
20].
To fill the multiple gaps of knowledge, this study was conducted to determine the effect of variable soil moisture and harvest time on growth, biomass characteristics, and juice- and bagasse-derived ethanol yield in two genotypes of biomass sorghum (sweet and fiber genotypes). Water use efficiency was calculated for sorghum dry weight (DW) and the total amount of ethanol, to assess the combination of the three factors (genotype, soil moisture, and harvest time) securing the highest energy output in exchange for the lowest water consumption. Lastly, ethanol and WUE data were used to calculate the amount of land and water needed to supply a modern ethanol-producing plant.
Our experiment was configured without the pretreatment step in order to understand biomass structural behavior under the investigated factors. This is supported by the fact that cellulosic ethanol production is not yet widespread [
21], and pretreatment is still a technologically-immature step in biomass conversion to fermentable sugars [
22].
2. Materials and Methods
2.1. Experimental Setup
The experiment was conducted during May to October 2014 in a greenhouse at the Department of Agricultural Sciences, University of Bologna, Italy (44°29′ N, 11°20′ E; 32 m above sea level).
Two hybrids of biomass sorghum (Sorghum bicolor (L.) Moench) were used as genotypes (G): Sucros 506 (S506) as sweet sorghum and Biomass 133 (B133) as fiber sorghum, both provided by Syngenta Seeds (Casalmorano, CR, Italy). The two genotypes were sown on 20 May 2014 in 48 pots (0.22 m diameter; 7.2 L volume) filled with 9.5 kg of soil on oven dry basis. Six seeds were sown in each pot. Seedling emergence occurred four days after seeding (DAS), and seedlings were subsequently thinned to two plants per pot. Beginning of differential watering started at 21 DAS; the experiment lasted a total of 151 DAS.
The soil was collected from the Research Farm of the University of Bologna in Cadriano (Bologna, Italy), air dried, ground to pass a 2 mm sieve, and mixed with sand in a 2:1 ratio. On this mixture, residual moisture was determined (in an oven at 105 °C until constant weight), and the following physical-chemical traits were assessed, according to standard procedures [
23]: particle size distribution (sand, silt and clay; 500 g·kg
−1, 330 g·kg
−1, and 170 g·kg
−1, respectively); pH (8.1; soil to water ratio, 1:2.5); total and active limestone (71.2 g·kg
−1 and 17.5 g·kg
−1, respectively); cation exchange capacity (17.2 cmol
c+·kg
−1); total organic carbon and total kjeldahl nitrogen (6.82 g·kg
−1 and 0.76 g·kg
−1, respectively); and available P (Olsen) and exchangeable K (14 g·kg
−1 and 101 mg·kg
−1, respectively). Volumetric water content at field capacity and wilting point was also determined (Richards’ apparatus); 0.269 m
3·m
−3 and 0.127 m
3·m
−3, respectively.
2.2. Experimental Design and Treatments
The experiment involved the two genotypes in combination with two soil moisture levels and three harvests organized in a completely randomized design with four replications, totaling 48 pots. To avoid interference of unpredictable precipitation on the two targeted soil moisture levels, the experiment was conducted in rain-sheltered conditions (greenhouse).
At 21 DAS, low (L) and high (H) soil moisture (SM), corresponding to a respective 30% and 70% soil available water (the latter, the difference between field capacity and wilting point), were differentiated by adding the amount of water determined by pot weighing. Prior to differentiation, the soil surface was covered with a layer of expanded clay granules encircling the sorghum base to curb evaporation. In H soil, water was added almost every day, whereas in L soil water was added three times a week. Soil moisture was monitored weekly: additional pots were set up and plants were harvested during the experiment to account for weight increase due to plant growth. N fertilizer was applied after thinning, while the rest of the nutrients were at sufficient levels in the soil.
The three harvests (H) and the corresponding plant development stages were: H1 at 90 DAS with sorghum in stem elongation; H2 at 118 DAS with plants at heading; H3 at 151 DAS with grain at soft dough. The two genotypes had the same length of crop cycle, based on previous field experiments.
At each harvest, four replicates (i.e., four pots) of the four combinations of G (S506, B133) per SM (L, H) were harvested, totaling 16 pots. The two sorghum plants of each pot were cut together from the base, weighted and chipped to a particle size of 20 mm. Juice was extracted with a hydraulic press at 40 MPa for about 15 min–20 min, until no more juice was released. Juice was quantified and stored at −20 °C in closed plastic vessels. After extraction, stem and leaves constituting the residual bagasse were fresh weighed and oven-dried (40 °C) to conduct compositional analyses. An aliquot of whole plant biomass was oven dried at 105 °C, in order to calculate dry matter content and sorghum dry weight (DW) (g·plant
−1) [
24]. The four replicates of juice and bagasse of each G × SM combination were put together for subsequent analysis and fermentation.
2.3. Juice Fermentation
Juice extracted with the above referred method was submitted to fermentation. Fermentation was conducted in duplicates at 30 °C, using 40 mL juice in 250 mL glass bottles, at pH 5. Bottles were placed in an orbital shaker maintained at 100 rpm during the process. The commercial yeast Ethanol Red (Saccharomyces cerevisiae), provided by Lesaffre (Marcq-en-Baroeul, Roubaix, France), was added at a concentration of 1 g·L−1. Each fermentation lasted 72 h, during which time samples of 1 mL were collected at 2, 4, 7, 9, 12, 24, 48, and 72 h. Each sample was analyzed for juice ethanol concentration ([EtOHJ]) (g·L−1).
2.4. Enzymatic Hydrolysis
Enzymatic hydrolysis was aimed at evaluating bagasse ability to release glucose from cellulose, in response to the investigated factors. Bagasse was dried in a ventilated oven at 40 °C, sieved at 2 mm and stored in ventilated conditions. Enzymatic hydrolysis was carried out in duplicates in 250 mL glass bottles previously sterilized at 121 °C for 20 min, at a solid loading of 5% WIS (water insoluble solid) [
25] with a working volume of 50 mL.
During the process, the bottles were placed in an orbital shaker at 100 rpm. The enzyme CelliCTec2, provided by Novozymes A/S (Bagsvaerd, Denmark), was added at a loading of 0.1 g·g−1 WIS. Hydrolysis lasted 48 h at 45 °C, during which time pH was manually adjusted at 5, using sodium acetate as a buffer. Samples of 1 mL were taken at 3 h, 6 h, 9 h, 24 h and 48 h, and analyzed for glucose concentration (g·L−1).
2.5. Simultaneous Saccharification and Fermentation
Simultaneous saccharification and fermentation (SSF) was performed on dried (40 °C) and sieved (2 mm) bagasse, operating in duplicates in 250 mL glass bottles previously sterilized at 121 °C for 20 min, at a solid loading of 5% WIS with a working volume of 50 mL. During SSF, the pH was maintained at 5 using sodium acetate as a buffer, while the temperature was set at 35 °C. The enzyme Cellic CTec2 (Novozymes A/S, Bagsvaerd, Denmark) was added at 0.1 g·g−1 WIS, while 1 g·L−1 of Ethanol Red S. cerevisiae (Lesaffre, Marcq-en-Baroeul, Roubaix, France) was used as the yeast. SSF lasted 96 h. Samples of 1 mL of broth were taken after 2 h, 4 h, 7 h, 10 h, 12 h, 24 h, 48 h, 72 h and 96 h, and analysed by high performance liquid chromatography (HPLC) for bagasse ethanol concentration ([EtOHB]) (g·L−1).
2.6. Analytical Determinations
Total sugar content in juice (as a sum of sucrose, glucose, and fructose) was determined using HPLC (Waters 1525 Binary HPLC Pump) equipped with a Biorad (Hercules, CA; USA) Aminex HPX-87H column (300 mm × 7.8 mm) and a refractive index detector (Waters 2414). H2SO4 5 mM at a flow rate of 0.5 mL·min−1 was used as the mobile phase; the temperature of the column and detector were maintained at 63 °C and 50 °C, respectively.
Ligno-cellulosic biomass involves the appraisal of extractives, meaning the water- and ethanol-soluble fraction containing inorganic materials, soluble sugars, chlorophyll, waxes, and others minor components. Extractives were determined on bagasse, following the procedure described by Di Girolamo et al. [
26]. Thereafter, structural carbohydrates (cellulose and hemicellulose) and lignin were determined following the National Renewable Energy Laboratory procedures [
27]. Briefly, biomass samples were hydrolyzed in a water bath (150 mg with 1.5 mL of 72%
w/
w of H
2SO
4 at 30 °C for 60 min), then diluted with 42 mL deionized water to reach a final H
2SO
4 concentration of 4%, and autoclaved (121 °C for 60 min). The insoluble residue was separated from the supernatant by vacuum filtration (glass micro-fiber filter Ø 47 mm), washed with 35 mL deionized water, and placed in a crucible. The crucible and glass micro-fiber filter were dried at 105 °C for 12 h, to determine the amount of acid insoluble residue (AIR). Thereafter, they were placed in a muffle furnace at 550 °C for 24 h to determine acid insoluble lignin (AIL).
Monomeric sugars (glucose, xylose, and arabinose) in the supernatant after acid hydrolysis were determined by means of HPLC (Waters 1525 Binary HPLC Pump) equipped with a Biorad Aminex HPX-87H column (300 mm × 7.8 mm) and a refractive index detector (Waters 2414). H2SO4 5 mM at a flow rate of 0.5 mL·min−1 was used as the mobile phase; the temperature of the column and detector were maintained at 63 °C and 50 °C, respectively.
2.7. Calculations
Glucose yield was calculated according to Equation (1), where only the measured sugar concentration is accounted for. This approximation is rather accurate for hydrolysis of diluted fiber suspensions (i.e., WIS < 5−10%) [
28]:
where Y
g is the glucose yield (%); Cg is the glucose concentration at 48 h (g·L
−1);
is the molecular ratio of glucose to glucan (1.11); Cis0 is the initial mass fraction of insoluble solids in total solids; Xg0 is the initial mass fraction of glucan in insoluble solids (g).
Juice- and bagasse-derived ethanol yield and their total (EtOH
J, EtOH
B, and EtOH
J+B, respectively) (g·pot
−1) were assessed as:
Water use efficiency (WUE) of DW, EtOH
J, EtOH
B and EtOH
J+B was assessed through the following equations:
where WUE
DW, WUE
EtOHJ, WUE
EtOHB, and WUE
EtOHJ+B represent WUE (g·L
−1) for the respective amounts (g·pot
−1) of DW, EtOH
J, EtOH
B, and EtOH
J+B; W, the amount of water (L·pot
−1) supplied from seeding to harvest.
2.8. Assessment of Land and Water Needs
Upscaling of EtOH
J, EtOH
B, and EtOH
J+B to a per hectare basis (L·ha
−1) was obtained by proportioning DW and the associated juice and bagasse amounts from pot area (0.038 m
2) to one hectare (10,000 m
2). Reliability of this procedure was proved by the comparison of upscaled DW (average, 23.2 Mg·ha
−1) with DW obtained in field experiments conducted in the nearby experimental farm for three years, resulting in an average 26.9 Mg·ha
−1 for the same two sorghum genotypes [
29].
An 85,000 m
3·yr
−1 ethanol producing plant was envisaged, as the average of two modern plants at ca. the same latitude in Italy (75,000 m
3·yr
−1) and the USA (95,000 m
3·yr
−1), fed by cellulosic biomass like sorghum [
30]. The land area and the total amount of water needed to supply such a plant were calculated for the different combinations of the three investigated factors, based on the respective EtOH
J+B and WUE
J+B. The amount of precipitation covering the crop length in the three respective harvests (232 mm, 268 mm, and 327 mm, based on 30-year data from the experimental farm) was then deducted from the total amount of water. This resulted in the net amount of water to be supplied with irrigation, to meet the needs of the above-referred ethanol plant.
2.9. Statistical Analysis
For all traits, normal distribution and equal variance of data were assessed through the Kolmogorov-Smirnov and Bartlett test, respectively. Sorghum DW, juice, and sugar content, bagasse composition, glucose yield in enzymatic hydrolysis, concentrations and yields of the three forms of ethanol, the respective WUE’s, land and net water needs were submitted to a three-way completely-randomized analysis of variance (ANOVA) for the sources genotype, water level, harvest time and their interactions, through the CoStat 6.3 software (CoHort Software, Monterey, CA, USA). Fisher’s Least Significant Difference (LSD) at p ≤ 0.05 was used to separate means of significant ANOVA sources.
3. Results and Discussion
3.1. Total Dry Weight, Juice and Sugars Content, and Bagasse Composition
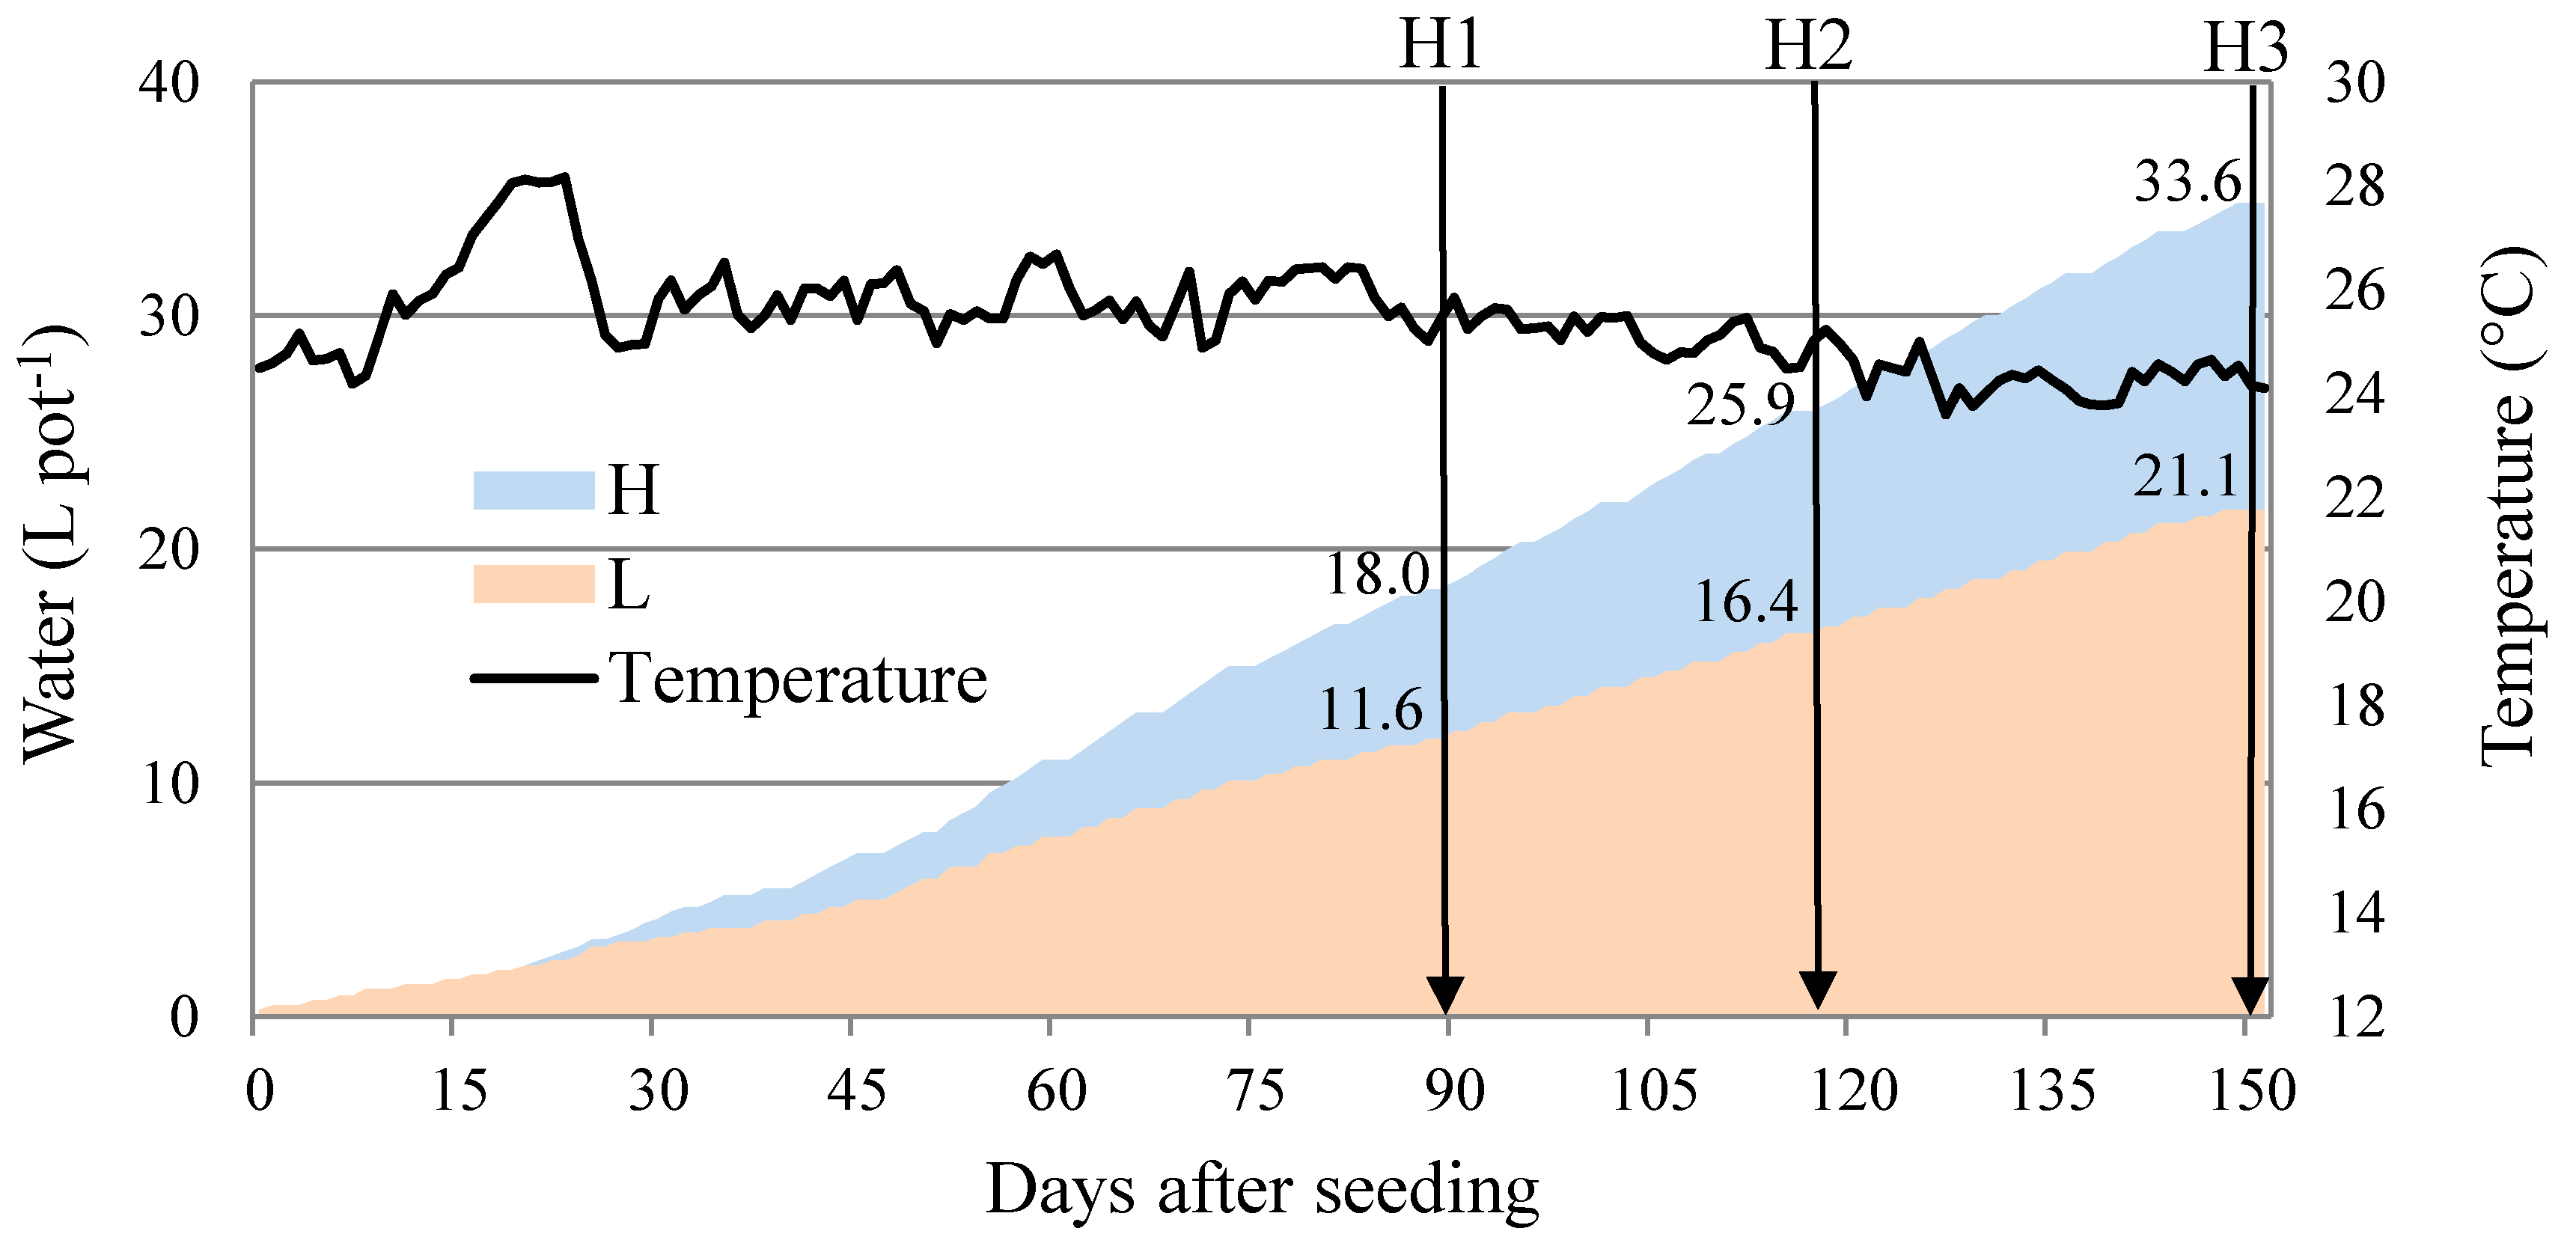
Figure 1 shows the amounts of water supplied under the two soil moisture treatments, and the average daily temperature in the greenhouse during the experiment. Cumulated water progressively increased in the two water levels (30% and 70% soil available water). At the end of the experiment, plants in the high soil moisture treatment consumed 59% more water than in the low treatment (33.6 vs. 21.1 L·pot
−1), as the effect of enhanced transpiration under conditions of abundant moisture.
Growing degree days (GDD) for stem elongation, heading, and soft dough harvest stage were 1170 °C, 1510 °C, and 1882 °C, respectively. Hence, the GDD difference between harvest stages was approximately 350 °C.
The two factors, harvest and soil moisture, determined strong differences in sorghum dry weight and the amount of juice, whereas genotypes did not influence these two traits (
Table 1). Specifically, dry weight benefited from H vs. L soil moisture. Late harvest also influenced dry weight, which is consistent with a longer growth period: dry weight steeply increased from H1 to H2 (+75% in 28 days), and continued to increase up to H3 (+110% in 61 days from H1). However, dry weight increase in the high soil moisture tended to slow at the end of growth (data not shown), as the effect of the significant SM × H interaction.
The amount of juice was not significantly influenced by the two genotypes (
Table 1), whereas juice differences were enhanced by soil moisture (+114% with H vs. L) and, especially, late harvest (+285% in H3 vs. H1). This latter difference reflects an enhancement in sorghum juiciness, which is defined as percent juice extracted from the fresh stem [
4]: juice recovery increased from 21% fresh stem in H1 to 37% in H3.
Despite a similar amount of juice between the two genotypes, S506 contained more sugars (+26%) than B133 (
Table 1). Remarkable increases in the amount of sugars were also observed with H vs. L soil moisture (+133%), and with H3 vs. H1 (+273%). In the case of soil moisture, the increase reflects a higher concentration of sugars, besides a higher amount of juice. Conversely, in the case of late harvest, the increase was entirely driven by the increased amount of juice.
Bagasse (
Table 1) showed a composition of the sweet genotype (S506) more suited for ethanol production, thanks to higher extractives and lower structural components (cellulose, hemicellulose, and AIL). The high soil moisture augmented cellulose and AIL, to the detriment of extractives. Lastly, the shift from first to third harvest determined the increase of fiber components and a concurrent decrease of extractives. This is consistent with the progressive ageing of plants passing from stem elongation (90 DAS) to the soft dough stage (151 DAS) in about two months.
Large compositional differences are reported in the literature, depending on the ample variation in sorghum morphology and use. A major role is played by the kind of biomass actually used for ethanol production, which varies from the straw of grain sorghum [
31], to the full plant of forage sorghum [
32], to sweet sorghum stem [
33] and bagasse [
32]. The closest case to ours [
32], also in terms of analytical procedures [
27], outlined a similar composition: slightly higher extractives (+8%) and lower lignin (−14%), and analogous contents of cellulose and hemicellulose.
Compositional differences determined by harvests are consistent with those observed by Zhao et al. [
33], whereas changes driven by soil moisture, which reflect stronger plant structure under adequate moisture, are not echoed in the literature. In other works [
6,
10], adequate moisture resulted in a more advanced growth stage. However, this last effect was not observed in our experiment, as the two soil moisture treatments featured similar sorghum stages during the whole experiment.
3.2. Ethanol Production from Juice Fermentation
Concentration and amount of ethanol obtained from juice fermentation were influenced by all three investigated factors (
Table 2). S506 was shown a better performer than B133, thanks to a higher ethanol concentration in the intermediate and late harvest (significant G × H interaction; data not shown). This determined increased amount of EtOH
J for S506 vs. B133 in the average (+32%), and especially in H3 (+58%; data not shown). Given a very similar amount of juice in the two genotypes, S506 advantage lay in a higher amount of fermentable sugars (+26%) (
Table 1).
Soil moisture strongly influenced both concentration and amount of EtOH
J (
Table 2). In particular, high soil moisture determined a 21% increase of ethanol concentration in the average of the three harvests. In combination with the wide differences in juice quantity (
Table 1), this determined a 179% increase in the amount of EtOH
J with H vs. L soil moisture (
Table 2). This gap widened in the late harvest (data not shown), which is consistent with the significant SM × H interaction.
On average, ethanol concentrations were in the low range compared to other authors [
6,
18], although in our experiment sweet sorghum attained concentrations (ca. 30 g·L
−1) similar to those obtained by Zegada-Lizarazu and Monti [
34] with the same genotype (S506) grown in field plots. A strong increase in the amount of EtOH
J (+84%) was estimated by Dalla Marta et al. [
11] in sweet sorghum under high vs. low (100% vs. 50%) soil moisture. Conversely, in the cited source no benefit was achieved from late harvesting (DAS 169 vs. 130), indicating a plateau in sorghum growth between the two harvests. Compared to this, in another source [
33], the combined effect of increased biomass and sugar concentration in 40 days after anthesis determined a 95% increase in estimated ethanol yield, in the average of five sweet sorghum genotypes. A strong variation is, therefore, evinced in the effects of the two factors soil moisture and harvest time, depending on non-univocal circumstances.
3.3. Enzymatic Hydrolysis
Glucose yield in enzymatic hydrolysis (
Table 2), calculated with Equation (1) and expressed as the percent of the theoretical maximum, was not influenced by the two factors genotype and soil moisture, whereas it decreased by an approximate 10% at each succeeding harvest. Glucose yield was generally higher than in the study of Zhang et al. [
35]. This could be due to the lower WIS concentration adopted in our experiment, given the fact that high WIS concentration affects enzymatic activity, resulting in decreased yield [
28,
36]. The study carried out by Goshadrou et al. [
37] corroborates this hypothesis: a glucose yield (65%) very close to ours was obtained in sweet sorghum bagasse, running enzymatic hydrolysis at a similar WIS concentration. In our study, no difference in glucose yield was observed between the two genotypes and water levels, whereas the three harvests depicted a decrease from 73% in H1 to 60% in H3.
The parallel increase of AIL (
Table 1) supports the assumption that lignin directly acts as a physical barrier, restricting cellulase access to cellulose, and reducing this enzyme’s activity through non-productive binding [
38]. As Corredor et al. [
17] observed, biomass suitability for ethanol not only depends on cellulose content, but also on physical and chemical properties, such as lignin cross-links with cell wall carbohydrates. This is due to secondary cell walls, i.e., those deposited once cell elongation ceases, which are usually thicker than primary walls, and multi-layered [
39]. More to this, water is largely replaced by lignin in secondary cell walls, sealing them from solutes and enzymes [
39]. The progressive decrease of glucose yield from H1 to H3 observed in this experiment (ca. −10% at each succeeding harvest) is consistent with the strengthening of the cell wall structure described in the cited source.
3.4. Ethanol Production from Bagasse Simultaneous Saccharification and Fermentation
Ethanol concentration at the end of SSF was not influenced by genotypes, whereas it was slightly, but significantly, higher in the H vs. L soil moisture (
Table 2). Likewise, the early harvest exhibited higher ethanol concentration than the intermediate and the late harvest, which is consistent with the time trend in enzymatic hydrolysis. Overall, fermentation efficiency, i.e., the percent cellulose that becomes ethanol after SSF, declined from 57% in H1 to an average 46% in H2 and H3 (data not shown). Modest differences were, conversely, evidenced by genotype and soil moisture treatment. This is in good agreement with the efficiency shown in enzymatic hydrolysis.
In this experiment, bagasse-derived ethanol attained a modest concentration (~4 g·L
−1), due to the fact that bagasse was not subjected to pretreatment, in order to more precisely evaluate the genotype, soil moisture, and harvest effects on SSF. Higher EtOH
B concentration (almost 30 g·L
−1) was shown in another experiment [
32] with sorghum bagasse subjected to ammonia fiber expansion. However, such a strong pretreatment could likely overcome the effects of the three investigated factors. Thus, owing to the fact that pretreatments were not the focus of this work, their evaluation was not pursued in this work.
Bagasse-derived ethanol production was not influenced by genotypes (
Table 2), as a consequence of a similar amount of bagasse and ethanol concentration during SSF. Conversely, the amount of EtOH
B steeply increased upon H vs. L soil moisture (+85%), and in the three harvests: +50% and +85% in H2 and H3, respectively, compared to H1. Hence, opposite time trends were observed in EtOH
B concentration and quantity. It is, therefore, evidenced that plant ageing and concurrent decline in bagasse properties were counter-balanced by a more than proportional increase in the amount of bagasse.
3.5. Combined Ethanol Production
Bagasse-derived ethanol production constituted the largest fraction in the total amount of ethanol (average, 79%) (
Table 2), supporting the drive towards combined ethanol production from sugar- and fiber-rich substrates in the current debate on bio-energy.
S506 produced significantly more EtOHJ+B than B133 (+9%) thanks to a more efficient fermentation, i.e., higher EtOHJ concentration, despite no significant difference in EtOHB concentration and quantity. Combined ethanol production was strongly enhanced by H vs. L soil moisture (+99%), which was due to the higher amount of sorghum dry weight, juice, and sugars produced under non-limiting moisture. Lastly, the amount of EtOHJ+B followed the same time trend of EtOHJ and EtOHB, increasing by a respective 64% and 107% in the intermediate and late harvest, compared to the early harvest.
The significant SM × H interaction in EtOH
J+B (
Table 2) indicates that the gap between the two soil moisture treatments became narrower at the end of growth (data not shown), which is consistent with the slowing of sorghum growth under high moisture.
It should be considered that water for irrigation is a limited, costly, and debated resource as regards energy crops, whereas extending the crop cycle to reap extra productivity involves no added cost. Hence, this latter appears a more feasible and sustainable option, intrinsically.
3.6. Water Use Efficiency
The concern for efficient allocation of the water resource drives the assessment of water use efficiency, i.e., the productivity of water in terms of biomass (WUEDW) or energy carriers as final products (WUEEtOH).
No difference in WUE
DW was observed between sweet and fiber genotypes, while soil moisture (H vs. L) and harvest (H3 vs. H1) determined a similar increase (~15%) (
Table 3). However, the gap in WUE
DW between the two soil moisture treatments became negligible in late harvest (
Figure 2a), in accordance with the significant SM × H interaction. The range of WUE
DW is consistent with studies on biomass sorghum carried out in both plots [
3,
5], and pots or lysimeters [
13,
40].
The comparison of WUE
DW in genotypes of biomass sorghum is a topic not specifically addressed in the literature. In general, the wide intra-specific variation is exploited in breeding, in view of releasing genotypes at improved WUE. Studies on plant physiology help to detect genotypic differences in biomass sorghum [
41,
42,
43], providing the grounds for the identification of valuable traits for breeding.
Increases in WUE
DW under adequate vs. poor moisture have already been echoed in the literature [
9,
11,
43], although in some works WUE
DW peaked at medium-low watering, then decreased at high water supply [
5,
44]. This diverging behavior has already been remarked [
43] as proof of the fact that sorghum can make the most efficient use of water when available moisture is at intermediate level.
Water use efficiency for the combined ethanol production (WUEEtOHJ+B) covers the two components, WUEEtOHJ and WUEEtOHB, the latter representing an average 80% of the combined trait. WUEEtOHJ+B was influenced by all three investigated factors. S506 exhibited a 7% higher value than B133, resulting from a higher WUEEtOHJ. High soil moisture achieved a 28% better WUEEtOH1G+2G than low soil moisture, thanks to increases in both components. Lastly, the intermediate and late harvest staged an average 14% increase in WUEEtOHJ+B with respect to the early harvest. This result was, once more, due to the WUEEtOHJ component.
The significant SM × H interaction (
Table 3) indicates a much reduced gap between H and L soil moisture in the late harvest (
Figure 2b). It is thereby demonstrated that extended growth surrogates the effect of water in supporting WUE, due to a reduced efficiency in well-watered plants approaching senescence.
In another experiment [
11], WUE
EtOHJ+B of sweet sorghum evidenced a certain increase (+22%) at high vs. low soil moisture. However, in the cited work EtOH
J+B was calculated with formulas instead of actual determination through juice fermentation and bagasse SSF, and the average data (0.48 g·L
−1) resulted quite higher than in our experiment (0.34 g·L
−1). To our knowledge, no other work in the literature specifically addressed WUE of the final energy carrier, ethanol from juice fermentation, and bagasse SSF.
3.7. Land and Water Needs
Based on the EtOH
J+B and WUE
EtOHJ+B data, the amount of land needed to supply an 85,000 m
3·yr
−1 second-generation ethanol plant resulted in an average 43,000 ha of biomass sorghum. This, in turn, involved an average 92 Mm
3 of irrigation water to achieve the goal. However, both figures greatly varied depending on the investigated factors. The two genotypes determined minor differences: −4% land and −7% water with S506 vs. B133. Conversely, soil moisture and harvest time played a major role, especially in the case of the SM × H interaction that was significant for both traits (ANOVA not shown). Based on this, the amount of land and irrigation water are depicted as function of harvest time (DAS) and net water supply (mm), this latter being the irrigation level applied to the single hectare of biomass sorghum (
Figure 3). The land area varied from a minimum of 21,000 ha when irrigating with ca. 550 mm and harvesting at soft dough maturity (151 DAS), to a maximum of 82,000 ha when irrigating with ca. 70 mm and harvesting at stem elongation (90 DAS) (
Figure 3a). Likewise, the irrigation water varied from a minimum of 60 Mm
3 when supplying ca. 70 mm and harvesting at stem elongation (90 DAS), to a maximum of 117 Mm
3 when supplying ca. 550 mm and harvesting at soft dough maturity (151 DAS).
It was shown that land and water needs were inversely related (
r = −0.73 **), thus savings in either factor determined extra needs of the other factor. This leads to a variable strategy in the management of the sorghum crop, depending on which of the two factors, land or water, is in shorter supply. Biomass sorghum is suited for warm-temperate areas with limited precipitation in the summertime, as the Mediterranean North zone where the experiment was located [
45]; thus, savings in irrigation water appear a top priority. However, this involves a parallel increase of the land surface dedicated to a bio-energy plant, to the detriment of other crops cultivated in the supplying basin. Compared to this, late harvest to achieve full yield potential involves no added cost, provided that biomass can be stored with appropriate methods (e.g., ensiling) in an infrastructure large enough to feed the ethanol plant for most parts of the year. Hence, there is no univocal solution to the dilemma of how to manage the sorghum crop, and intermediate options may be envisaged as those best suited, depending on local conditions.
To our knowledge, no other work in the literature has specifically addressed the effect of variable cropping factors, as sorghum genotype, soil moisture regime and harvest time, on land and water needs at a full ethanol plant scale.
Nevertheless, these results need to be dealt with cautiously, for prospecting land and water use in the exploration of scenarios. Further data will be needed at the field level to corroborate our results that rely on the comparison between a controlled environment (greenhouse) and the open field.
Similar issues are echoed in the literature, as indirect land use change associated with ethanol production from sugar cane in Brazil [
46], additional land use from wheat grain ethanol in the EU [
19], and implications of cellulosic ethanol production on regional water resources in the Southern U.S. [
20]. In this last source, it is worth noting that sweet sorghum consistently proved a better performer in terms of land, N fertilization, and water need over maize, sugar cane, and southern pine. This example further supports our insight into the sorghum crop to assess combinations of cropping factors at variable impacts on the land and water resources.
4. Conclusions
Two representative genotypes of biomass sorghum (sweet vs. fiber sorghum), displayed a different potential in ethanol production, despite a similar amount of biomass and juice. The sweet sorghum earned a 9% gain in combined ethanol production, in the average of soil moisture levels and harvest times.
In late vs. early harvest and high vs. low soil moisture, bagasse showed a decrease of extractives and concurrent increase in all fiber components, which are the premises for lower glucose yield in enzymatic hydrolysis. However, the amounts of both juice- and bagasse-derived ethanol were greatly enhanced by late harvest and high soil moisture, thanks to a strong increase of sugar concentration, juice, and bagasse amounts offsetting lower ethanol concentration in fermentation and SSF.
Water use efficiency referred to the combined ethanol production portrayed the combination of sweet sorghum, late harvest, and low soil moisture, as that fetching a reasonable efficiency in exchange for a remarkable saving (59%) in the amount of water, compared to high soil moisture. These findings translate into a variable amount of land and water needed, prospectively, to supply biomass for a modern ethanol plant (85,000 m3·yr−1): basically, more crop land is needed to save irrigation water, and vice versa, whereas sweet sorghum consistently maintains a modest competitive edge over fiber sorghum.
Further studies are, nevertheless, needed to corroborate the experimental findings and the subsequent upscaling, in view of more efficient bio-ethanol production.


 ,
, 


