1. Introduction
The use of solar photovoltaic (PV) electric systems is growing rapidly in the sustainable renewable energy market and is expected to play an important role in the future sustainable energy mix [
1,
2]. On the other hand, the initial capital cost of the PV modules and systems has always been a major barrier to the widespread use of this technology over the globe. The initial price of solar PV systems can be reduced by producing more power with the same PV module. The PV module’s power output can be increased by increasing the incident solar radiation falling on a PV module according to the inherent characteristics of the PV cells. The distribution of solar radiation is not constant throughout a day. The Sun changes its position from morning to evening and its locus fluctuates throughout the year. A fixed installed solar panel with no Sun tracking system cannot provide high output power. Single and dual axis solar trackers have been proposed for this purpose. On the other hand, installing a tracking system not only increases the initial cost of the solar PV system as a number of motorized components are required, but also it reduces the life of the mechanical design of a solar PV system frame because it will require a movable and adjustable structure. In addition to these drawbacks, the energy required for these motors to move the solar PV system is also a problem. The power supply requires an energy storage system and power converter system for smooth operation of these motorized tracking systems. Moreover, the installation of a motorized solar tracking system is impractical for a solar grid connected on large scale commercial solar PV projects because of its initial cost operation and maintenance and net low output power enhancement.
Previous studies reported that the intensity of solar radiation can be increased with a planar reflector system [
3]. These reflectors will reflect light on the solar panel to enhance the electrical power output. Concentrating mirror booster technology is attracting increasing attention. The low cost and abundant availably make this option the most desirable. Nevertheless, inexpensive and cost effective solutions are required to make their installation more practical.
The initial focus of the solar thermal system was the output of a solar cell during winter [
4,
5,
6]. Some researchers found that the alignment and placement of solar panel at high latitudes with a vertical collector with a horizontal reflector [
7]. Ray tracing models were also studied to calculate the increase in irradiation for a given reflector geometry [
7,
8,
9,
10]. Among these models, some apply diffuse reflectors that use a combined view factor and specular reflectance mode [
11,
12], whereas some analyzed the 2-D specular reflectance model and some used experimental data [
7,
10,
13,
14]. A future suggestion regarding the introduction of non-specular corrugated booster reflectors enhances the results by up to 8% and bidirectional reflectance function (BDRF) of these corrugated material is also noticed [
12]. Enhancing radiation may improve the temperature of a PV module when the power and efficiency of the PV cell is decreased. Studies have shown that the efficiency of an amorphous silicon cell decreases by 0.05% with every 1 °C temperature increase and in the case of a crystalline silicon solar cell, the decrease ranges from 0.4% to 0.5% [
15]. A cooling system can enhance the performance of solar systems. Currently, the challenge for a solar PV system is to design a cost effective cooling system.
Different solutions have been proposed to decrease the operating temperature of a PV panel. S. Dubey calculated the dependence between the conversion efficiency and temperature of PV cells [
15]. A hybrid photovoltaic/thermal solar system is a reliable method for cooling the PV panels [
16]. In this system, the PV panels are attached to the cooling system. Water or air, which is used as cooling agents, is circulated around the PV panel to cool the solar cells. The key factor of this system is that the warm water coming from around the solar panel can be used for domestic use. In addition, a previous study [
17] proposed a cooling model, in which water and air were both observed as cooling agents. The performance of water as a cooling agent is higher than air used as a cooling agent. The high performance of water is due to the increase in the glazing area of water. Similarly, air and passive cooling for improving the temperature of photovoltaic panels was assessed [
18].
Computational fluid dynamics (CFD) was also used to examine the effects of air flow on the output of PV panels [
18]. In this model, air flows under the panels to increase cooling by natural convention. The efficiency of cooling depends mainly on the geometry and construction of the solar energy system. Another system for improving the panel efficiency was based on water as a coolant, in which two solar panel prototypes, one sprayed with water and other without spray, were compared [
19]. The performance of the solar panel with water spray was higher than that of the un-sprayed but this method result in very high water consumption.
A micro-heat pipe array was designed for solar panel cooling [
20], which consisted of evaporator and condenser. The cool water in the evaporator section is vaporized by the input heat from the sun, which is then passed to a condenser section that is cooled using water or air. Therefore, the heat from the solar panel is transferred to air or water. The analysis showed that using water as a cooling agent decreases the temperature by 8 °C and increases the efficiency by 3%. In the case of air, the temperature was decreased by 4.7 °C and the efficiency was enhanced by 2.6%. Therefore, water is more effective as a cooling agent [
21].
Air cooling for photovoltaic panels was reported [
22]. A ventilated channel, 0.1 m in width behind each photovoltaic panel was used for cooling. Thus, a photovoltaic/thermal (PV/T) system was used, which is the most feasible solution for cooling photovoltaic panels with the added advantage of producing thermal energy. This feature is more important because it generates two main sources of energy: electricity and heat. The best function of each source benefits each other [
23]. Numerically, the temperature variations have also been studied.
Overall, there are different methods to cool solar PV systems and the use of reflectors can increase the output power of solar PV system considerably. Most cooling systems operate on some kind of water pumping system. The operation of this type of cooling system requires electrical power, which can be drawn from the solar PV system. This reduces the effectiveness of the cooling system to increase the solar PV system efficiency. Furthermore, the cost of solar PV systems increases. Continuous operation of this cooling system requires considerable electrical energy.
This paper examined the design of low cost cooling with an optimal operating mechanism but there have been no studies on how much this will affect the solar PV temperature, and long- performance. In addition, the designs discussed in this paper are impractical for commercial purposes. This study performed real-time experiments and comparative analysis of different cooling methods proposed in the literature to integrate it with the proposed reflector materials and its effects on the output power of a solar PV system were examined. This study assessed three different solar reflector systems. The aim was to find an optimal material with the best design for future commercial amorphous and crystalline silicon solar PV systems. In addition, this research assessed an optimal way to operate a solar PV system with the proposed BRPVS and cooling system. The heating rate model and BRPVS were based on the operating conditions, i.e., solar radiation, ambient temperature, and solar PV position.
The remainder of the paper is organized as follows: an overview of the proposed reflector systems and cooling techniques studied in this paper is given in
Section 2.
Section 3 presents the experimental setup.
Section 4 and
Section 5 discuss the experimental results and conclusions, respectively.
2. Materials and Methods
Three very inexpensive reflective materials were addressed for economical and high output power solar PV systems. The first material used was aluminum foil, which is a very thin sheet of aluminum ranging from about 0.006 mm to the upper ISO defined limit of 0.2 mm (200 µm). To prevent oxidation, the aluminum oxide layer is added on top of Al during manufacturing process of Al foils. Aluminum foil is produced from cast ingots that are rolled to the required thickness using a beta radiation sensor. According to the radiation intensity, it rolls the sheet and the roller adjusts the thickness.
Table 1 lists the common properties of Al foils.
Silvered glass mirror is the second material to be used as a reflector to enhance the output power of the solar panel. From all available shapes, a plane and convex spherical silvered glass mirror were chosen. Silver nitrate was used to manufacture the mirror. Silvered coated glass mirror has many properties that help to improve the efficiency, such as ease of fabrication, rigidity, hardness, and ability to take a smooth finish. For more protection, the reflective coating has applied the back side of glass. A beam of light reflects off a mirror at an angle of reflection equal to its angle of incidence, i.e., if the beam of light is shining on a mirror surface at a vertical angle, it reflects from the point of incidence at an angle in the opposite direction [
25,
26]. A convex mirror helps scatter the beam of light.
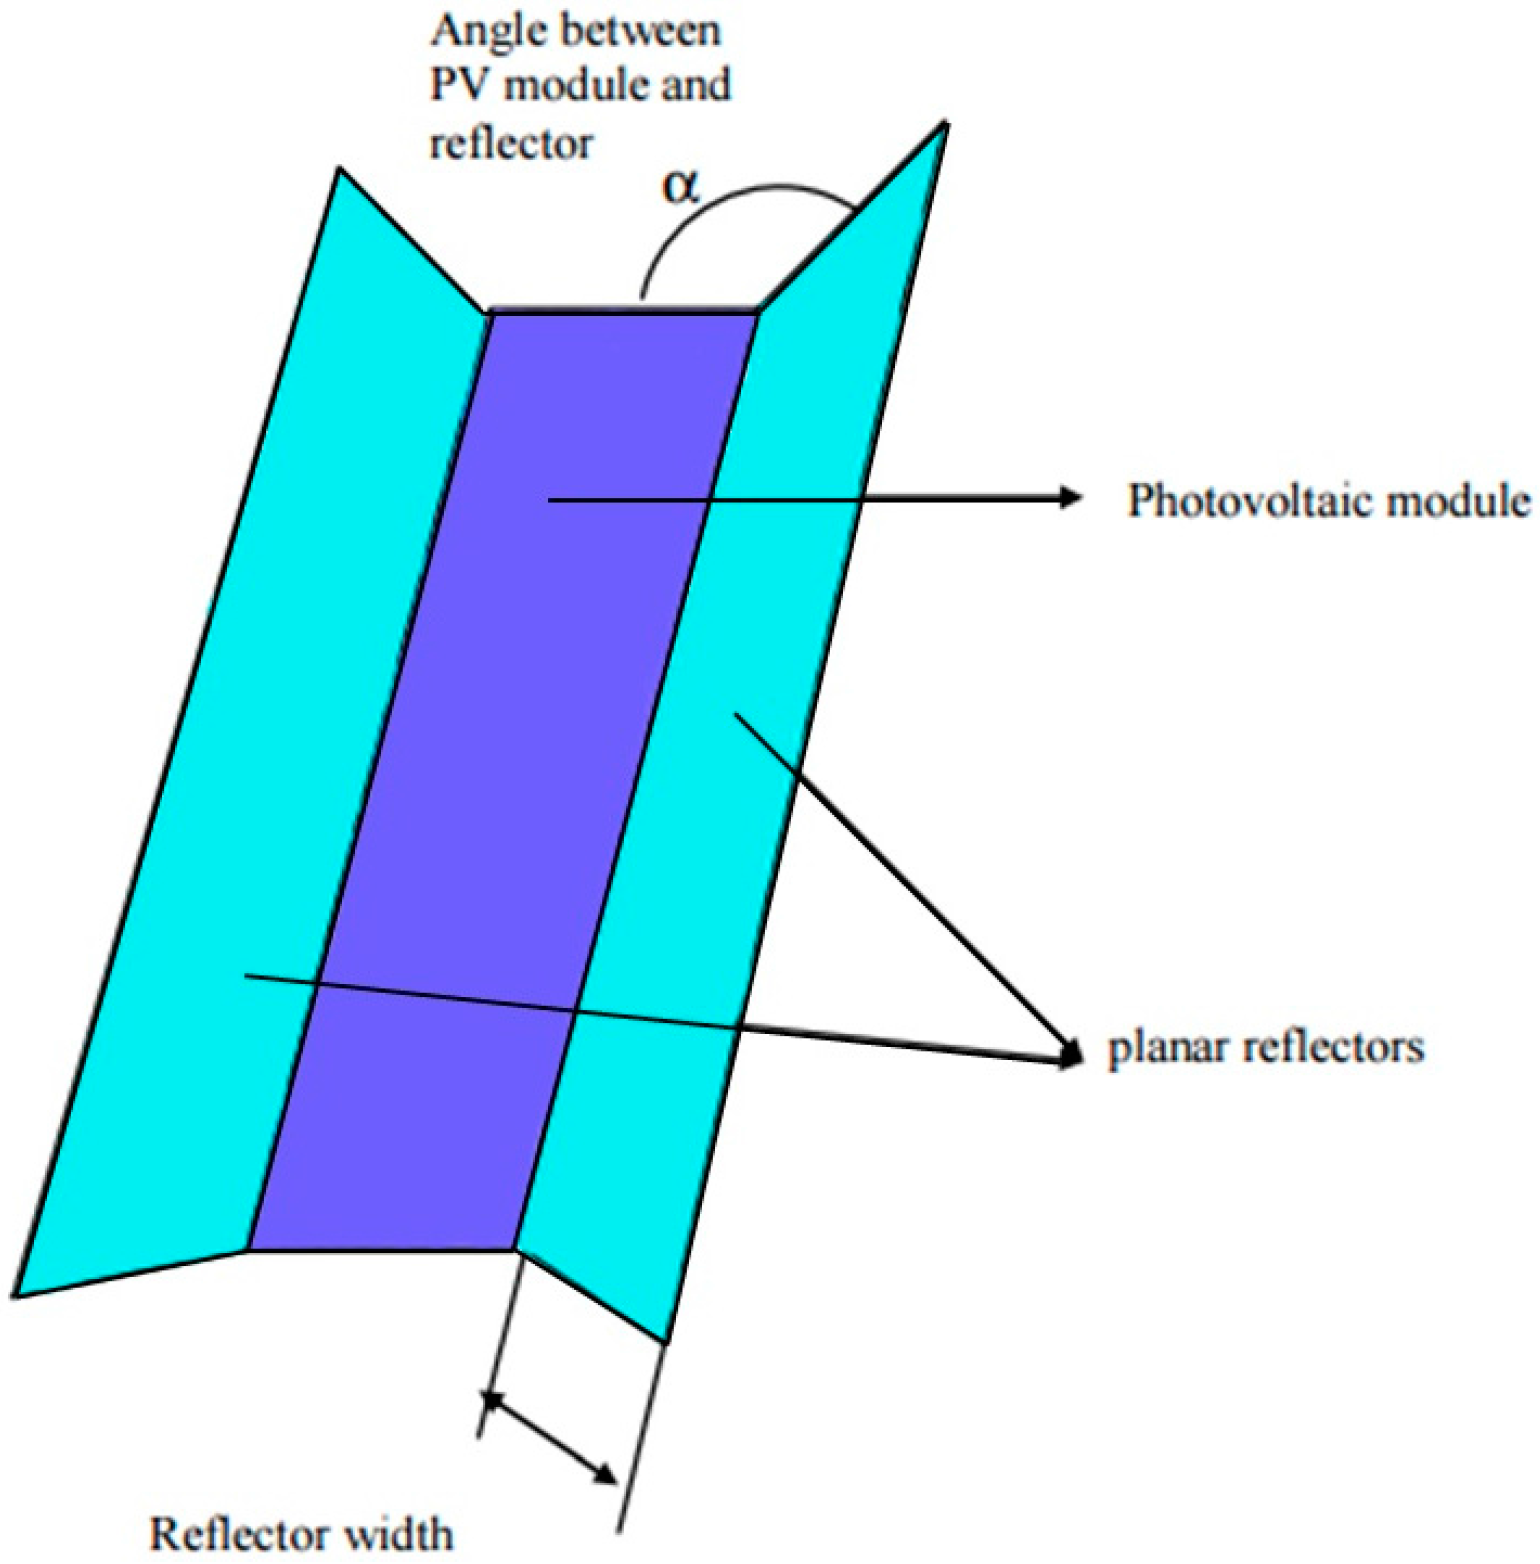
Figure 1 presents an overview of the reflectors with an attached solar PV module discussed in this paper.
2.1. Electrical Modeling
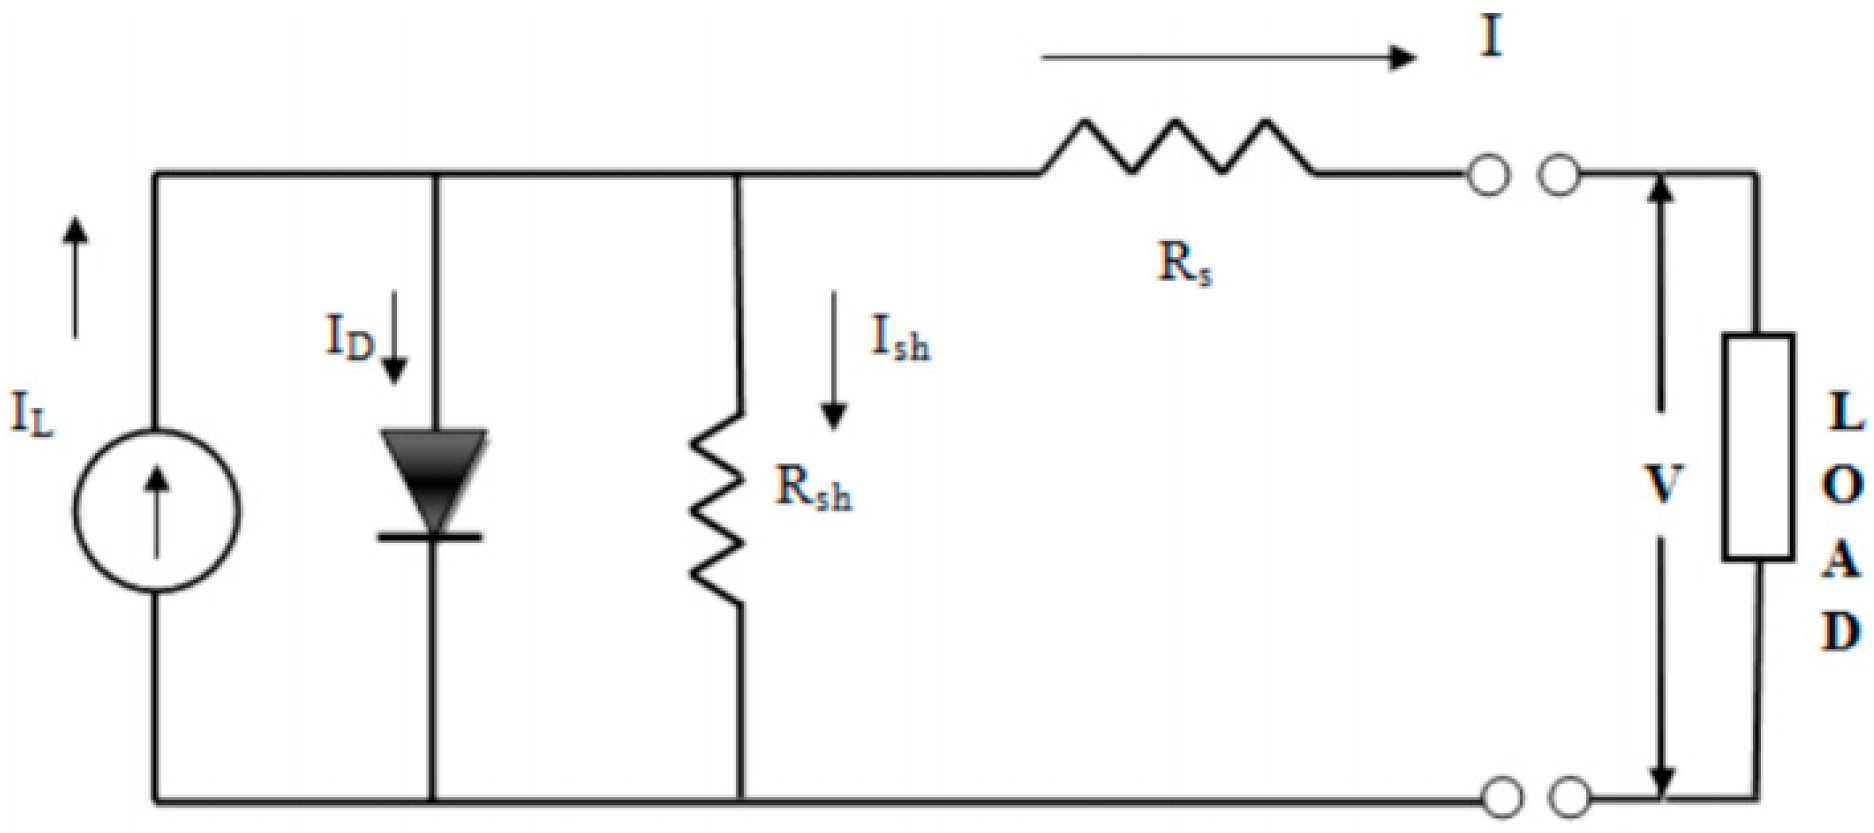
BRPVS can be modeled by its equivalent electric circuit. Solar cells are replaced with a current source with a photo-generated current
IL with a p-n junction diode connected in parallel. This also has a parallel resistance,
, and series resistance,
, as shown in
Figure 2.
At a constant temperature and solar irradiance, the V-I characteristics of the proposed model can be given using the following relation:
The resistances represent the external behavior of the model. Values for important parameters (
and
) for modeling PV module with BRPVS can be estimated by using conditions in
Table 2 [
27].
By applying all five conditions into Equation (1), the following equations are obtained [
3]:
The maximum power output (MPP) can be obtained MPP current (
) and voltage (
) using relation:
In estimating the PV module performance, the temperature dependence of the maximum power point efficiency is an important parameter and is given by the following:
2.2. Optical Modeling
The proposed BRPVS can be modeled easily by considering the conventional optical geometry approach. The total solar radiation (
) absorbed by the BRPVS system is equal to the sum of direct radiation (
) on the PV surface, the ground reflected radiation (
), the sky-diffuse radiation (
), the reflected radiation from the right reflector (
) to the surface of the PV panel with a tilted plane angle,
α1 and the radiation reflected from the left reflector (
) to the PV panel with a tilted plane angle
α2 [
28]:
A previous study [
29] discussed the BRDF (Bidirectional Reflectance Function) for optical modeling of a solar PV system with a reflector. Reference [
30] presents an integrative method in the analysis, where the contribution of irradiation to a differential point on the PV module (
dx) from each differential scattering element on the reflector (
dy) in the direction of dx is calculated. Therefore, to determine the total solar irradiations on the surface of the module, integration was performed along the two principle directions of the array,
x and
y. Equation (10) shows energy incident on the surface of the module (
) that is impacting the plane reflector at point
dx:
Equations (11) and (12) shows the value of the reflected radiant intensity per unit depth through a differential angle (
) and the radiant intensity per unit depth that strikes the surface of the module (
) respectively [
31]:
Equation (4) is defined in terms of the angle of incidence (
) of the differential ray onto the surface of the module and the distance the ray has travelled [
31]:
Equations (10)–(14) can be combined and integrated along the characteristic dimensions, and multiplied by the depth of the module being analyzed (A
module). Irradiance (W/m
2) on the surface of the module due to reflection (
) can be calculated using relation [
31]:
where
is the area of module,
is the spectacularly constant surface reflectivity, and
angle between incoming ray and reflector surface.
2.3. Proposed Cooling Techniques
The performance of PV modules is generally specified under standard test conditions (STC); however, the performance of the modules under real field conditions differs from the expectations derived from the STC results due to a variety of continuously changing conditions, so it is important to monitor PV module behavior under real field conditions at temperatures higher than the defined STC ambient temperature (25 °C). PV module temperature increases make the band gap of the intrinsic semiconductor shrink, and as a result the open circuit voltage (Voc) decreases. At the same time, a lower band gap allows more incident energy to be absorbed because a larger percentage of incident light has sufficient energy to raise charge carriers from the valence band to the conduction band; a larger photocurrent results. As the temperature is raised, however, the internal resistance of the material increases and the electrical conductivity decreases. The current increase for a given temperature rise is proportionally lower than the voltage decrease. Hence, the cell efficiency is reduced. Cooling systems are needed to reduce the temperature and increase the efficiency of solar PV modules. Based on a literature survey and previous work, the following four cooling techniques were compared to achieve the most effective cooling system for a solar PV system.
2.3.1. Passive Air Cooled System
A passive air cooled system for solar panels involves the installation of heat sinks on the rear side of solar panel. Heat sinks transfer thermal energy from the higher temperature rear side of a solar panel to the lower temperature surrounding air. For the effective utilization of heat sinks, the solar panel temperature must be higher than the surroundings to transfer heat by convection, radiation, and conduction [
25]. Heat transferred by a heat sink can be explained by Fourier’s heat conduction law. The rate at which heat is transferred by conduction (
) is proportional to the product of the temperature gradient (
) and the cross-sectional area through which heat is transferred:
Applying the conservation of energy, for steady-state conditions, and Newton’s law of cooling to the temperature node of heat sink in a duct gives the following two equations:
where
is the air mass flow rate in kg/s.
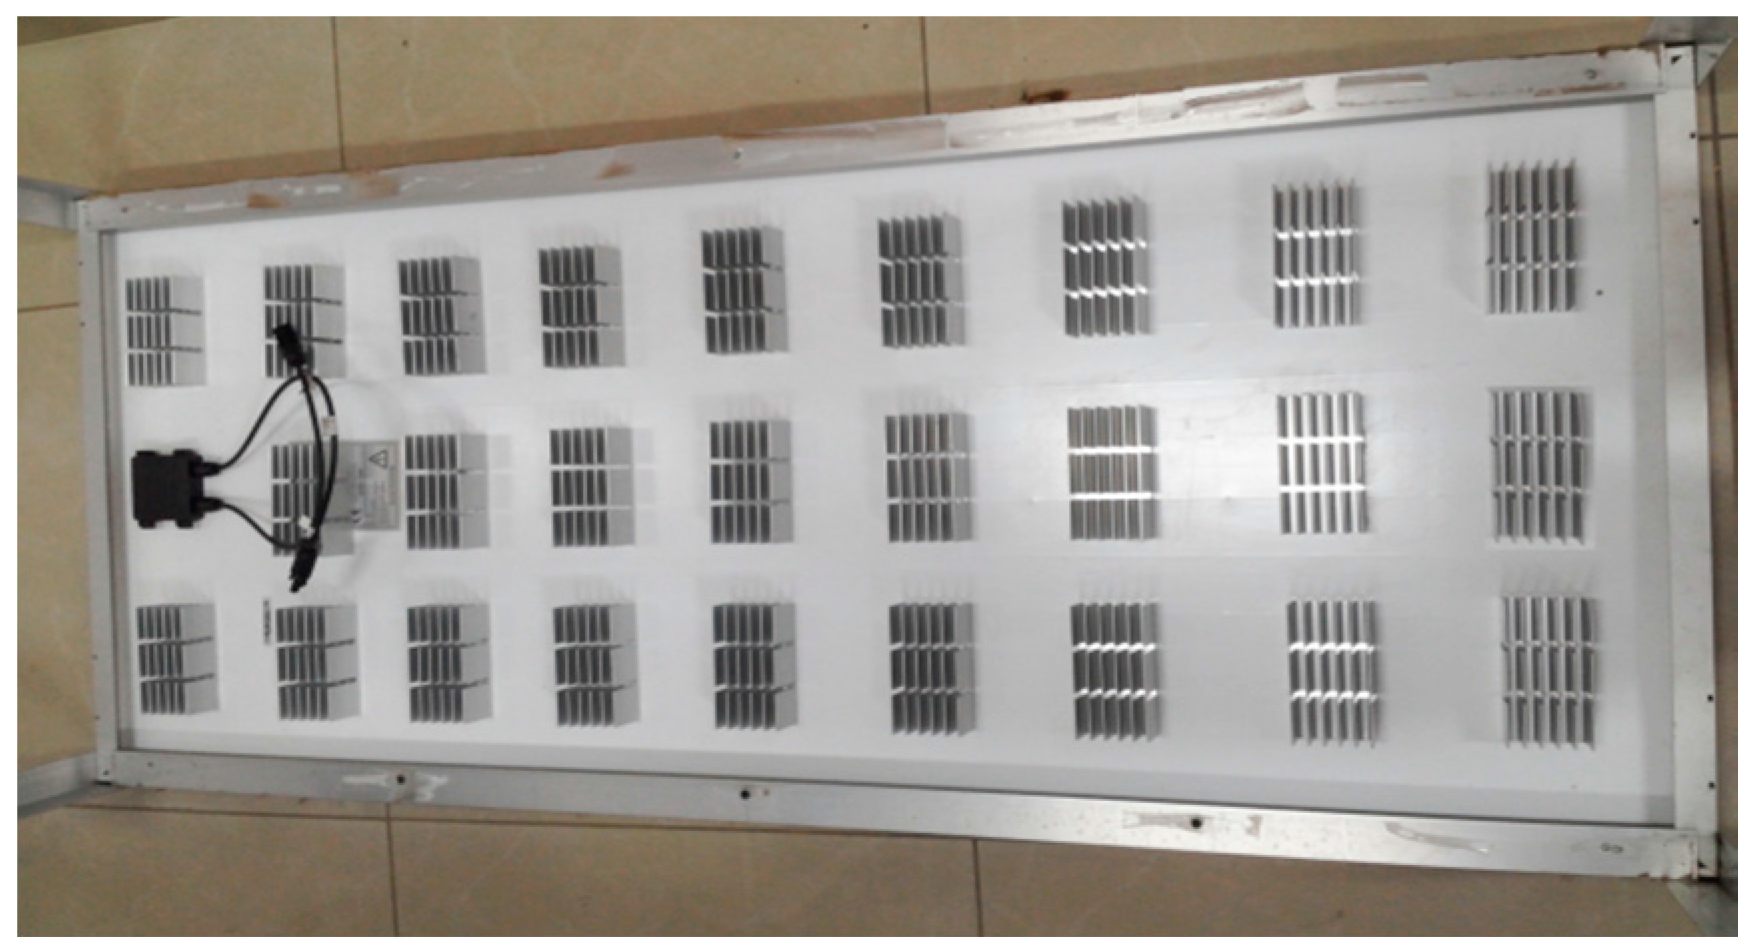
The fin efficiency is one of the parameters that make a higher thermal conductivity material important. The fin efficiency is increased with decreasing fin aspect ratio (making them thicker or shorter), or by using a more conductive material (copper instead of aluminum). Many shapes exist in the literature, ranging from elliptical and cylindrical cylinders, conical shapes to more sharpened surfaces, such as a rhombus. Square sections were used with a base thickness in the 5 mm range and a fin height of 45 mm with an air spacing of 5 mm. To utilize the heat sink, an optimal and cost-effective array of the heat sink was arranged as shown in
Figure 3. The heats sinks were attached to the rear side of the solar panel. A total number of 26 heat sinks were used for a 150 Watt solar panel with an area of 0.991 square meters.
2.3.2. Closed Loop Water Loop System
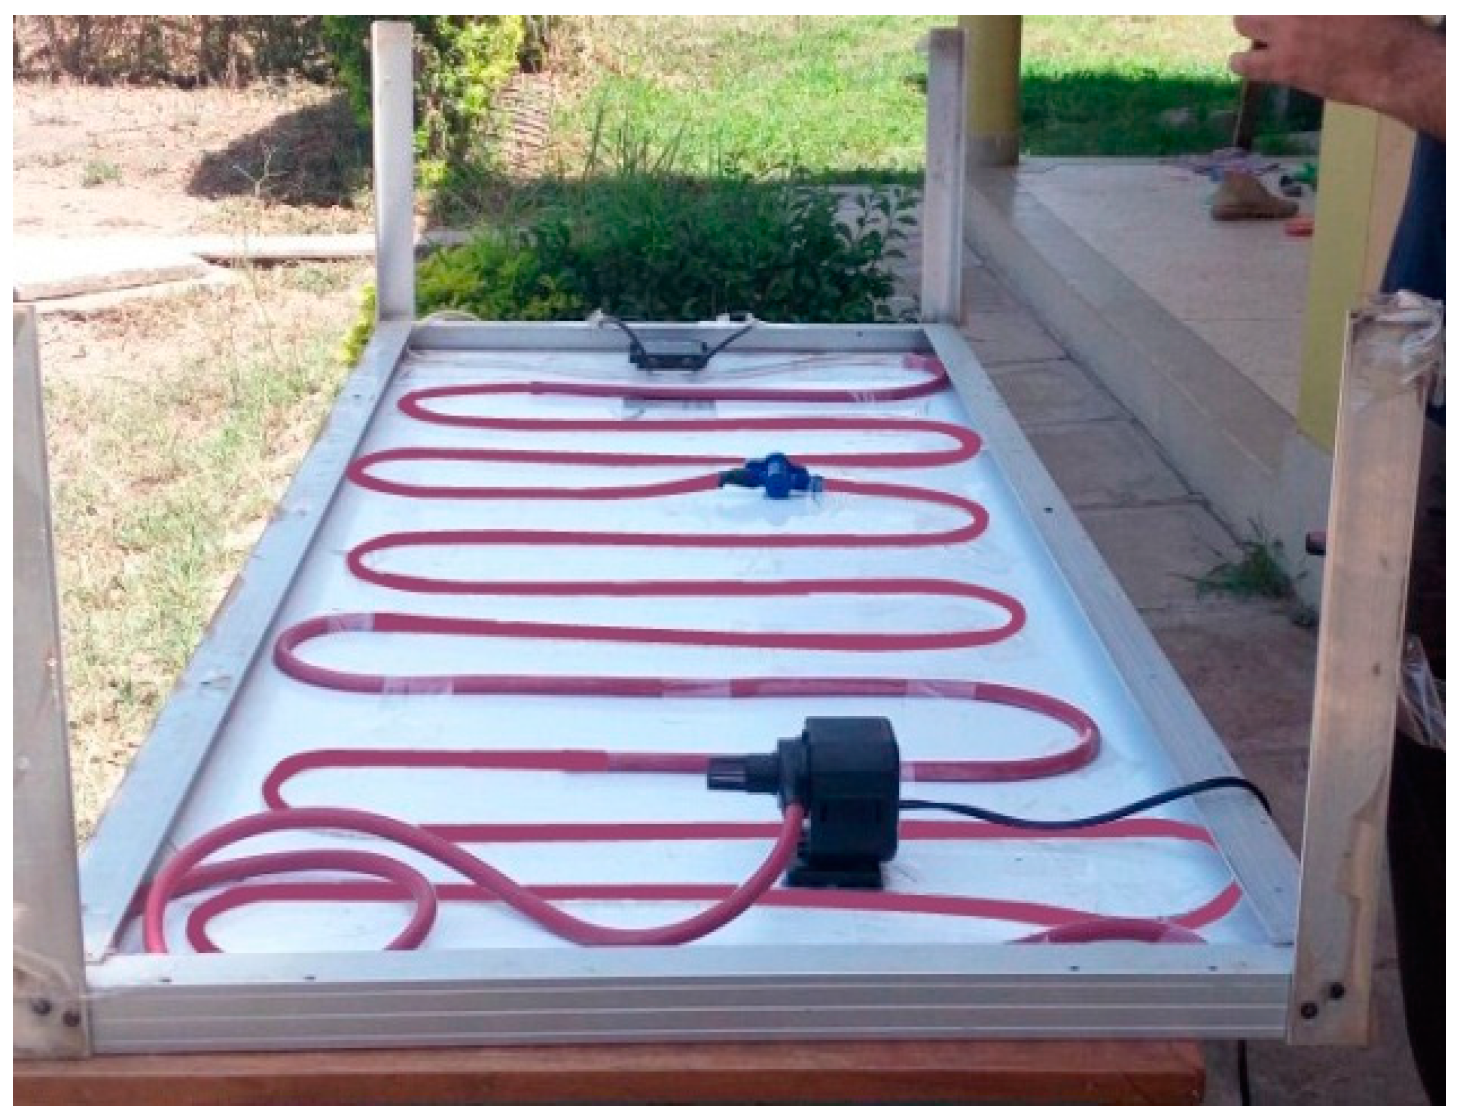
The PV module was integrated with a pipe (for cooled water circulation) with a thickness of approximately 20 mm attached to the rear side of the module. The water to be supplied to the cooling panel was stored in a storage tank with an insulation thickness of 10 mm. The outlet of the tank was connected to a pump for circulating water at the required pressure. To regulate the water flow inside the cooling panel, a flow meter with a maximum flow rate of 8.33 LPM was used. The cooling water circulated through the collector, captured the waste heat from the PV module and produced hot water collected at the collector outlet. An overview of cooled loop water cooled system is given in
Figure 4.
The temperatures at various points of the system were measured using a submersible digital thermometer (mode No. Tp101). A small waterproof aquarium pump was used.
Table 3 lists the specifications of the pump used for this setup.
2.3.3. Air Cooled System
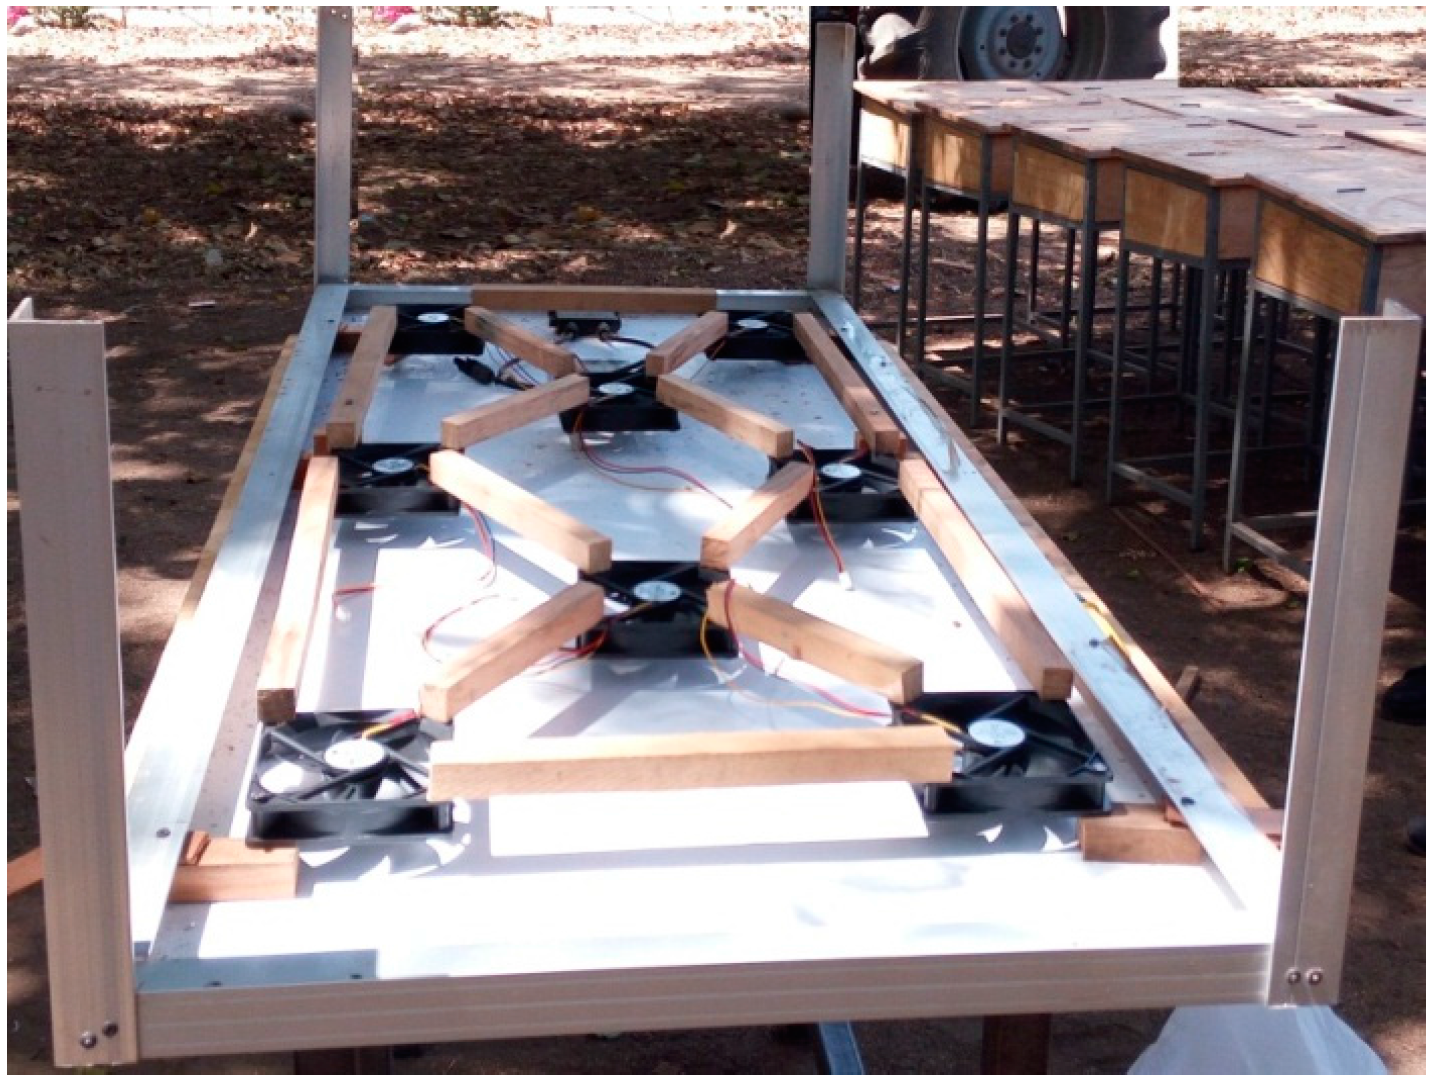
Some researchers have examined the effectiveness of an air cooled system for a solar panel cooling system. The effect of the air cooling mechanisms under indoor testing used halogen lamps as a light source. The impact of the air cooling mechanism was analyzed under different levels of solar radiation and surrounding temperature. Using a brushless DC fan to reduce the PV panel temperature, the power output was observed with increasing solar radiation [
7].
An active cooling system was developed based on the forced convection induced by fans as the cooling mechanism. The DC fan attached at the back side of PV panel will extract the heat energy distributed and cool the PV panel. The battery provides the DC source to the forced active-air cooling system installed at the back side (DC brushless fan) of the PV module. The DC cooling system reduces the temperature to improve the efficiency output power of the PV module. Two different approaches for fan cooling systems were constructed using eight fans with the specifications shown in
Table 4.
The DC brushless fans were arranged in such a way that a smaller number of fans could provide air to the entire panel. The fans were inverted to act like ordinary room fans to provide cooled air to the panel from the outside atmosphere. The increasing fan capacity increases the overall heat transfer and PV panel cooling performance but it is not advisable to increase the number of fans as it will increase the power consumption from the battery and reduce the overall efficiency of the system [
26]. Experimental set up and arrangements of fans for an active air cooled system are shown in
Figure 5.
2.3.4. Water Sprinkling System
Cooling the solar PV system with water is the most discussed cooling technique. The percentage decrease in temperature of a solar panel depends on the cooling rate of the solar PV material. The cooling period can be determined by obtaining precise information of the cooling rate of the solar PV system. The energy balance equation provides a base to determine the cooling period. The amount of heat absorbed by cooling water (
) is equal to the amount of heat dissipated by the solar PV system (
). The cooling period can be determined using the following equation [
26]:
where
is the mass flow rate of water,
is the change in temperature of water,
is the mass of glass,
is the heat capacity of glass (solar panels are manufactured from silicon with the top covered completely by glass, so the physical properties of glass are taken as the physical properties of the solar panels),
is the specific heat capacity of water,
is the change in temperature of glass, and t is the time taken to adjust the solar panel temperature to a specified temperature.
3. Experimental Setup
To confirm the effectiveness of the proposed method and techniques and to achieve a very clear comparison, an experimental setup was developed to determine the effect of the aforementioned materials and cooling techniques on the output power and temperature. The experimental work was performed in front of the 107 Mechatronics Engineering Building and the Laser Sensor and Application Laboratory, Pusan National University, at latitude 31.04083° N and longitude 31.4861303° E. The experiments were conducted in April 2016 and the 304 azimuth angle (a) in each experiment was measured from the north in Busan. Experiments with a slight modification were then performed at the Nelson Mandela African Institute of Technology, Arusha, Tanzania (latitude 3°23′58″ S and longitude 36°47′48″ E in January 2017. The tilt angle varies with location and an optimal tilt angle of 30° and 0° were selected for the experiment on a solar panel facing south zero degrees at Busan and Arusha, respectively. Initially, a commercial PV module with 20 watts of capacity was used to determine the effect of the reflectors on its performance at a given latitude. The electrical specifications of the module are given in
Table 5 under standard test conditions (STC).
A MS8217 millimeter (MASTECH, Brea, CA, USA) was used to measure the voltage and current under various irradiance and reflector conditions. A VT04A visual IR thermometer (FLUKE, Everett, WA, USA) was used to record the thermal images at a specified time. Three different materials and structures were studied. The voltage and operating temperature of the PV module were recorded and saved using an EL-USB-3 voltage data logger (Lascar electronics, Erie, PA, USA) and EL-USB-3 temperature and humidity data logger.
An aluminum foil sheet, 0.5 mm in thickness, was used to make the structure firm. The foil was wrapped around a rectangular hard paperboard. For the very first experiment, the area (LXW) of aluminum foil was kept the same as that of the solar panel (0.54 m × 0.36 m). A silver coated plane mirror of 0.1944 m2 area was used. The convex mirror scatters light so two convex mirrors, 15 cm in diameter each, were fixed together and used as a reflector, as shown in the figure. Three different size aluminum foil reflectors were used to obtain a normalized value for the effect of the reflectors on solar panel output. The size of the first, second, and third reflector was 0.0648 m2 (one-third of panel size), 0.1296 m2, and 0.1944 m2, respectively.
For the real time installation of solar PV systems, perfect south (180° N) is not available so three different positions were studied .South west 210° N (30° diverted towards the west) and south east 150° N (30° diverted from the south towards the east). A VICTOR 816 digital anemometer (Victor Hi-Tech, Shenzhen, Guangdong, China) was used to measure the wind velocity of the surrounding air. A detailed solar insulation and weather data was obtained from a weather station installed. The experimental set up acquired data continuously from sunrise to sunset.
4. Results and Discussion
To make this research more fruitful for future research on efficient solar PV system, authenticated data was obtained from the Korean Metrological Agency (KMA). Solar insolation data provided by the KMA was in units of MJ/m
2 that was then converted to kW/m
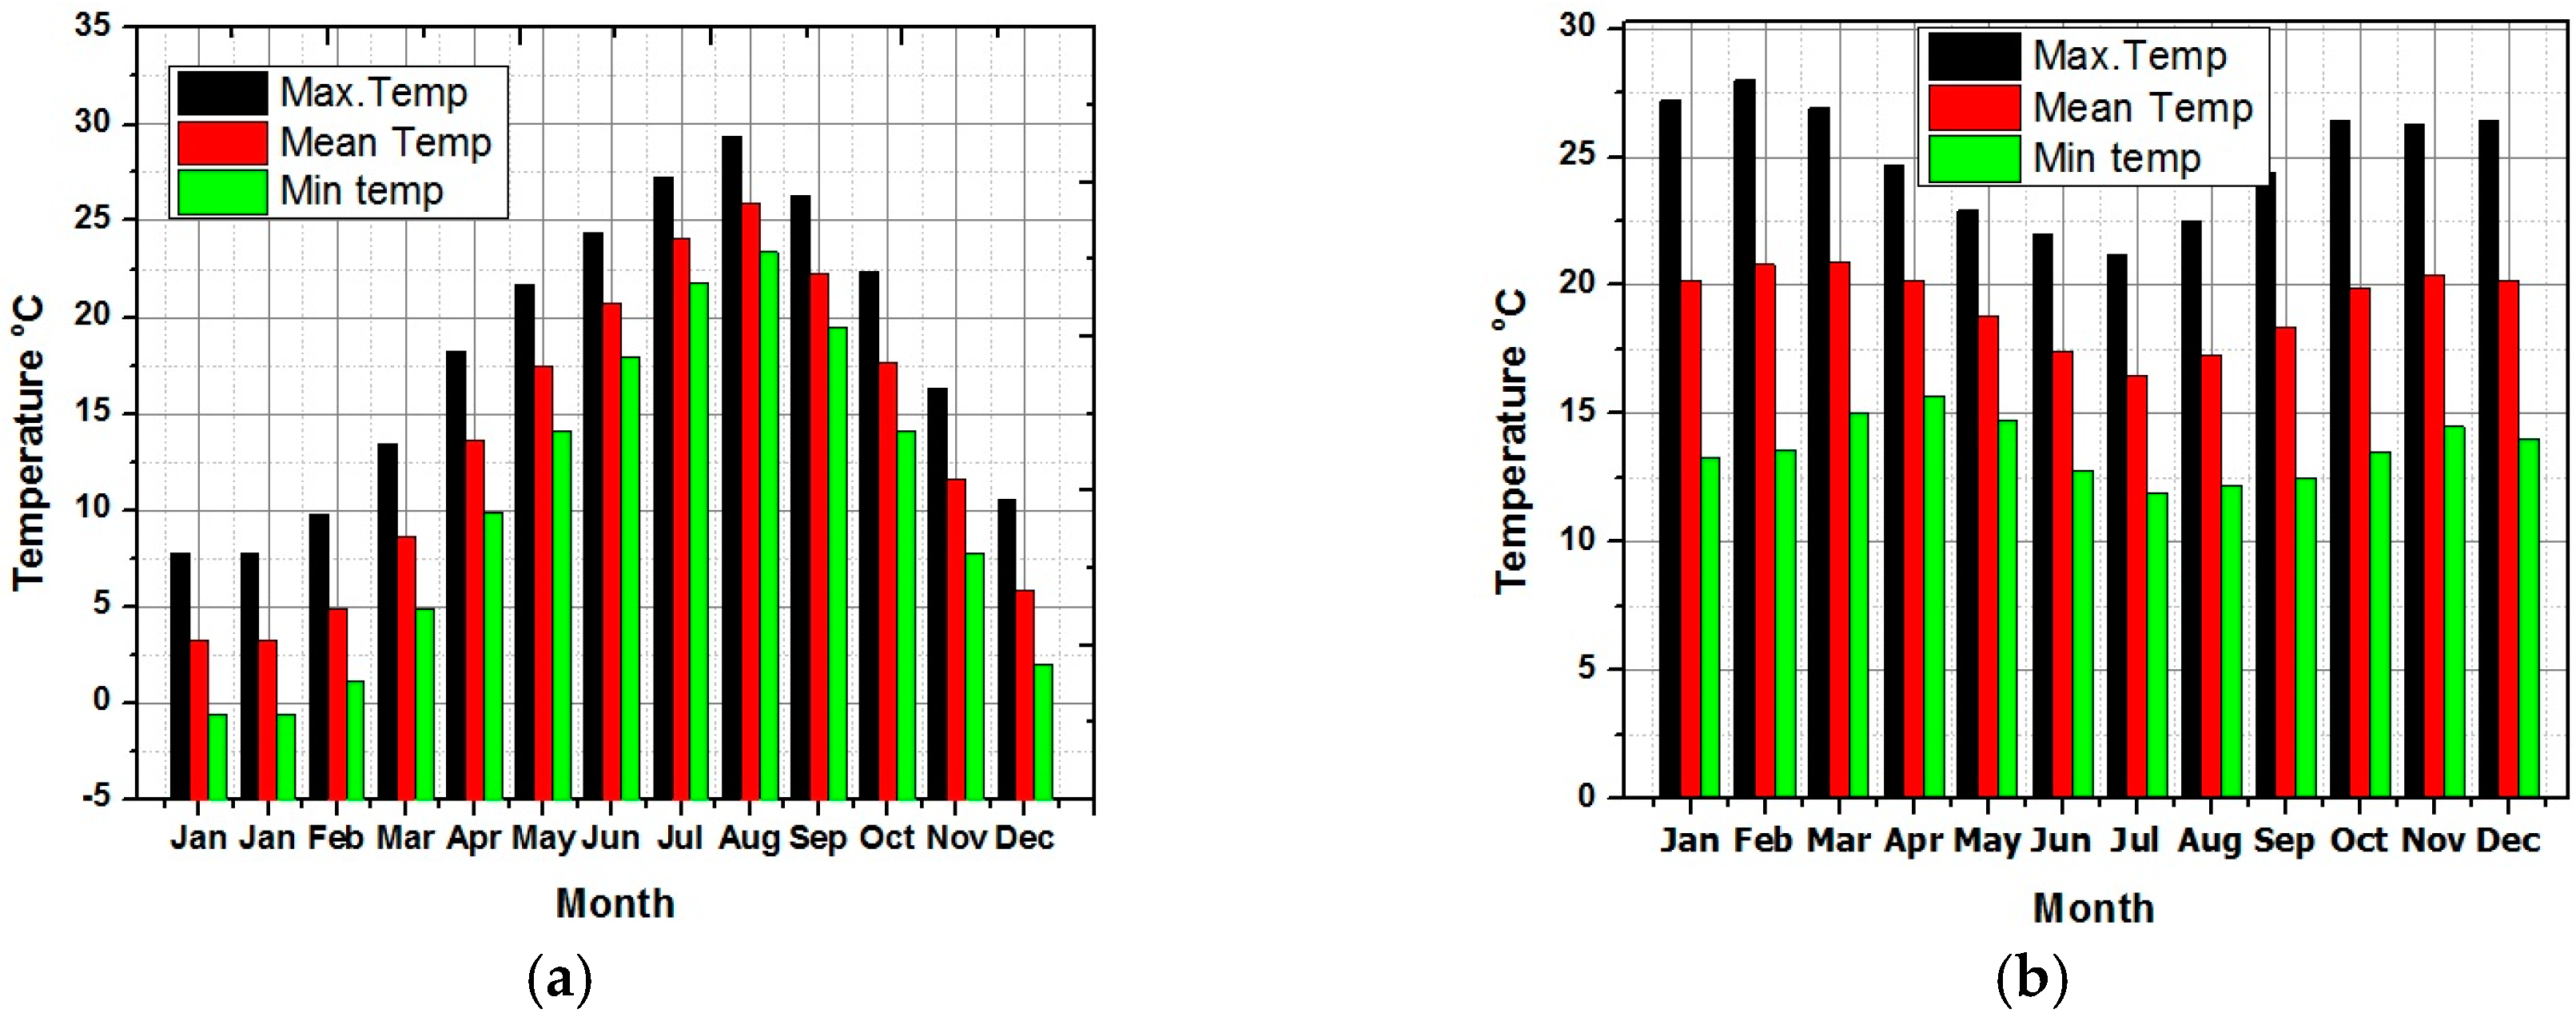
2 to make the data compatible, easily understandable, and comparable to the existing published data. Maximum, minimum and mean temperatures of Busan and Arusha are given in
Figure 6a,b, respectively.
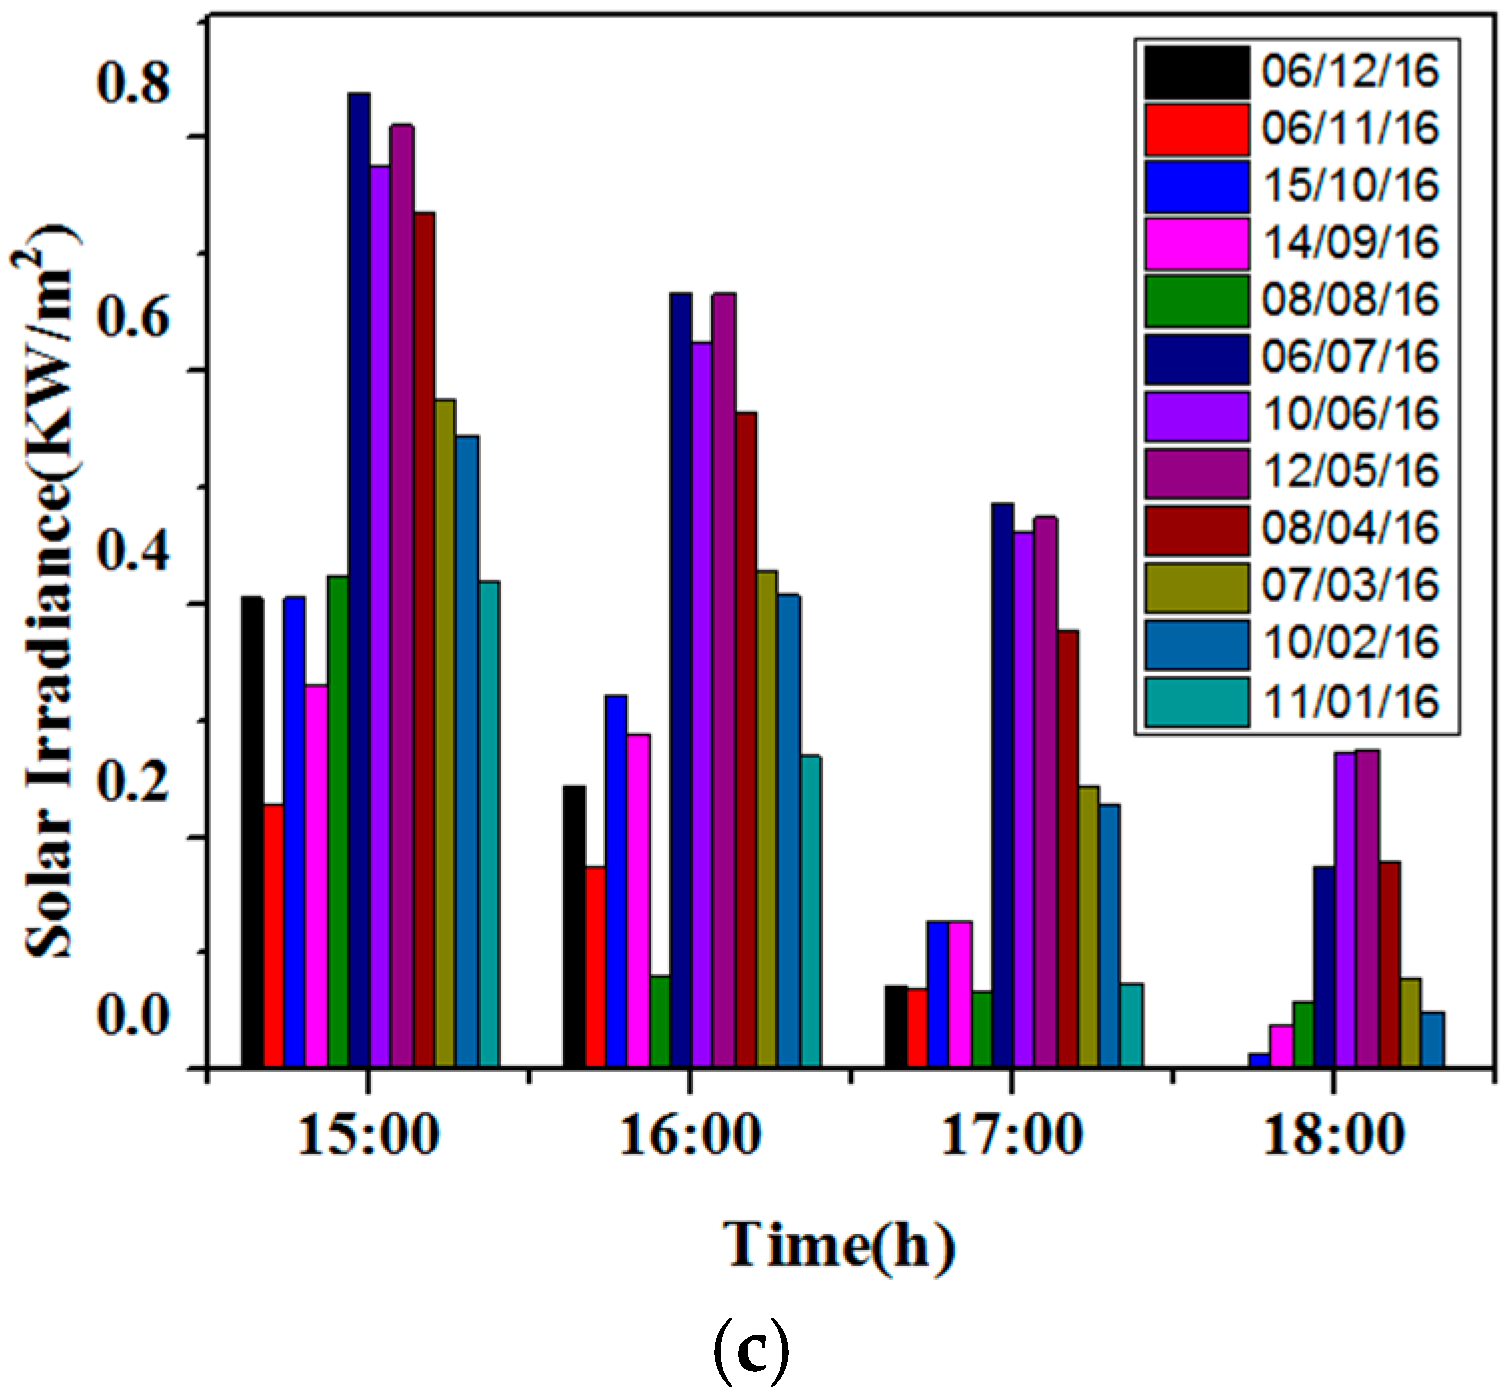
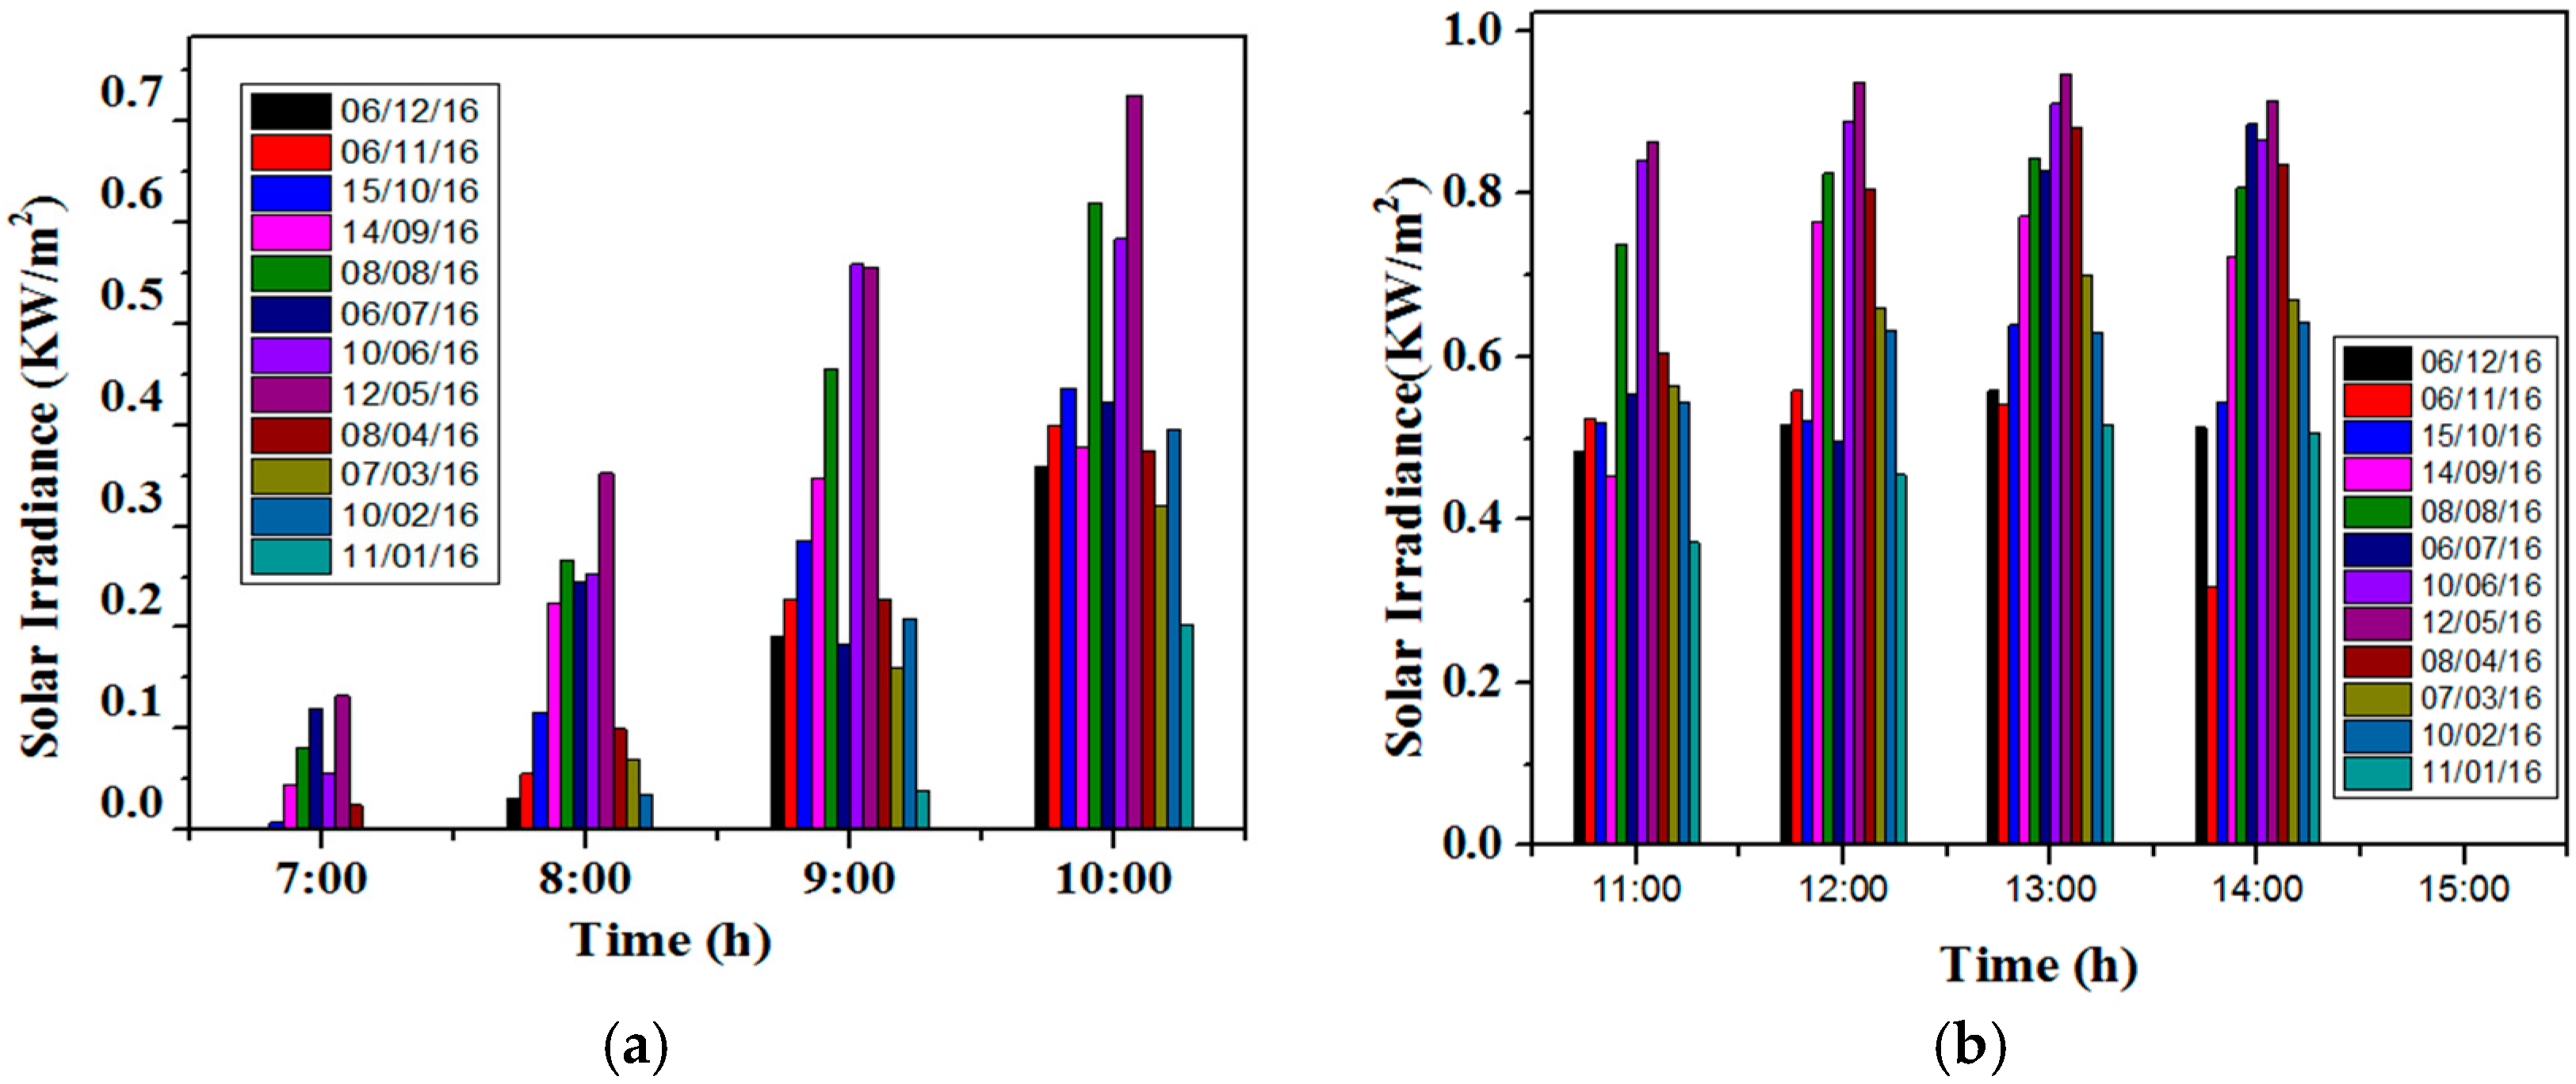
Solar irradiance data of random twelve days (one sunny day from each month) from sunrise to sunset were obtained from the KMA. These dates and their corresponding solar irradiance data are as shown in
Figure 7. During cold weather, the solar irradiance, much less than 1 kW/m
2 (1000 W/m
2), which is a standard solar PV designed parameter, was obtained. During December, January, and February the solar irradiance in the morning (7:00 am to 10:00 am) and evening (3:00 pm to 6:00 pm) was no more than 0.54 kW/m
2. At the afternoon (11:00 to 2:00 pm) it was 0.63 kW/m
2. Similarly, during a moderate weather period from March to May, the maximum solar irradiance was 0.70 kWh/m
2, which is still less than the peak solar irradiance defined for the solar panel. In summer (June-July-Aug and Sept), this value increased to 0.95 kWh/m
2 but the problem is the temperature that also increases for solar panel and hence again solar PV system cannot generate electricity to its full capacity.
Figure 7 shows that the solar irradiance for Busan at morning and evening varies throughout the year; however, these values are much less than the standard test conditions (STC) and there is always a chance to enhance the output power of PV modules using reflectors by increasing the amount of incident light on solar panel.
Solar irradiance data from Arusha was not easily available. Therefore, the data from Arusha Tanzania was obtained by installing a weather station at Nelson Mandela African Institute of Technology (3.3869° S, 36.6830° E).
Figure 6b shows that the Arusha temperature remains almost constant throughout the year, but June, July, and August have a slightly lower (cooler) temperature than the other months. Solar irradiance data of random twelve days (one sunny day from each month) from sunrise to sunset were analyzed.
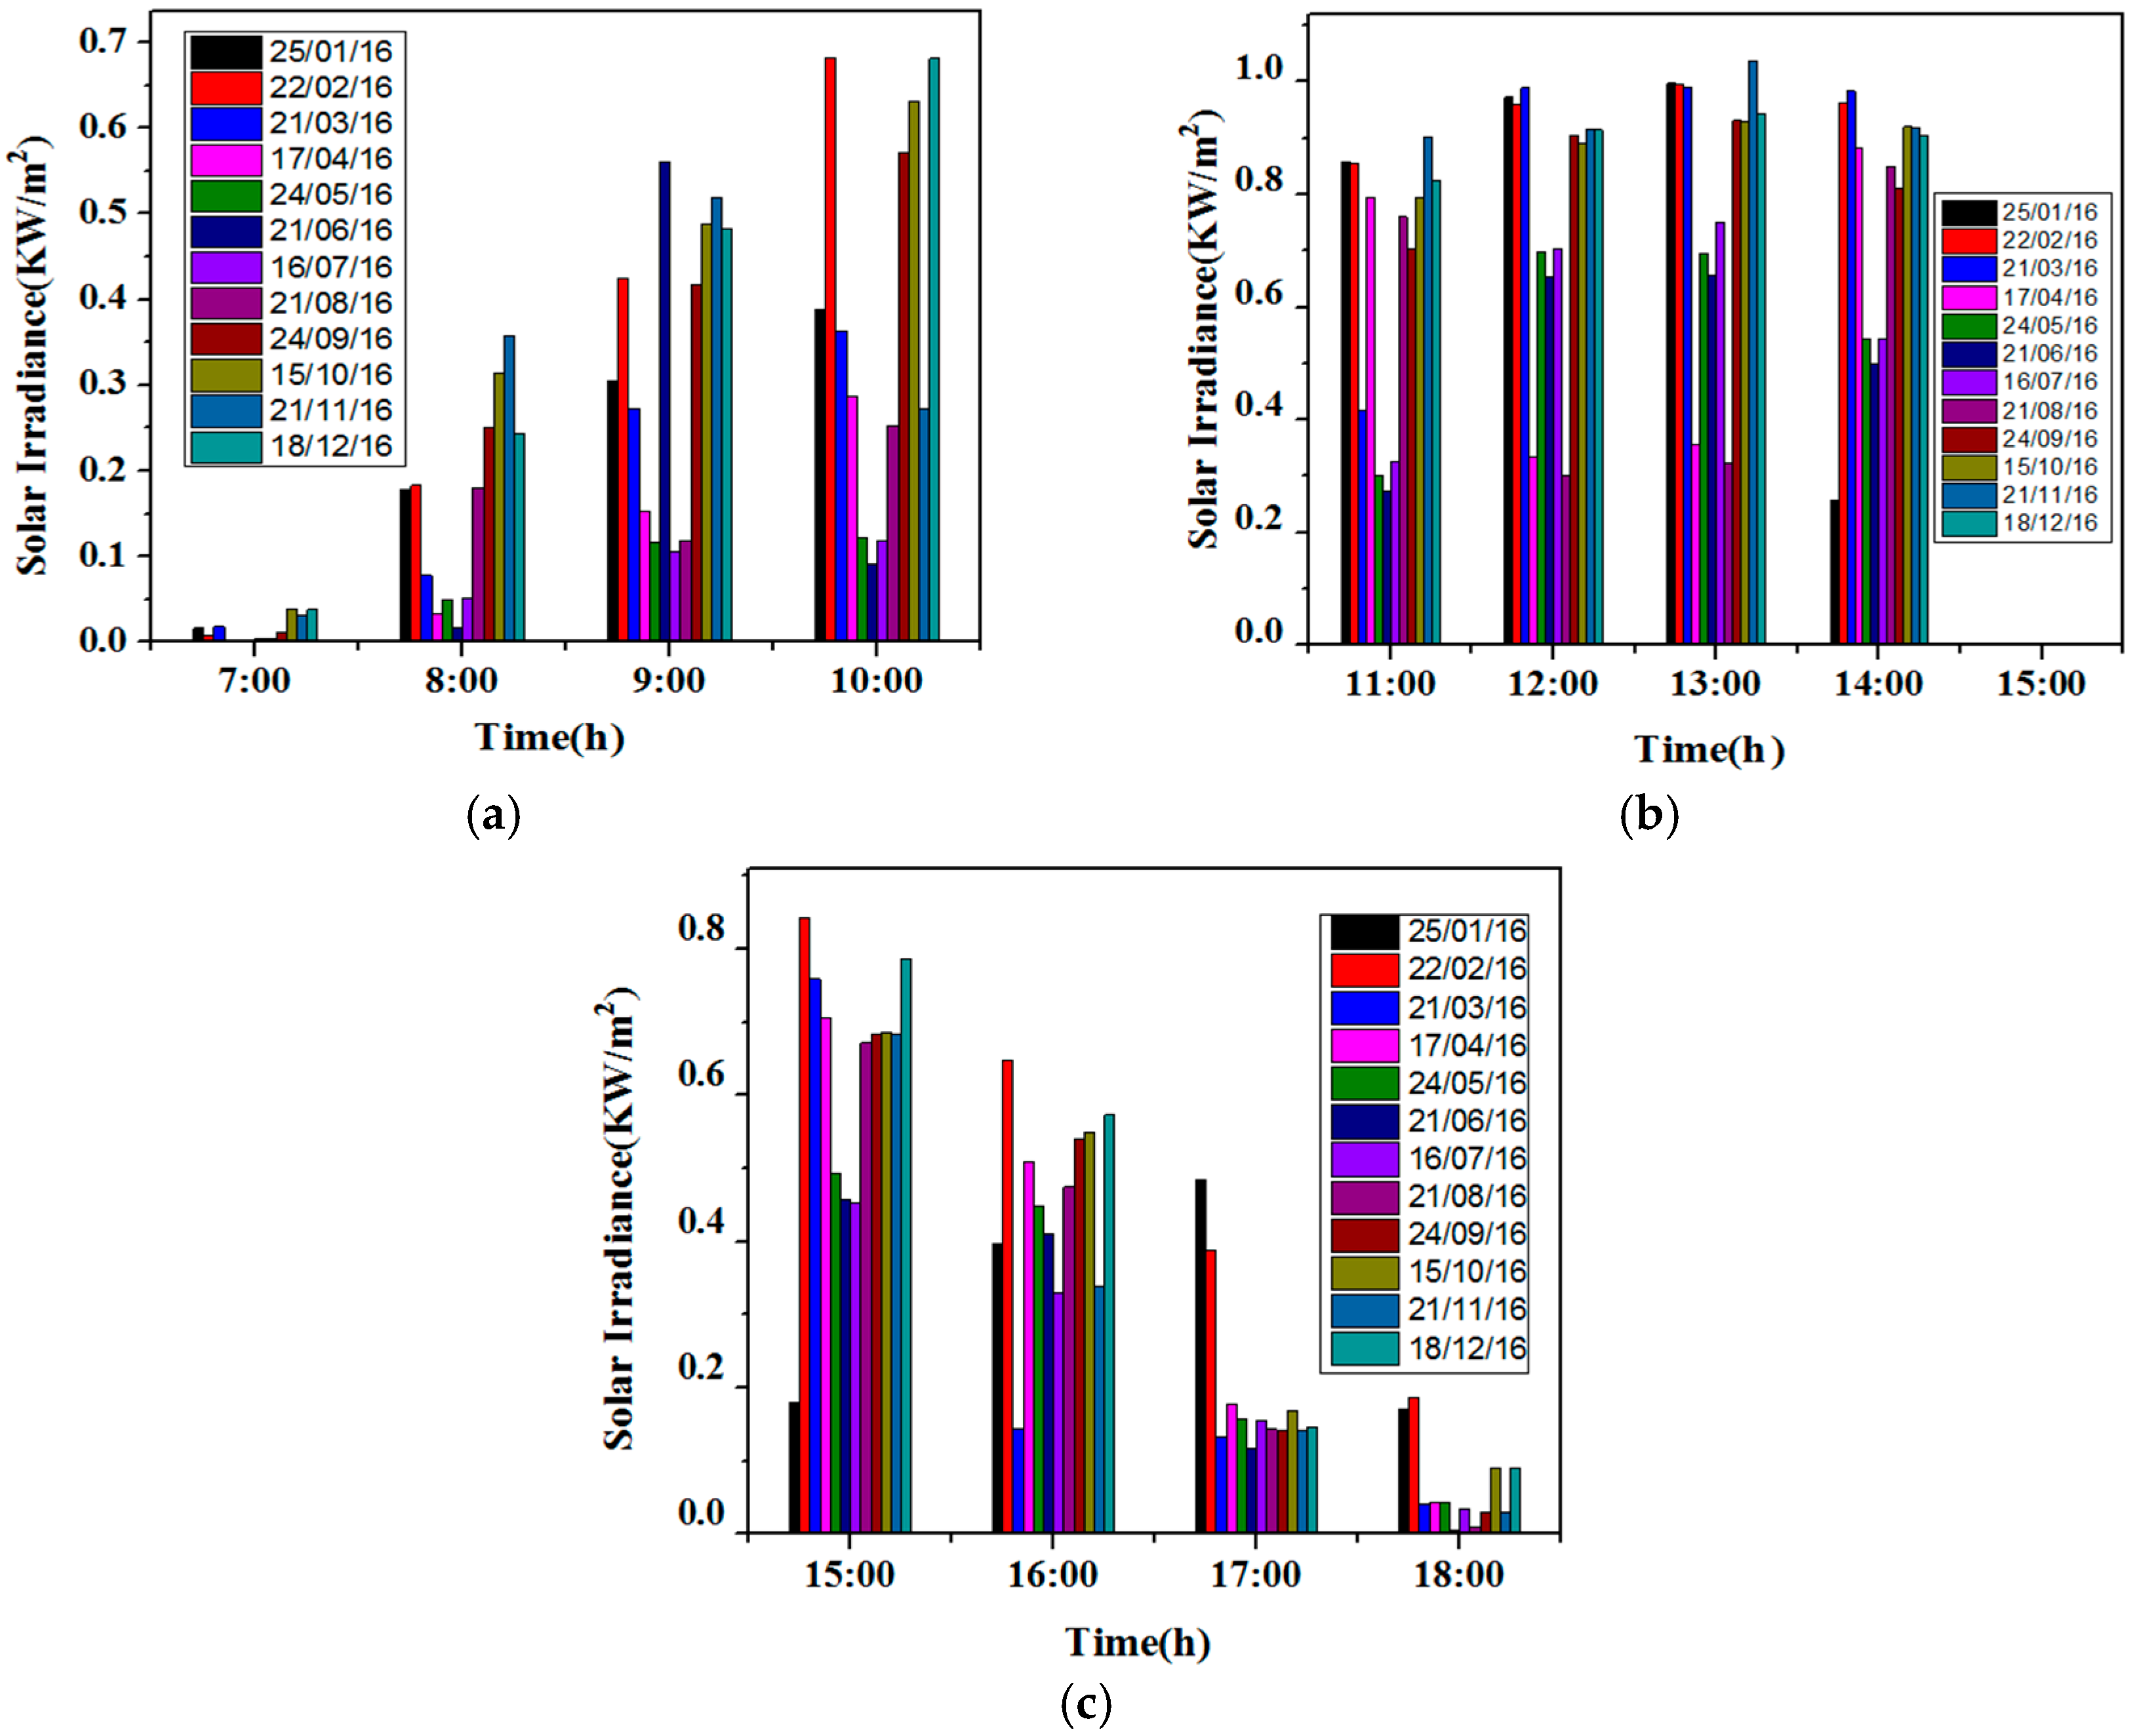
Figure 7a,b shows that solar irradiance is less than 1 kW/m
2 in morning (7:00 to 10:00) and evening (3:00 to 6:00). A reflector can show its effectiveness in increasing output power of PV module during these time intervals. At afternoon the values of irradiance are nearly equal to STC values. These dates and their corresponding solar irradiance data are as shown in
Figure 8. It is very clear from the solar irradiance and temperature data of both sites that a reflector and cooling system are always needed to increase the solar radiations on PV module and control the temperature of solar PV module.
4.1. Investigating Effective Reflector Material/Structure
A 20 W solar panel was used to determine the effects on the outcomes of the solar PV system using an optimized bi-reflector PV system (BRPVS) made up of convex spherical mirrors, plane mirrors, and aluminum foil sheet. The panel was placed at 0° South.
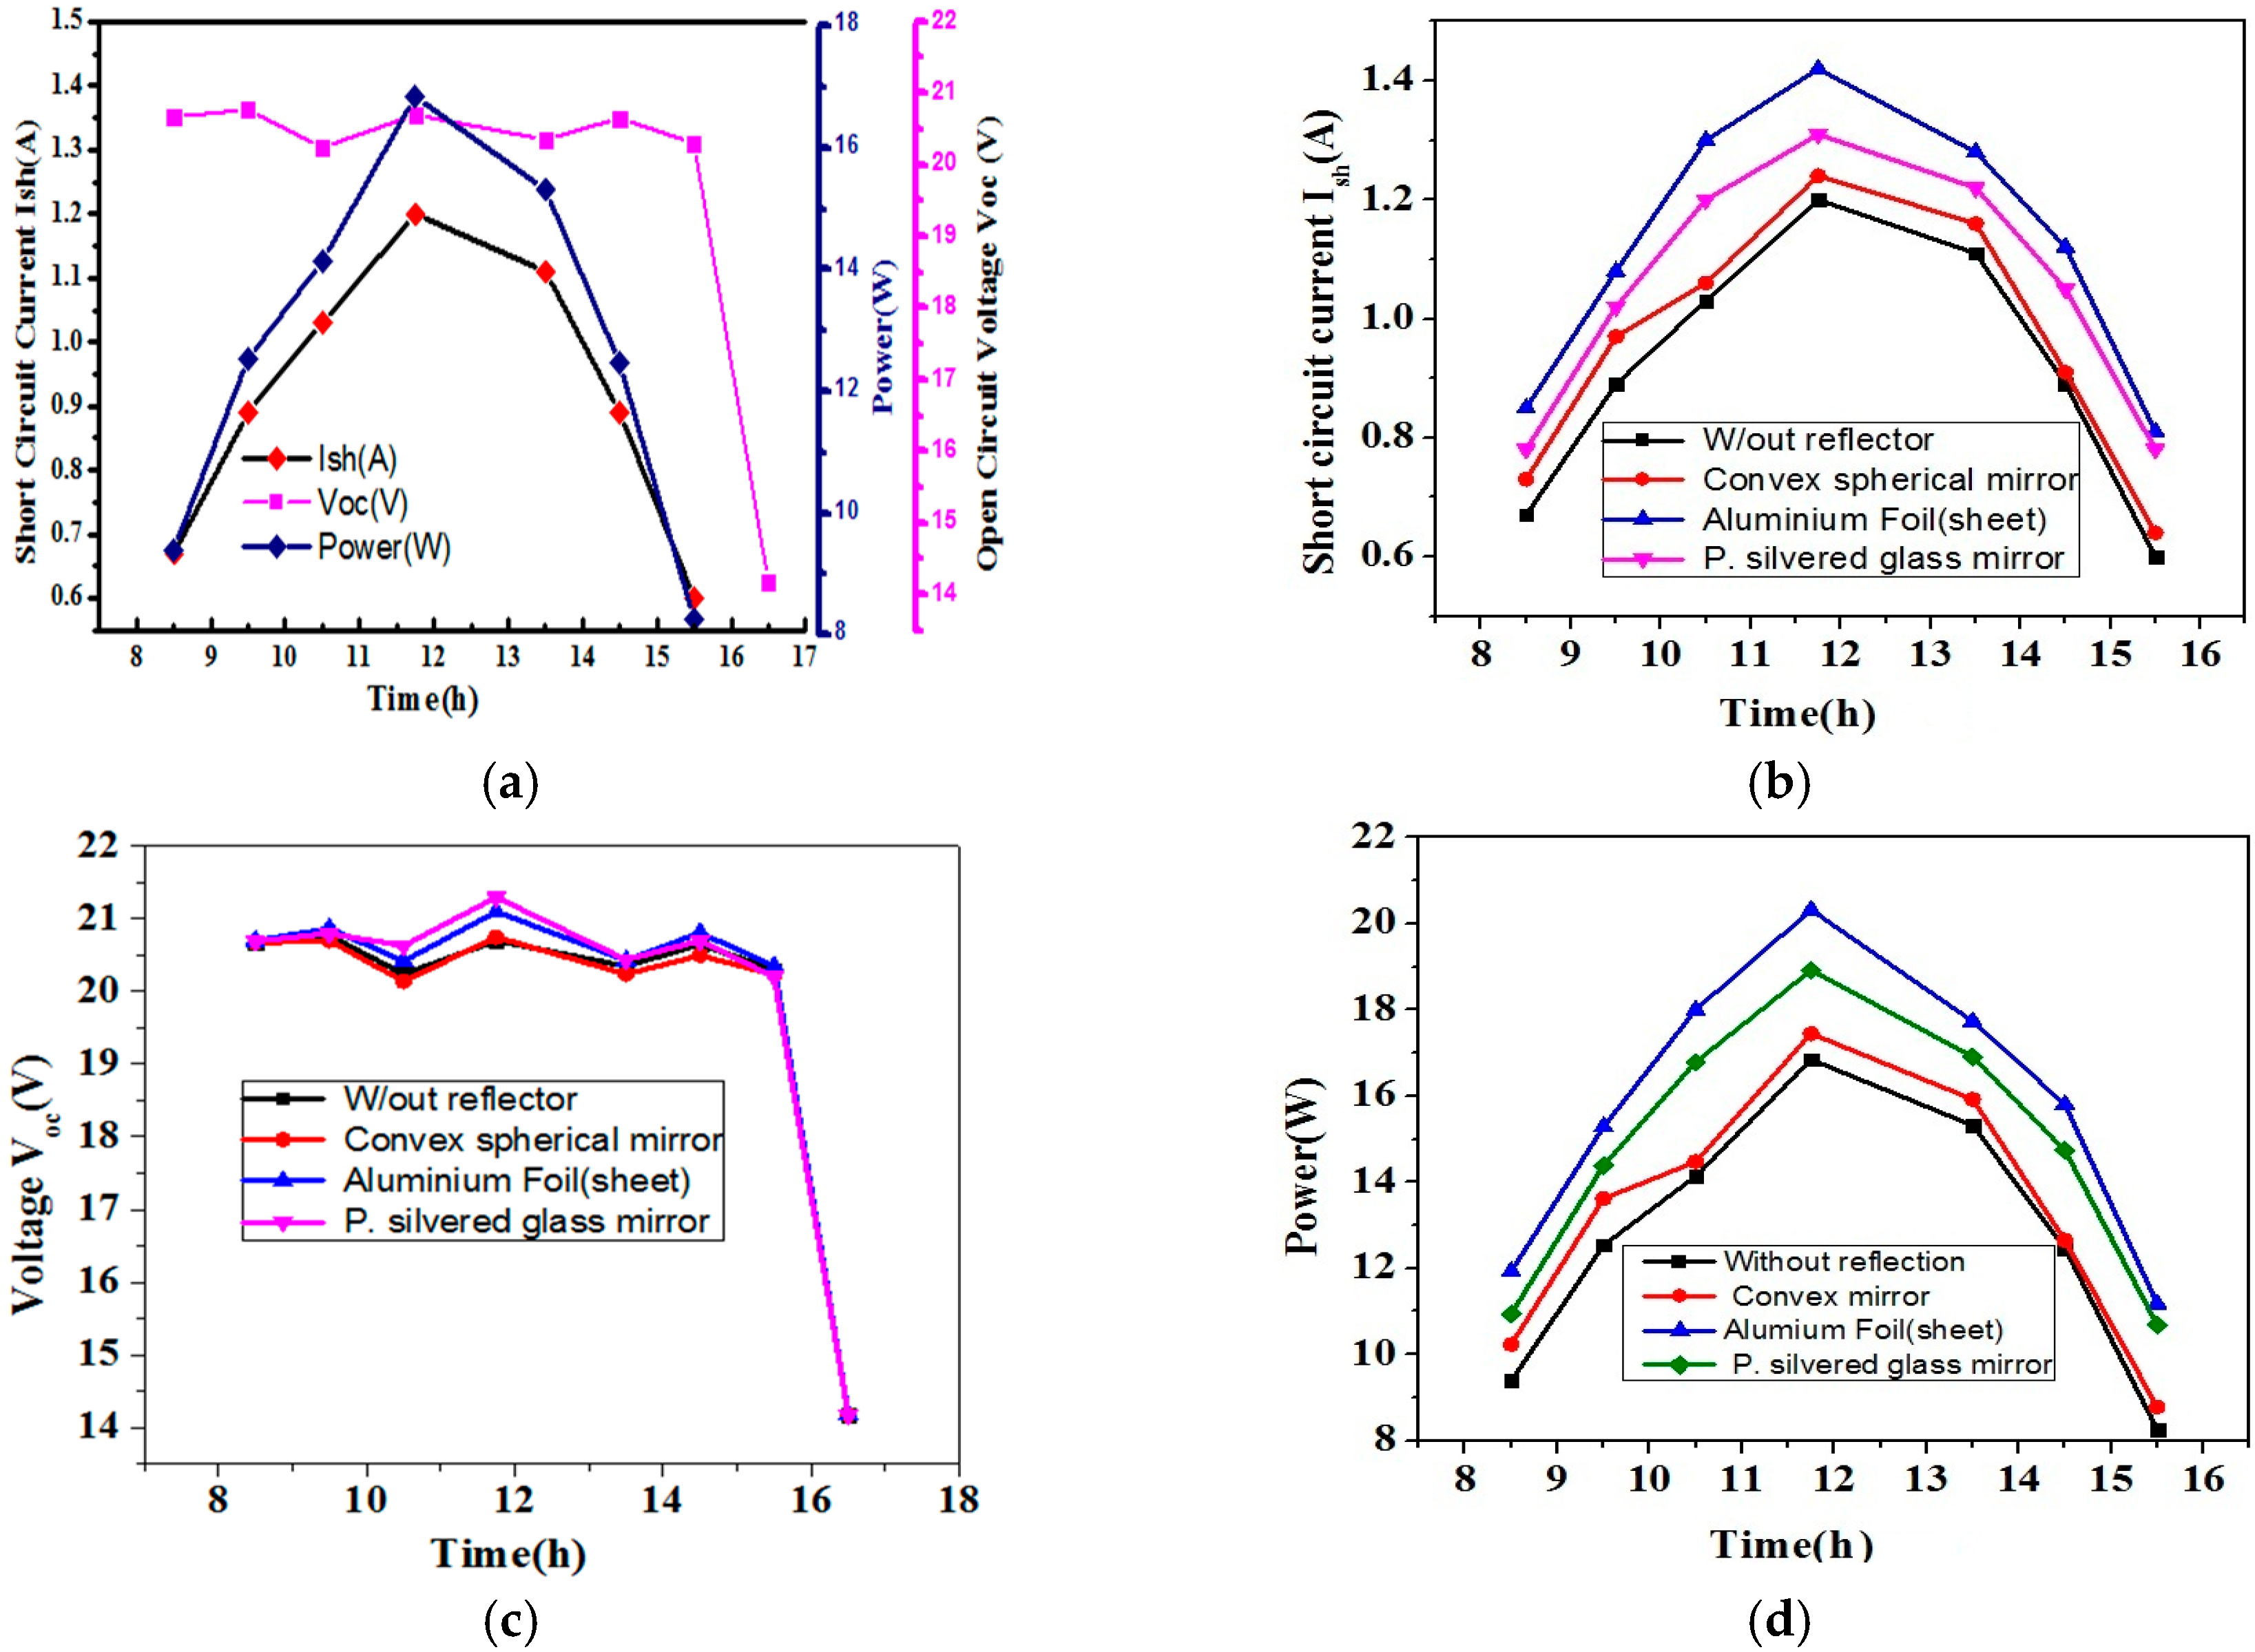
Figure 9a shows the open circuit voltage, short circuit current, and power from 8:30 to 16:30. The open circuit voltage remains almost constant from 8:30 am to 4:00 pm followed by a sudden decrease as the sunlight intensity is decreased at its maximum level. The short circuit current varies from 8:30 to 12:00, where there is a gradual increase (0.67 A to 1.2 A) and then a gradual decrease from 12:00 to 16: 30.
Outcomes (Voc, Ish, and Power) of the solar panel with no reflector were then compared with outcomes of solar panels with plane using silvered mirrors, Al foil sheets and convex spherical mirrors as reflectors. The open circuit voltage (Voc) and short circuit current, Ish, for the plane, spherical mirror, and Al foil reflector were calculated from 8:00 am to 4:30 pm. A significant enhancement in output power using the reflector was noticed. As three different types of reflectors were used, the effects of each reflector material and structure were different. Maximum power delivered by the solar panel with no reflector was 16.84 W. Maximum power delivered by the convex spherical mirror, silvered coated plane glass and Al foil reflector were 17.44 W, 18.91 W and 20.31 W, respectively. The spherical mirror has a much less of an effect and Al foil showed a comparatively large effect from the plane mirror. Short circuit current and power curve showed this effect. Moreover, the reflector systems are more effective in the morning and evening and comparative less effective at noon.
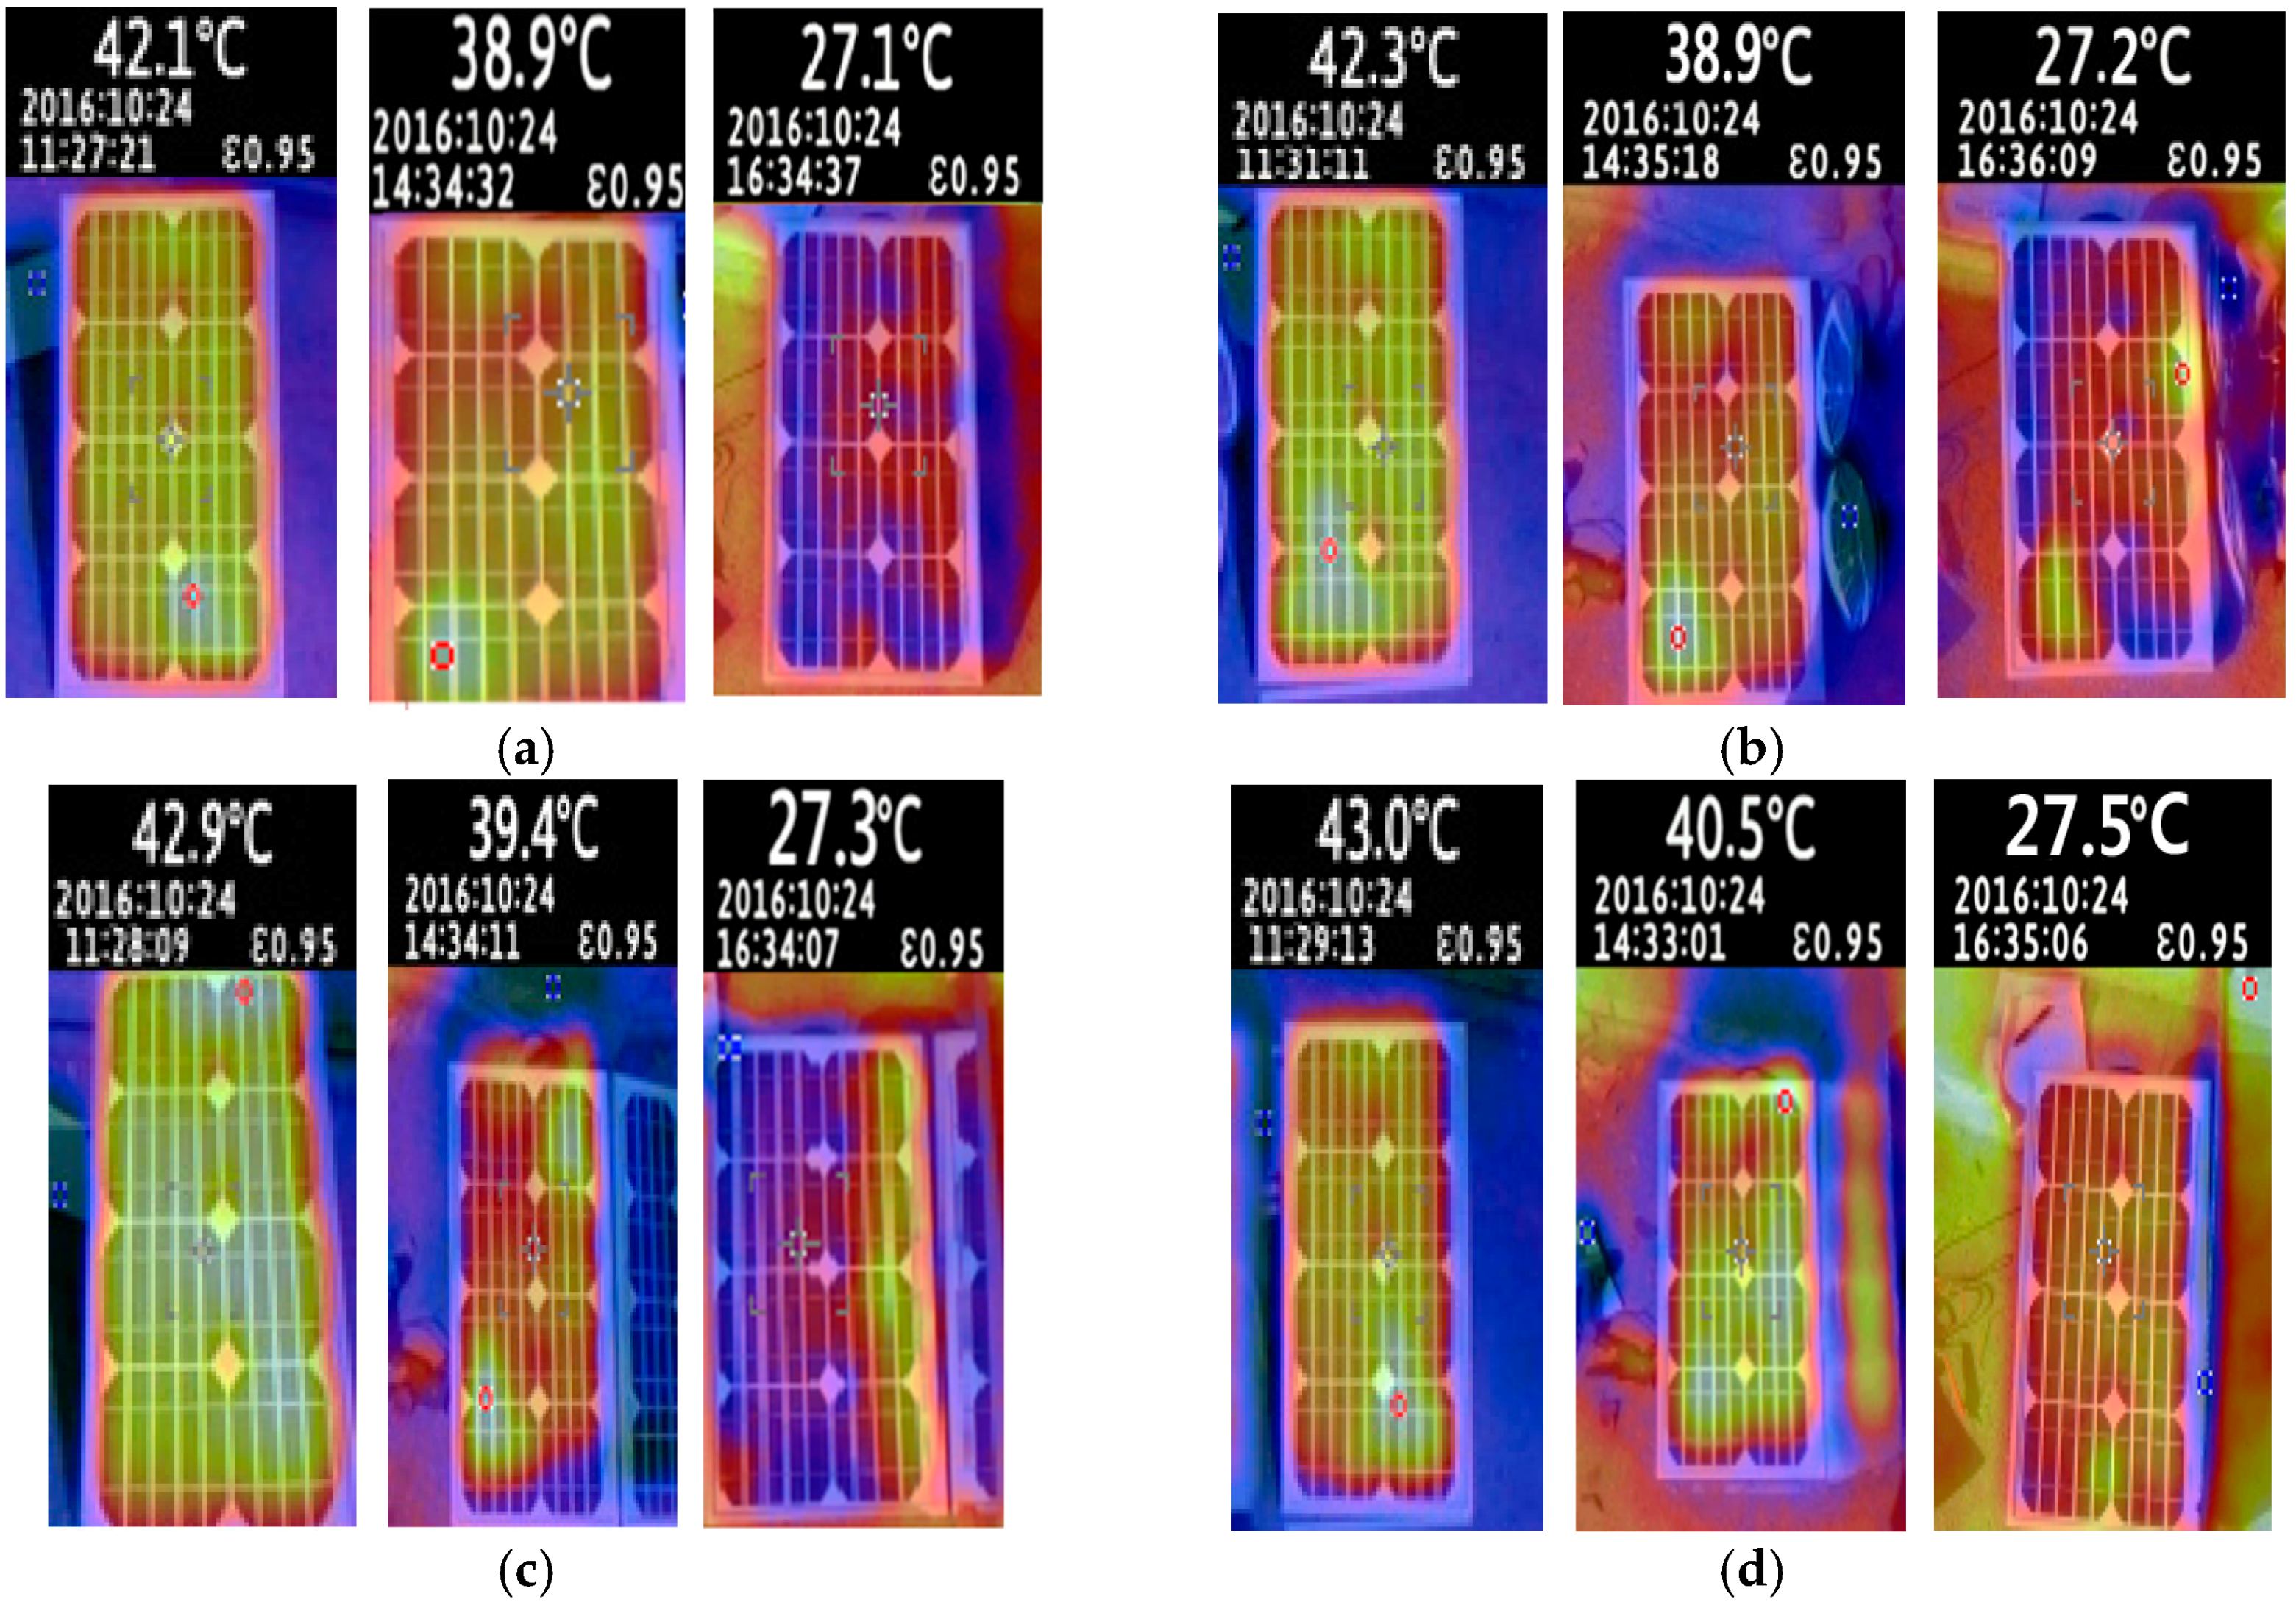
Experimental studies showed that use of a reflector is inexpensive and effective in enhancing the output power of a solar PV system. On the other hand, the effect of these reflectors on the solar panel temperature is unclear. Real-time infrared thermal images of each reflector system were collected using the maximum ambient temperature. The peak temperature time for investigating these figures was selected.
Thermal images (
Figure 10) at 11:30 showed a maximum hotspot temperature for a solar panel without a reflector, spherical mirror, plane mirror, and Al foil sheet of 42.1 °C, 42.3 °C, 42.9 °C, and 43 °C, respectively. At 14:37, the maximum hotspot temperature for solar panel without a reflector, spherical mirror, plane mirror, and Al foil sheet was 38.9 °C, 38.9 °C, 39.4 °C, and 40.5 °C, respectively. Similarly at 16:35, the maximum hotspot temperature for solar panel without a reflector, spherical mirror, Al foil sheet, and plane mirror was 27.1 °C, 27.2 °C, 27.3 °C, and 27.5 °C, respectively. These images show that the use of a reflector does not have a large effect on the temperature of solar panel and the use of reflectors is safe for solar PV operation.
4.2. Finding Optimal Reflector Size and Angle
The initial experiments showed that sheets made from aluminum foil are cheaper and comparatively highly efficient. The efficiency of a solar PV system varies with the reflector size. A series of experiments were performed on an aluminum foil sheet reflector to quantify and normalize the reflector size. A solar panel was placed at South 0° (North 180°) with an angle tilt of 30°. The aluminum foil sheets with a size equal to the total area 1/3 of the solar panel area (length = 54 cm width = 12 cm), a size equal to 2/3 of the solar panel area (54 cm width = 24 cm), and an Al foil sheet with size equal to that of the solar panel area (length = 54 cm, width = 36 cm) were used for analysis.
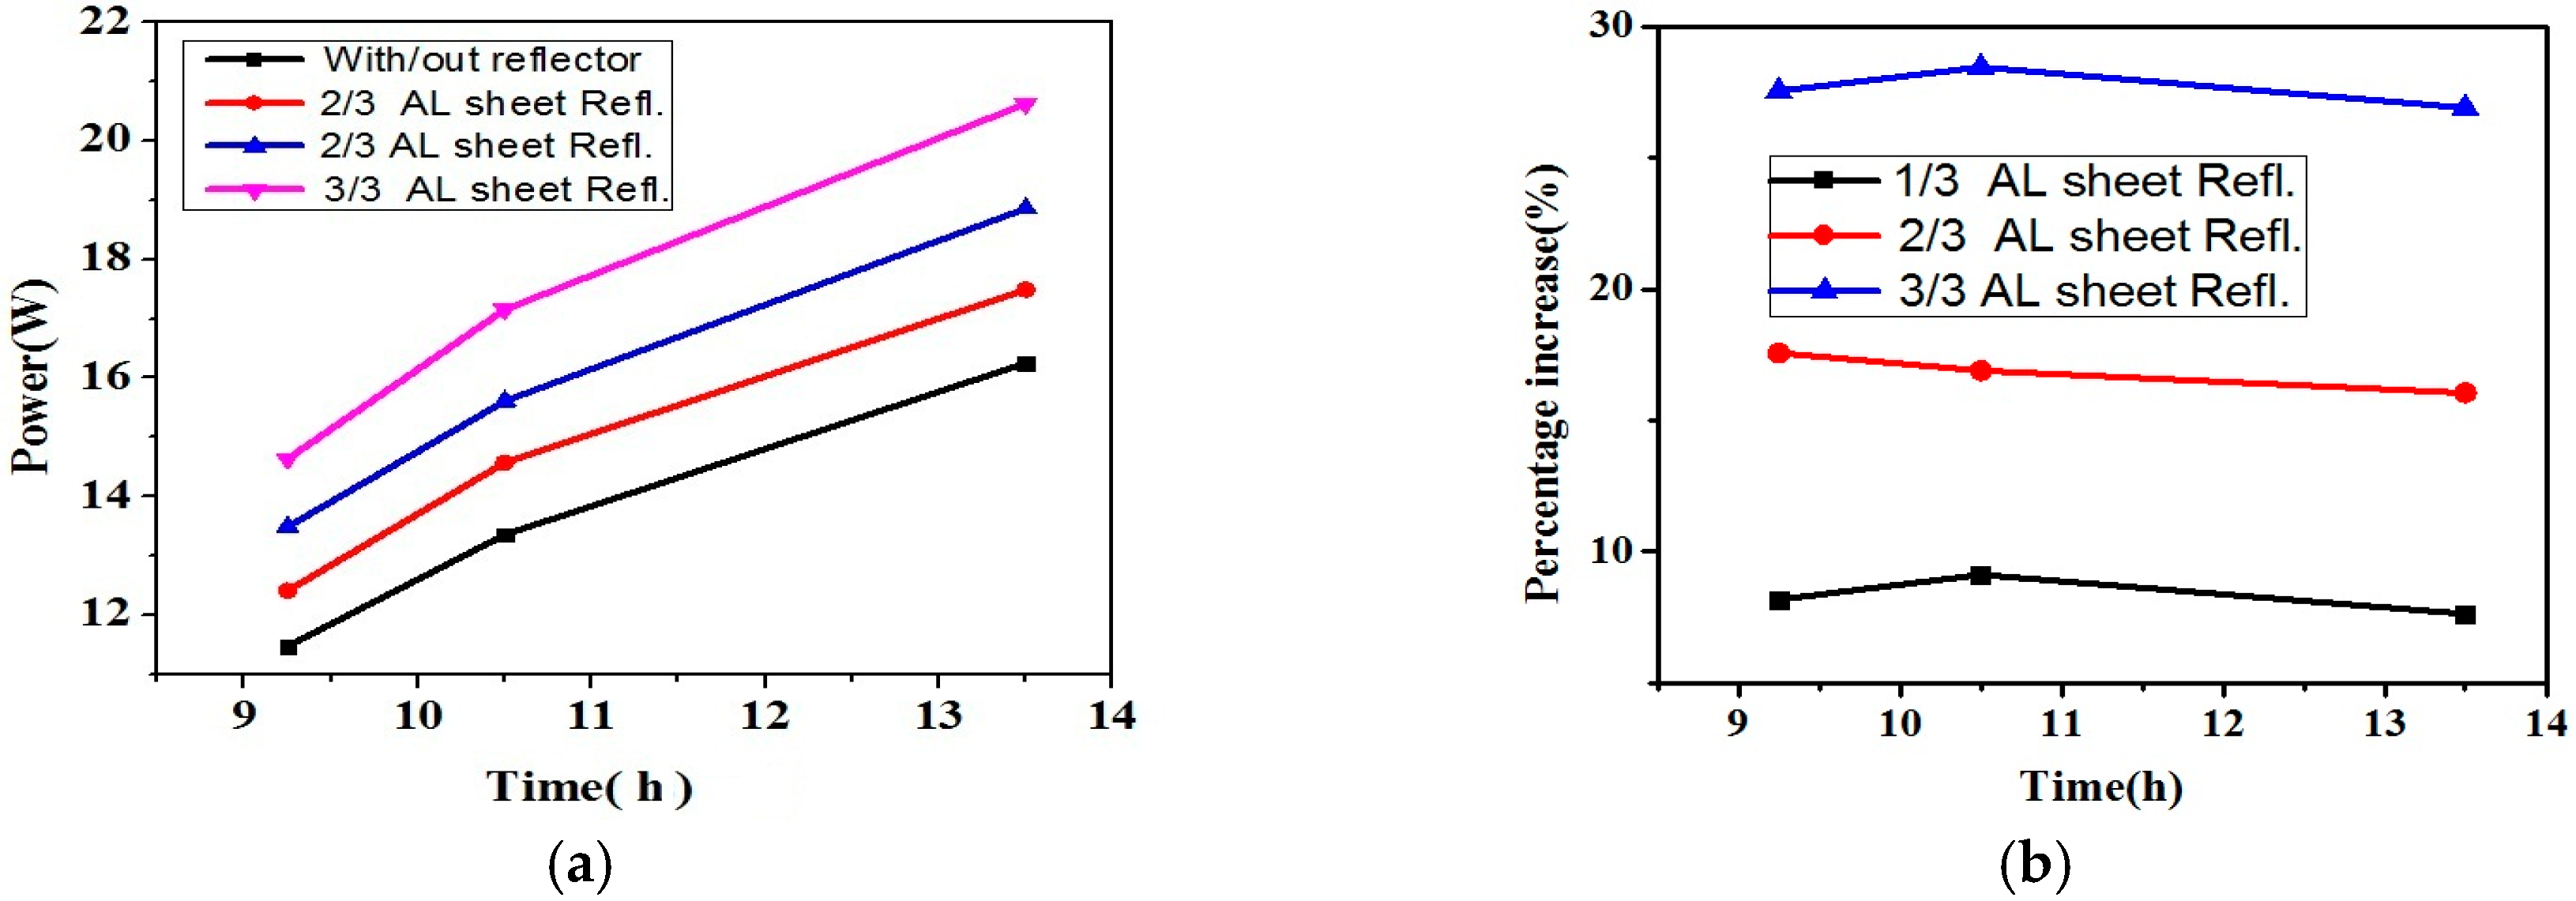
Figure 11 shows the percentage increase in output power of PV module using all three sizes of reflectors. Using Al foil reflector with a size one-third of the solar panel produces a 7.62% to 9.11% increase in the output power of a solar PV module. An Al foil reflector with a size equal to two-third of the solar panel increased the output power from 16.05% to 17.57%; a reflector with the same size as the solar panel offered a 25.92% to 28.47% increase. Increasing size of the reflector increases the output power linearly.
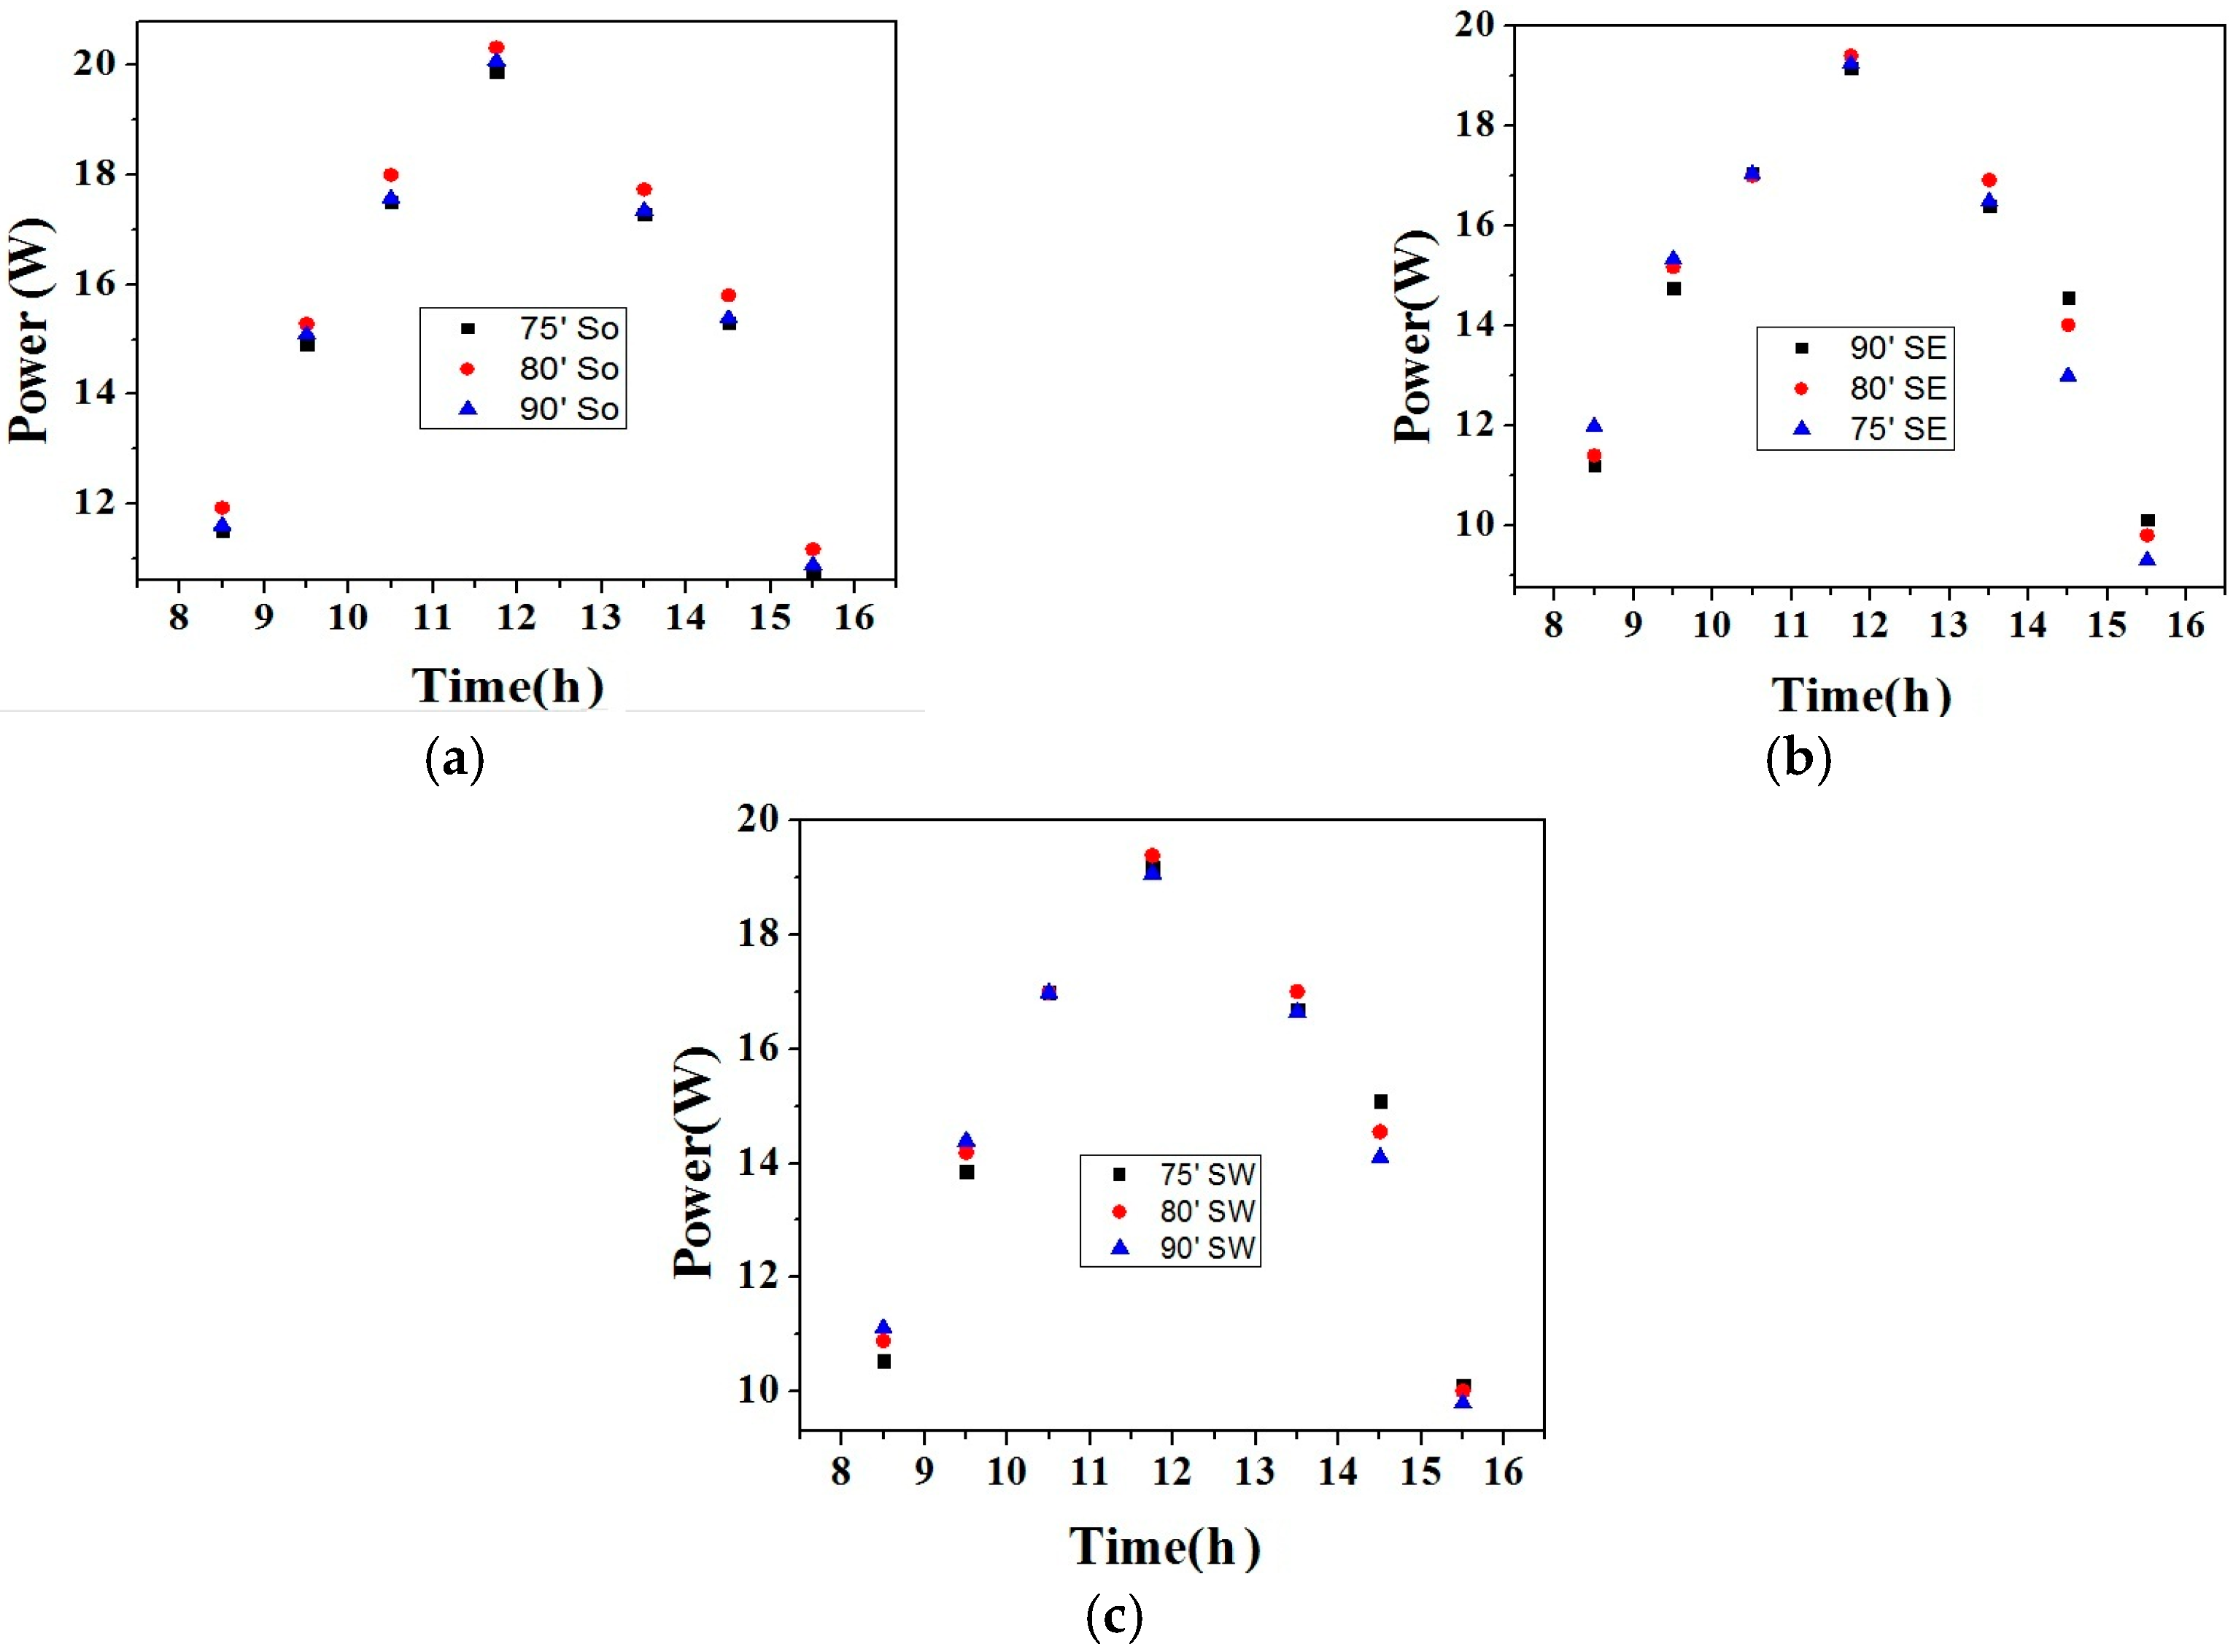
The next step was to find the optimal angle between the reflector and solar panel. The optimal angle between the solar panel and reflector changes with the solar panel position. Perfect south is unavailable all the time so three positions for the solar panel were selected, i.e., south 0°, south east (30° from south towards east) and south west (30° from south towards west).
Figure 12 shows the output power delivered by the reflector at different angles from morning to evening. For all three cases, in the afternoon (11:00 am to 2:00 pm) keeping both the reflector from the ground provided enhanced output power. In the morning (9:00 am to 11:00 am), the best angle for the south, south east, and south west position was 80°, 75°, and 90°, respectively. In the evening (3:00 pm to 5:00 pm), the best angle for the south, south east, and south west position was 80°, 90°, and 75°, respectively. Changing the position of the solar panel affects the angle between the reflector and solar panel but the effect of the reflector on the output power increases as the panel deviates from south.
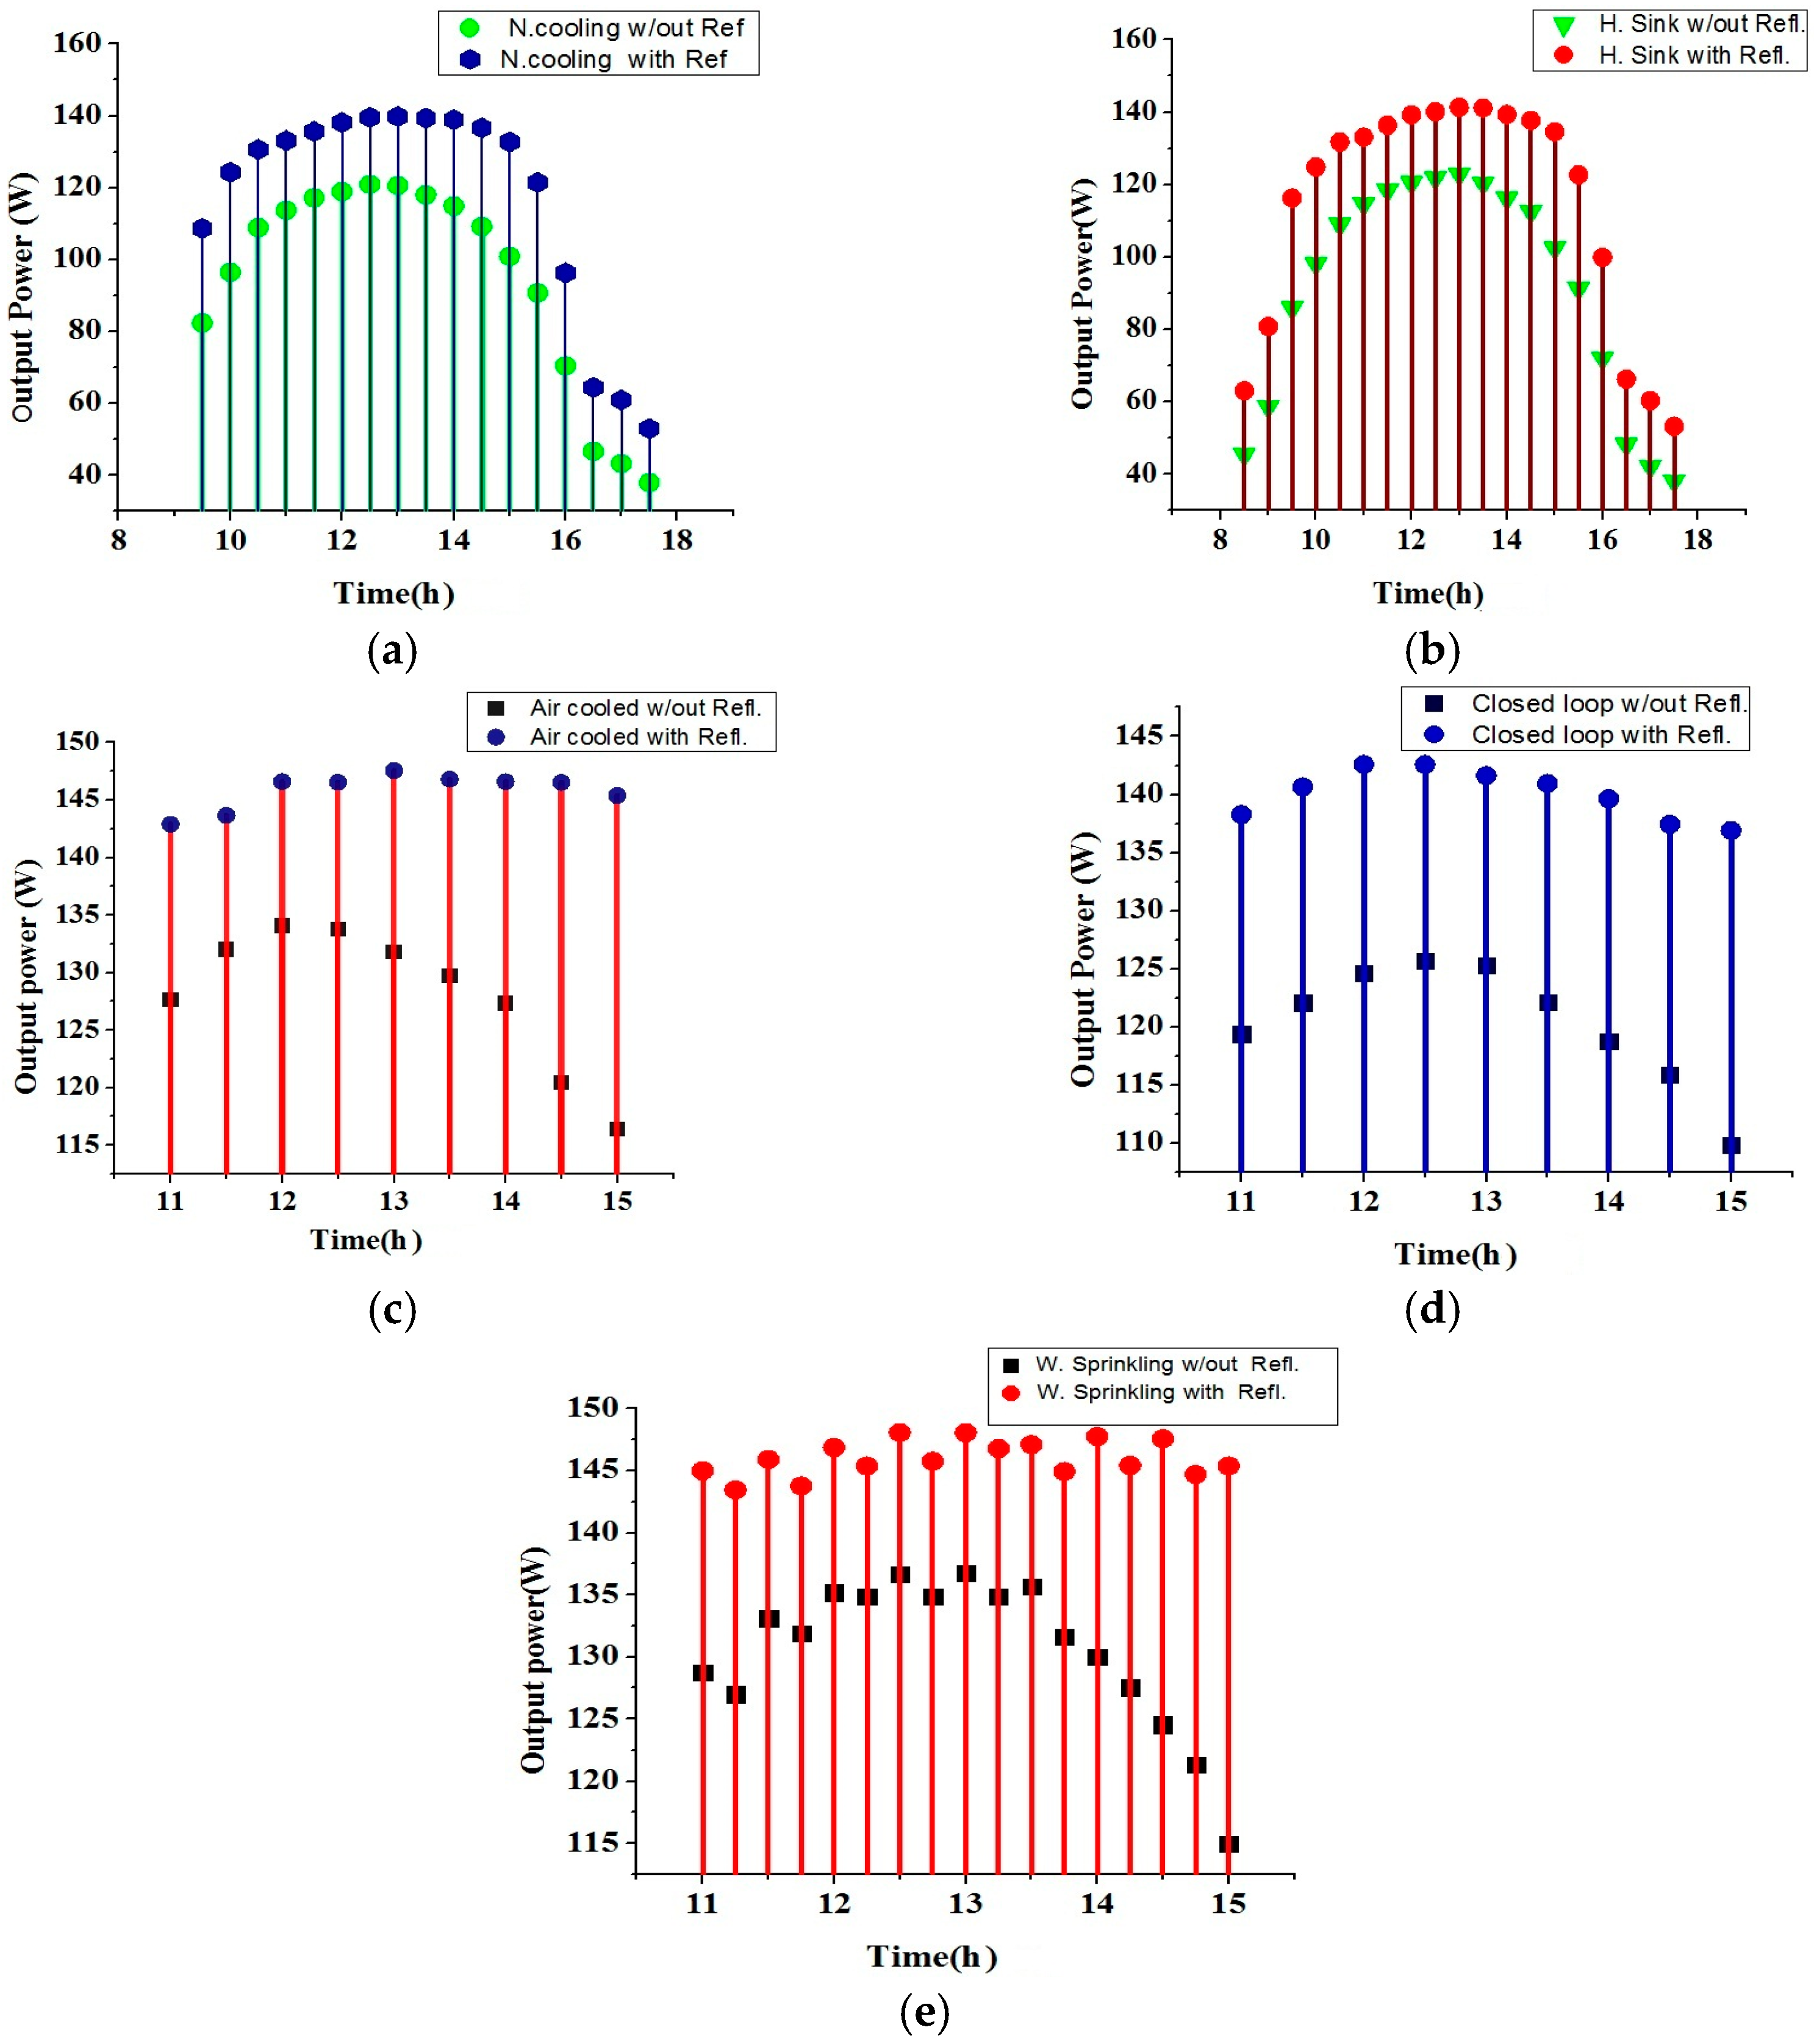
4.3. Investigating Appropriate Cooling Technique
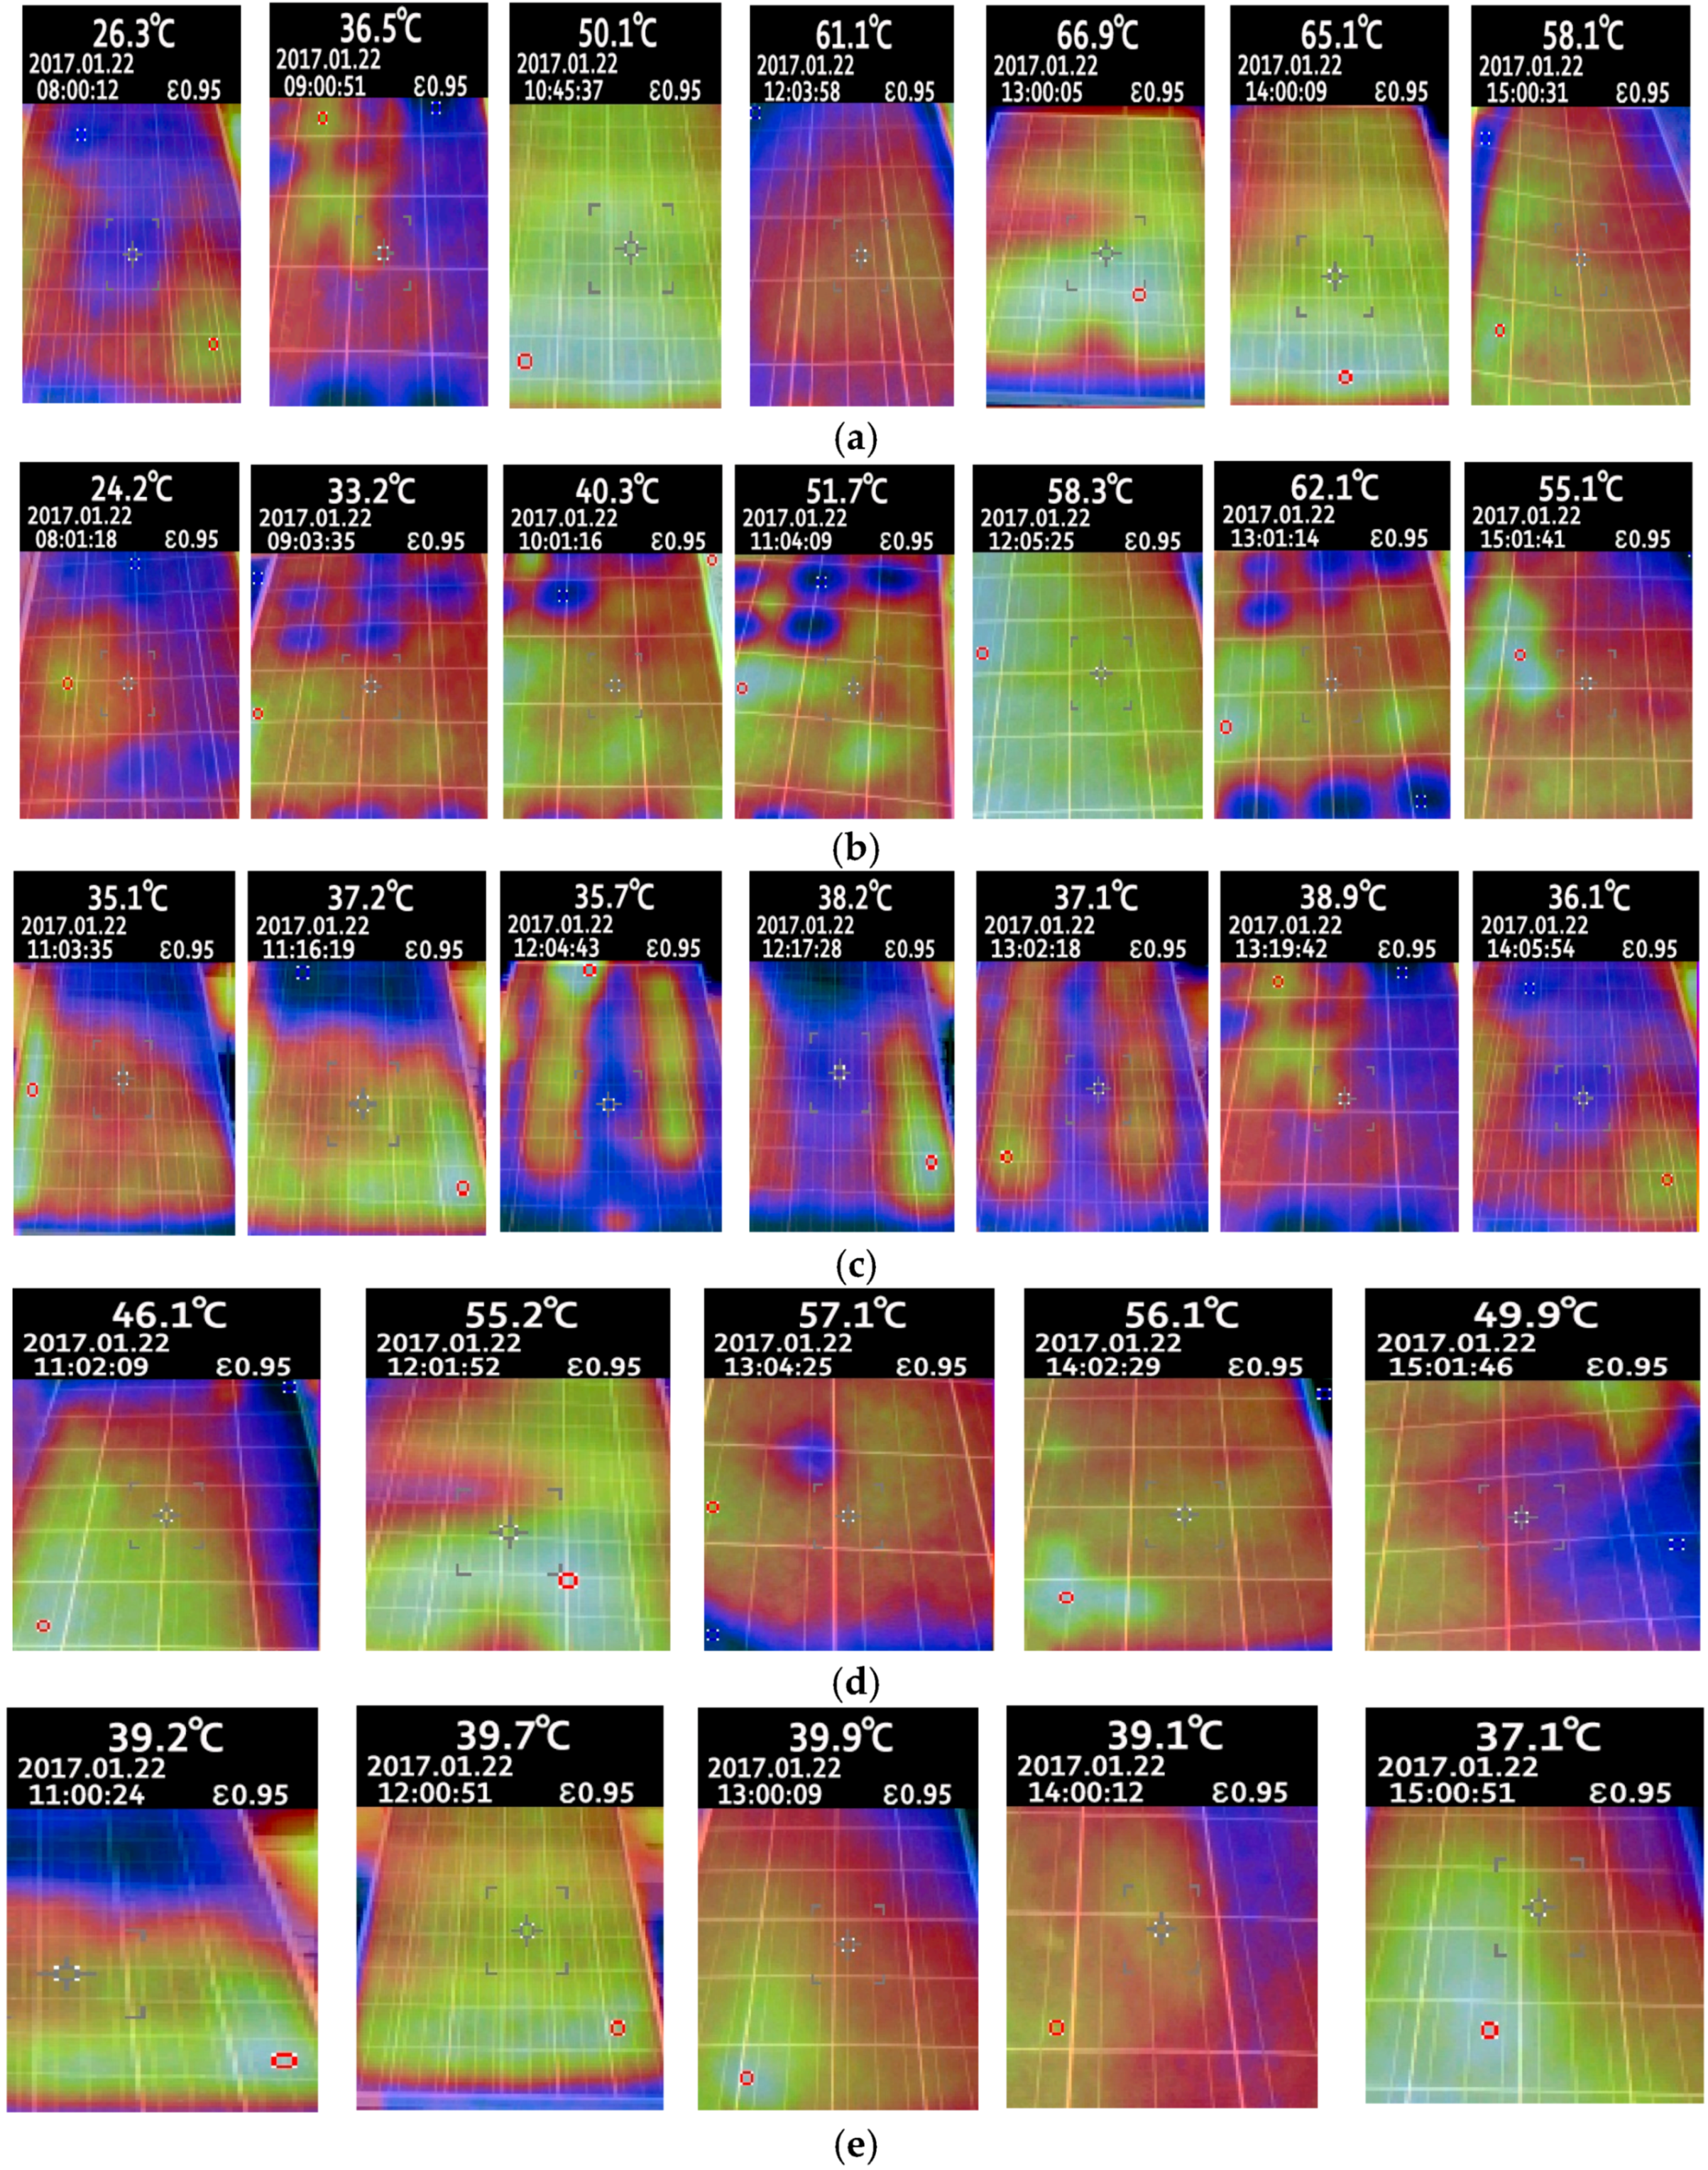
The proposed cooling system was analyzed using real time experiments and the outcomes were compared. The experiments were performed at Arusha Tanzania. All four cooling systems were tested on the same day and time to obtain accurate data for the open circuit voltage and short circuit current. The temperatures of the solar panels with different cooling systems were recorded using an EL-USB-3 (temperature and humidity data logger) and thermal images were taken using a FLUKE VT04A visual IR thermometer. The operation of passive heat sink method does not require electric power to cool the solar PV module. Initially, the data from the solar PV system with no cooling or natural cooling and the one (solar PV module) with a specifically arranged heat sink was monitored from 8:00 am to 10:30 am at specific time intervals while the other three systems were turned on when the temperature of the panel reached 50 °C. The thermal images for the PV module in
Figure 13a showed that the temperature of the PV module was 26.3 °C at 8:00 am, which increased with time until it reached 66.9 °C at 1:00 pm (13:00). At 1:00 pm, the temperature of the PV module was 41.9 °C more than the STC (25 °C). The temperature of the module then decreased to 65.1 °C at 2:00 pm and 58.1 °C at 3 pm. The passive heat sink method reduces the temperature to some extent, as shown in
Figure 14b.
The temperature of the PV module cooled by the heat sink method was 24.2 °C at 8:00 am (2.1l °C lower than the panel with no cooling system) The temperature of the module kept increasing with time until it reached 62.1 °C at 1:00 pm (4.8 °C less than the panel with no cooling). At 1:00 pm, the temperature of the PV module was still 37.1 °C more than the STC (25 °C). The temperature of the module then decreased to 55.1 °C at 3:00 pm. The cooling systems were not turned on before the temperature of the panel reached 50 °C, as the literature survey suggests that it is not economical to use a cooling system at a low temperature [
29].
The temperature of the PV module reached 50.1 °C at 10:45 am. The temperature of the PV module was lowered to 35.1 °C (11:03 am) by the water sprinkling method for cooling (
Figure 13c). On the other hand, there was a continuous increase in temperature of the PV module that reached 37.2 °C at 11:16 am until the water was sprinkled on the module at 11:30 am. The temperature of the PV module was kept in the range of 35.1 °C to 39.8 °C by sprinkling water every 30 min.
Figure 14 compares the solar PV modules with different cooling systems. Compared to the water sprinkling method, the closed looped water cooled system and active air cooling by fans requires a continuous operation. The temperature of the PV module was lowered to 46.1 °C at 11:02 am by the closed loop method. The temperature of the module kept increasing with time until it reached 57.1 °C at 1:00 pm. At 1:00 pm, the temperature of the PV module was 32.1 °C more than the STC (25 °C). The temperature of the module then decreased to 56.1 °C at 2:00 pm and 49.9 °C at 3 pm. Cooling the solar panels by air reduced the temperature of the panel to 39.2 °C and this temperature for the solar panel was maintained. Although a slight variation occurs, it still keeps the temperature in the range of 39.2 °C to 40 °C. Important data for thermal images is summarized in
Table 6. The temperature data shows that the water sprinkling method and air cooled methods are more effective than the heat sink and the closed looped method for cooling solar PV system. Among water sprinkling and cooling by air, water sprinkling offered a lower temperature.
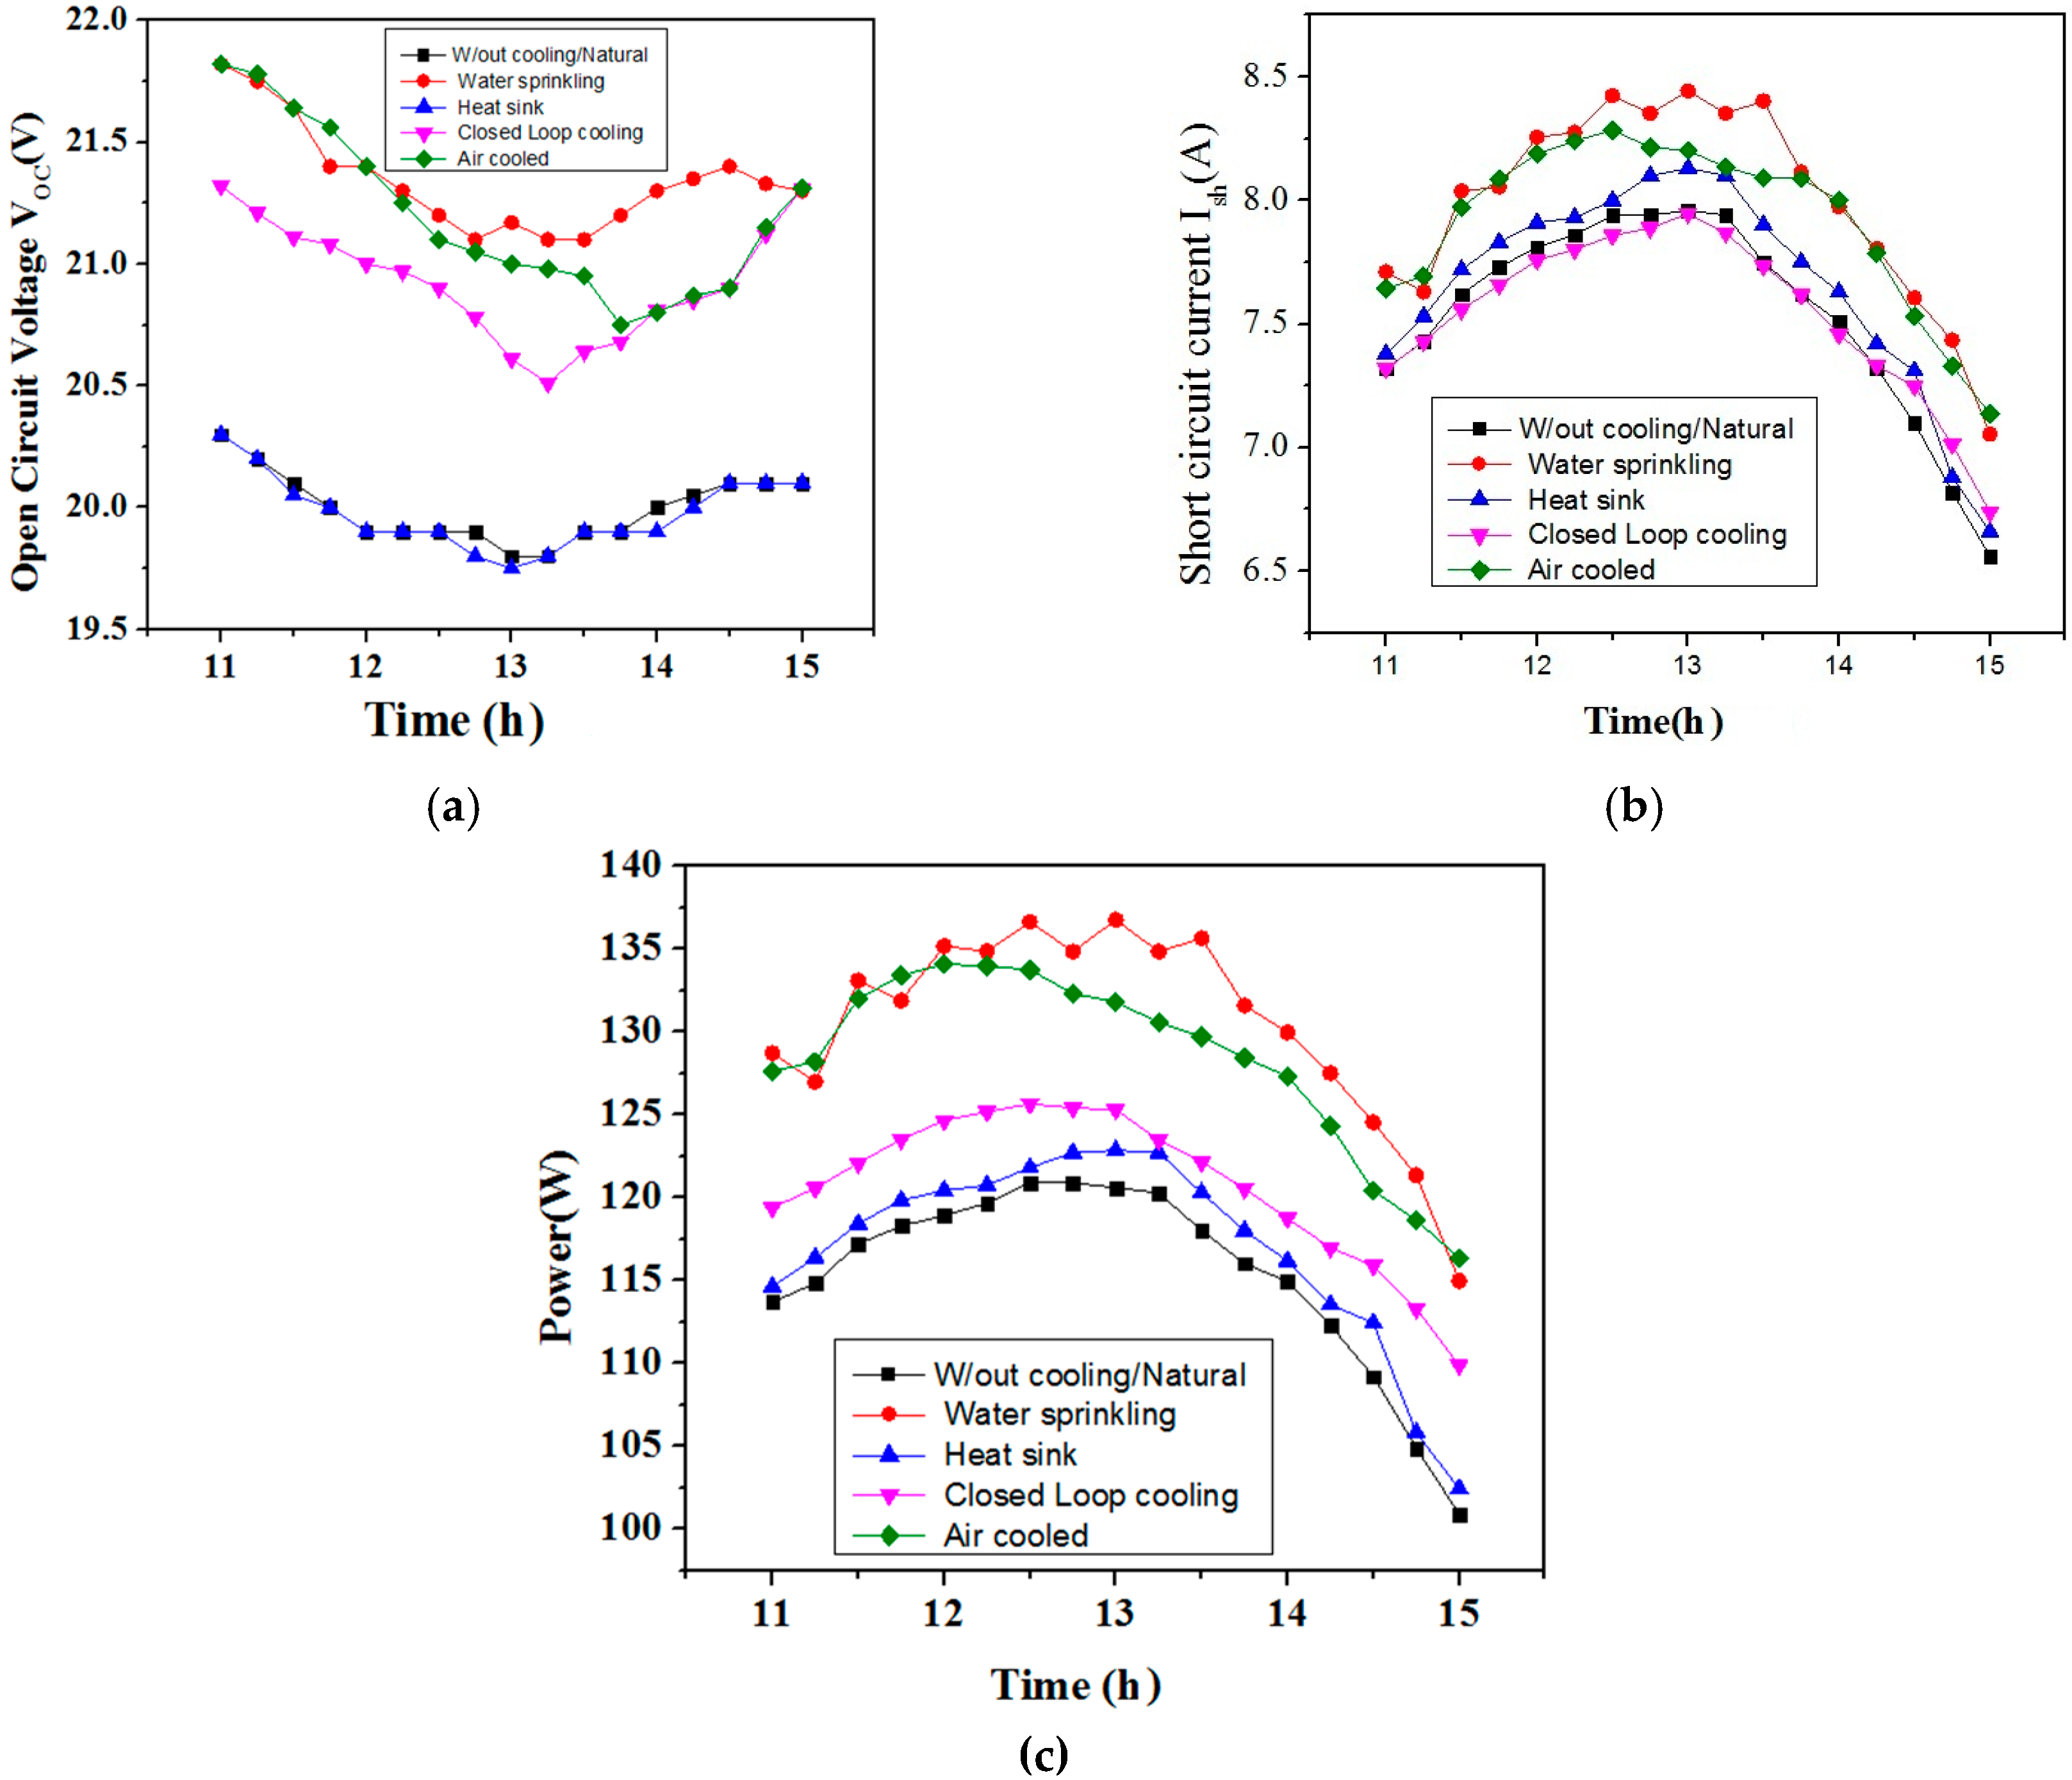
The open circuit voltage (
Voc), short circuit current (
Ish), and output power of different cooling system were compared.
Figure 14a shows that the open circuit voltage decreases with increasing temperature. The values for
Voc are higher at 11:00 am and decreased with increasing temperature; the lowest values for
Voc were observed between 1:00 pm to 2:00 pm, which then increased with decreasing temperature. Moreover, the values of
Voc for water sprinkling and air cooled method were higher (20.9 V to 21.82 V) than
Voc for the system with no cooling and system with heat sink (19.75 V to 21.18 V).
Voc for the closed loop method was in the range of 20.51 V to 21.32 V.
The short circuit current (
Ish) curves for all the systems are shown in
Figure 14b. The short circuit values for the solar panel with no cooling ranged from 6.56 A to 7.96 A between 11:00 am to 3:00 pm with maximum values between 12:30 pm to 1:30 pm. The short circuit values for the solar panels with heat sinks for heat dissipation were within the range of 6.66 A to 8.13 A between 11:00 am to 3:00 pm. The
Ish values for the solar panel cooled with the water sprinkling method ranged from 7.05 A to 8.44 A between 11:00 am and 3:00 pm. The
Ish values for solar panel with the closed looped system ranged from 6.73 A to 7.94 A between 11:00 am and 3:00 pm.
Ish for forced air by fans ranged from 7.13 A to 8.21 A. The
Ish values for the water sprinkling system were the highest, whereas the values for the heat sink method were the lowest.
Figure 14c shows the output power delivered by each system. The maximum output power delivered by the solar panel with no cooling system was 120.90 W at 12:30 pm. The maximum output power extracted from the solar panel with heat sinks, air cooled method, and the closed loop was 122.86 W, 134.08 W, and 125.66 W, respectively. The average power delivered by the system with no cooling, water sprinkling method, heat sink method, and closed loop method between 11:00 am to 3:00 pm was 115.3 W, 130.56 W, 117.03 W, 128.41 W, and 120.75 W, respectively. The percentage increase in average output power of the PV module with the heat sink, closed loop, and air cooled was 1.41%, 5.36%, and 11.2% respectively. Interestingly, the solar PV module with the water sprinkling method showed an enhanced but variable output power (max 136.77 W) due to the cooling effect of water. The percentage increase in output power of the solar PV module with water sprinkling was 13.14%. Moreover, this method not only helped improve the output power by lowering the solar PV temperature but also helped overcome the lowering of power caused by the accumulation of dust on the solar panels.
4.4. Combined Effect of Cooling System and Reflectors
Overall, aluminum foil was the most effective and least expensive option. Therefore, aluminum foil with the same size as that of the solar panel was used for all four cooling systems and an increase in power was noticed from 8:00 am to 5:30 PM.
Figure 15 shows the output power of these solar panels with different cooling systems. The use of aluminum foil with the cooling system helps obtain more power from the solar PV system. The average power delivered by the solar panel with no reflector and no cooling system was 90.76 W. The average power delivered by the solar panel with no cooling system but with reflectors was 110.98 W. The average power delivered by the solar panel with a reflector and heat sink cooling was 113.25. The average power by the solar panel with a reflector and air cooled and closed loop (with reflector) was 122 W and 120 W respectively. In contrast, the average power by the solar panel with a reflector and water sprinkling method was 125.75 W. Combined effect of using Al foil reflector and water sprinkling method for cooling offers 38.55% increase in output power. The aluminum foils were more effective in the morning and evening and offered an average of approximately 48% increase in the output power of solar PV module.
4.5. Cost Effective Solution, Optimal Control and Implementation Plan
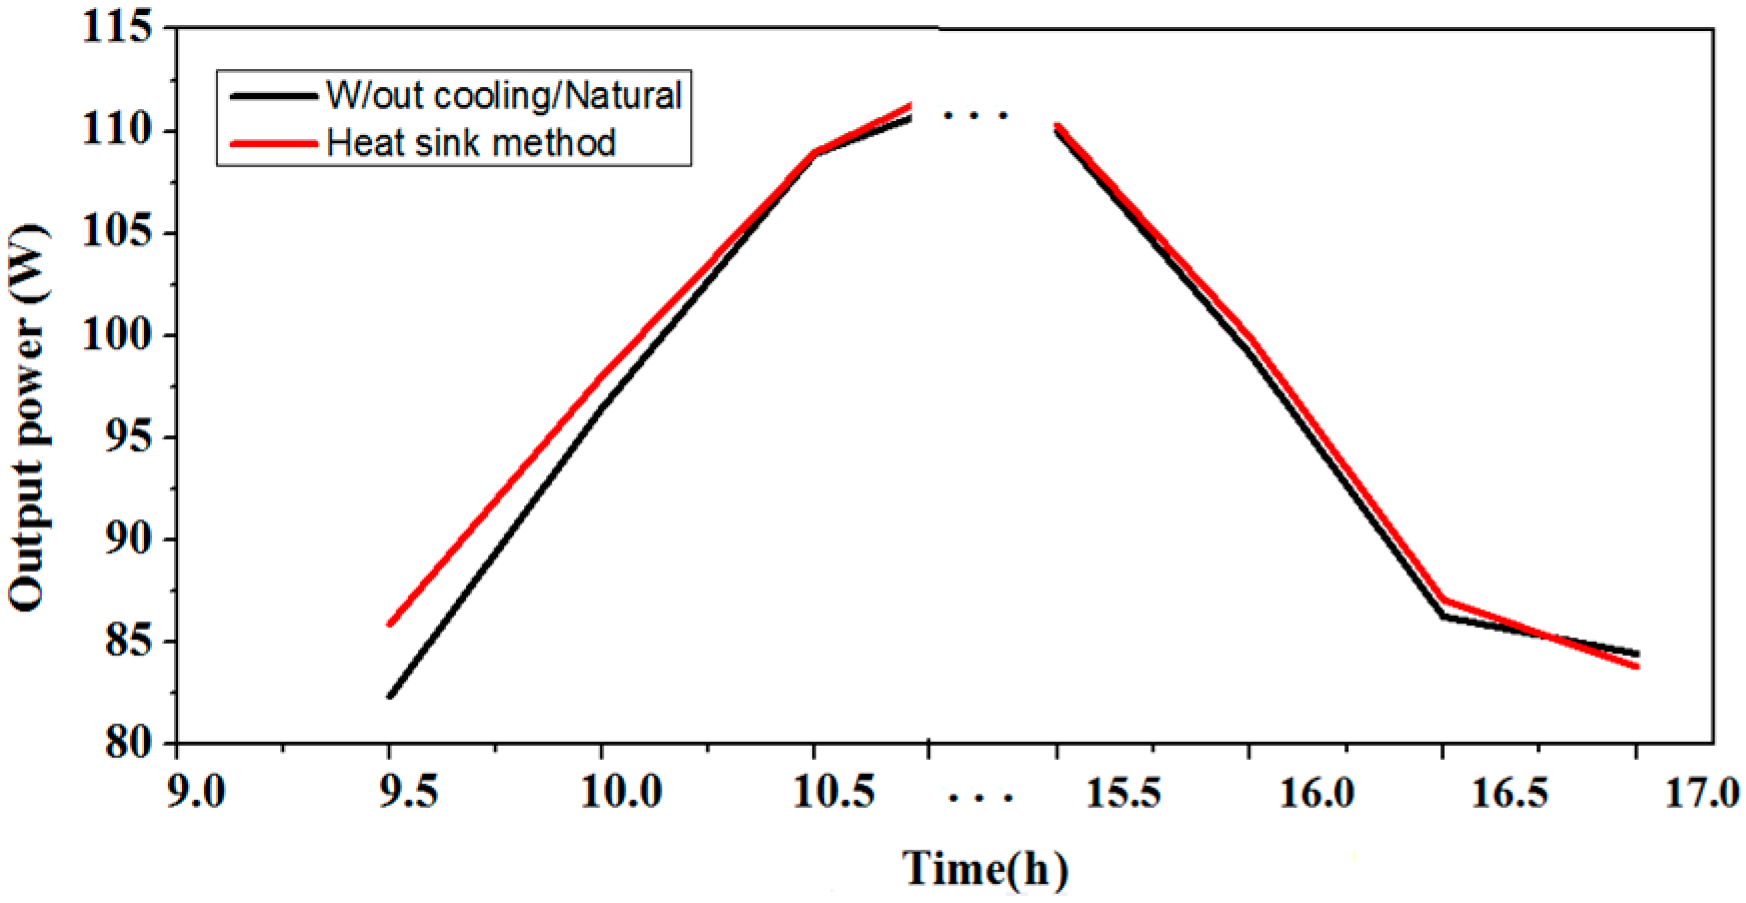
Comparative analysis of different cooling systems with and without reflectors revealed the water sprinkling method to be the most efficient of all the methods assessed. On the other hand, every method has some advantages and disadvantages. For example, installing a heat sink on the rear side of a solar panel offers the least improvement in the output power of the solar PV module but it does not require external power to operate. It offers some cooling even when other cooling systems are not recommended to be operated for that time period i.e., Morning 9:30 to 11:00 and evening 15:30 to 17:00 (
Figure 16).
The net increase in the output power by heat sink method is very less compared to the initial investment required to install these heat sinks at the rear side of each solar panel and may not be an economical solution for many users. The performance of the heat sink method can be improved by increasing the natural air flow. On the other hand, the availability of natural air with a high flow rate cannot be guaranteed during real time practical installation because it depends on the climate of the location where the PV system is to be installed.
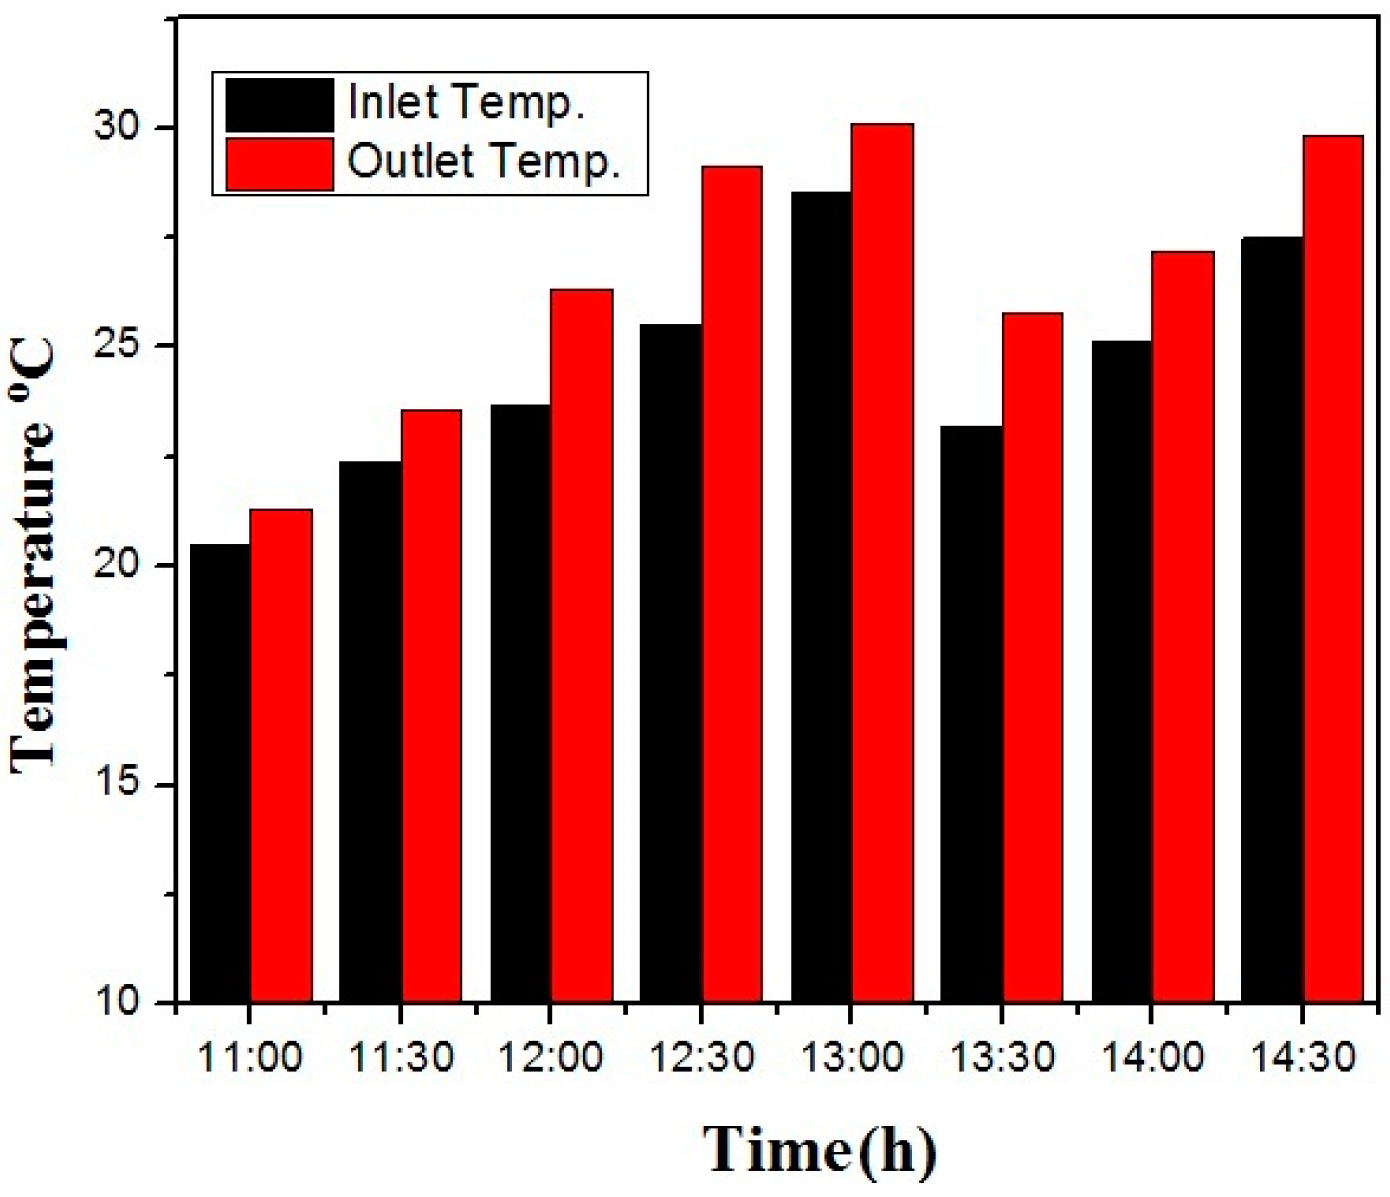
The water sprinkling method is the most efficient of all the methods discussed in this paper but it requires water and power to sprinkle water at regular intervals. The closed loop method offers not only a moderate enhanced output power from the solar panel, but also increases the water temperature (an average of 2.66 °C in the experimental setup). Inlet and outlet temperature of water with closed loop technique at different interval of time is shown in
Figure 17.
In addition, it requires a continuous operation of the water pump motor to circulate water in the pipe attached to the solar panel on its rear side. Electric power is needed to run this motor (a 10 W water pump was used for the closed looped system in this experiment). The increase in output power of the solar panel with a closed loop system was less than the power required to operate the motor. The air cooled method is also very effective in reducing the temperature of the solar panel and enhancing the output power. This method, however, requires power to operate the fans attached to the solar panel for cooling. The performance of this method increases with increasing number of fans. A total of 8 fans with each fan consuming 1.92 W (a total of 15.36 W) was required to operate this system. From the results, it is clear that a cooling system has a positive impact on the output power of the solar PV system. On the other hand, selection of a specific cooling technique depends on the users’ demand.
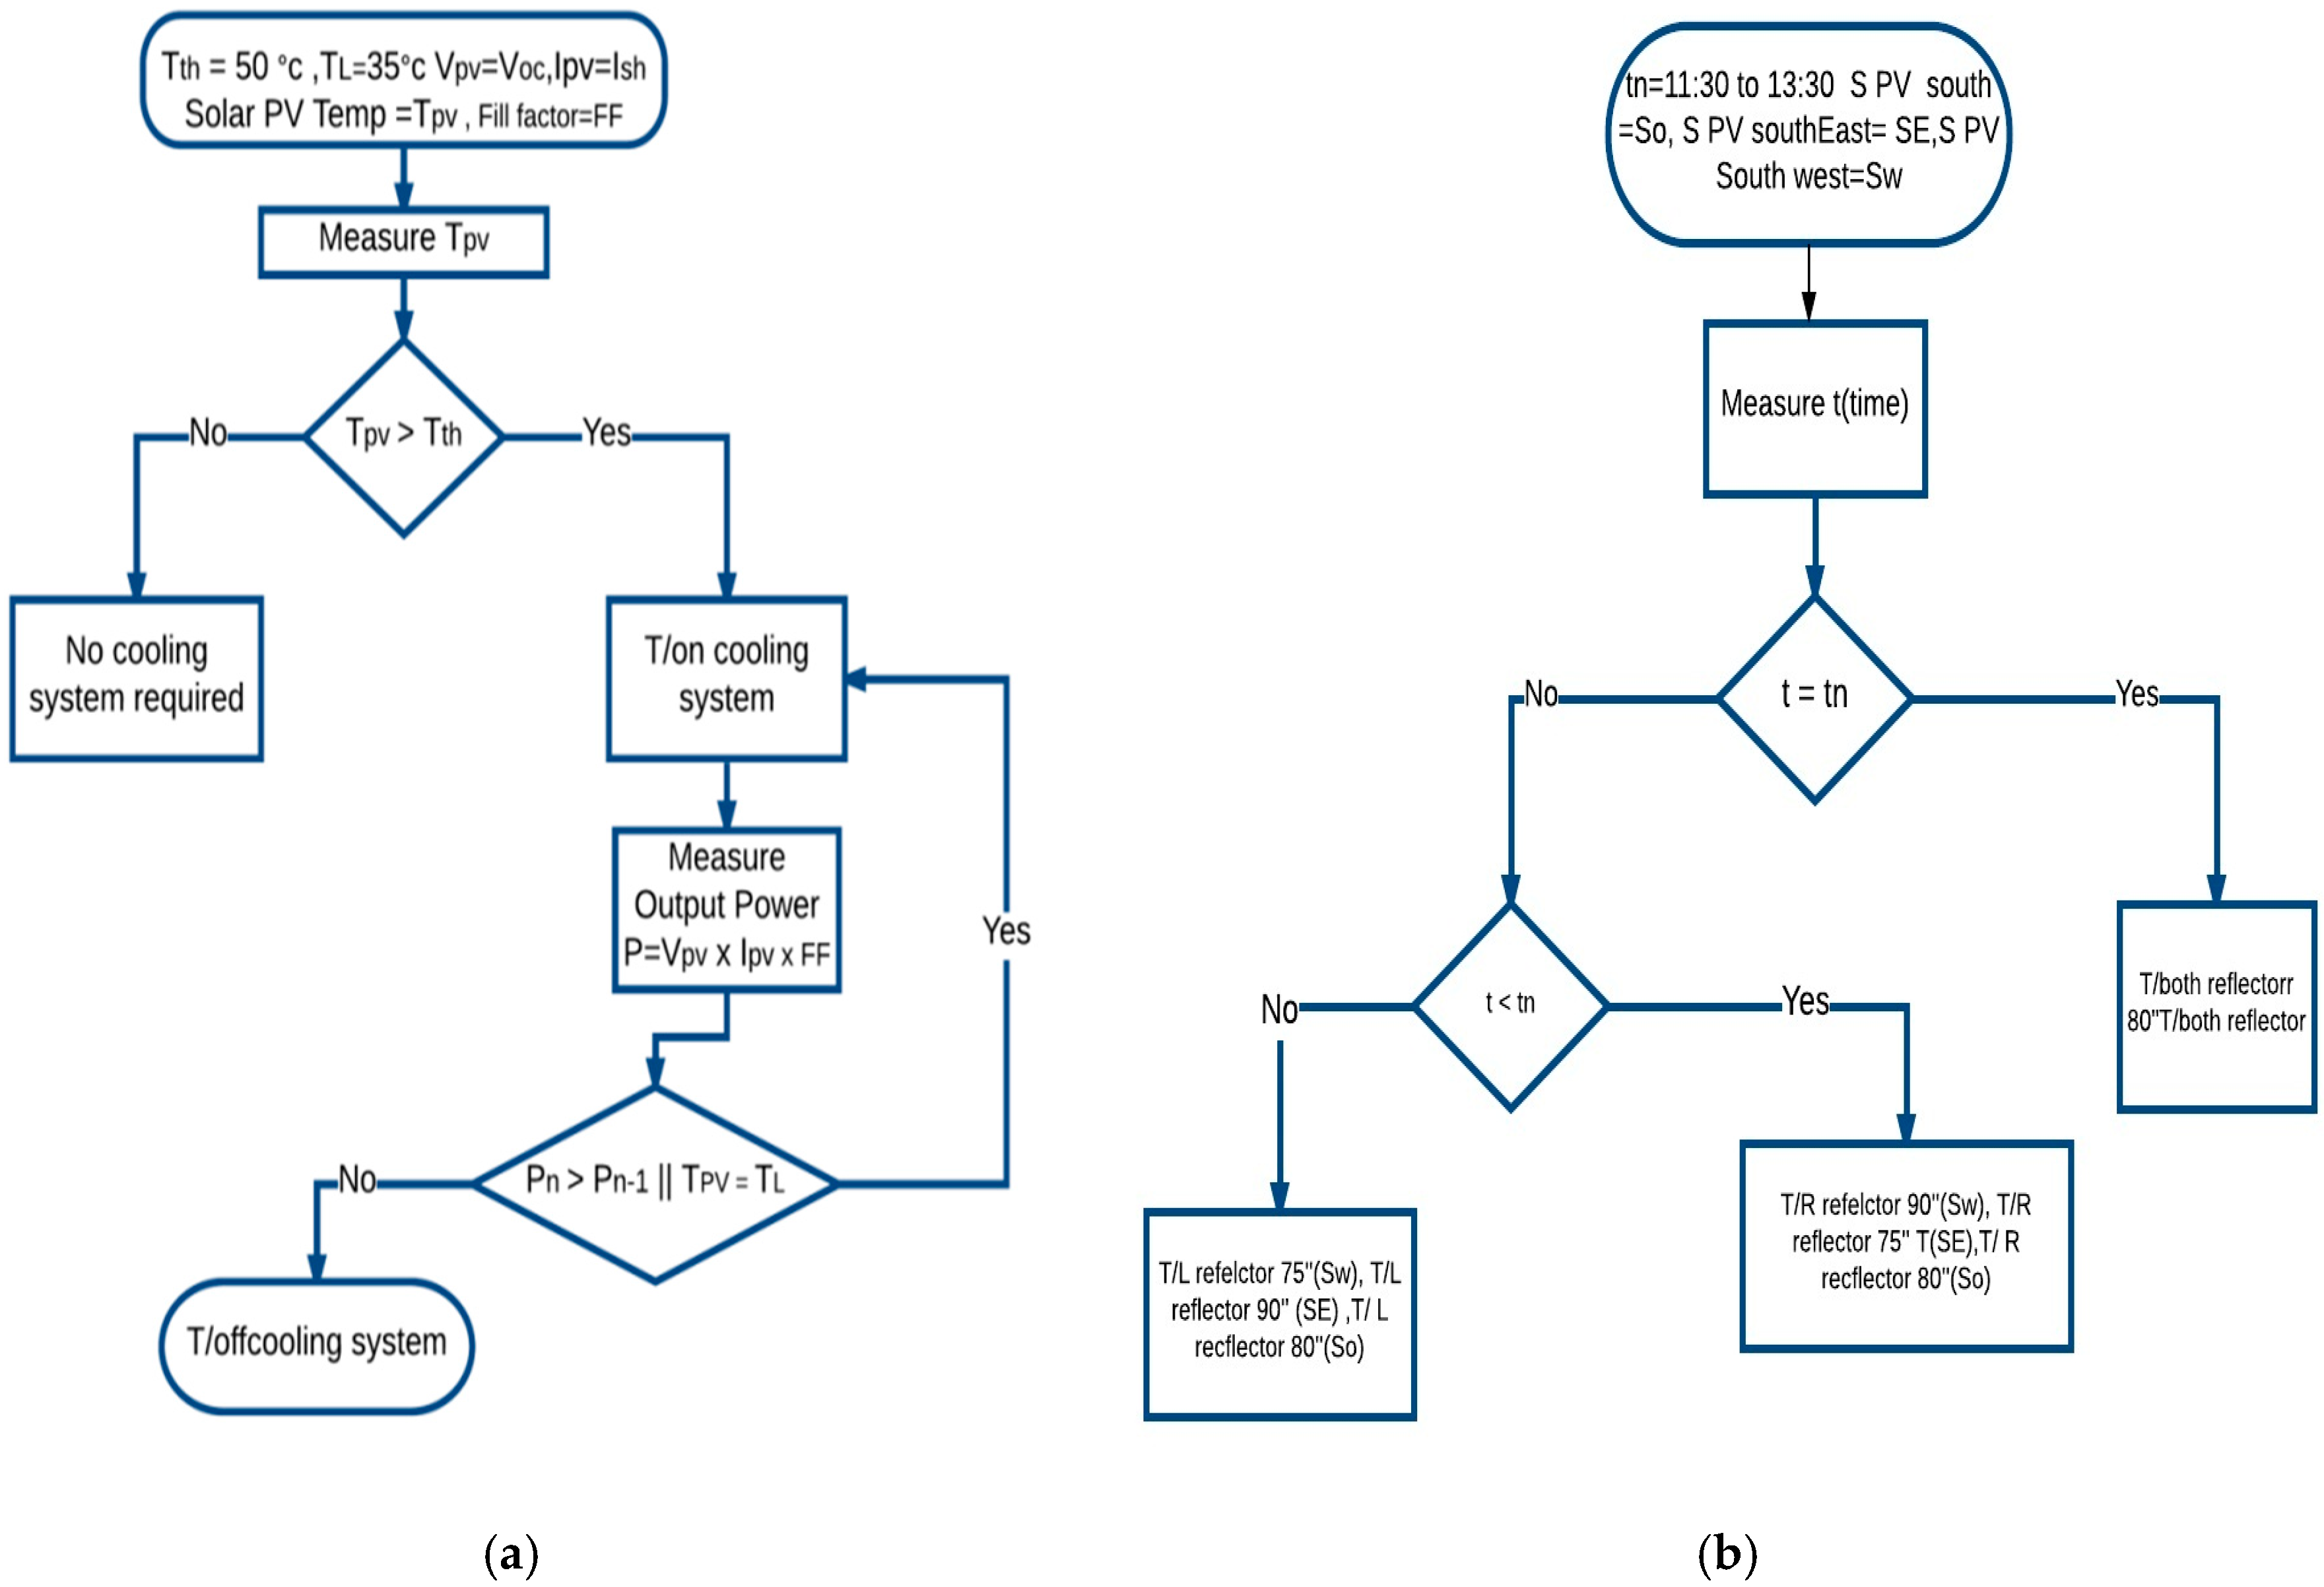
The continuous operation of a cooling system is not recommended for a solar PV system. The increase in the output power of a solar PV system will be less than the power required to run these systems. A mechanism is needed to determine when to turn on and off the cooling system [
32]. Based on the work done in [
33], a threshold temperature (
Tth) of 50 °C was decided and an algorithm that can provide for the optimal operation of the cooling system was developed and can be implemented easily on an Arduino controlled program with some basic electronics components. This algorithm describes the turn on the cooling system when
Tth = 50 °C and turn off the system when the solar PV module (
TPV) =
TL or when
Pn >
Pn−1, i.e., no improvement in output power using cooling system. An algorithm for the optimal control of BRPVS system is shown by the flowchart in
Figure 18. Enhanced solar PV output power requires optimal BRPVS. The results in
Section 4 show that the movement of reflectors varies with time and the optimal angle between the reflector and solar panel is required.
Figure 18 shows an algorithm for the timed-based optimal control BRPVS system. If time
t =
tn, turn both reflectors on; if
t <
tn, move the right reflector described in the algorithm; if
t >
tn, move the left reflector to an angle given in the algorithm. The algorithm shown in the figure summarizes only the movement of the reflector based on the experimental studies in this research; an algorithm for hardware implementation may require a proper explanation of the system using a LDR/CDS sensor.


