Abstract
The effect of the discharge pressure on the performance of the trans-critical CO2 heat pump with a low gas-cooler outlet temperature is experimentally investigated on a test rig of water source heat-pump water heater. The optimal discharge pressure of the trans-critical CO2 heat pump is investigated under different external operation conditions. When the tap-water temperature is low, the characteristic of the S-shape isotherm at the supercritical region has little effect on the occurrence of the optimal discharge pressure; while the mass flow rate of CO2, the suction pressure and the gas-cooler outlet temperature play a significant role in determining the emergence of the optimal discharge pressure. At the optimal discharge pressure, the COP reaches the peak; however, the corresponding heating capacity is still lower than its maximum, which is reached as the discharge pressure is slightly above the optimal discharge pressure. Reducing the tap-water flowrate or increasing the water-source temperature can increase the optimal discharge pressure. The COP is positively dependent on both the tap-water flowrate and the water-source temperature. In addition, the tap-water flowrate has a negligible influence on the maximum heating capacity while increasing the water-source temperature can greatly enhance the heating capacity.
1. Introduction
Owing to numerous incomparable advantages like excellent environmental compatibility and heat transfer characteristic, carbon dioxide (CO2) has been widely acknowledged as the most competitive alternative refrigerant. Since Lorentzen and Pettersen put forward the application of the trans-critical CO2 system in the mobile air-conditioning [1], replacing CFC and HCFC refrigerants with CO2 has attracted great attention in many industrial fields.
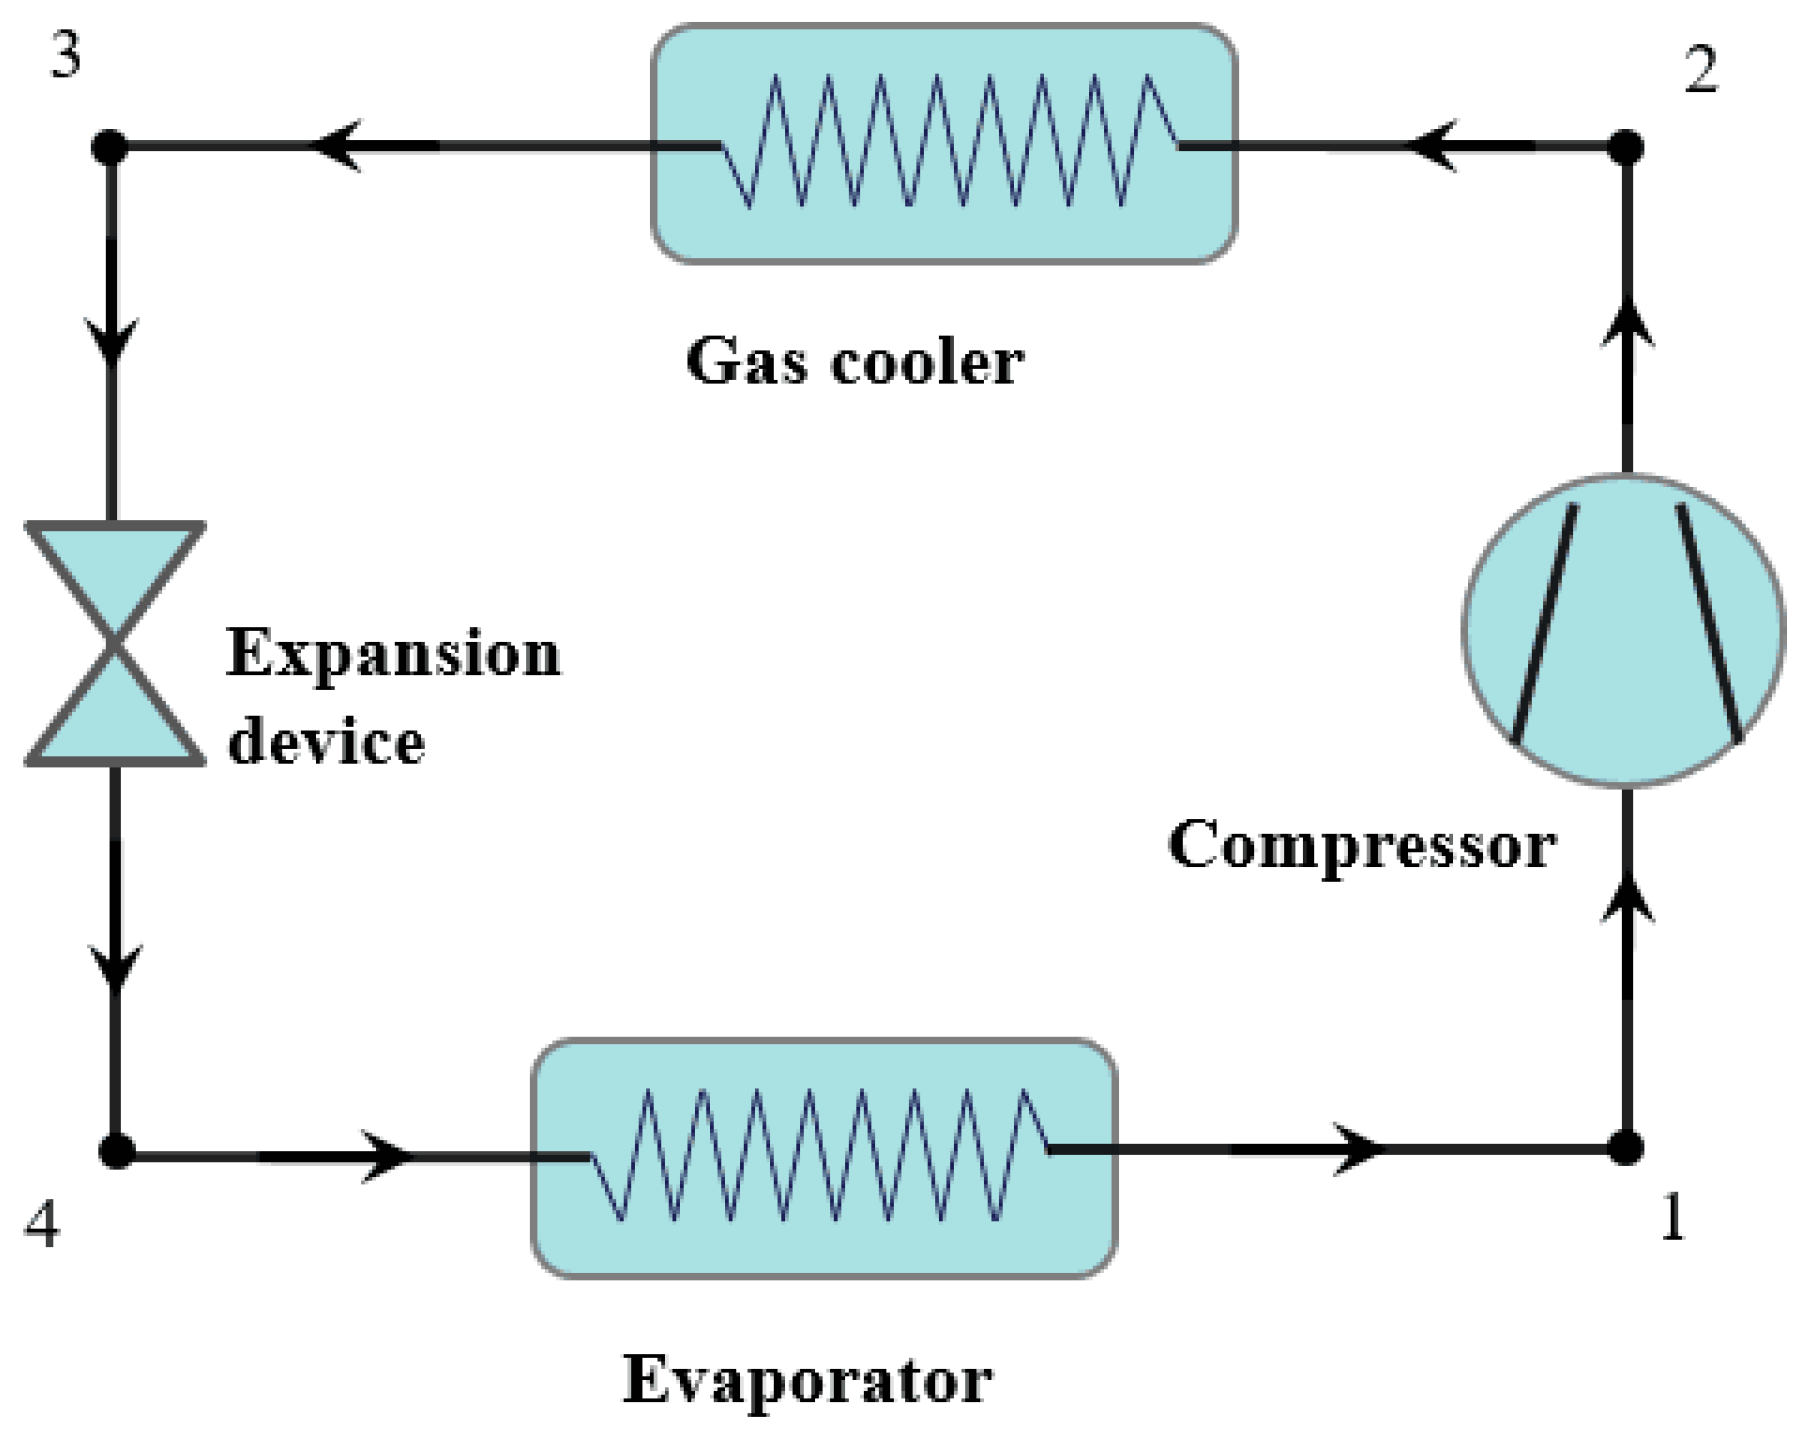
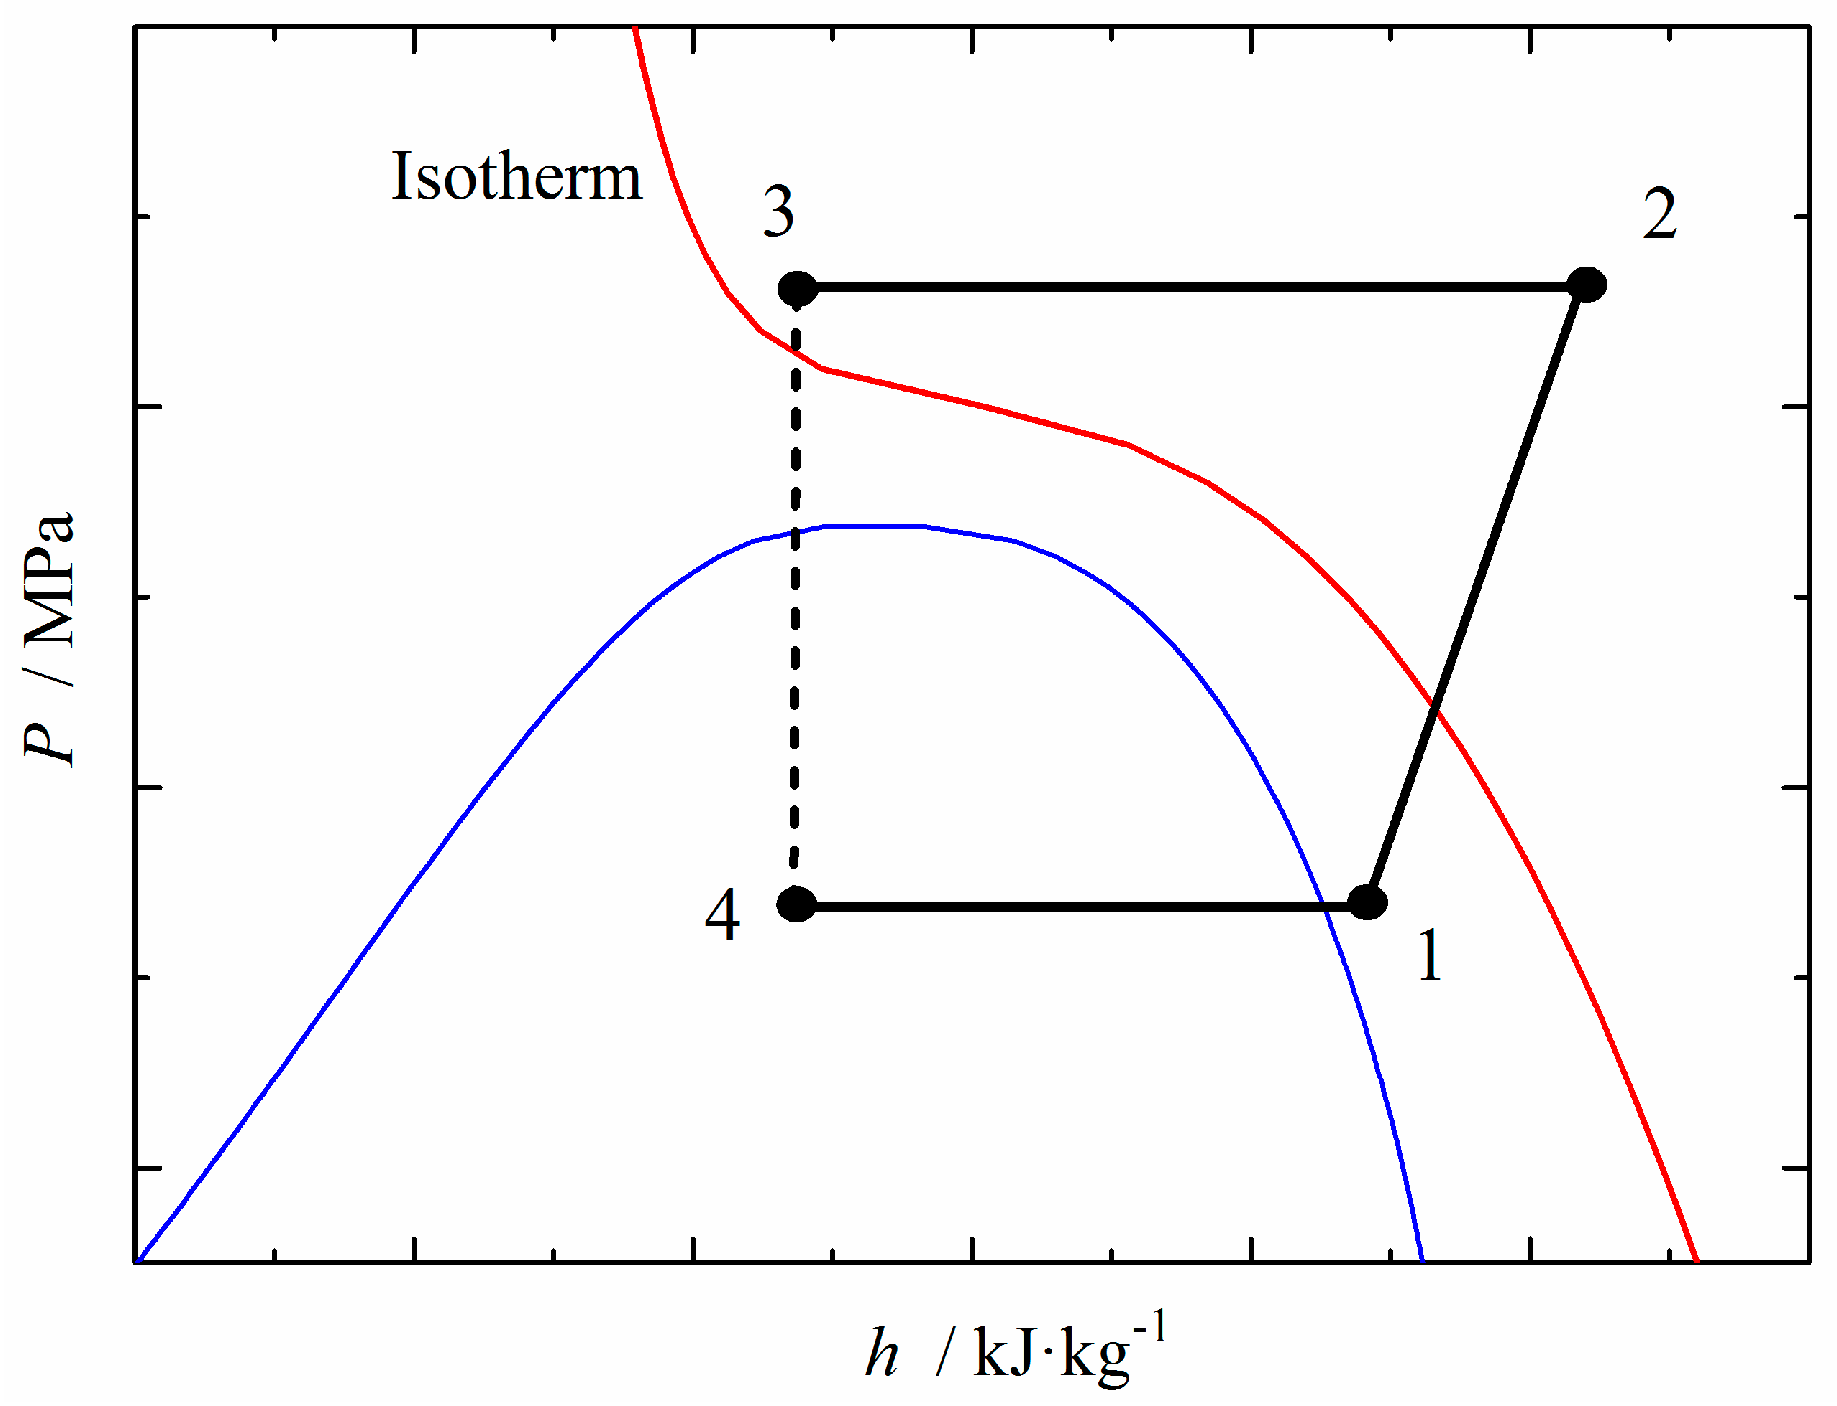
Conventional air-conditioning and refrigerating systems with CO2 as the working medium operate in trans-critical mode. In a trans-critical system, the heat rejection process occurs above the critical point while the heat absorbing process takes place below the critical point. While, in a sub-critical system, both the absorbing and rejection of heat process take place below the critical point. It is the unique characteristic of the trans-critical CO2 system that makes it different from the traditional sub-critical system [2,3]. The main components of a trans-critical CO2 system include a compressor, a gas cooler, an expansion device and an evaporator. The simplified sketch and the corresponding pressure-enthalpy diagram of a trans-critical CO2 system are shown in Figure 1 and Figure 2 respectively. As shown in Figure 2, the isotherms in the super-critical region are S-shaped. The isotherms are flattened a bit above the critical point, while in other area, the isotherms are steep. The unique characteristic of the S-shaped isotherm is the main reason for the emergence of the optimal discharge pressure in a trans-critical CO2 system [2,3].

Figure 1.
Simplified sketch of a trans-critical CO2 cycle.
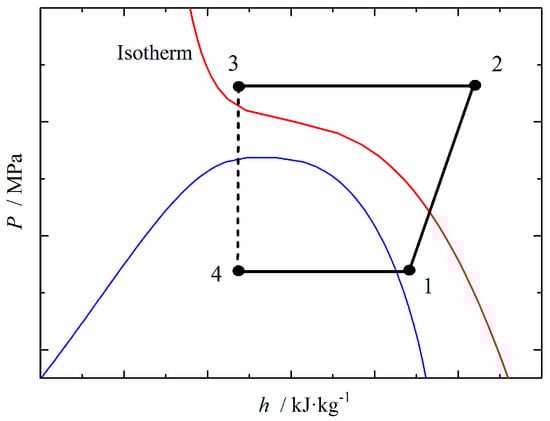
Figure 2.
Pressure-enthalpy diagram of a trans-critical CO2 cycle.
The optimal discharge pressure is one of the research hotspots in the trans-critical CO2 systems. In recent years, many theoretical analysis and experimental investigations were carried out on this topic [2,3,4,5,6,7,8,9,10,11], and some stressed on the optimal discharge pressure control [12,13,14]. However, most of these studies focused on the operating conditions when the CO2 temperature at the gas-cooler outlet is above the critical temperature.
The trans-critical CO2 heat-pump water heater has gained much attention nowadays because it can produce hot-water with higher temperature (up to 90 °C) while having a relatively high system COP [15,16]. Much effort has been devoted to the system performance evaluation [17,18,19,20] and many novel optimizing strategies have been proposed based on extensive theoretical analysis and experimental tests [13,21,22]. Some other studies examined the performance of the gas cooler [23,24,25].
The tap-water temperature of the trans-critical CO2 heat-pump water heater is normally lower than the critical temperature of CO2. Due to the influence of the tap-water temperature, the gas-cooler outlet temperature is often below the critical temperature as well [15]. Hitherto only a few researchers have investigated the optimal discharge pressure of the trans-critical CO2 system with lower gas-cooler outlet temperature. To be specific, it is lower than the critical temperature of CO2. Wang et al. [26] studied the influences of the low-temperature heat source temperature as well as the hot-water outlet temperature on the system performance on a test bed of air-source trans-critical CO2 heat-pump water heater. The gas-cooler outlet temperatures involved in their study was below the critical temperature. It was found that the CO2 gas-cooler outlet temperatures and the evaporating temperatures had significant influences on the system COP and the optimal discharge pressure because of unique thermophysical properties of CO2 around the critical point and similar sensible heat transfer in gas cooler.
The optimal discharge pressure is of great importance in the performance of a trans-critical CO2 heat-pump system, while studies concerning the role of the optimal discharge pressure are still lacking for the heat-pump water heater system with lower gas-cooler outlet temperature. Motivated by this, we experimentally studied the performance of the trans-critical CO2 heat pump with lower gas-cooler outlet temperatures. The optimal discharge pressures under different external operating conditions were obtained. In addition, it is also studied the effects of the water-source temperature and the tap-water flowrate on the system performance.
2. Materials and Methods
2.1. Experimental Apparatus
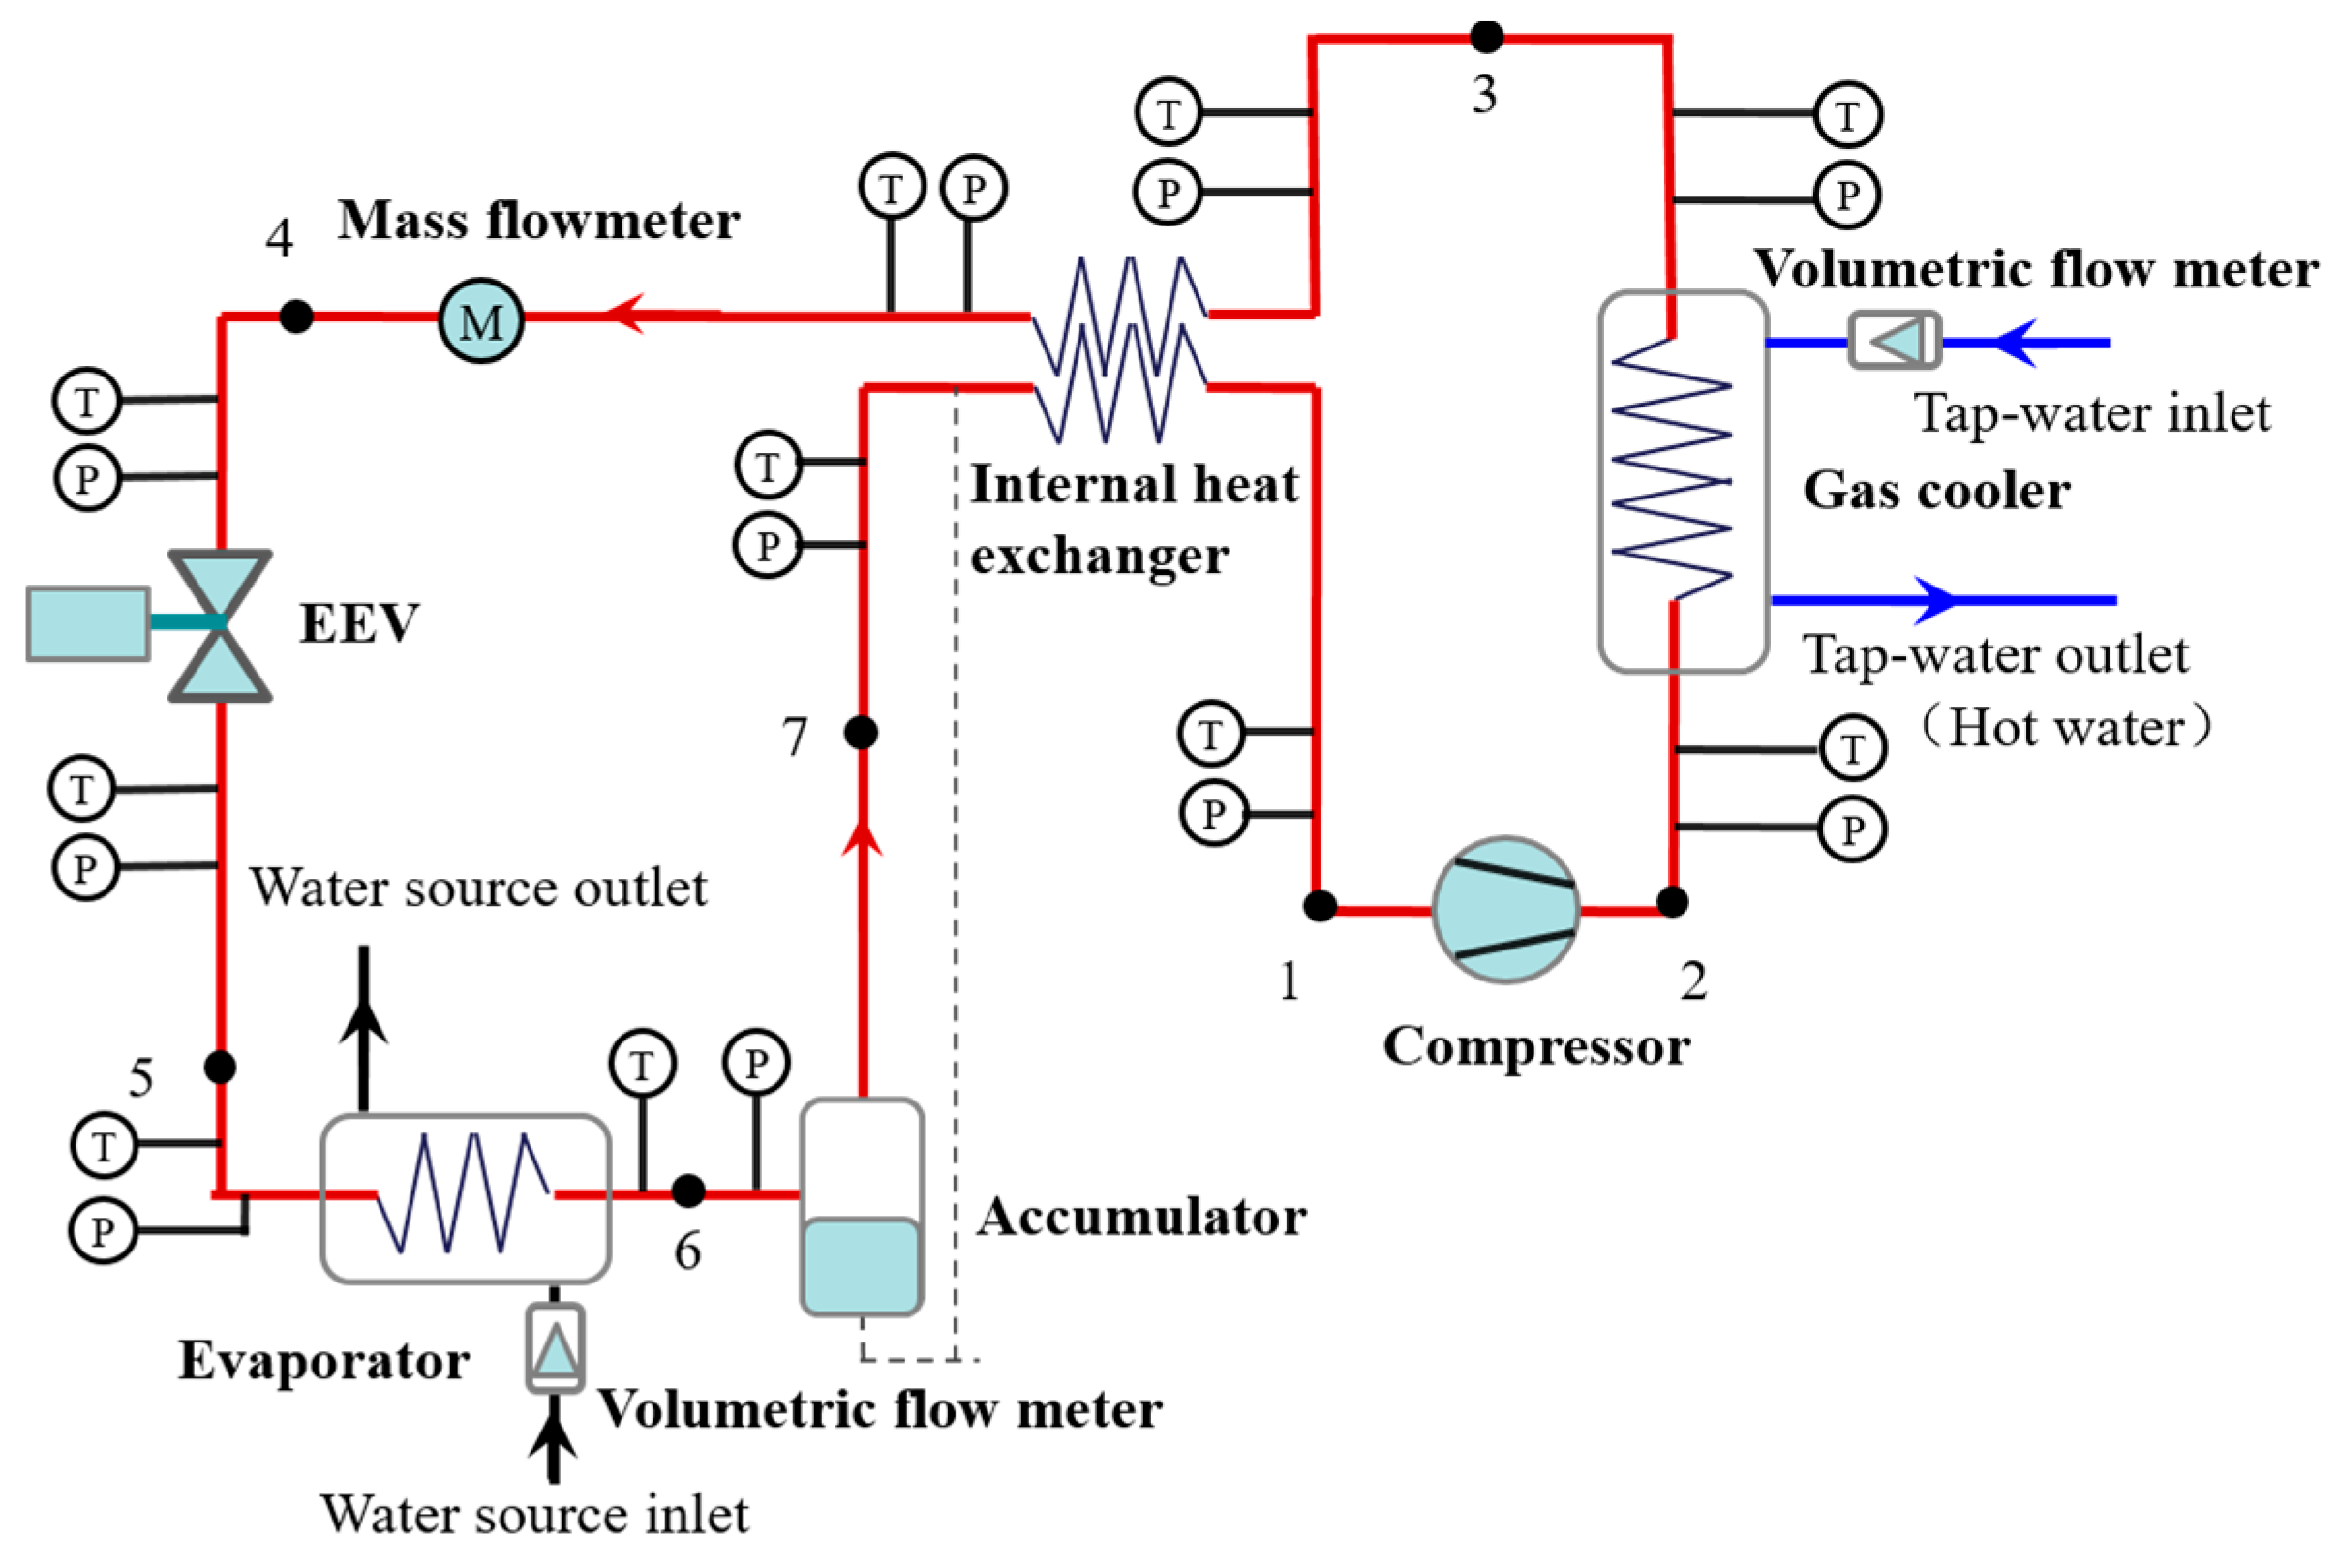
The test rig of water source trans-critical CO2 heat-pump water heater consists of three major components: water-supply system, heat-pump system and data collection system. The schematic diagram of this experimental system is shown in Figure 3. It is composed of a gas cooler, an evaporator, a compressor, an accumulator, an internal heat exchanger, and an electronic expansion valve (EEV). Detailed information about the main components is summarized in Table 1. The internal heat exchanger is used to cool the working fluid discharging from the gas-cooler and heat the suction gas of the compressor simultaneously for purpose of weakening the flash evaporation inside the EEV and avoiding the liquid shock of the compressor [27,28].
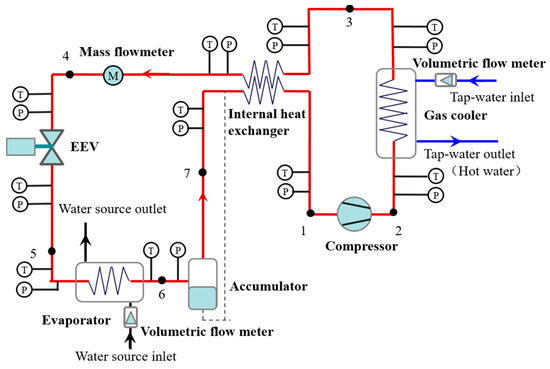
Figure 3.
Schematic diagram of the experimental system.

Table 1.
Main components.
At first, the superheated gas outflowing from the internal heat transfer is pressurized by the compressor (1–2) and then cooled in the gas cooler by the tap water (2–3) and the internal heat exchange (3–4) successively. After that, the working fluid flows through the EEV, in which its pressure and temperature drop significantly (4–5). Then, the CO2 gas-liquid mixture absorbs heat from the water source in the evaporator (5–6) and gathers in the accumulator (6–7). Finally, it is superheated in the internal heat exchanger (7–1) and then a new cycle begins.
T-type thermocouples were adopted to measure the temperatures in the experimental system. The measurement accuracy is ±0.2 °C in the range of −10 °C to 150 °C. CO2 flowrate was measured by a Coriolis mass flow meter (SITRANS F C, Siemens Co, Munich, German) with the accuracy at ±0.1% in the range of 0 to 5600 kg·h−1. Diffusion silicon pressure transmitters with the accuracy at ±0.25% (0–6 MPa and 0–16 MPa, respectively) were used to measure the CO2 pressures. Turbine volumetric flow meters (LWGYC-20, Beijing Flowmeter Factory, Beijing, China) with the accuracy at ±0.5% (0.06~0.6 m3·h−1 and 0.6~6.0 m3·h−1, respectively) were used to measure water flowrates. Compressor power was measured by a digital wattmeter (QZ8716C1, Qingzhi Instruments, Qingdao, China) with the uncertainty at 0.1% (AC: 0–500 V; V: 0.03–40.00 A). All the readings were collected by a data acquisition device (MV2000, Yokogawa Meters & Instrument Corporation, Tokyo, Japan).
2.2. Data Reduction and Uncertainty Analysis
The heating capacity Q refers to the heat transferred to the tap water in the gas cooler. It is calculated according to the Formula (1):
where is the volume flowrate of water, is the density of water, is the constant-pressure specific heat of water, and is the temperature rise of the water in the gas cooler.
The compressor power W refers to the work input in the compressor for lifting heat from the evaporator to the gas cooler.
The COP is defined as the heat capacity divided by the compressor power, as shown in Formula (2):
The uncertainties of the indirectly measured variables (heat capacity and COP) can be estimated by the error transfer function [29], as shown in Function (3):
where is the total uncertainty associated with the dependent variable R, is the independent variable which affects the dependent variable R, and is the uncertainty of the independent variable .
According to the error transfer function as shown in Function (3), the uncertainty of the heating capacity can be estimated by the Formula (4):
where , and are the uncertainties of the heating capacity, the temperature rise and the volumetric flowrate, respectively.
The uncertainty of the COP can be estimated by the Formula (5):
where is the uncertainty of the compressor power.
Based on the above error transfer theory, the uncertainties of the heating capacity and the COP were estimated to be 1.8% and 1.9%, respectively.
2.3. Test Condition
Several parameters can be directly adjusted, including the water-source temperature, the water-source flowrate, the tap-water flowrate, the tap-water temperature and the EEV opening. The influence of the discharge pressure on the system performance can be tested by adjusting these parameters under different operating conditions. The experiment primarily investigated three aspects and the experimental conditions are shown in Table 2.
Table 2.
Experimental conditions.
The first one (See case 1 in Table 2) is the influence of the discharge pressure upon the system performance. In this part, the discharge pressure was regulated by adjusting the opening of the EEV when the temperature and the flowrate of both the water source and the tap water were kept unchanged. At a given EEV opening, the stable discharge pressure was achieved when the experimental system operated for at least 20 min. In the same way, a series of discharge pressures, which are corresponding to different EEV openings, were obtained under steady-state conditions. On this basis, the effects of the discharge pressure on the key parameters of the trans-critical CO2 heat-pump were investigated.
The second one (See case 2 in Table 2) is the effect of the tap-water flowrate on the system performance. In this case, the EEV opening and the tap-water flowrate were adjusted when the water-source flowrate, the water-source temperature and the tap-water temperature were kept constant. The characteristic parameters of the heat pump with different discharge pressures and the tap-water flowrates were obtained.
The last one (See case 3 in Table 2) is the influence of the water-source temperature upon the system performance. EEV opening and the water-source temperature were adjusted when the water-source flowrate, the tap-water temperature and the tap-water flowrate were kept constant. In this case, the characteristic parameters of the heat pump with different discharge pressures and water-source temperatures were achieved.
3. Results and Discussion
3.1. Discharge Pressure
In the experiment, the EEV opening was adjusted when the temperature and the flowrate of the water source, and the temperature and the flowrate of the tap water were kept constant. In this case, several performance parameters of the heat pump with different discharge pressures were obtained, including the suction pressure, CO2 mass flowrate, gas-cooler outlet temperature, COP, compressor power, hot-water outlet temperature and heating capacity, etc.
The effects of the discharge pressure upon the key parameters characterizing the trans-critical CO2 heat-pump system are illustrated in Figure 4, Figure 5 and Figure 6.
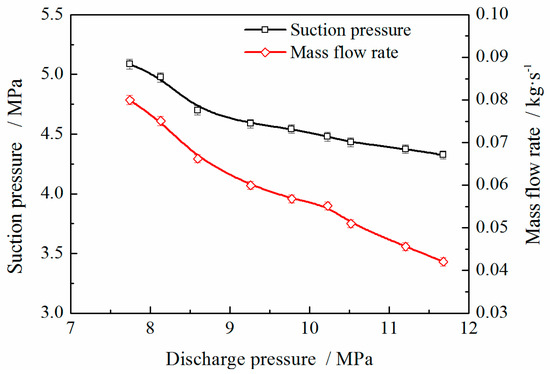
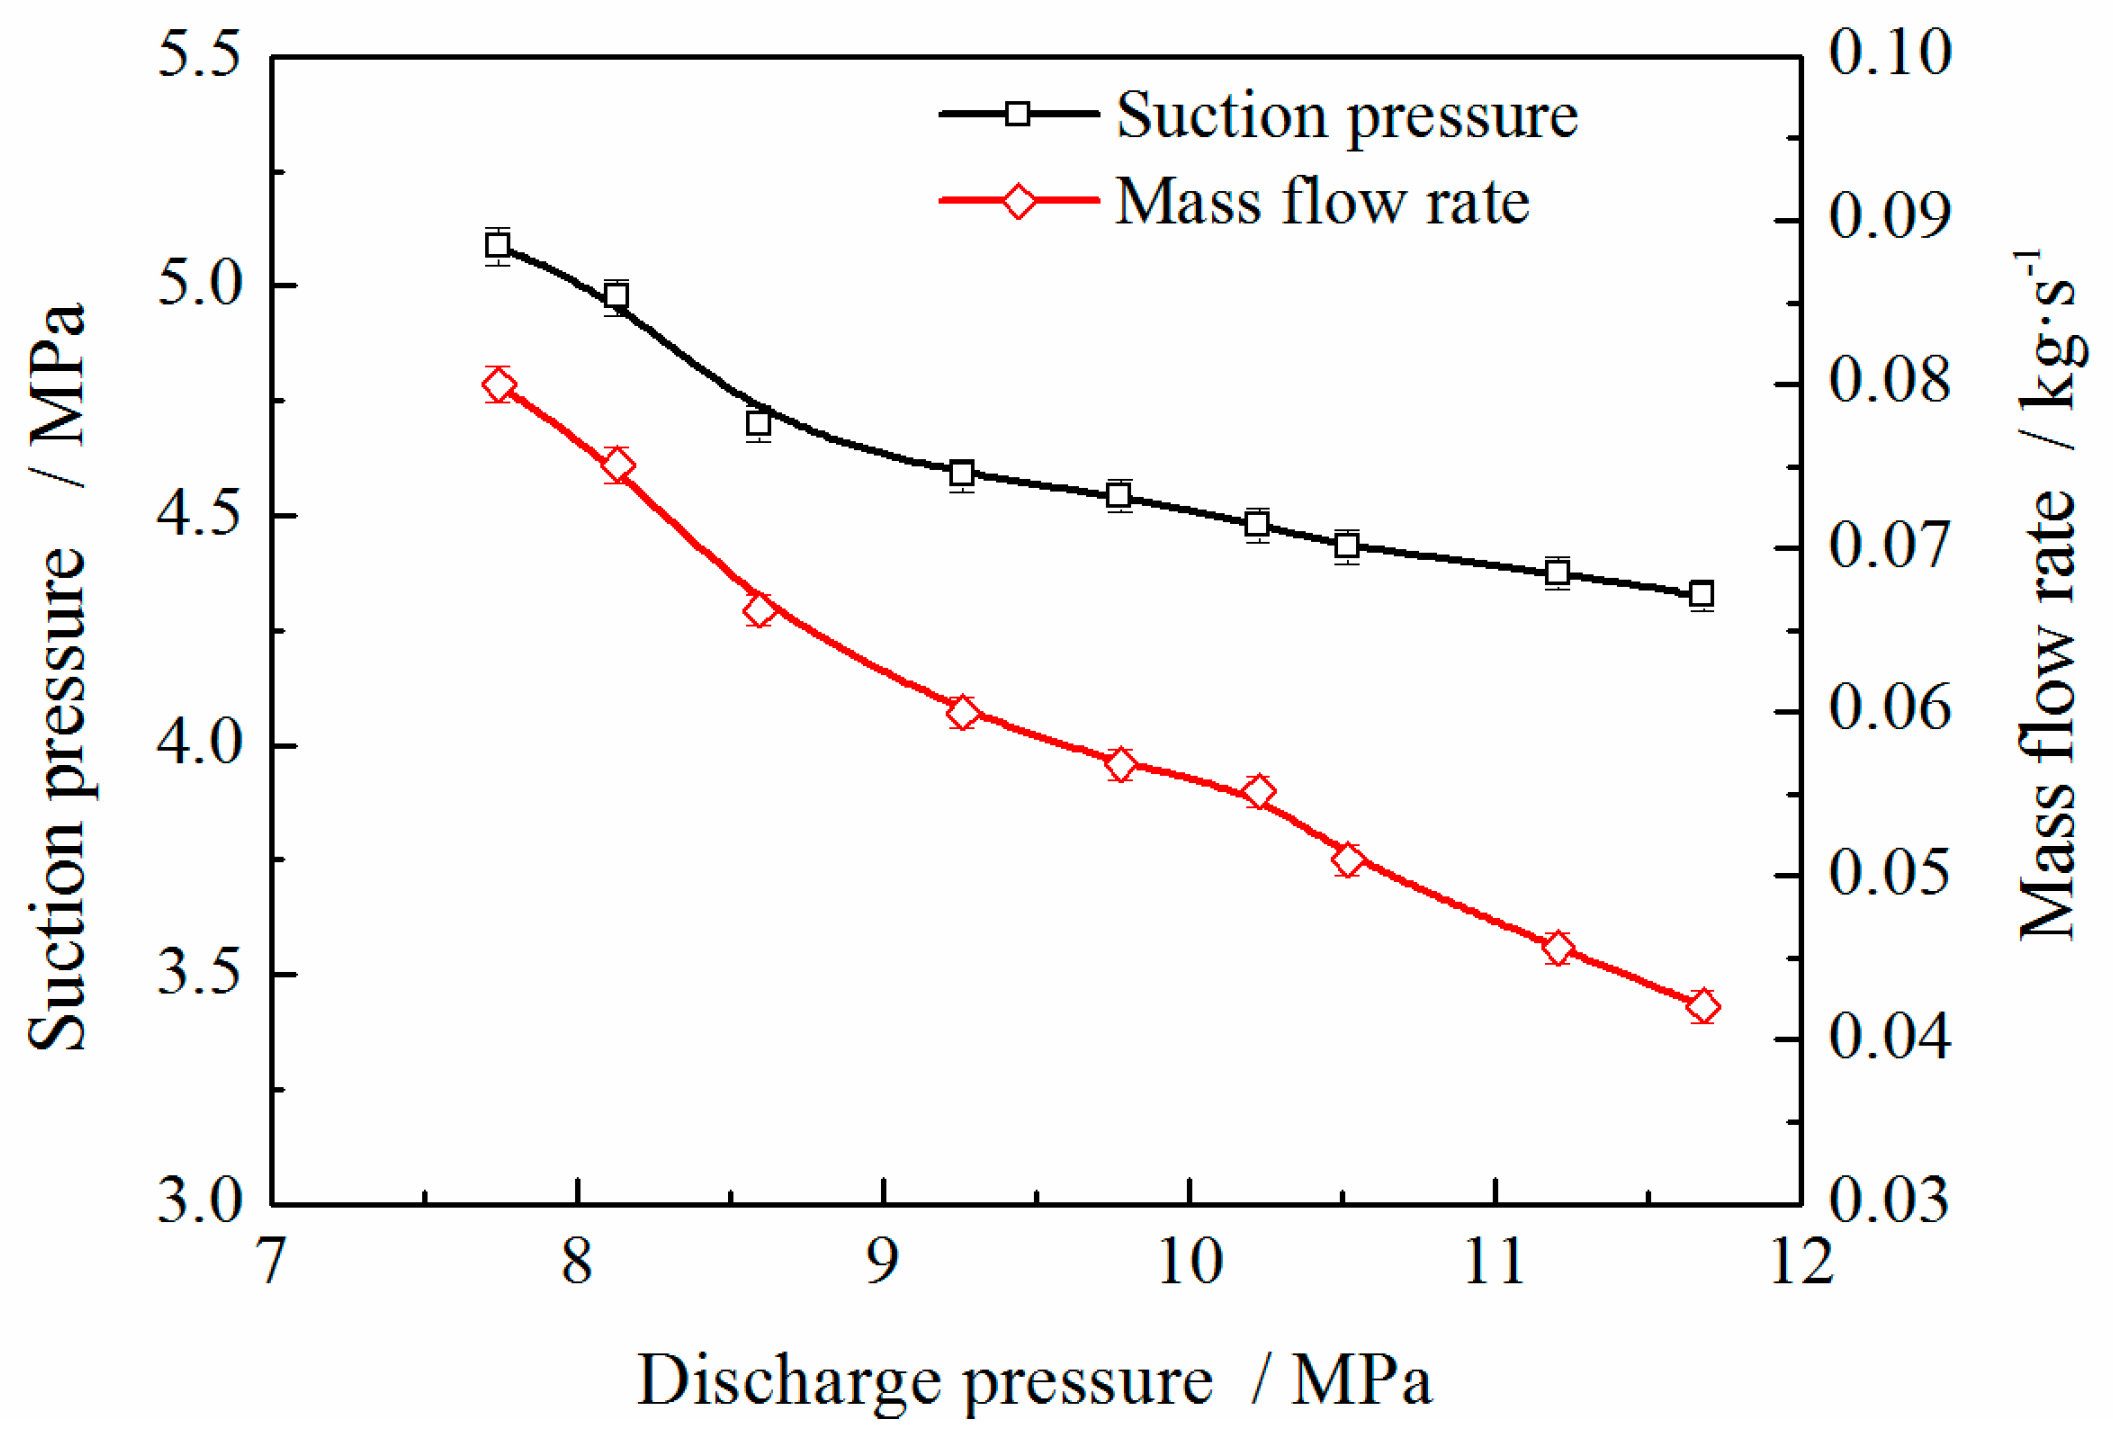
Figure 4.
Effects of discharge pressure on suction pressure and CO2 mass flowrate (tap-water temperature: 15 °C; tap-water flowrate: 0.25 m3·h−1; water-source temperature: 20 °C; water-source flowrate: 1.5 m3·h−1).
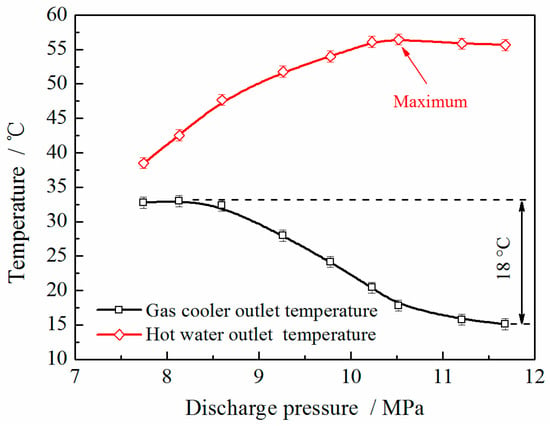
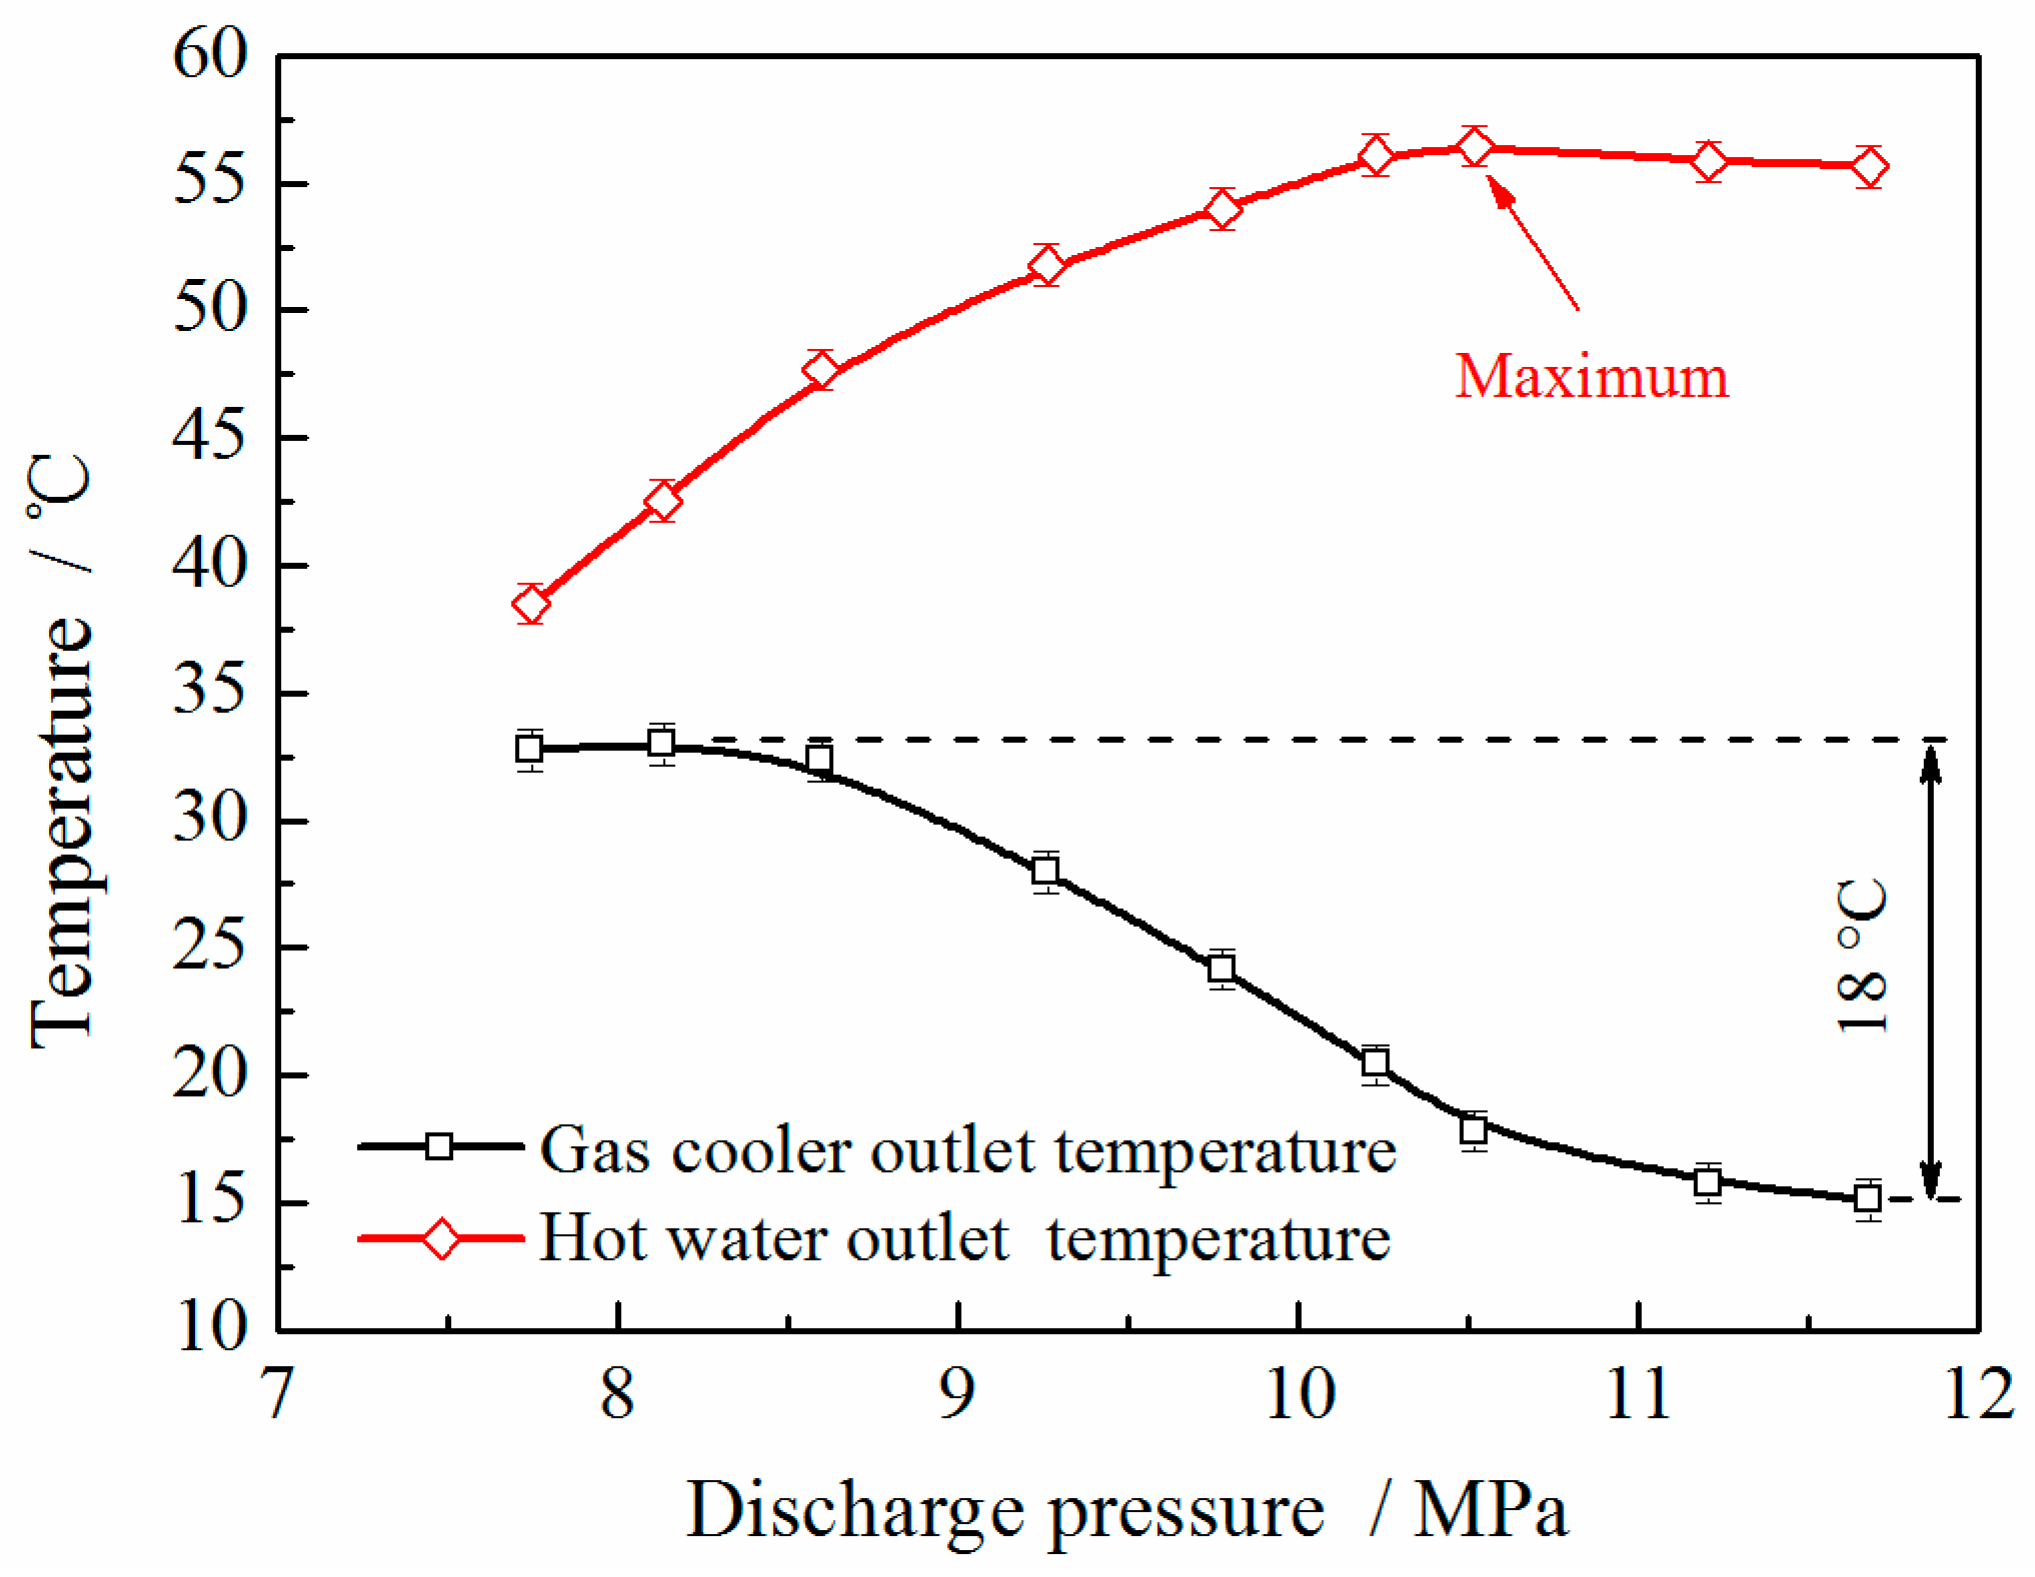
Figure 5.
Effects of discharge pressure on temperatures (tap-water temperature: 15 °C; tap-water flowrate: 0.25 m3·h−1; water-source temperature: 20 °C; water-source flowrate: 1.5 m3·h−1).
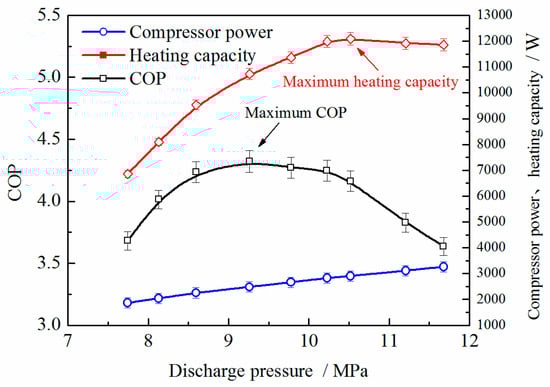
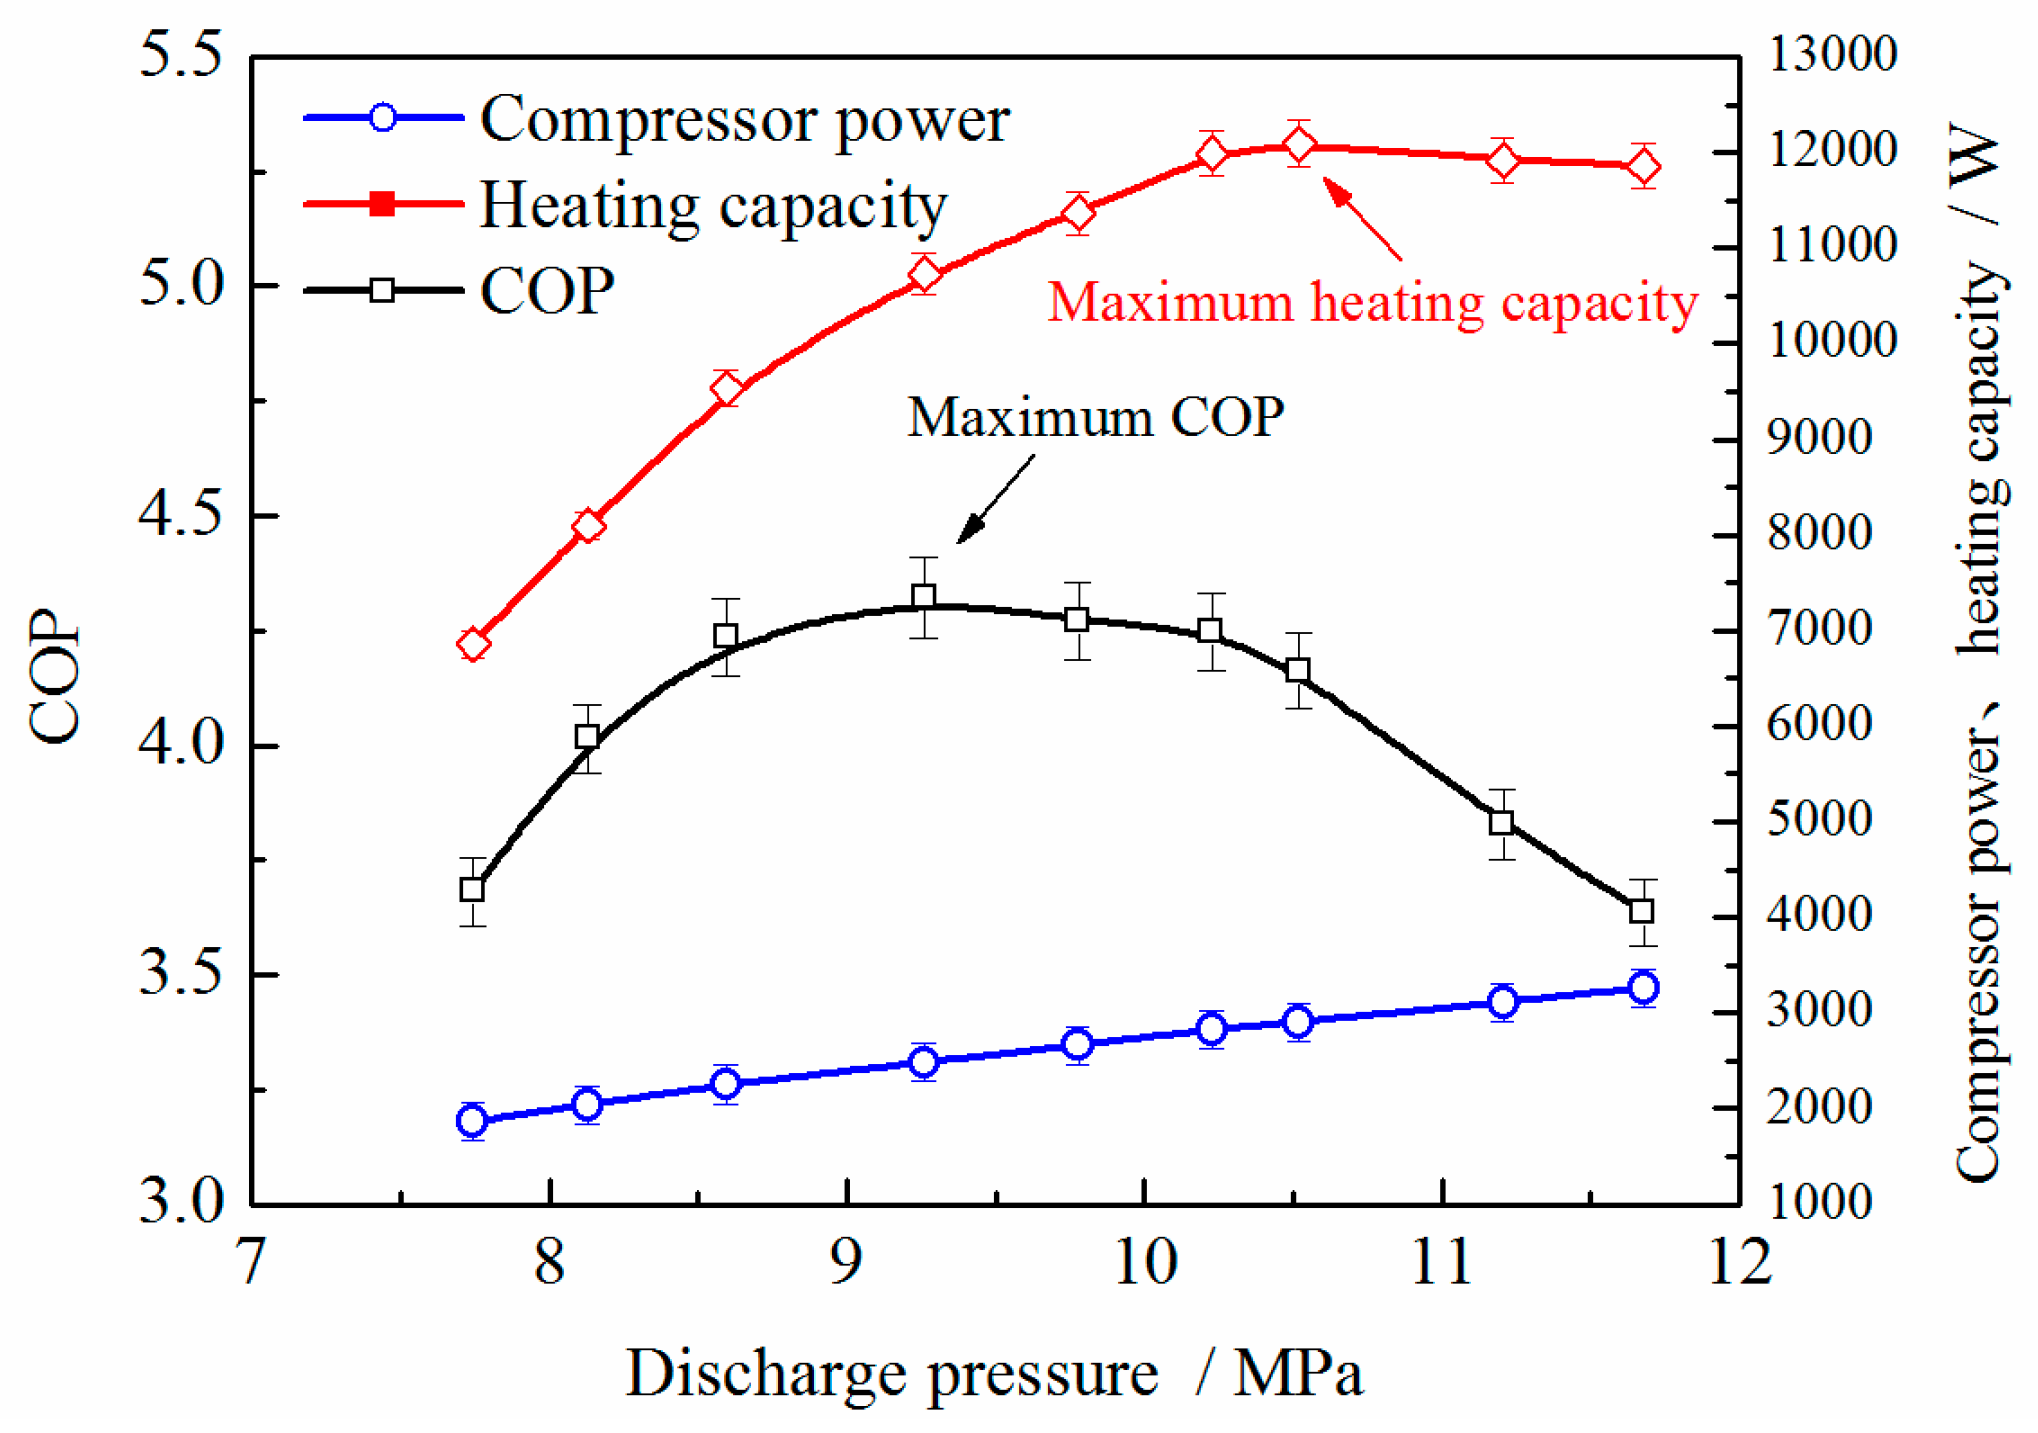
Figure 6.
Effects of discharge pressure on compressor power, heating capacity and COP (tap-water temperature: 15 °C; tap-water flowrate: 0.25 m3·h−1; water-source temperature: 20 °C; water-source flowrate: 1.5 m3·h−1).
As shown in Figure 4, upon increasing the discharge pressure, the suction pressure and the CO2 mass flowrate gradually decreases. This results from the regulation of the discharge pressure by adjusting the EEV opening. For the trans-critical CO2 heat-pump system with a compressor at a fixed frequency, provided that the other operating parameters are kept constant, the increasing of the discharge pressure is caused by the excessive CO2 gathering in the gas cooler. If the EEV opening is reduced, the mass flow of CO2 flowing through EEV decreases, leading to an excessive accumulation of CO2 in the gas cooler. As a result, the discharge pressure increases. As the total amount of CO2 is constant in the system, the accumulation of CO2 in the evaporator would decrease if much of CO2 is accumulated in the gas cooler. Therefore, the corresponding suction pressure decreases.
Figure 5 shows the influences of the discharge pressure upon the gas-cooler outlet temperature and the hot-water outlet temperature.
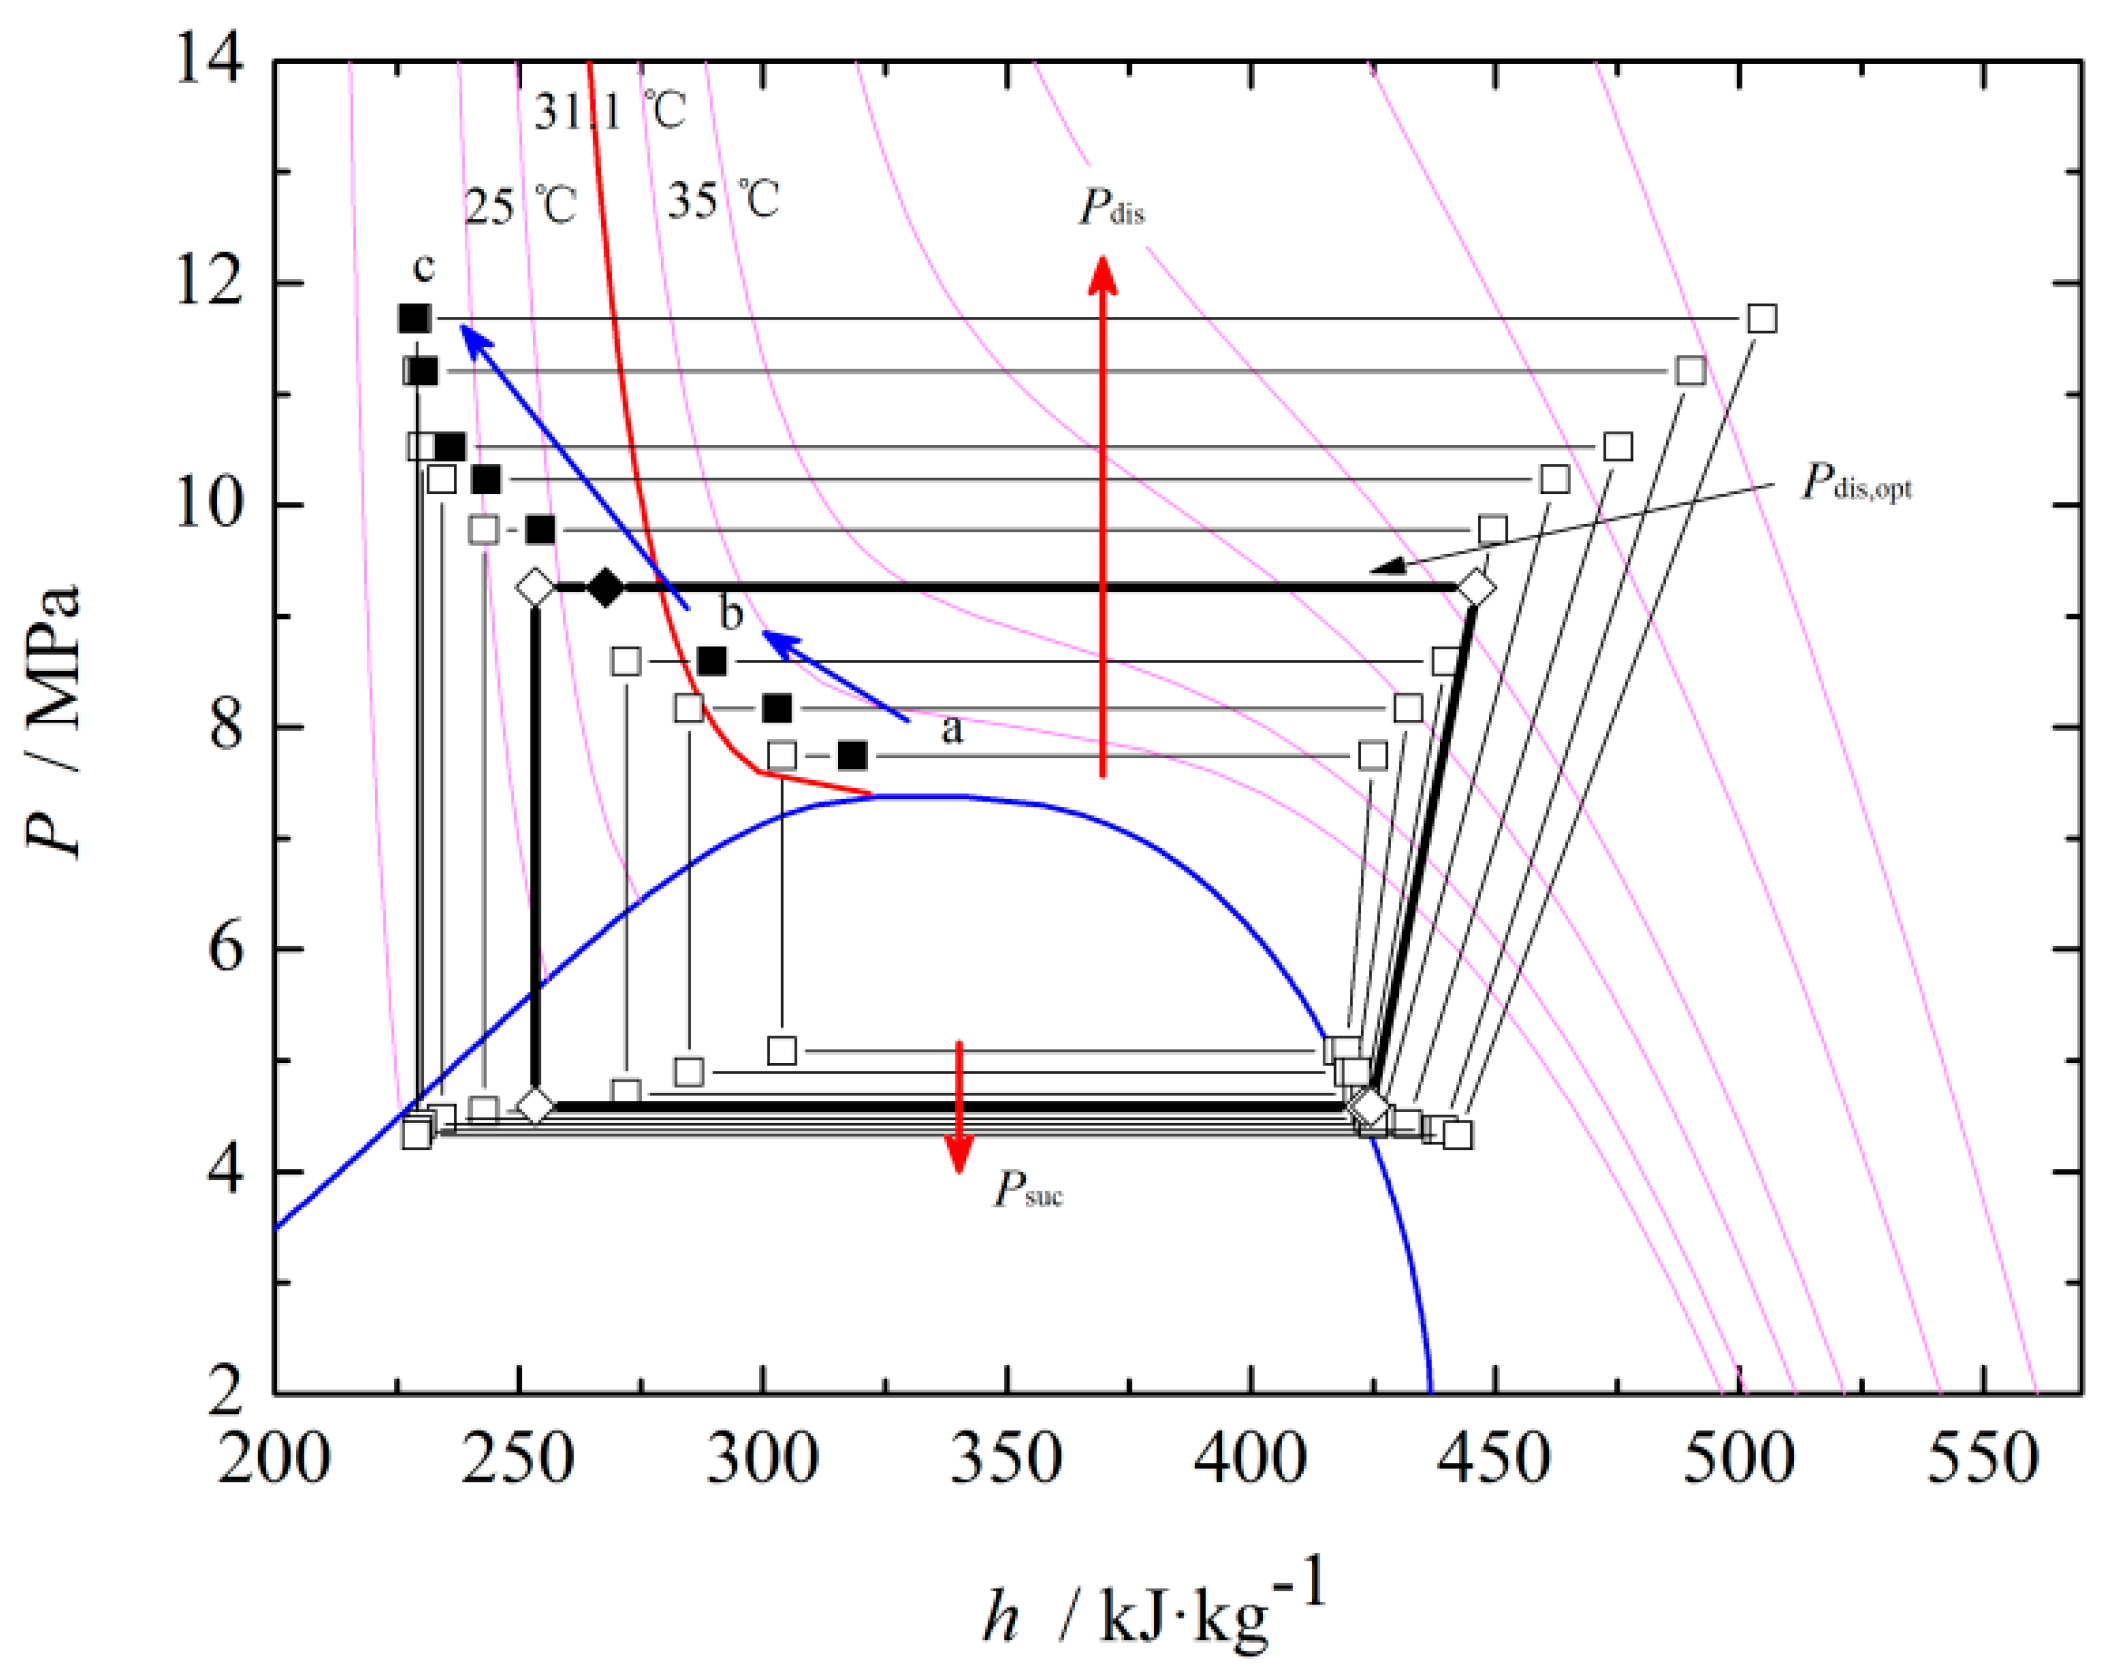
It can be found from Figure 5 that upon increasing the discharge pressure, the CO2 gas-cooler outlet temperature increases firstly and then decreases. This is attributed to the S-shape isotherm at the supercritical area (see the process a–b in Figure 7). The decreasing trend of the temperature is relatively steep at the beginning, then it becomes more flattened, and finally it remains almost unchanged (see the process b–c in Figure 7). The decrease of the CO2 gas-cooler outlet temperature is attributed to the reduction of the CO2 mass flowrate due to the increase of the compression ratio along with the increased discharge pressure. However, when the discharge pressure is too high, the decrease of the CO2 gas-cooler outlet temperature is restricted by the constant tap-water inlet temperature because the gas cooler is a counter-flow heat exchanger. Consequently, the decreasing trend of CO2 gas-cooler outlet temperature becomes flattened. The change of the gas-cooler outlet temperature with the discharge pressure is relatively evident, with the maximum variation being up to 18 °C, as shown in Figure 5. A similar trend has also been obtained by Wang et al. [26]. In their research, the maximum variation of the gas-cooler outlet temperature with the discharge pressure is about 22 °C.
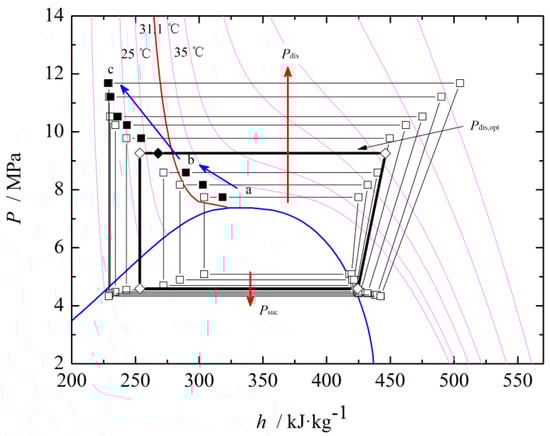
Figure 7.
Trans-critical CO2 heat-pump cycle in the pressure-enthalpy diagram.
From Figure 5, it can also be found with the increase of the discharge pressure, the hot water outlet temperature increases firstly and decreases afterwards, leaving an apex there. During the experiment, the tap-water flowrate and the tap-water temperature remains unchanged, therefore, the hot water outlet temperature directly depends on the heating capacity. The variation trend of the hot water outlet temperature with the discharge pressure is the same as that of the heating capacity, which will be detailed later.
Figure 6 shows the variation of the heating capacity and the COP versus the discharge pressure.
From Figure 6, it can be found that upon increasing the discharge pressure, the heating capacity gradually increases until reaching the apex, and then it declines slowly. The main reasons behind this trend are as follows: On one hand, as the discharge pressure increases, the enthalpy difference in the gas cooler increases correspondingly, which can be observed clearly in Figure 7. This is attributed to the combined action of the increased CO2 gas-cooler inlet enthalpy along with the increased compression ratio and the decreased CO2 gas-cooler outlet enthalpy. The variation trend of the CO2 gas-cooler outlet enthalpy depends not only on the CO2 gas-cooler outlet temperature but also on the slope of the isotherm. On the other hand, the CO2 mass flowrate decreases upon increasing the discharge pressure as shown in Figure 4. Both-side effects lead to the variation trend of the heating capacity with the discharge pressure.
Upon increasing the discharge pressure, the specific work of the compressor increases significantly due to the increase of the compression ratio. However, the CO2 mass flowrate decreases with the increase of the discharge pressure. It is worth noting that the variation of the specific work is much larger than that of the CO2 mass flowrate, therefore, the combined effects of these two factors lead to the increase of the power consumption of the compressor with the discharge pressure, as shown in Figure 6.
With the increase of the discharge pressure, the COP rises firstly and then drops, leaving the apex at approximately 4.3. It means that for the heat-pump system, there is an optimal discharge pressure, at which the COP reaches the maximum value. According to the definition of the COP, the influence of the discharge pressure on the COP depends on the variation trend of the heating capacity and the power consumption with the discharge pressure together, which in turn depends on the combined effects of the suction pressure, the CO2 mass flowrate, the CO2 gas-cooler outlet temperature, the slope of the isotherm and so on. Based on the previous analysis, the power consumption increases monotonously with the increase of the discharge pressure; however, the heating capacity increases firstly and then decreases upon increasing the discharge pressure. Both effects of these two factors lead to the emergence of an optimal discharge pressure.
It can be noted from Figure 7 that at the optimal exhaust pressure, the gas-cooler outlet temperature is about 25 °C. It is below the critical temperature of CO2 (31.1 °C). This is similar to the case in Reference [26], in which the gas-cooler outlet temperature corresponding to the optimal discharge pressure is about 19.8 °C. Under this condition, the isotherm near the optimal point does not exhibit the S type characteristics. It is different from the evident S type isotherm near the optimal point as in the trans-critical CO2 heat-pump cycle with a high gas-cooler outlet temperature (higher than the critical temperature of CO2). Therefore, the effect of the discharge pressure on the characteristic parameters in this case is different from that of the trans-critical CO2 heat pump cycle with a high gas-cooler outlet temperature.
In addition, it can be observed from Figure 6 that at the optimal discharge pressure, the COP reaches the maximum value while the heating capacity is still lower than the maximum value, which is later reached when the discharge pressure is slightly above the optimal discharge pressure. This is attributed to the different increasing tendencies of the compressor power and the heating capacity upon increasing the discharge pressure.
3.2. Tap-Water Flowrate
By keeping the water-source flowrate, the water-source temperature and the tap-water temperature unchanged, and simultaneously adjusting the tap-water flowrate and the EEV opening, the effects of the tap-water flowrate under different discharge pressures on the system performance were obtained.
Figure 8, Figure 9 and Figure 10 show the influences of the tap-water flowrate on the key parameters of the heat pump under different discharge pressures.
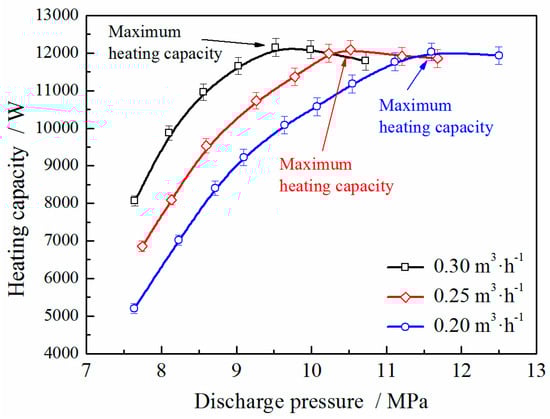
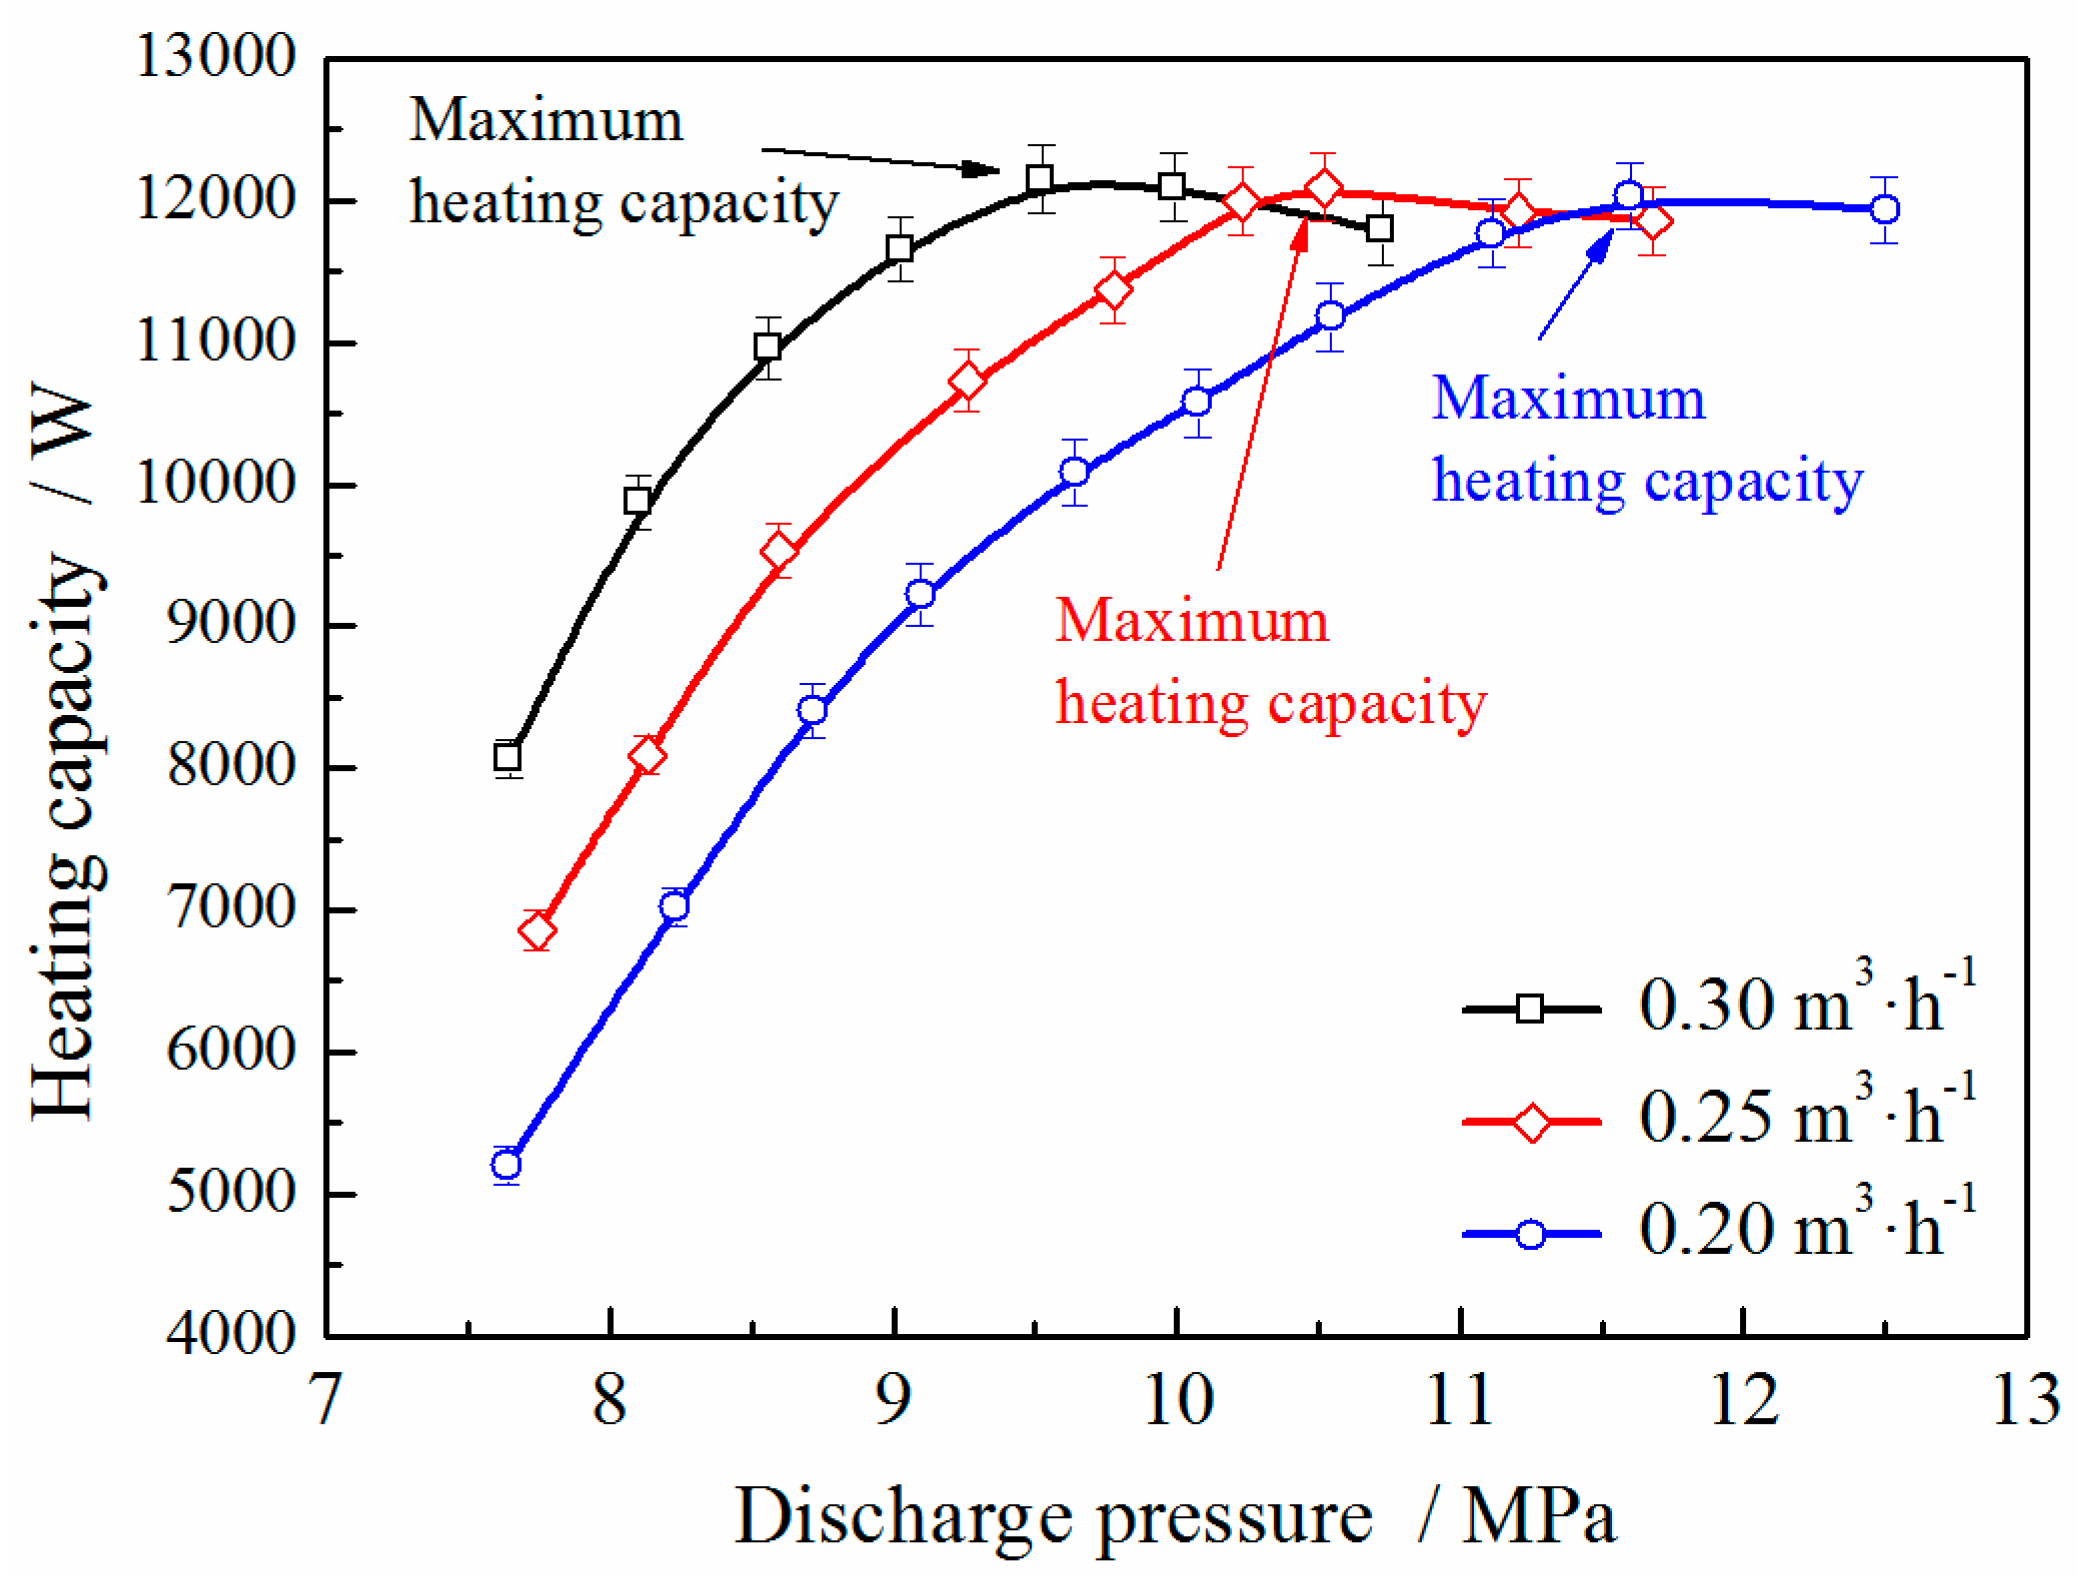
Figure 8.
Comparison of heating capacity under different tap-water flowrates.

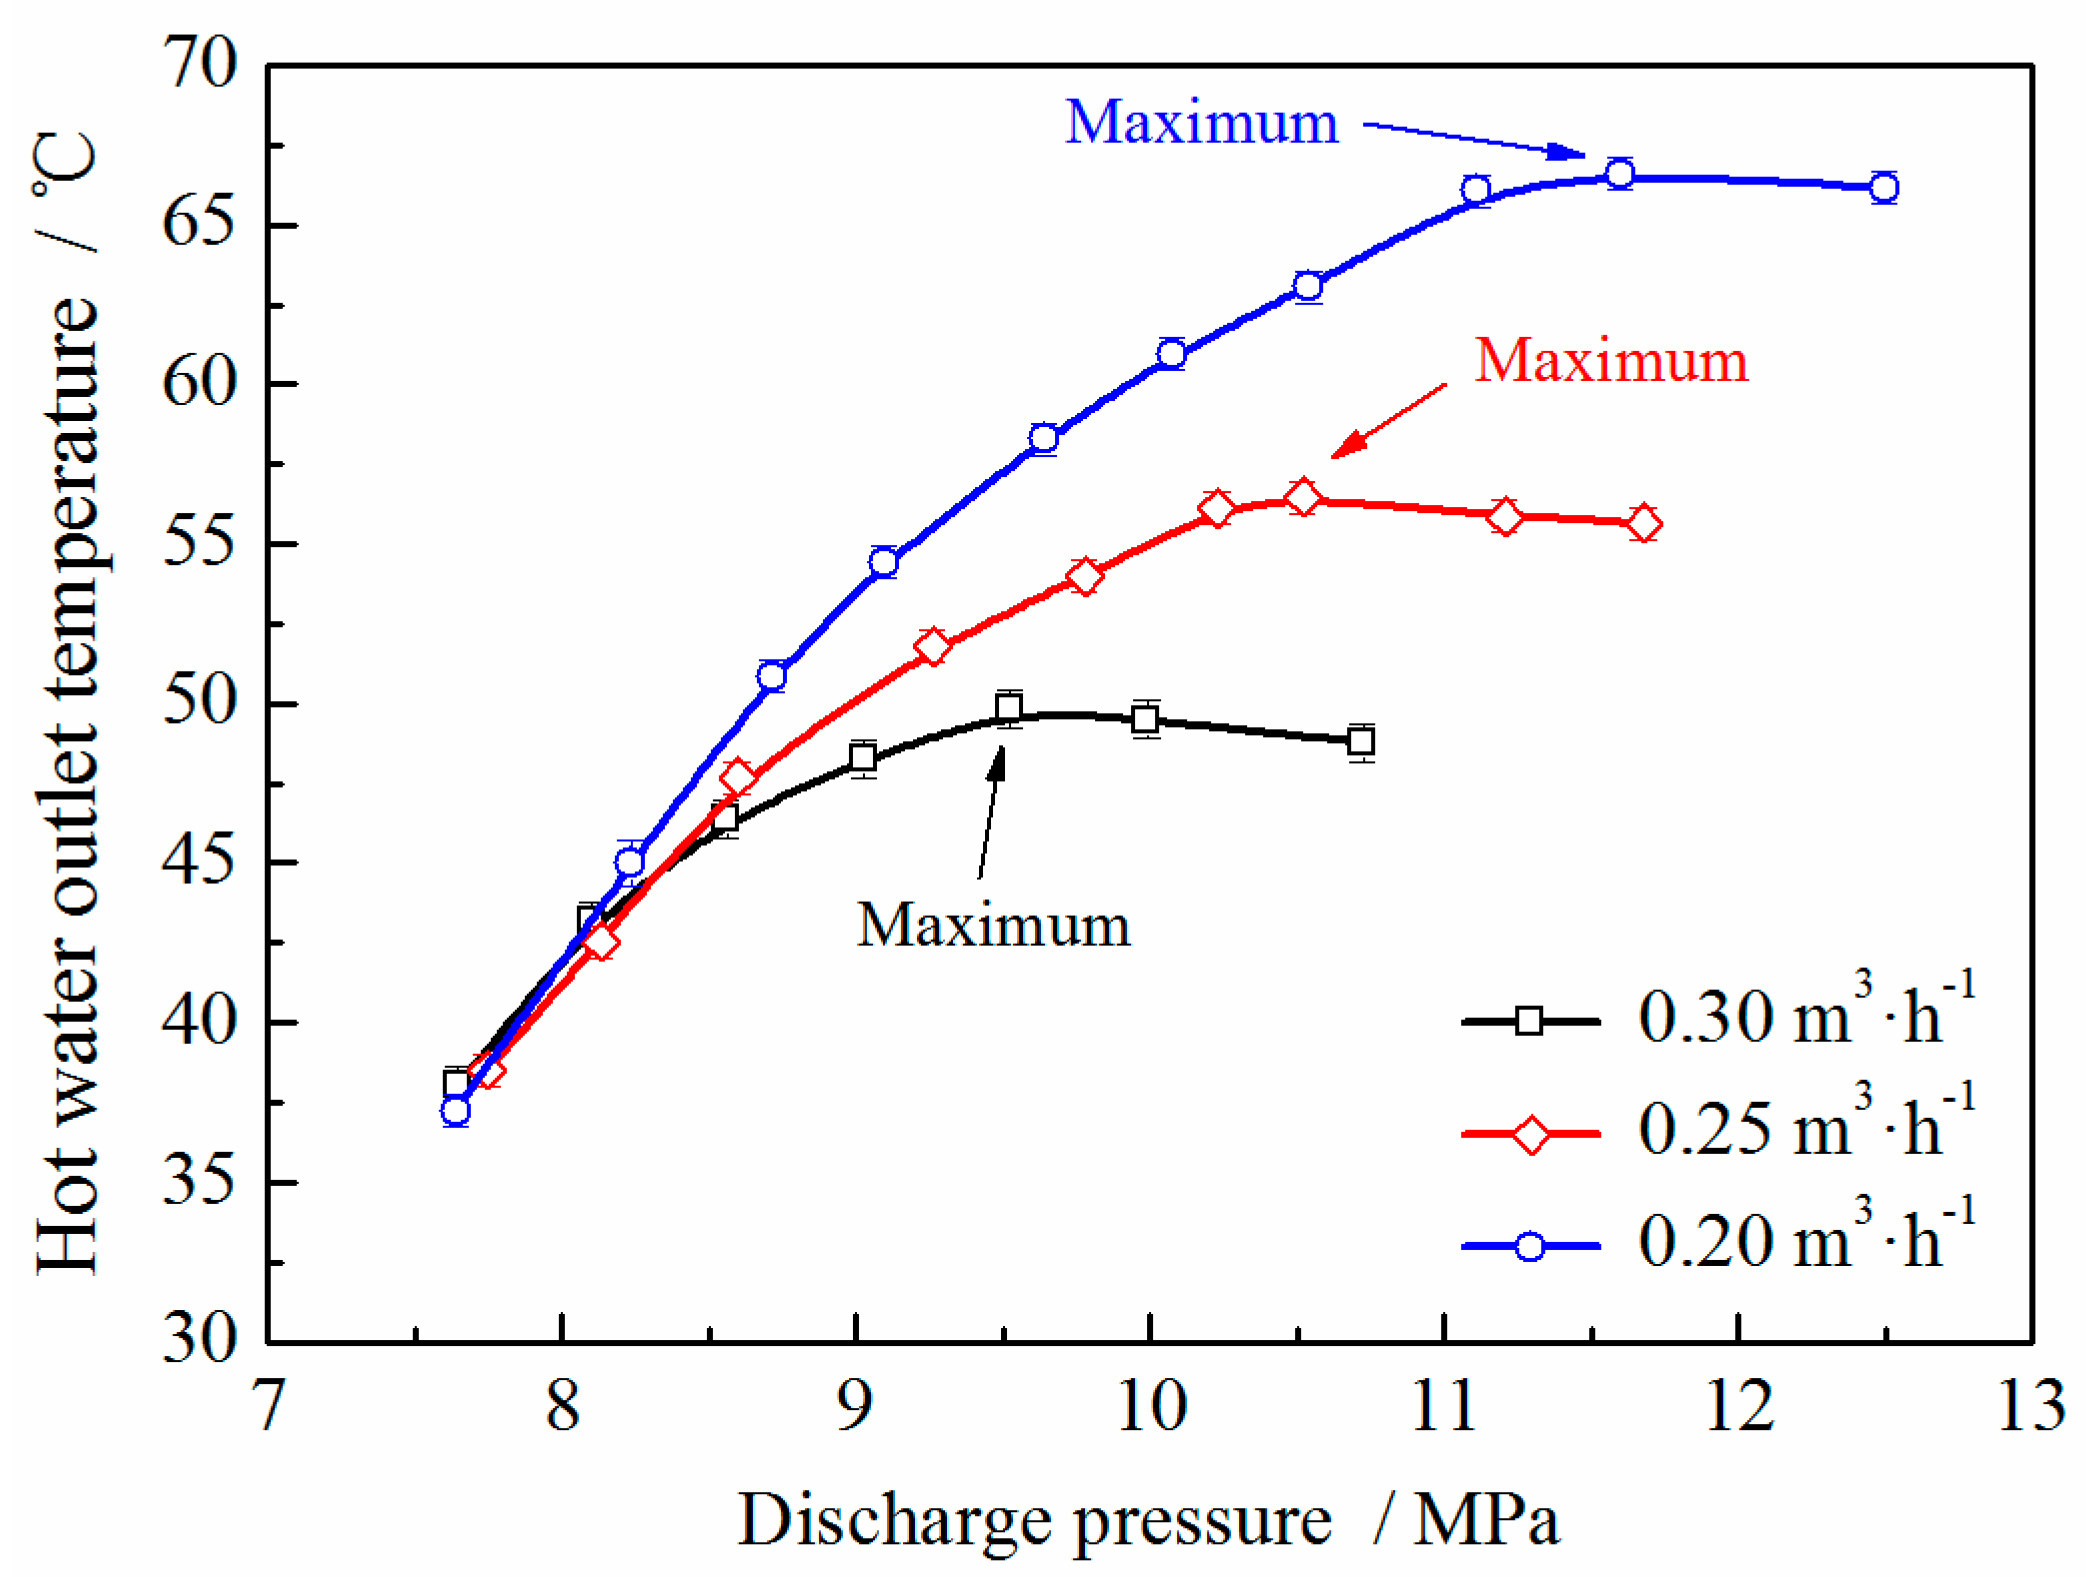
Figure 9.
Comparison of hot-water outlet temperature under different tap-water flowrates.
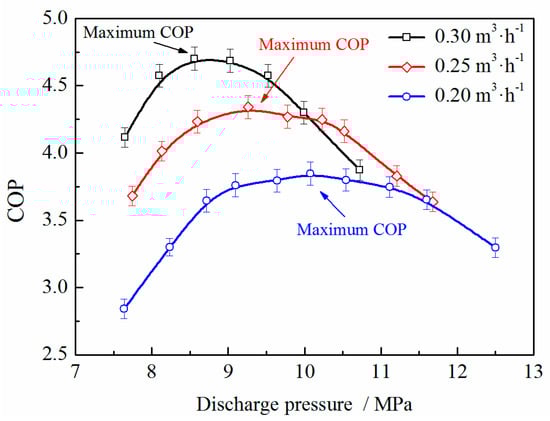
Figure 10.
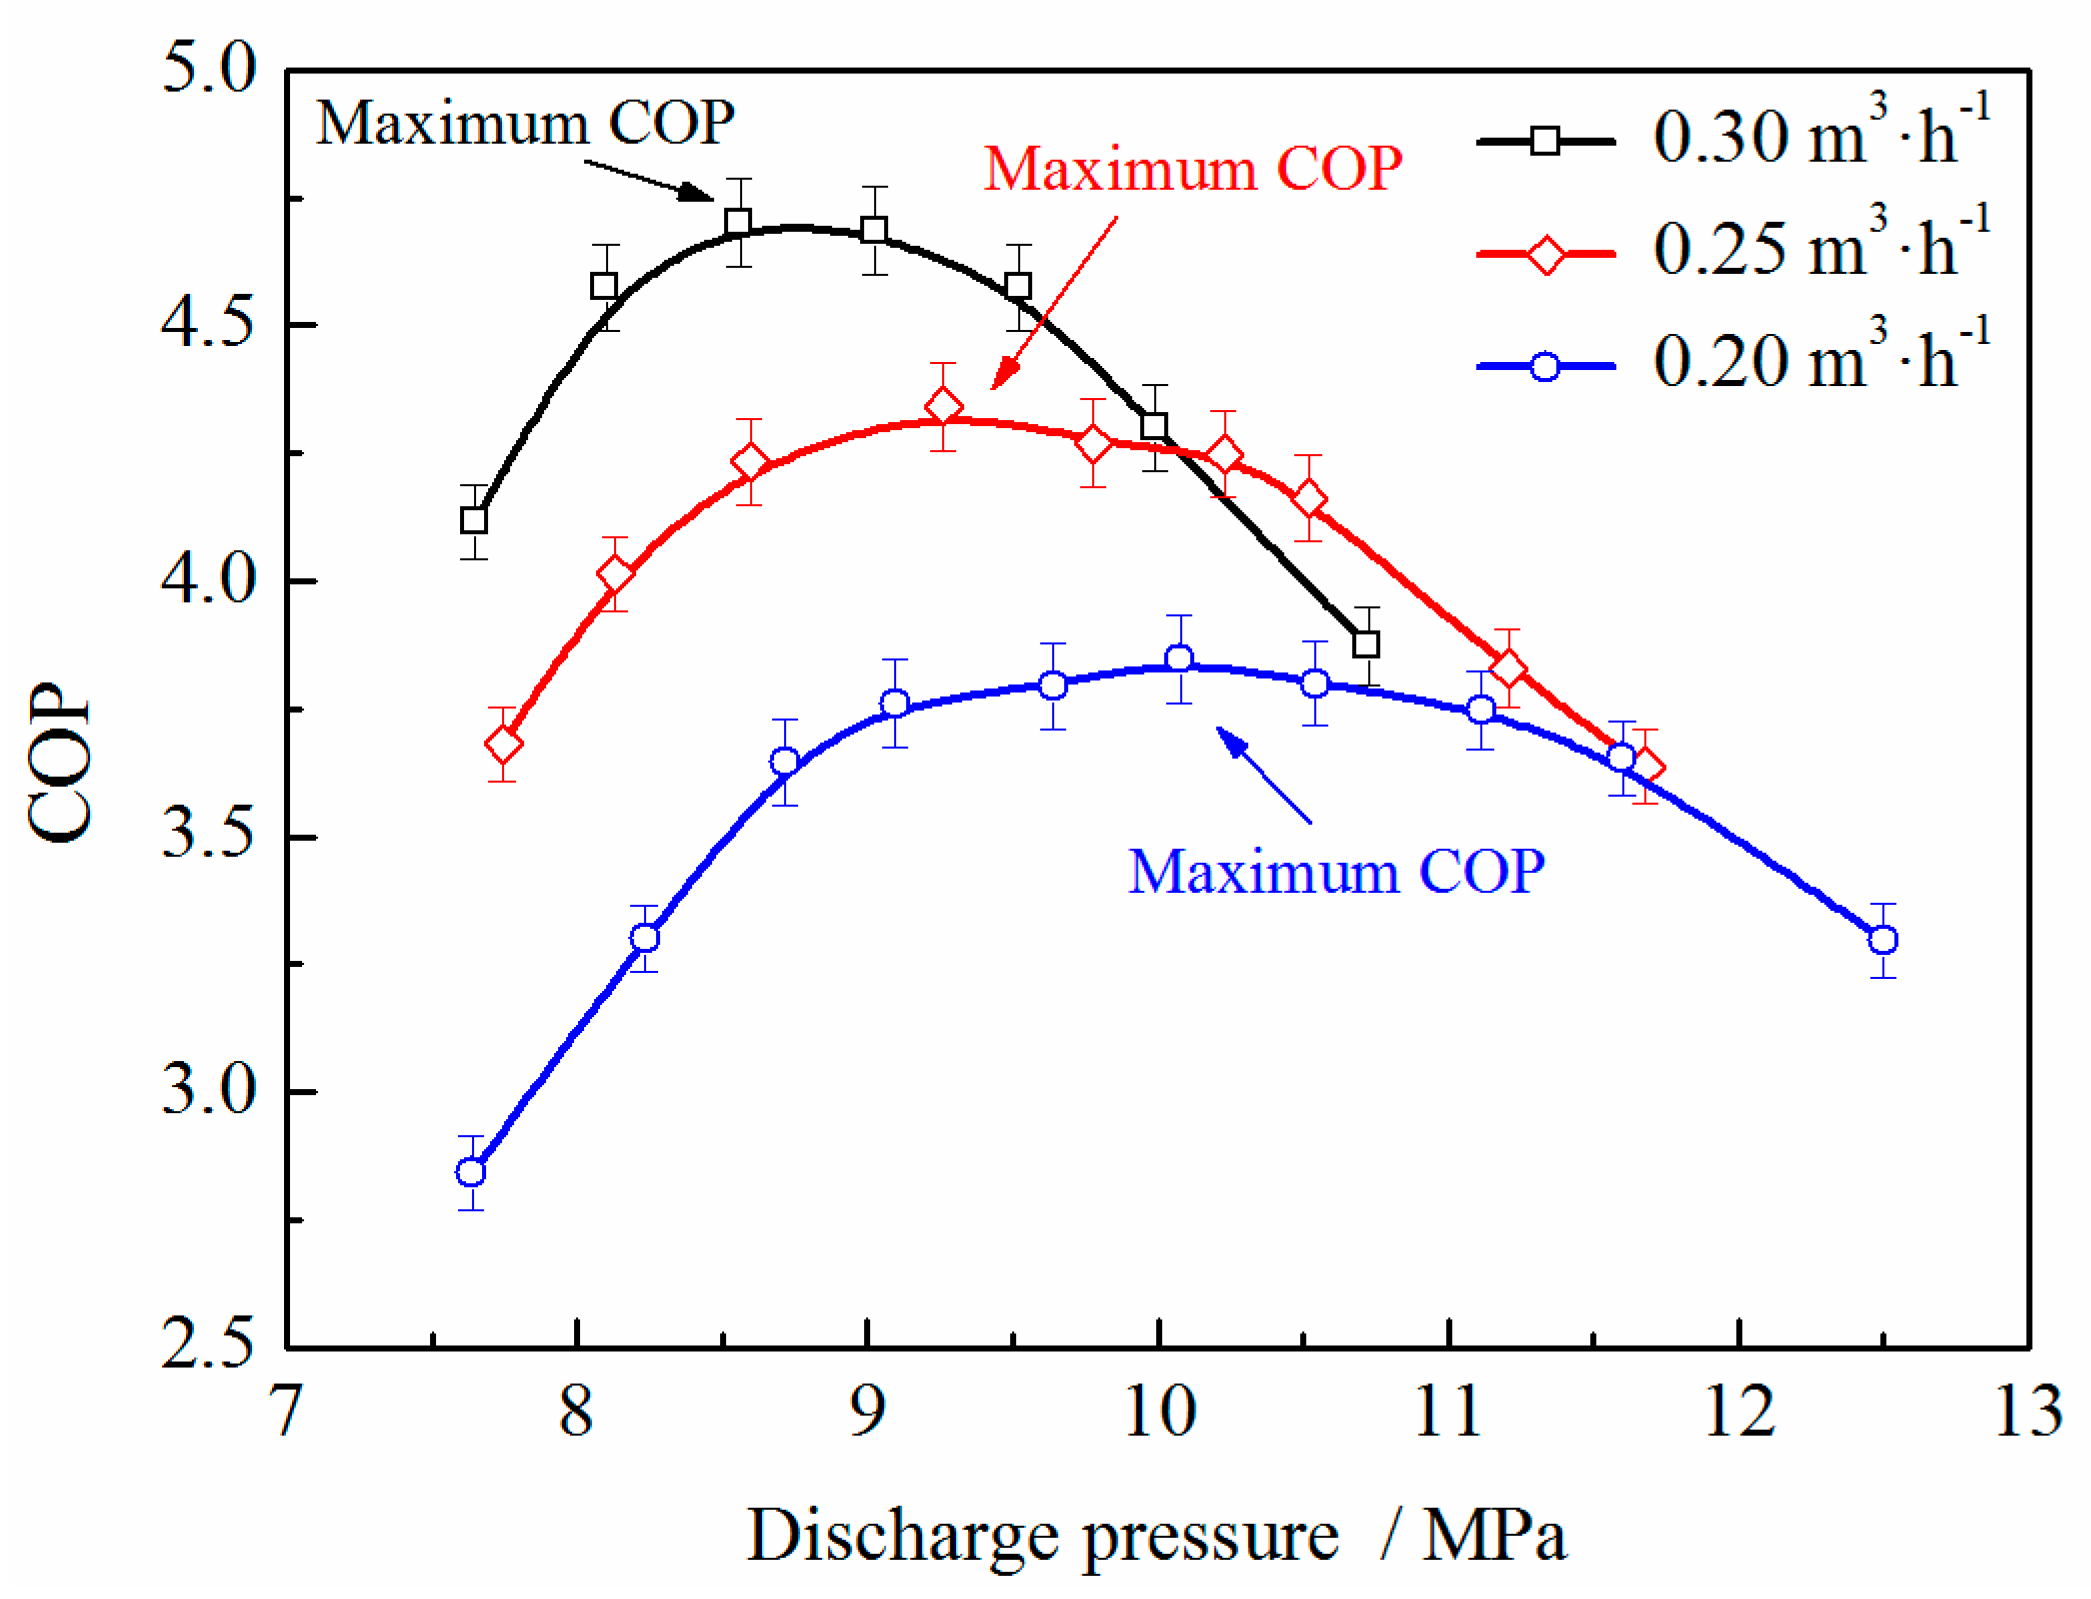
Comparison of COP under different tap-water flowrates.
It can be seen from Figure 8 that the heating capacity rises firstly and then drops upon increasing the discharge pressure regardless of the tap-water flowrate. The difference between them is that the discharge pressure corresponding to the maximal heating capacity decreases with an increase of the tap-water flowrate. The maximal heating capacity increases slightly upon increasing the tap-water flowrate.
When the discharge pressure is below the peak, at a given discharge pressure, increasing the tap-water flowrate leads to an increase in the heating capacity. This is because as the tap-water flowrate increases, the water-side heat transfer in the gas cooler is enhanced, therefore, the corresponding heating capacity increases.
Besides, at a given heating capacity, the discharge pressure increases with the decrease of the tap-water flowrate. It is because upon decreasing the tap-water flowrate, the water-side heat transfer coefficient decreases due to the smaller water velocity. In order to achieve the same heating capacity, a larger heat transfer temperature difference is required, which is corresponding to a large discharge pressure.
As shown in Figure 9, with an increase of the discharge pressure, the hot-water outlet temperature increases firstly and then decreases independent of the tap water flowrate. The difference is that an increase in tap water flowrate leads to a reduction in the discharge pressure corresponding to the maximum hot-water outlet temperature.
At a given discharge pressure, increasing the tap-water flowrate leads to a decrease in the hot-water outlet temperature. This is because the gas-cooler is a counter-flow heat exchanger, the hot-water outlet temperature is directly affected by the compressor discharge temperature. Therefore, when keeping the discharge pressure unchanged, an increase of the tap-water flowrate would induce a decrease in the hot-water outlet temperature.
Hence, to achieve a high hot-water outlet temperature, a smaller tap-water flowrate and a higher discharge pressure are required. It is worth noticing that when the discharge pressure increases to a certain value, the hot-water outlet temperature would decline after reaching the maximum value. It is owing to the reduction of the CO2 mass flowrate which has a great influence on the heat capacity.
The maximum hot-water outlet temperature decreases upon increasing the tap-water flowrate. This is because the maximum heating capacity has a small variation with the increasing tap-water flowrate, as shown in Figure 8.
As shown in Figure 10, with the increase of the discharge pressure, the COP increases firstly and then decreases under the three flowrate conditions, leaving an optimal COP there. The optimal COP increases conspicuously and the optimal discharge pressure decreases upon increasing the tap-water flowrate. As an example, when the tap-water flowrate increases from 0.20 m3·h−1 to 0.3 m3·h−1, the optimal COP increases by about 19.4% and the optimal discharge pressure decreases by about 1.5 MPa. It is attributed to the enhanced water-side heat transfer in the gas cooler resulting from the increased tap-water flowrate.
3.3. Water-Source Temperature
Keeping the water-source flowrate, the tap-water temperature and the tap-water flowrate unvaried, and simultaneously adjusting the water-source temperature and the EEV opening, the effects of the water-source temperature under different discharge pressures upon the system performance were investigated.
Figure 11, Figure 12 and Figure 13 show the effects of water-source temperature on the key parameters of the heat pump under different discharge pressures.
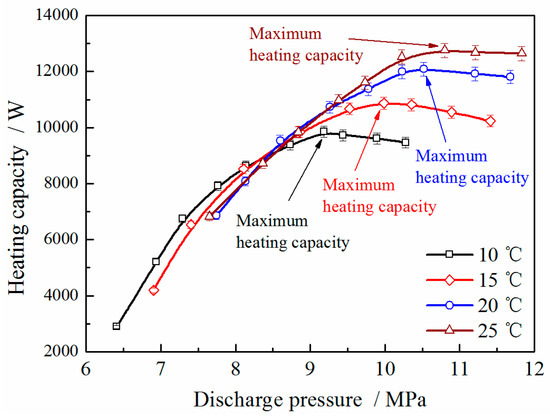
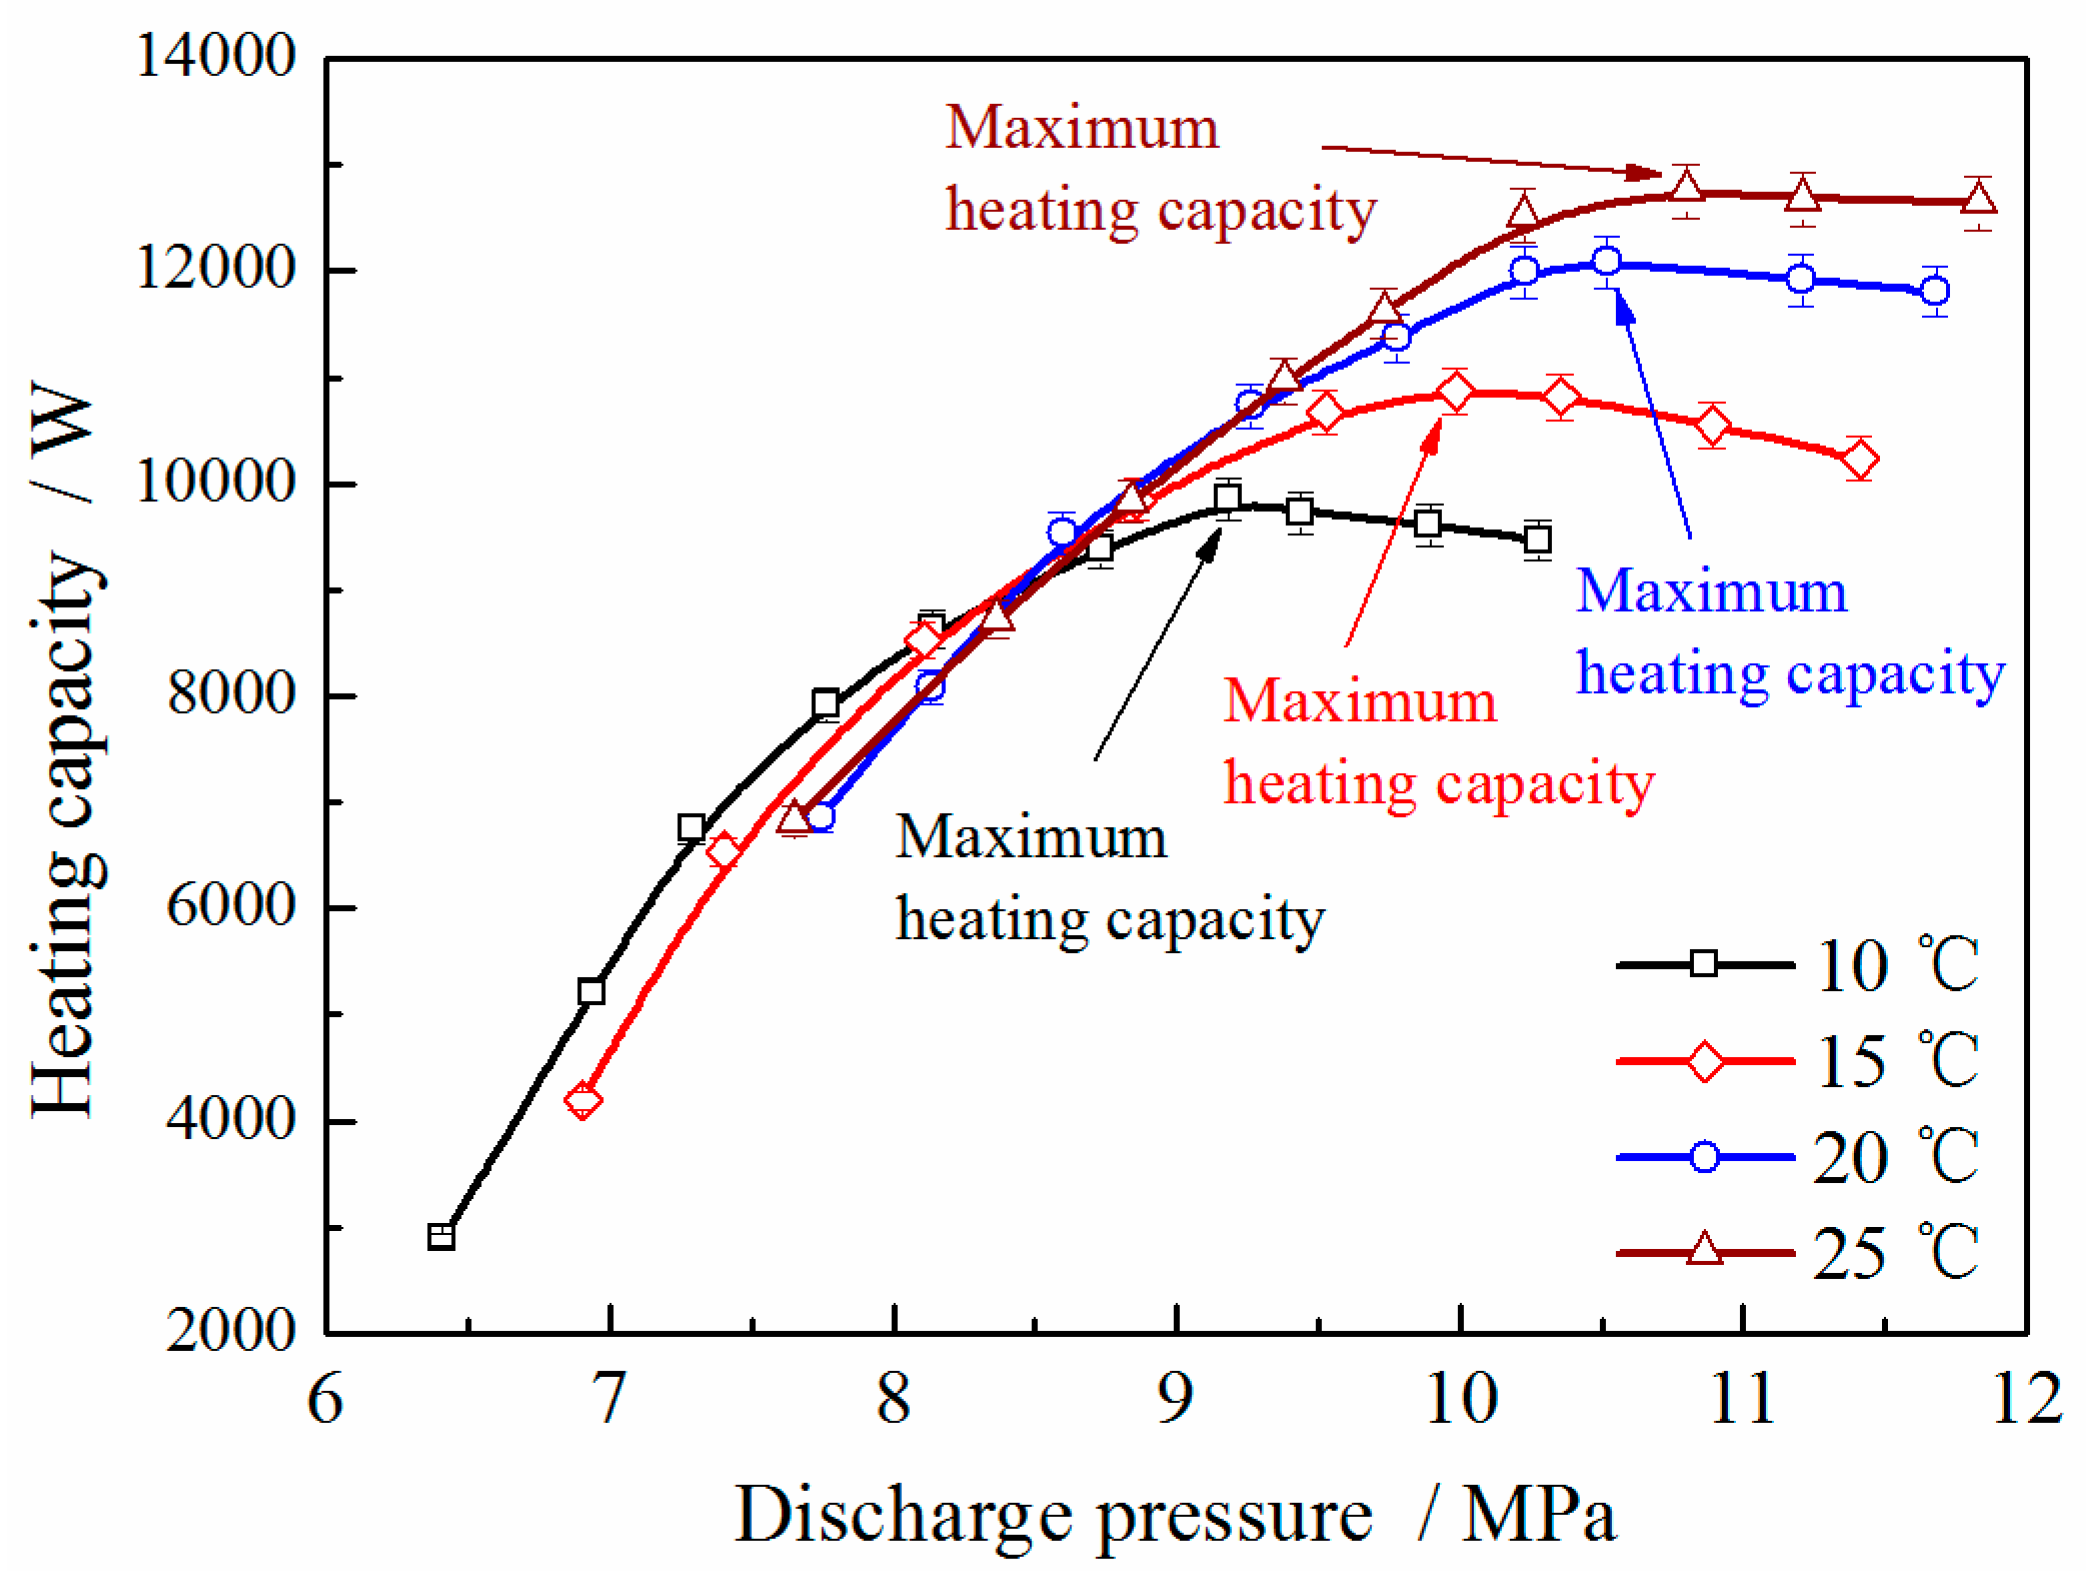
Figure 11.
Heating capacity versus discharge pressure for different water-source temperatures.
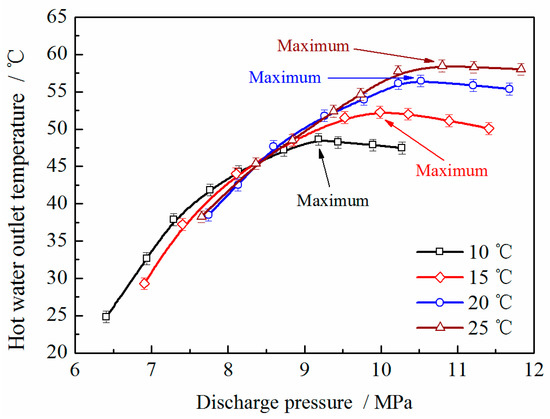
Figure 12.
Comparison of hot-water outlet temperature under different water-source temperatures.
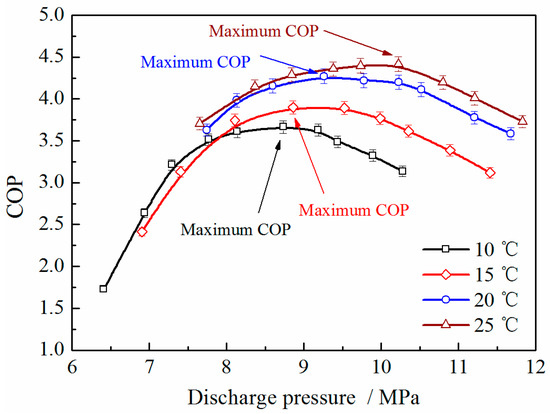
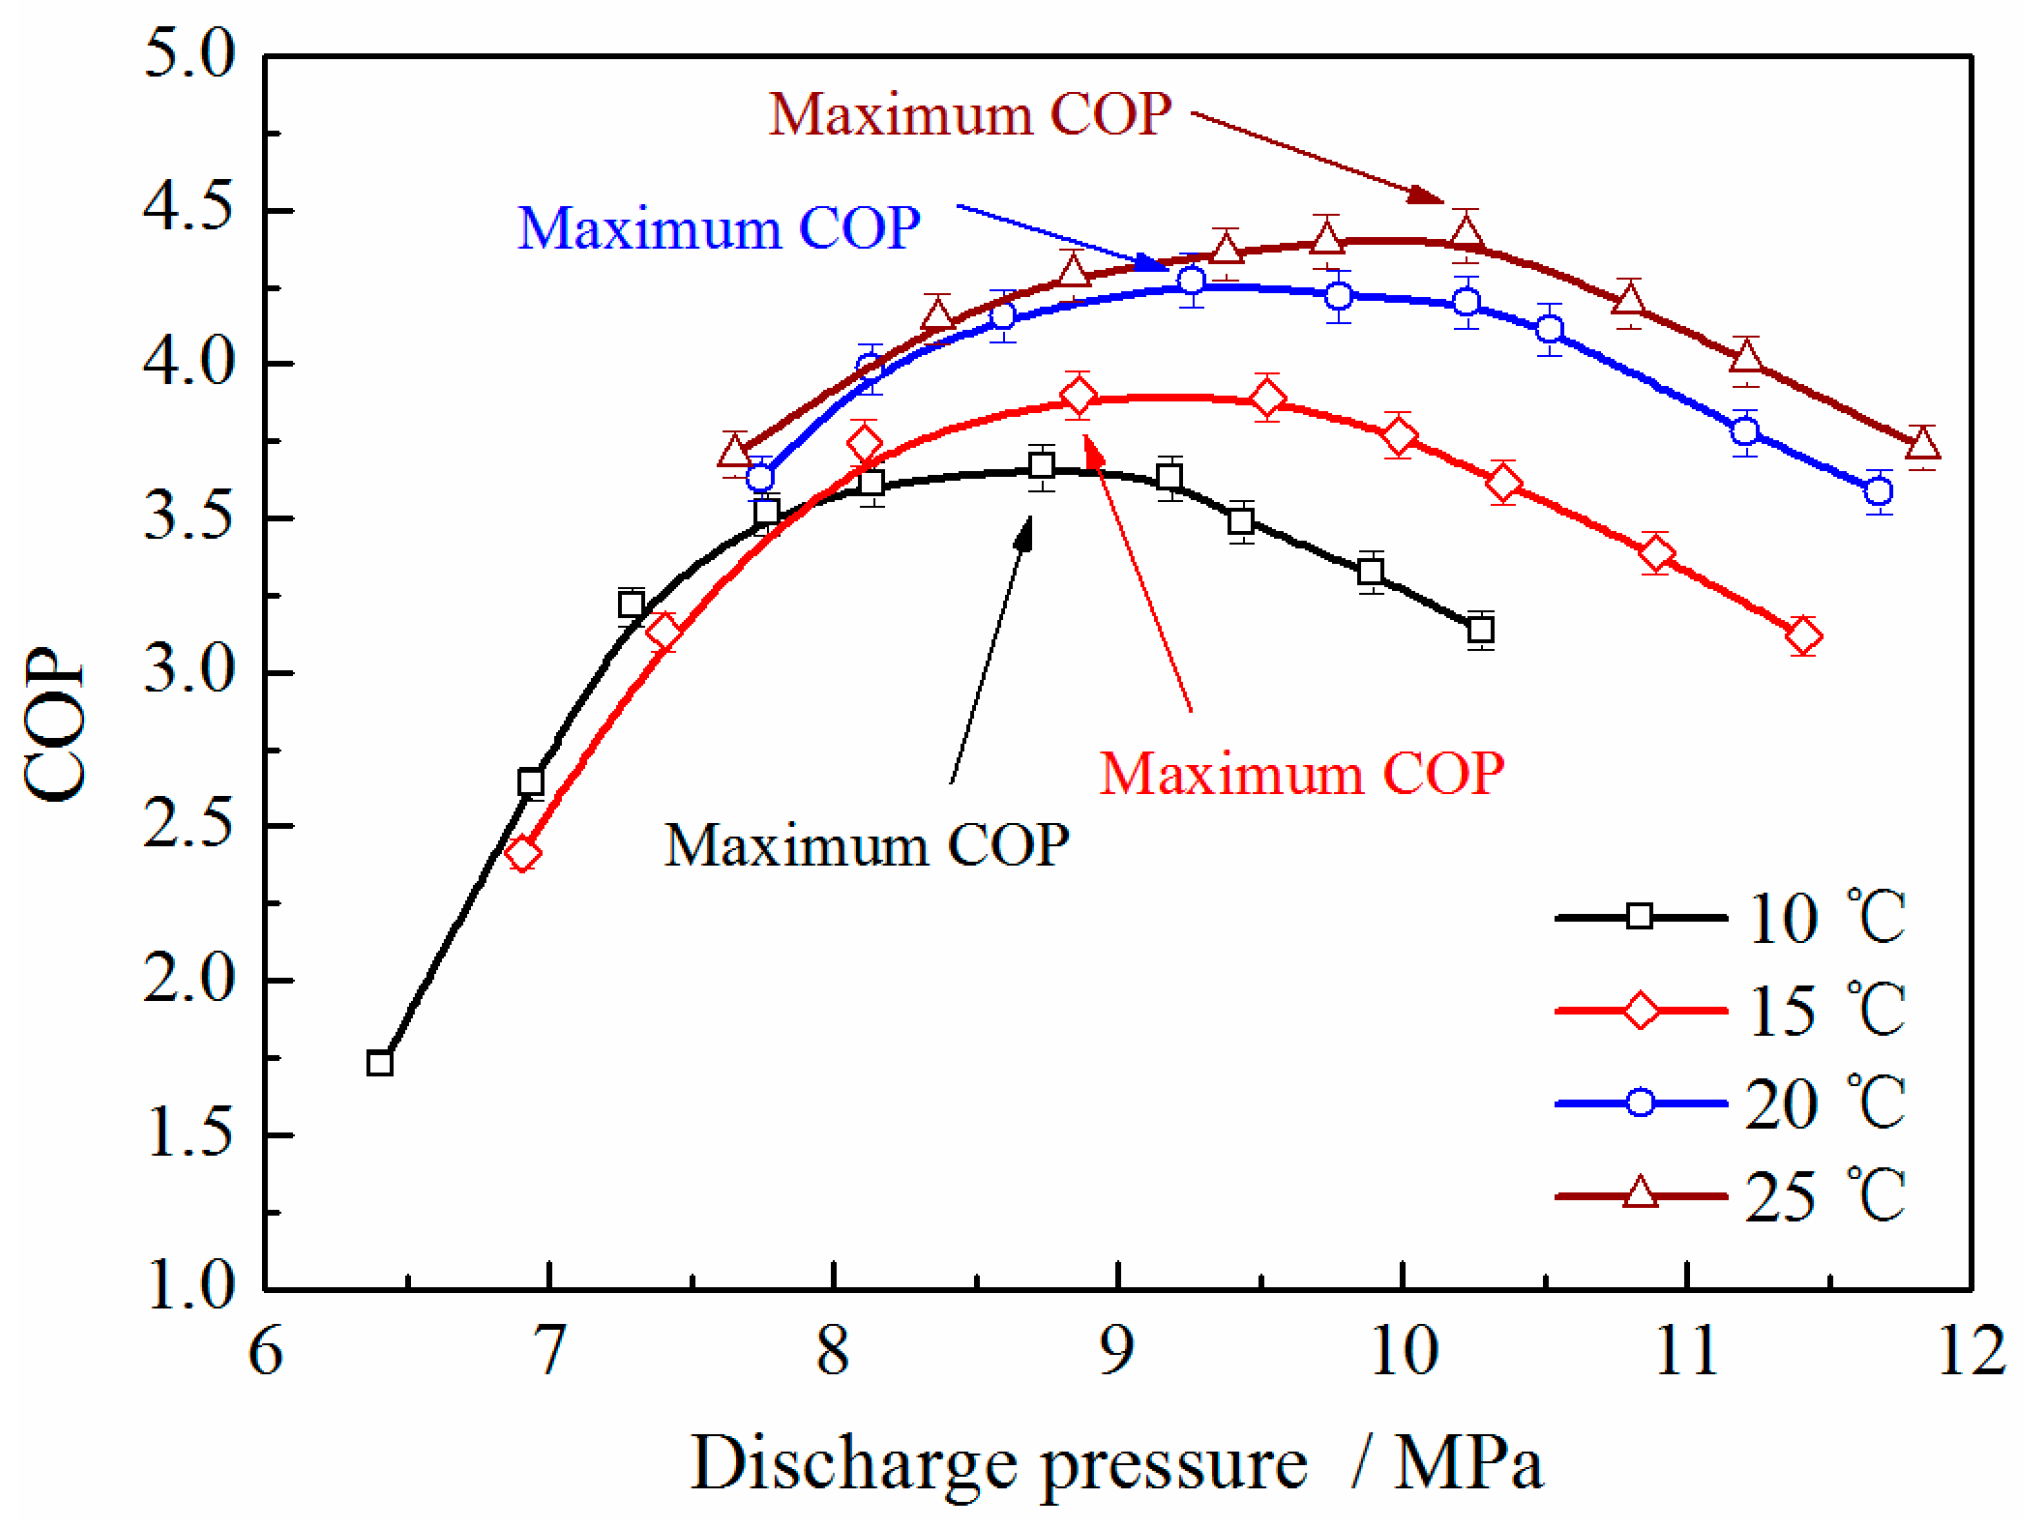
Figure 13.
Comparison of COP under different water-source temperatures.
As shown in Figure 11, with an increase of the discharge pressure, the heating capacity increases firstly and then decreases regardless of the water-source temperature. The difference is that the maximal heating capacity increases along with the increase of the water-source temperature. When the water-source temperature increases from 10 °C to 25 °C, the maximum heating capacity increases by roughly 28.9%. In addition, increasing the water-source temperature also leads to an increase in the discharge pressure corresponding to the maximum heating capacity. The main reason is that upon increasing the water-source temperature, the evaporation temperature increases correspondingly because of the enhanced heat transfer in the evaporator, which leads to an increase in the suction pressure. For an invariable frequency compressor, the corresponding discharge pressure also increases.
Figure 12 shows the variation of the hot-water outlet temperature versus the water-source temperature. As the water-source temperature increases from 10 °C to 25 °C, the maximum hot-water outlet temperature increases by about 9.8 °C. Because the tap-water flowrate and the tap-water inlet temperature are kept unchanged, the varying trend of the hot-water outlet temperature resembles that of the heating capacity as shown in Figure 11. For simplicity, the underlying reasons will not be repeated here.
As shown in Figure 13, with an increase of the discharge pressure, the COP increases firstly and then decreases independent of the water-source temperature, leaving an apex there. Upon increasing the water-source temperature, both the optimal COP and the optimal discharge pressure increase correspondingly. As the water-source temperature varies from 10 °C to 25 °C, the optimal discharge pressure increases by about 1.5 MPa and the optimal COP increases by about 20.5%. This is because as the water-source temperature rises, the water-side heat transfer in the evaporator is enhanced, and then the evaporation temperature and the corresponding evaporation pressure increase as well, resulting in an increased COP.
4. Conclusions
In summary, we experimentally studied the system performance under different operating conditions on a test rig of water source trans-critical CO2 heat-pump water heater. The main conclusions are shown as follows:
- (1)
- When the tap-water temperature was low (~15 °C), there had an optimal discharge pressure for the trans-critical CO2 heat-pump water heater. Under this operating condition, the influence of the discharge pressure on the COP depends on the combined effects of the suction pressure, the CO2 mass flowrate, the CO2 gas-cooler outlet temperature and the slope of the isotherm. This is different from the trans-critical CO2 heat-pump cycle with a higher gas-cooler outlet temperature, in which the optimal discharge pressure depends on the characteristic of the S-shape isotherm at the supercritical region.
- (2)
- At the optimal discharge pressure, the COP reached the maximum value while the heating capacity was still lower than its maximum value, which was reached when the discharge pressure was slightly above the optimal discharge pressure.
- (3)
- Decreasing the tap-water flowrate and increasing the water-source temperature resulted in an increase of the optimal discharge pressure. Decreasing the tap-water flowrate led to a significant decrease of the COP while increasing the water-source temperature enhanced the COP greatly. In addition, decreasing the tap-water flowrate had little influence on the maximum heating capacity. However, increasing the water-source temperature could significantly enhance the maximum heating capacity.
- (4)
- For the trans-critical CO2 heat-pump system with an invariable frequency compressor, to achieve a high hot-water outlet temperature, a smaller tap-water flowrate, a higher water-source temperature and a relatively higher discharge pressure are required. From the perspective of the COP, a larger tap-water flowrate, a higher water-source temperature and an optimal discharge pressure are required.
Acknowledgments
This project was supported by the National Nature Science Foundation of China (51476122), the Natural Science Foundation (BK20160388) and the Prospective Joint Research Project (BK2014071) of Jiangsu Province, China.
Author Contributions
Xiufang Liu designed the experiments; Changhai Liu built up the experimental apparatus; Ze zhang and Liang Chen carried out the experimental study; Yu Hou analyzed the experimental data. All authors contributed equally in the writing and revision of this paper.
Conflicts of Interest
The authors declare no conflict of interest.
References
- Lorentzen, G.; Pettersen, J. A new efficient and environmentally benign system for car air-conditioning. Int. J. Refrig. 1993, 16, 4–12. [Google Scholar] [CrossRef]
- Kauf, F. Determination of the optimum high pressure for trans-critical CO2 refrigeration cycles. Int. J. Therm. Sci. 1999, 38, 325–330. [Google Scholar] [CrossRef]
- Sarkar, J. Review on cycle modifications of trans-critical CO2 refrigeration and heat pump systems. J. Adv. Res. Mech. Eng. 2010, 1, 22–29. [Google Scholar]
- Liao, S.M.; Zhao, T.S.; Jakobsen, A. A correlation of optimal heat rejection pressures in trans-critical carbon dioxide cycles. Appl. Therm. Eng. 2000, 20, 831–841. [Google Scholar] [CrossRef]
- Kim, M.-H.; Pettersen, J.; Bullard, C.W. Fundamental process and system design issues in CO2 vapor compression systems. Prog. Energy Combust. Sci. 2004, 30, 119–174. [Google Scholar] [CrossRef]
- Sarkar, J.; Bhattacharyya, S.; Gopal, M.R. Natural refrigerant-based subcritical and trans-critical cycles for high temperature heating. Int. J. Refrig. 2007, 30, 3–10. [Google Scholar] [CrossRef]
- Cabello, R.; Sánchez, D.; Llopis, R.; Torrella, E. Experimental evaluation of the energy efficiency of a CO2 refrigerating plant working in trans-critical conditions. Appl. Therm. Eng. 2008, 28, 1596–1604. [Google Scholar] [CrossRef]
- Chesi, A.; Ferrara, G.; Ferrari, L.; Tarani, F. Setup and characterisation of a multi-purpose test rig for R744 refrigerating cycles and equipment. Int. J. Refrig. 2012, 35, 1848–1859. [Google Scholar] [CrossRef]
- Qi, P.C.; He, Y.L.; Wang, X.L.; Meng, X.Z. Experimental investigation of the optimal heat rejection pressure for a trans-critical CO2 heat pump water heater. Appl. Therm. Eng. 2013, 56, 120–125. [Google Scholar] [CrossRef]
- Zhang, X.P.; Fan, X.W.; Wang, F.K.; Shen, H.G. Theoretical and experimental studies on optimum heat rejection pressure for a CO2 heat pump system. Appl. Therm. Eng. 2010, 30, 2537–2544. [Google Scholar] [CrossRef]
- Chen, Y.; Gu, J. The optimum high pressure for CO2 trans-critical refrigeration systems with internal heat exchangers. Int. J. Refrig. 2005, 28, 1238–1249. [Google Scholar] [CrossRef]
- Kim, M.S.; Shin, C.S.; Kim, M.S. A study on the real time optimal control method for heat rejection pressure of a CO2 refrigeration system with an internal heat exchanger. Int. J. Refrig. 2014, 48, 87–99. [Google Scholar] [CrossRef]
- Hu, B.; Li, Y.; Cao, F.; Xing, Z. Extremum seeking control of COP optimization for air-source trans-critical CO2 heat pump water heater system. Appl. Energy 2015, 147, 361–372. [Google Scholar] [CrossRef]
- Cecchinato, L.; Corradi, M.; Cosi, G.; Minetto, S.; Rampazzo, M. A real-time algorithm for the determination of R744 systems optimal high pressure. Int. J. Refrig. 2012, 35, 817–826. [Google Scholar] [CrossRef]
- Nekså, P.; Rekstad, H.; Zakeri, G.R.; Schiefloe, P.A. CO2-heat pump water heater: Characteristics, system design and experimental results. Int. J. Refrig. 1998, 21, 172–179. [Google Scholar] [CrossRef]
- Zhang, J.F.; Qin, Y.; Wang, C.C. Review on CO2 heat pump water heater for residential use in Japan. Renew. Sustain. Energy Rev. 2015, 50, 1383–1391. [Google Scholar] [CrossRef]
- Dai, B.; Dang, C.; Li, M.; Tian, H.; Ma, Y. Thermodynamic performance assessment of carbon dioxide blends with low-global warming potential (GWP) working fluids for a heat pump water heater. Int. J. Refrig. 2015, 56, 1–14. [Google Scholar] [CrossRef]
- Yokoyama, R.; Wakui, T.; Kamakari, J.; Takemura, K. Performance analysis of a CO2 heat pump water heating system under a daily change in a standardized demand. Energy 2010, 35, 718–728. [Google Scholar] [CrossRef]
- Goodman, C.; Fronk, B.M.; Garimella, S. Trans-critical carbon dioxide microchannel heat pump water heaters: Part I—Validated component simulation modules. Int. J. Refrig. 2011, 34, 859–869. [Google Scholar] [CrossRef]
- Goodman, C.; Fronk, B.M.; Garimella, S. Trans-critical carbon dioxide microchannel heat pump water heaters: Part II—System simulation and optimization. Int. J. Refrig. 2011, 34, 870–880. [Google Scholar] [CrossRef]
- Hu, B.; Wang, X.; Cao, F.; He, Z.; Xing, Z. Experimental analysis of an air-source trans-critical CO2 heat pump water heater using the hot gas bypass defrosting method. Appl. Therm. Eng. 2014, 71, 528–535. [Google Scholar] [CrossRef]
- Ohkura, M.; Yokoyama, R.; Nakamata, T.; Wakui, T. Numerical analysis on performance enhancement of a CO2 heat pump water heating system by extracting tepid water. Energy 2015, 87, 435–447. [Google Scholar] [CrossRef]
- Fronk, B.M.; Garimella, S. Water-coupled carbon dioxide microchannel gas cooler for heat pump water heaters: Part I—Experiments. Int. J. Refrig. 2011, 34, 7–16. [Google Scholar] [CrossRef]
- Fronk, B.M.; Garimella, S. Water-coupled carbon dioxide microchannel gas cooler for heat pump water heaters: Part II—Model development and validation. Int. J. Refrig. 2011, 34, 17–28. [Google Scholar] [CrossRef]
- Yang, Y.; Li, M.; Wang, K.; Ma, Y. Study of multi-twisted-tube gas cooler for CO2 heat pump water heaters. Appl. Therm. Eng. 2016, 102, 204–212. [Google Scholar] [CrossRef]
- Wang, S.; Tuo, H.; Cao, F.; Xing, Z. Experimental investigation on air-source trans-critical CO2 heat pump water heater system at a fixed water inlet temperature. Int. J. Refrig. 2013, 36, 701–716. [Google Scholar] [CrossRef]
- Klein, S.A.; Reindl, D.T.; Brownell, K. Refrigeration system performance using liquid-suction heat exchangers. Int. J. Refrig. 2000, 23, 588–596. [Google Scholar] [CrossRef]
- Aprea, C.; Maiorino, A. An experimental evaluation of the transcritical CO2 refrigerator performances using an internal heat exchanger. Int. J. Refrig. 2008, 31, 1006–1011. [Google Scholar] [CrossRef]
- Kline, S.J.; McClintock, F.A. Describing uncertainties in single sample experiments. Mech. Eng. 1953, 75, 3–8. [Google Scholar]

© 2017 by the authors. Licensee MDPI, Basel, Switzerland. This article is an open access article distributed under the terms and conditions of the Creative Commons Attribution (CC BY) license (http://creativecommons.org/licenses/by/4.0/).