Article

A Step towards the Hydrogen Economy—A Life Cycle Cost Analysis of A Hydrogen Refueling Station

by
Ludvik Viktorsson
1,*,
Jukka Taneli Heinonen
2,
Jon Bjorn Skulason
1 and
Runar Unnthorsson
3
1
Icelandic New Energy, Reykjavik 108, Iceland
2
Faculty of Civil and Environmental Engineering, University of Iceland, Reykjavik 107, Iceland
3
Faculty of Industrial Engineering, Mechanical Engineering and Computer Science, University of Iceland, Reykjavik 107, Iceland
*
Author to whom correspondence should be addressed.
Energies 2017, 10(6), 763; https://doi.org/10.3390/en10060763
Submission received: 8 April 2017 / Revised: 25 May 2017 / Accepted: 26 May 2017 / Published: 31 May 2017
(This article belongs to the Special Issue Sustainable and Renewable Energy Systems)

Abstract

:
This study was aimed to define a methodology based on existing literature and evaluate the levelized cost of hydrogen (LCOH) for a decentralized hydrogen refueling station (HRS) in Halle, Belgium. The results are based on a comprehensive data collection, along with real cost information. The main results indicated that a LCOH of 10.3 €/kg at the HRS can be reached over a lifetime of 20 years, if an average electricity cost of 0.04 €/kWh could be achieved and if the operating hours are maximized. Furthermore, if the initial capital costs can be reduced by 80%, in the case of direct subsidy, the LCOH could even fall to 6.7 €/kg.

1. Introduction

Global warming has become an unequivocal problem where the main cause is considered to be anthropogenic greenhouse gas (GHG) emissions [1]. Means to mitigate GHG emissions such as the implementation of renewable energy (RE) sources, stopping deforestation and increasing power generation efficiencies have been presented [2]. New and efficient RE technologies such as wind and solar power are being implemented in large quantities on a global scale. To demonstrate the rapid growth of the global RE capacity, wind power rose from 17,333 MW to 369,608 MW from 2000 to 2014 and solar energy capacity increased from 805 MW to 175,305 MW during the same period [3].
These new energy sources entail problems linked to their power output as it is highly intermittent and cannot meet steady energy demand [4]. One solution to this problem is to use hydrogen as an energy carrier where hydrogen can be produced on site by water electrolysis, and compressed, stored and re-electrified via fuel cells during low production days or used for mobility purposes [5].
Compared to conventional fuels hydrogen is a strong competitor. For example, hydrogen has more energy content per unit mass but at the same time occupies more space at atmospheric temperature which makes a high pressure or liquefied storage vital [4,6,7,8,9,10,11,12]. Hydrogen can be produced from variable sources and by different processes such as coal gasification, partial oxidation of hydrocarbons, steam reforming of natural gas and water electrolysis [13,14,15]. Water electrolysis is the only method that does not entail GHG emissions, making it the perfect method to link to the rapidly increasing RE capacity. Despite the advantages of hydrogen, large scale implementation has been slow to be developed, due to high capital and running costs [16].
The term “hydrogen economy” has a relatively broad meaning [17] and can be traced to the early 1970’s where the term was first used publicly in the work of Bockris [18,19], who referred to the hydrogen economy as the concept of using hydrogen as the energy medium between future energy generation sites and consumers where the hydrogen could be used as a fuel or to produce electricity. Since then the term has widely been used in relation to the part hydrogen plays in the car industry and as an energy carrier linked to renewable energy sources aimed to balance intermittent energy production [5,20]. Therefore, the term has been referred to as many “economies” instead of one “economy” [17].
Although hydrogen has been considered a viable option as an energy carrier for stationary applications, the main application of hydrogen has been linked to the car industry where hydrogen could replace conventional fossil fuels, thus reducing GHG emissions [7,9,21]. During the first decade of this century hydrogen “hype” linked to the car industry peaked [22]. However, despite the cooling down of hydrogen hype, car manufacturers have reached a point where hydrogen driven vehicles are ready for deployment.
Hydrogen production via water electrolysis is expensive due to the high investment and running costs which make an economic assessment of such systems important. Life cycle cost (LCC) analysis has been the method to study the cost due to its capability of capturing all upstream costs associated with the overall lifetime of the selected system [12]. Hydrogen systems are often considered as a replacement or addition to conventional energy sources at remote locations where diesel generators are used extensively with relevant emissions and diesel cost. Therefore, as a means to compare different systems at different locations the levelized cost of hydrogen (LCOH) method has been implemented in order to evaluate the LCC in terms of cost per energy unit (kWh) or in terms of hydrogen mass (kg) [12,23,24,25].
The literature reveals many studies that assess the economic feasibility of energy systems that include hydrogen as an energy carrier, especially for remote locations [26,27,28,29]. The key similarity among the results of those studies is that further reduction in hydrogen component cost is needed to achieve economic competitiveness. Thus, new pilot projects and research on their results are needed for the hydrogen systems to become economically competitive. Furthermore, although there is an abundance of feasibility studies for hydrogen energy systems there is a certain lack of economic assessments of real demonstration and pilot projects despite the fact that a number of hydrogen systems have been installed [30].
The aim of this study was to evaluate the well-to-tank (WTT) LCOH of a hydrogen refueling station (HRS) located in Halle, Belgium, compare the cost-level to previous benchmarks, and identify the most critical cost factors. In addition, a sensitivity analysis for different uncertain components is provided to evaluate further under which conditions certain target cost levels could be met. The LCC model provides a holistic approach based on the existing literature. The main findings are that capital costs should be pushed down in the future to reach more competitive cost levels, which in the current assessment are only reached under the most favorable future running cost development.
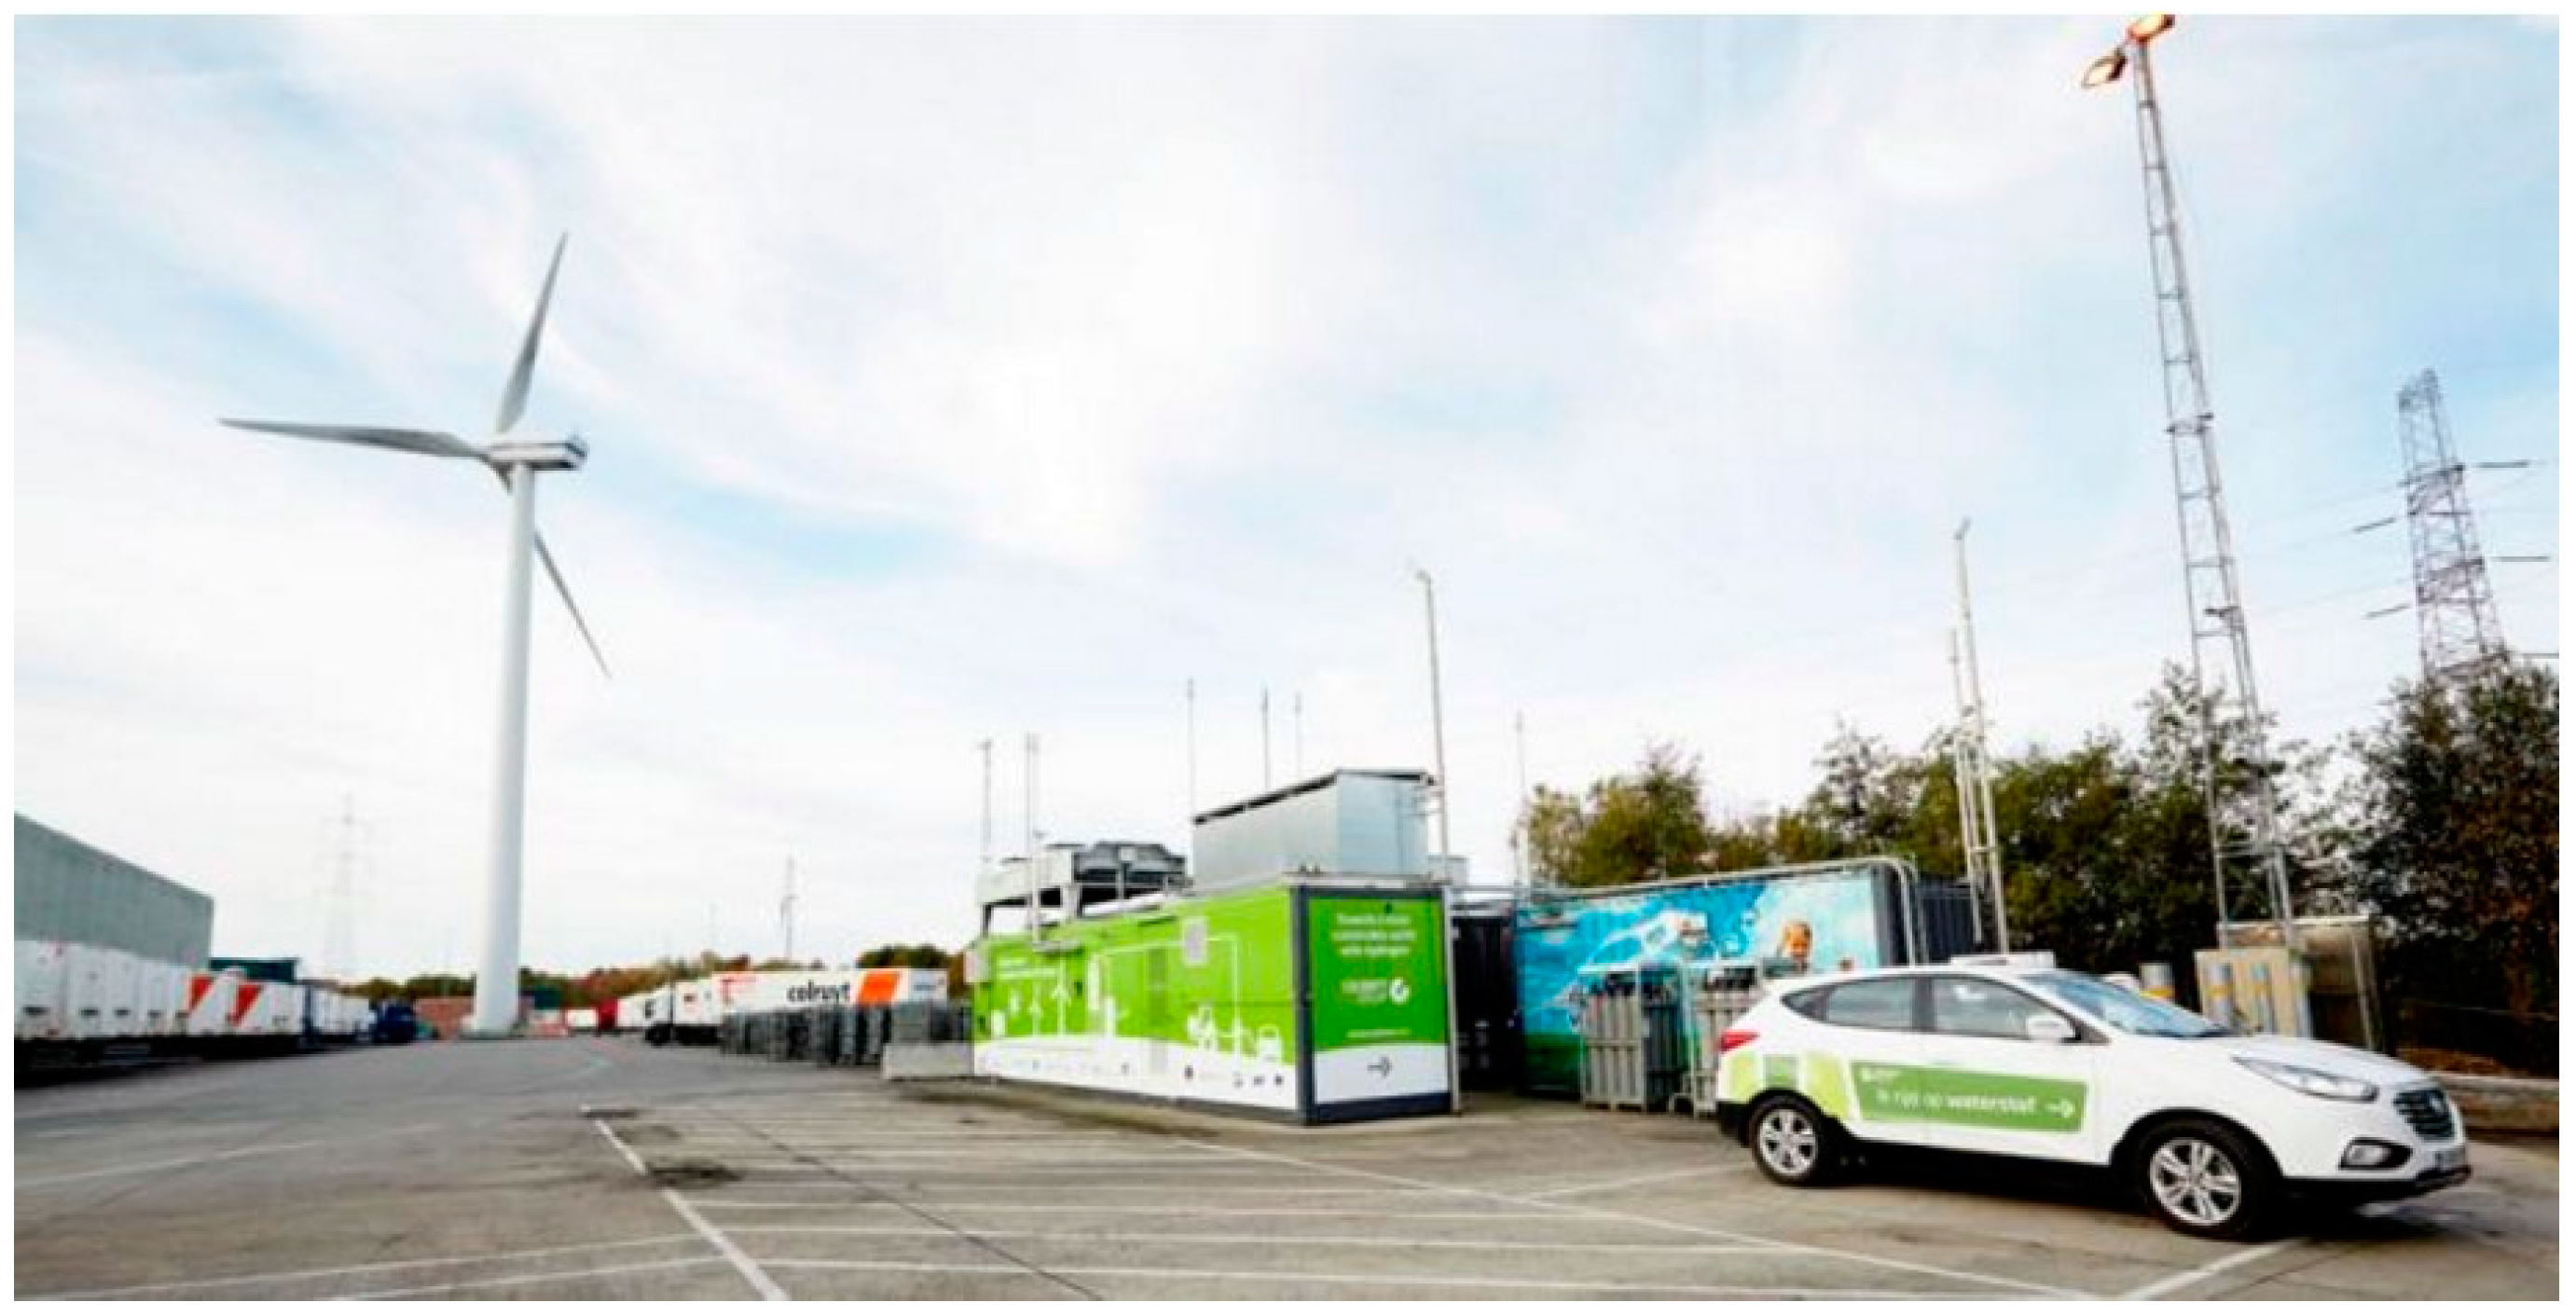
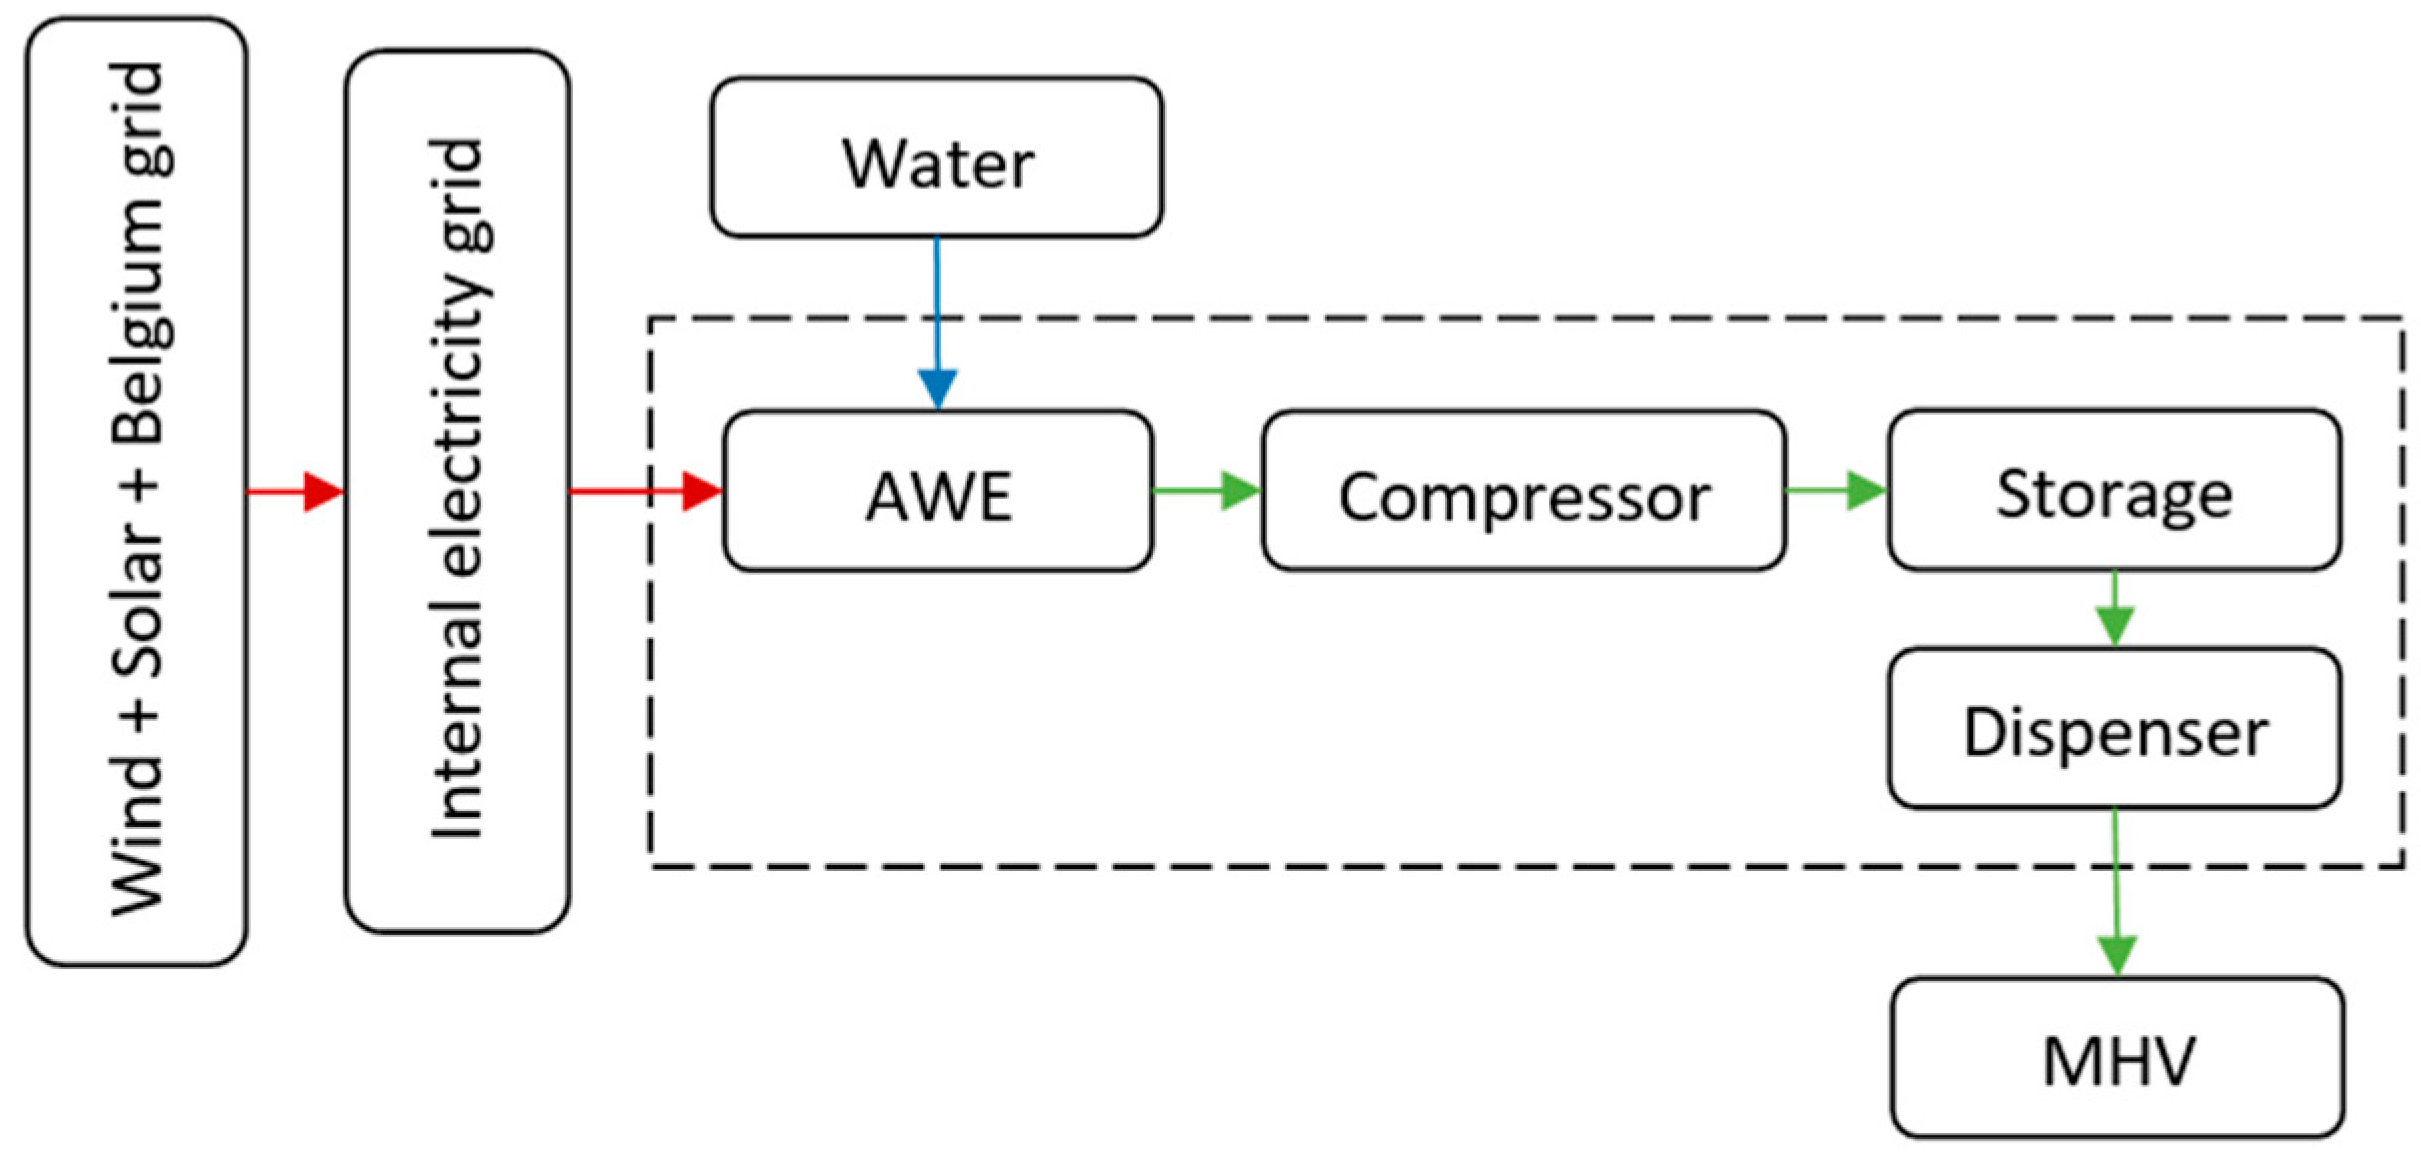
The case study project was co-funded by the European Commission. The 7th Framework Programme for the Fuel Cell and Hydrogen Joint Undertaking (FCH JU) initiative and has been given the acronym Don Quichote (DQ). The DQ project was initiated in 2012 and is a 5-year project consisting of three phases. The first phase, analyzed in this paper, was the evaluation of an existing hydrogen refueling station based on an alkaline water electrolyzer (WE), diaphragm compressor (450 bar) and steel hydrogen storage (50 kg). Phase 2 is aimed to implement a state-of-the-art proton exchange membrane (PEM) WE and a fuel cell (FC) for the re-electrification of the hydrogen and a (40 kg) composite storage tank. The aim of the DQ project is obviously to benchmark the new PEM WE system against the mature alkaline WE technology. Phase 3 includes the addition of a state-of-the-art electrochemical compressor that will be benchmarked against the existing diaphragm compressor. The focus of this study is only on phase 1 of the project and can act as a benchmark for phase 2.
The structure of this paper is split, as follows: the research methods are explained in Section 2 and a detailed description of the research process is given in Section 3. The results are presented in Section 4, including the main LCC results along with a sensitivity analysis. Implications and further discussion are provided in Section 5 and finally the main results are concluded in Section 6.

2. Methodology

2.1. Life Cycle Costing (LCC)

LCC is an important method to evaluate the total cost of a product or a system over its given lifetime [31,32]. By applying LCC into the early life cycle stage, changes are easier in terms of minimizing the LCC. There is no global approach that fits all situations and as the literature reveals the LCC discourse has been a long journey. Many methods have been proposed and are rather general in approach [31,32,33]. Although the methods are different, many of the main steps are similar to some of the first methods such as the steps in the method by Harvey [33]:
  • Define the cost elements;
  • Define the cost structure;
  • Establish cost estimating relationships;
  • Establish the method of LCC formulation.
Although LCC has been accepted as a methodology it is still being criticized. The main disadvantages of the LCC method come from the fact that it includes a future estimation and can lead to uncertain results. Despite the flaws of the LCC method it still provides a somewhat holistic universal method to evaluate and compare different investment opportunities.

2.2. Levelized Cost of Hydrogen (LCOH)

Essentially the LCOH method is based on the levelized cost of energy (LCOE) method which is widely used in the renewable energy sector where the LCC of renewables is presented in terms of cost per energy output unit. The definition of the LCOE by IRENA [34] is depicted in Equation (1):
L C O E =   n = 1 N ( I n + M n + F n ) · ( 1 + i ) n n = 1 N E n · ( 1 + i ) n
where In is the initial investment cost for year n, Mn is the maintenance cost in year n, Fn is the fuel cost in year n, En is the energy generation in year n, i is the discount rate and N is the lifetime.
The LCOE method is a valuable tool when comparing different case studies and is not limited to renewable energy sources but has been used widely to assess the cost of hydrogen. Hydrogen output is usually measured in terms of energy and therefore, similarly to electrical calculations, the cost can be presented in terms of cost per unit energy or mass of hydrogen [12,35].

2.3. LCC Assessment

The LCC framework was derived from the existing literature, both state of the art and mature papers [12,24,25,29,35,36]. Equation (2) depicts how the investment cost was calculated:
C i n v =   ( C w e   + C c   + C s   + C d + C m i s c )
where Cinv is the investment cost, Cwe is the WE cost, Cc is the compressor cost, Cs is the storage unit cost, Cd is the dispenser cost and Cmisc is miscellaneous costs or all other costs that were connected to the station such as the Conformité Européene (CE) certification and the preparation costs.
The investment costs were annualized by the capital recovery factor (CRF) depicted in Equation (3):
C R F =   i ( 1 + i ) n ( 1 + i ) n 1
where i is the nominal discount rate and n is the economic lifetime of the station. The annualized, a, investment costs are therefore:
C i n v , a =   C R F × C i n v  
The operational and maintenance (O&M) costs were divided between fixed and variable expenses. The annual fixed O&M is denoted by:
C f o m , a = C m c + C c o n t + C r e p , a
where Cmc is the maintenance cost for the compressor, Ccont is the service contract cost and Crep,a is the annualized replacement cost.
Annual replacement costs were calculated by applying the single amount present value formula and the CRF to the replacement costs. Equation (6) depicts how the annual replacement costs were calculated, where t is the year of replacement, i is the nominal discount rate and Crep is the current value of the component to be replaced:
C r e p , a =   C R F × C r e p ( 1 + i ) t
Similarly, the variable O&M is presented by:
C v o m , a =   C e +   C w
where Ce is the annual electricity cost and Cw is the annual water cost. The annualized LCC can therefore be expressed by Equation (8):
C L C C , a =   C c a p , a +   C f o m , a +   C v o m , a
After the annualized LCC have been calculated the LCOH can be assessed by dividing the annualized LCC noted as CLCC,a by the amount of produced hydrogen (kg H2) noted as E H 2 , a , on an annual basis:
LCOH   =   C L C C , a E H 2 , a

3. Research Design

3.1. Scope of the Study

The focus was set for the customer’s perspective and includes the WTT boundary. The life cycle phases considered were the acquisition and operational phases. A graphical representation of the boundary is depicted in Figure 1.
The acquisition phase included the main component, installation, and license costs while the operational phase included the O&M costs which were divided between fixed and variable costs.
As Figure 1 indicates, the system is connected to the internal electricity grid at Colruyt, which provides electricity to the warehouse for example, and comprises electricity from wind turbines, solar PV and the Belgium grid when needed. The proportion from each source to the station remains unknown to the authors; hence the assumptions of electricity price described in Section 3.3.1.

3.2. Case Description

The system under investigation is a hydrogen refueling station located in Halle, Belgium, on the site of Colruyt, one of the largest retail companies in Belgium (see Figure 2). The logistic center comprises a warehouse which is operated 24 h a day, 7 days a week with numerous material handling vehicles on site. The warehouse is powered by three approximately 1.5 MW wind turbines, an approximately 1 MW solar PV system and the Belgium grid. The station is connected to the warehouse and therefore hydrogen can be produced from any of these sources. In addition, the renewables can inject electricity into the Belgium grid when needed. The material handling vehicles were completely electrical until 2011, when an alkaline-based hydrogen refueling station, i.e., phase 1, was implemented based on regional funding.
As indicated, the project was split into three phases. However, the focus of this paper is on phase 1, as the data collection for phase 2 was not complete at the time of writing. Phase 1 consists of an alkaline WE (30 N m3/h), a diaphragm compressor (450 bar), a 50 kg (450 bar) hydrogen storage and a (350 bar) dispenser. Phase 2 was commissioned in July 2015 and by then the initial station (phase 1) had provided around 2,200 kg of hydrogen through approximately 2500 refuelings, maintaining over 95% (~8322 h) annual availability. Eleven hydrogen forklifts had already been implemented at that time and the goal of Colruyt is to implement at least 75 forklifts before the end of the DQ project in 2017. The forklifts are also being subsidized by Interreg Europe.

3.3. Data Collection

3.3.1. Cost Data

The first part of the dataset consists of the capital expenses. High investment costs have previous been found as one of the key obstacles to reach feasible LCOH levels [26,27,28,29]. For the present case study, the investment costs were acquired from project partners and included in the component cost, the integration cost of the system performed by the provider of the hydrogen components, CE compliance of the complete station, relevant permits, and civil work on site. The lifetime of individual components differs and is often dependent on operational hours and quality of maintenance. Therefore, the assumption was made that each component has a lifetime of 20 years and salvage value was neglected. The initial capital expenses are depicted in Table 1 and do not include value added tax (VAT).
The alkaline WE occupies the largest share or 37%, the compressor and the dispenser both take up 19% each, and the storage unit takes up 14%. The remaining factors only account for 10% of the total (Figure 3).
The annual costs associated with the operational phase were divided between fixed and variable costs. The fixed costs comprised a service contract cost, maintenance and replacement cost for the alkaline WE, and maintenance cost for the diaphragm compressor (see Table 2 for fixed O&M values).
The variable expenses included the electricity and water costs. The electricity cost is usually the largest cost factor of the LCOH, though uncertain how it will extend into the future, which makes it an extremely important parameter. Detailed information regarding hourly availability of the renewables and the cost of each kWh at Colruyt during the data collection period remained unknown to the authors. This uncertainty was overcome by setting the initial price for electricity to the average Belgium grid price for mid-size companies according to Eurostat [37] during the period 2005 to 2016, and further analyzing the impact of the energy price on the LCOH in the sensitivity analysis.
The water cost represents the actual water cost before entering the system and gives a realistic view of the cost. Table 3 depicts the values of the electricity and water costs used in this study. The sensitivity analysis covered situations such as the valorization of wind or solar power on the power market in case of injection of electricity in the public grid.
One of the main replacement cost factors is the cell stack replacement. The WE is comprised of 2 cell stacks (15 Nm3/h) each. The rated lifetime of the cell stacks is approximately (60,000 h) corresponding to approximately 7 years, if operated continuously. However, the assumption was made that the cell stacks would be replaced every 5 years to simplify the initial model. The cost of replacing the cell stacks, parts, plus labor cost, were estimated at 60,600 €/change. The cell stack replacement cost is included in the sensitivity analysis in Section 4.2.
Following the European Central Bank inflation target [38] and Ammermann et al. [39], the values for the inflation and the discount rate were selected as 2% and 6% respectively in the initial model, and later allowed to vary in the sensitivity analysis.

3.3.2. Field Data

The second part of the dataset was field data. At the beginning of the DQ project a comprehensive data collection plan was set up and carried out by project partners on a weekly basis. It should be noted that due to some scientific measurement campaigns the system did not always operate in the most effective way.
The data represents the gross consumption of the HRS station which might affect the results in a way but still provides information that are realistic and possibly higher than in studies that only account for the minimum consumption. The main operational data used in this study were the electricity and water consumption of the complete station ranging from the year 2014 to 2015. Missing data from 2014 was replaced with data from 2015 resulting in a whole year of monthly values.
The electrical measurements comprise of the WE consumption, the control units and the compressor, storage, and dispenser unit. Figure 4 shows the monthly values of the total electricity consumption in a bar graph.
Similarly, the water consumption, in terms of (m3) was collected and represents the gross consumption before the water filtration system and does not represent the real consumption of the WE. The total monthly values for the base year 2014 are depicted in Figure 5.
The output of the station was based on produced hydrogen, in terms of the functional unit kg. Due to a lack of a flow meter the hydrogen output was calculated by team members based on the electrical consumption of the alkaline WE. The results represented the theoretical maximum production of the AWE. The total monthly values from 2014 are depicted in Figure 6.
The field data described above was assembled and are summarized in Table 4.
As Table 4 indicates, the station was running on low capacity in the year 2014. The reason could be that the number of forklifts was low and not been implemented into the daily routine at the warehouse.
The values in Table 4 were used to assess the LCOH. The assumption was made that the station would be run 80% of the time, which is considered a realistic scenario for a decentralized HRS and results in approximately 18,896 kg H2 per year. Estimations for different actual production capacity levels are reported in the sensitivity analysis to demonstrate the effects capacity level has on the LCOH. Table 5 summarizes the costs for the main design variables at the selected utilization factor.

4. Results

4.1. Main LCC Results

The main LCC results are summarized in Table 6 where different lifetimes of 10, 15 and 20 years have been assumed. The variable lifetime was selected to demonstrate the effect time has on the LCOH in case of a short-lived demonstration project or a long-term investment. The results show that the LCOH is highest for the 10 years lifetime with a value of 16.6 €/kg and decreases with time becoming 13.9 €/kg H2 for 20 years of lifetime.
As seen in Table 6 the LCOH is lowest for the 20 years’ lifetime. A system like this would realistically be a long-term investment and therefore the results from the 20 years lifetime were selected for further analysis. The share of the main components in terms of annualized costs for 20 years of lifetime (€/kg) is presented in Figure 7. The electricity cost has the largest share of 6.4 €/kg, the investment costs second largest with a value of 4.5 €/kg, the fixed O&M for the WE and compressor with a value of 2.3 €/kg, cell stack replacement cost with a value of 0.6 €/kg and water cost with a near negligible value of 0.1 €/kg. It is evident that the electricity cost is the main cost factor, having an approximately 40% larger share of the LCOH than the investment expenses, the second largest cost factor.

4.2. Sensitivity Analysis

Based on the results the main cost factors were identified and the effects of changes analyzed in terms of the LCOH. The main factors considered were the electricity cost, electrical consumption, investment expenses and discount rate. A sensitivity star is presented in Figure 8 where those factors were subject to a change of ±60% from their base values, which was estimated as the maximum plausible change over the assessment period, as explained further below.
As seen in Figure 8 changes the price of electricity and electrical consumption have the same impact on the LCOH due to their linear relationship. They have the largest effect but the investment expenses have the second highest impact, approximately half of that of the electricity price. Although Figure 8 provides a relatively good idea regarding the effects each cost factor could have on the LCOH it fails to show numerical values of the LCOH when subject to somewhat realistic changes. To demonstrate in more detail how the LCOH changes with respect to individual cost factors, Figure 9 is presented based on the following arguments:
  • As seen in Table 3 the base electricity cost in this study was set to 0.09 €/kWh, which was the average electricity cost for medium size industries in Belgium for the period 2005 to 2016 [34]. This assumption is somewhat unrealistic considering that Colruyt gets most of the electricity from onsite renewable energy sources and is benefiting from a green certificate scheme, which means a portion of the LCOE from the renewables is subsidized. The actual value was not available for the authors but the assumption was made that it could get as low as 0.04 €/kWh in case of injection into the public grid. The maximum value of 0.15 €/kWh was considered to cover any fluctuations in the price of electricity.
  • As seen in Figure 8 the effects of the discount rate are not severe; however, an interval from 3% to 9% was selected based on assumptions.
  • Although the initial capital expenses are a fixed cost at the beginning of the project it is important to see how it affects the LCOH in the case of decreased costs in the future due to mass production. To cover any uncertainties an increase in investment expenses of 20% and a decrease of −80%, were selected.
  • The water cost was neglected in the sensitivity analysis as it only occupies a small share of the total costs and has been considered negligible in other studies [40].
  • The most important part of the fixed O&M costs is the cell stack replacement cost and was selected for further analysis. As the hydrogen implementation is still in its early stages the future costs of the cell stacks are likely to decrease with mass production. Based on pure assumptions the changes in replacement costs were selected as ±50%.
As Figure 9 indicates the LCOH could be reduced to approximately 10.3 €/kg with an electricity price of 0.04 €/kWh. In the case of a reduction of −80% of the total investment costs the LCOH could be reduced to approximately 10.3 €/kg, together with the estimated minimum price of electricity down to 6.7 €/kg over the longest assessed operational phase. The sensitivity of the LCOH on the cell stack replacement cost shows a decrease to approximately 13.6 €/kg.
In the results above, a fixed and relatively modest number of operating hours, 80% of the time or 7008 h annually is assumed. As an important parameter, a specific sensitivity analysis was carried out to see how the operating hours affect the LCOH. The results are depicted in Figure 10 where the operating hours vary from 50% (4380 h)–95% (8322 h) over the 20-year lifetime.
As Figure 10 indicates the LCOH could reach approximately 18 €/kg if the operating hours are 4380 h (50%) and as low as approximately 12 €/kg at 8322 h (95%), making the operating hours as important factors as the electricity and investment costs.

5. Discussion

The main goal of this study was to evaluate the LCOH for a decentralized HRS in Belgium. The cost model was derived from mature and state of the art literature and the calculations were based on a comprehensive field data collection to ascertain as realistic costs as possible. The results can also be used as benchmarks for the next phase of the DQ project, where a new state of the art PEM WE and FC have been added to the current HRS.
The main limitations of the study are related to assumptions of the price of electricity and the utilization of the HRS. The assumption of the price of electricity was based on an average value, both for the high and low values, which is a simplification of a highly dynamic relationship. These assumptions might lead to estimation errors as well, especially if actual operating hours tend to be during peak hours when the cost of electricity is high or at other times resulting in lower electricity costs. A further analysis of this relationship is an area of further study.
No consumer tax or other fees were applied to the LCOH, which would reflect real consumer costs similar to some of the results in the study by Linnemann & Steinberger-Wilckens [36]. There was no salvage value assumed nor any end of life costs due to uncertainty of the status of the components after the lifetimes analyzed.
Based on the assumptions in this study the main results indicated that a LCOH of 13.9 €/kg could be reached for a 20 year lifetime with 80% utilization. Furthermore, in favorable conditions, with a reduction in investment expenses of −80% and electricity cost of 0.04 €/kWh a LCOH as low as 6.7 €/kg could be reached. Of these, a reduction in investment expenses requires subsidizing or a technological leap, but the electricity part is already a plausible scenario with the RE systems operated on the case site, and with an electricity cost of only 0.04 €/kWh the LCOH would drop down close to 6.7 €/kg.
When comparing the results with the existing literature on similar production systems [25,36], variations in the results are found placing the current study in between the extremes. The key factor explaining the differences seems to be the high impact on different assumptions, underlining the earlier stated need for more studies of actual operating facilities.
In comparison to the study by Linnemann and Steinberger-Wilckens [36], where a small and a large scale hydrogen plant were analyzed, costs of approximately 27.5 €/kg and 11.4 €/kg, respectively, were presented. It is relevant to compare the cost of the smaller scale system from the reference study to the 13.9 €/kg in the current study. There is a large difference between the two which could be attributed by different assumptions. The main differences are depicted in Table 7 but the main difference was the operating hours. It should be noted that although the dates of the studies differ, the technology is similar and the date of the cost information in the current study is from the year 2011 and therefore the validity of the comparison remains.
In another study, Greiner et al. [25] provide a method of assessment for a wind-hydrogen system on a Norwegian island, presenting both a chronological simulation and cost calculations. In contrast to the current study and the reference study above there is a large gap between the results. Greiner et al. [25] presented a LCOH of 2.8 €/kg and 6.2 €/kg for grid-connected and stand-alone systems. Different assumptions (refer to Table 7) are the main reasons for the vast difference where the largest factors might be the scale of the system and potentially the electricity costs. The study by Greiner et al. [25] utilizes electricity from an onsite wind turbine and therefore the electricity cost is only connected to the wind turbine cost and production capacity. They also assume hydrogen demand of 450 kg/day. It is appropriate to compare the grid connected system to the current study whereas both systems have renewables that inject electricity into the local grid, bearing in mind that Greiner et al. [25] include the sold sale/purchase cost of market price electricity. In this way, in the case of the lowest electricity cost in the current study the LCOH could reach 10.3 €/kg with an electricity cost of 0.04 €/kWh. The assumption of the lower electricity cost is somewhat unrealistic where this value could only be reached when injecting electricity into the public grid, which then affects the results to some extent. The actual price would presumably fluctuate, but just how much is an area for further study. It should be noted that the investment expenses in the current study include more realistic costs than the comparison studies, and hence a potentially higher LCOH.
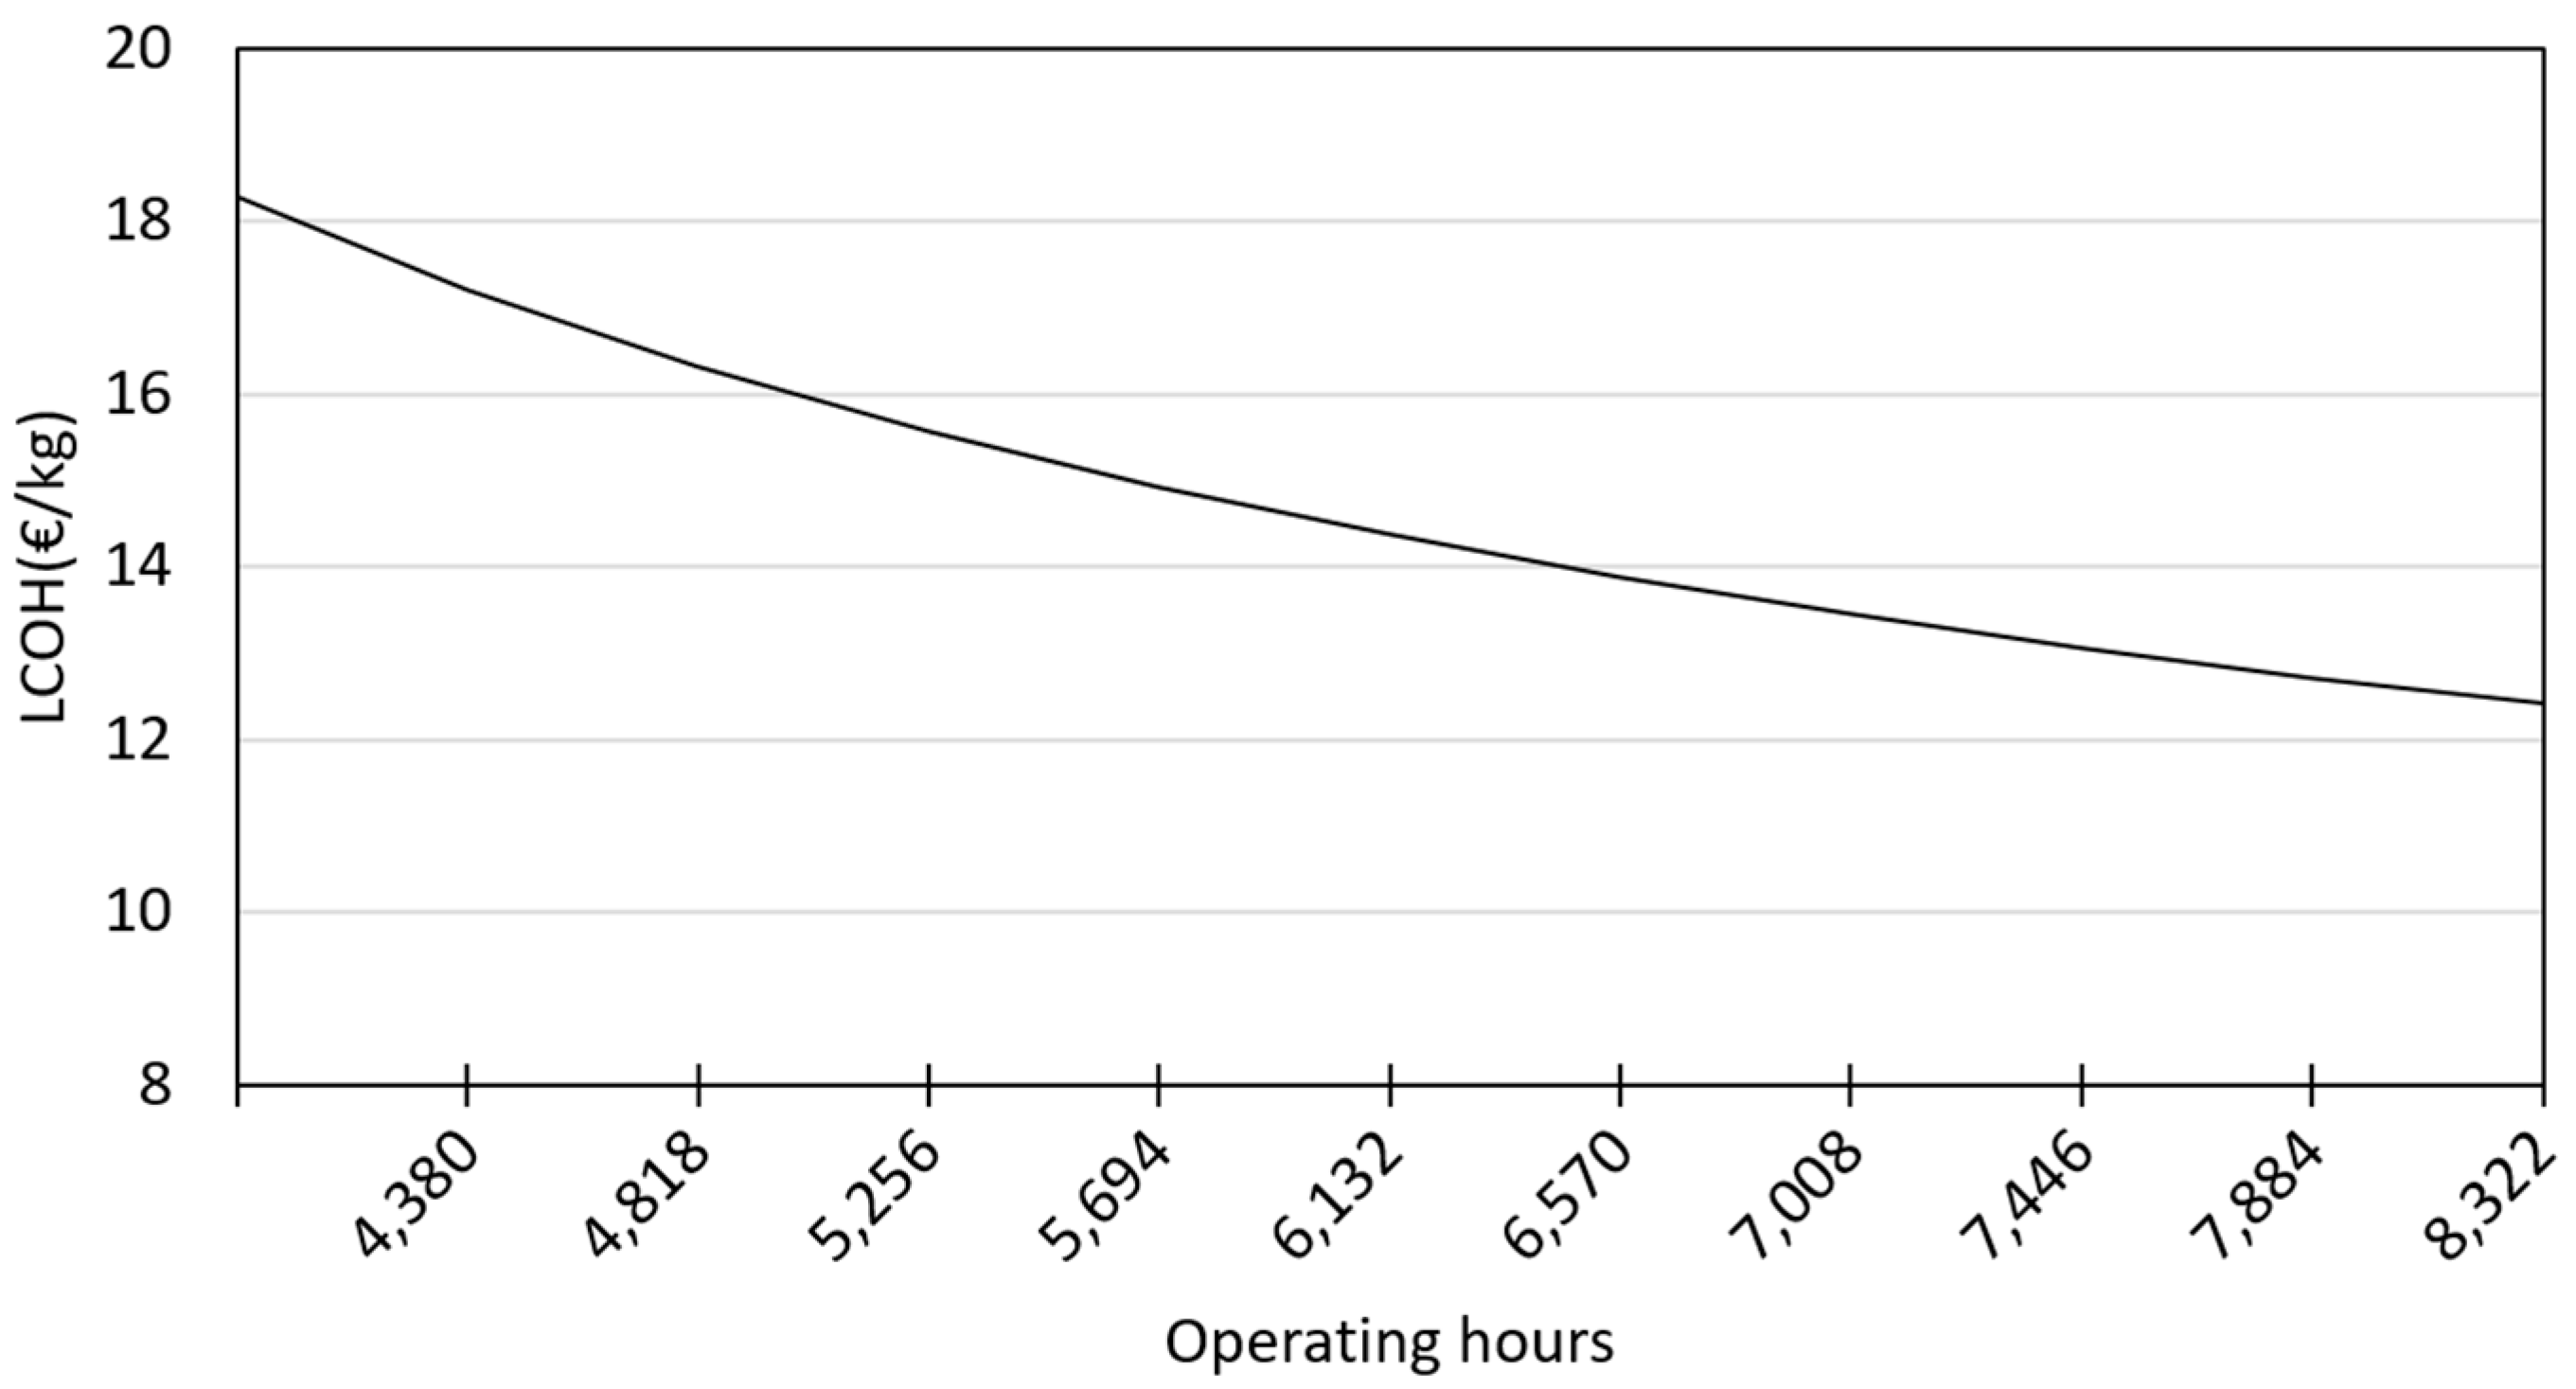
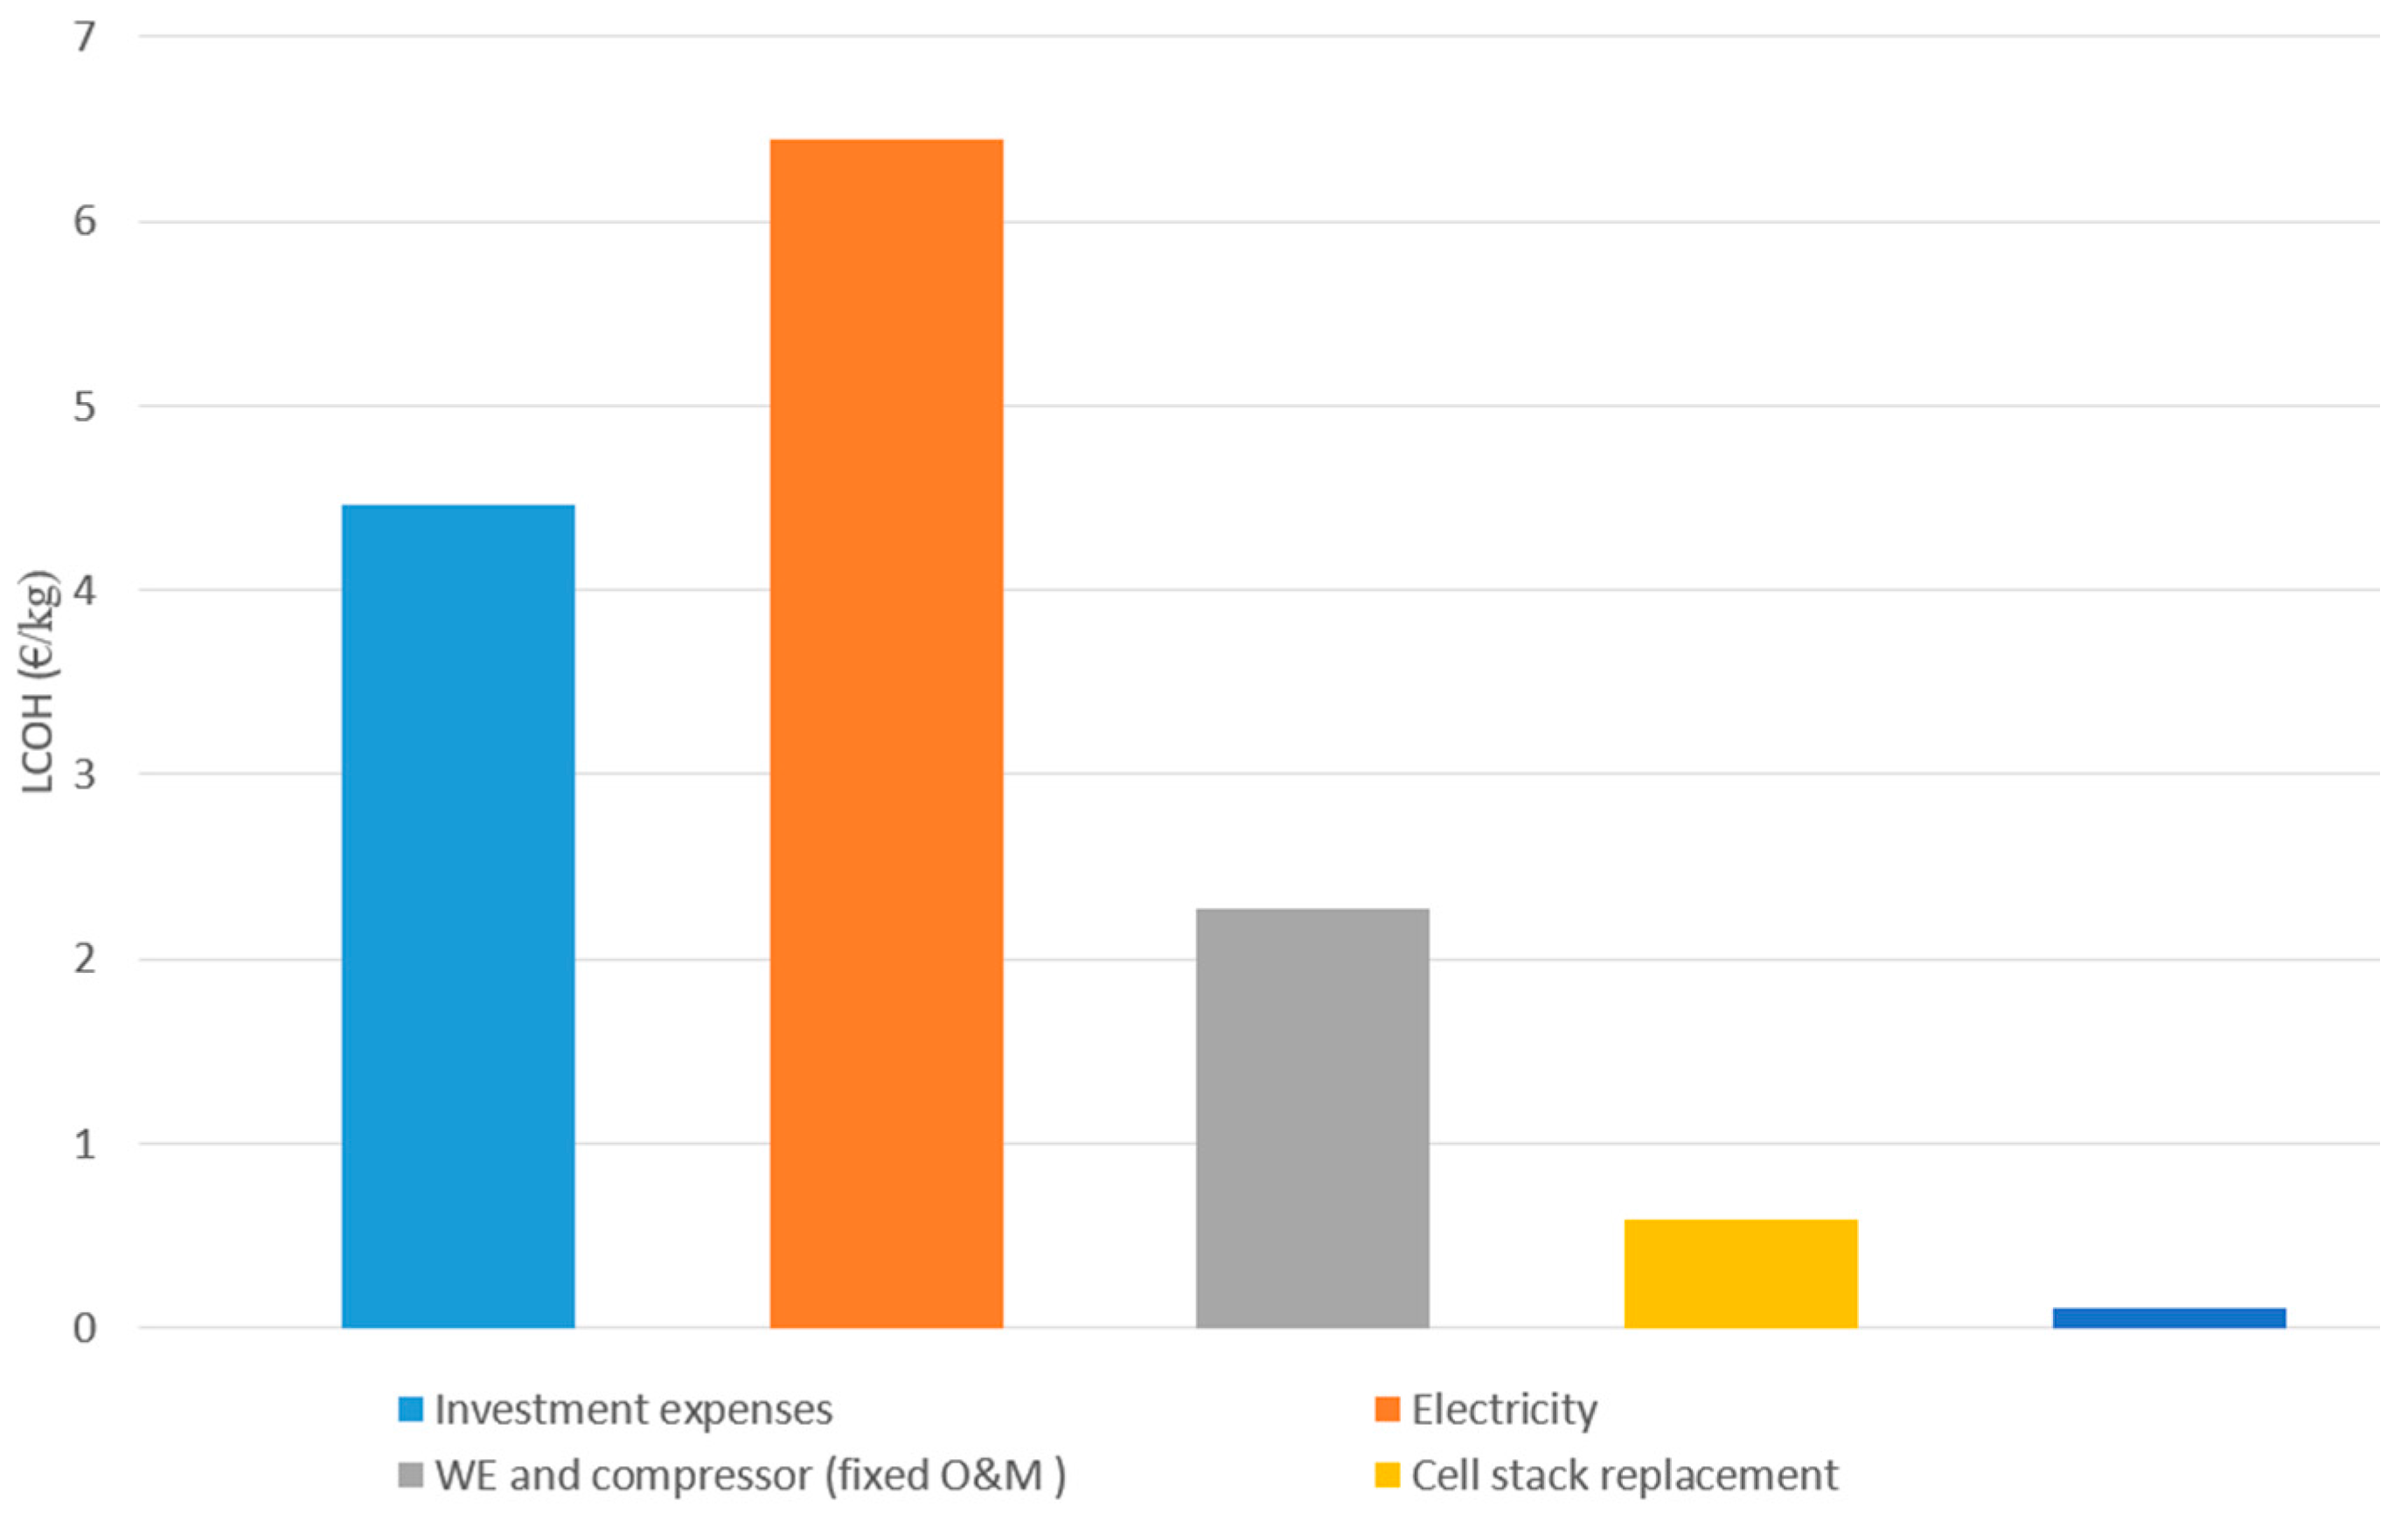
Based on the above it becomes evident that the main factor in keeping the LCOH as low as possible is maintaining operating hours at the maximum level as the LCOH could drop to approximately 12 €/kg at 95% utilization, as depicted in 
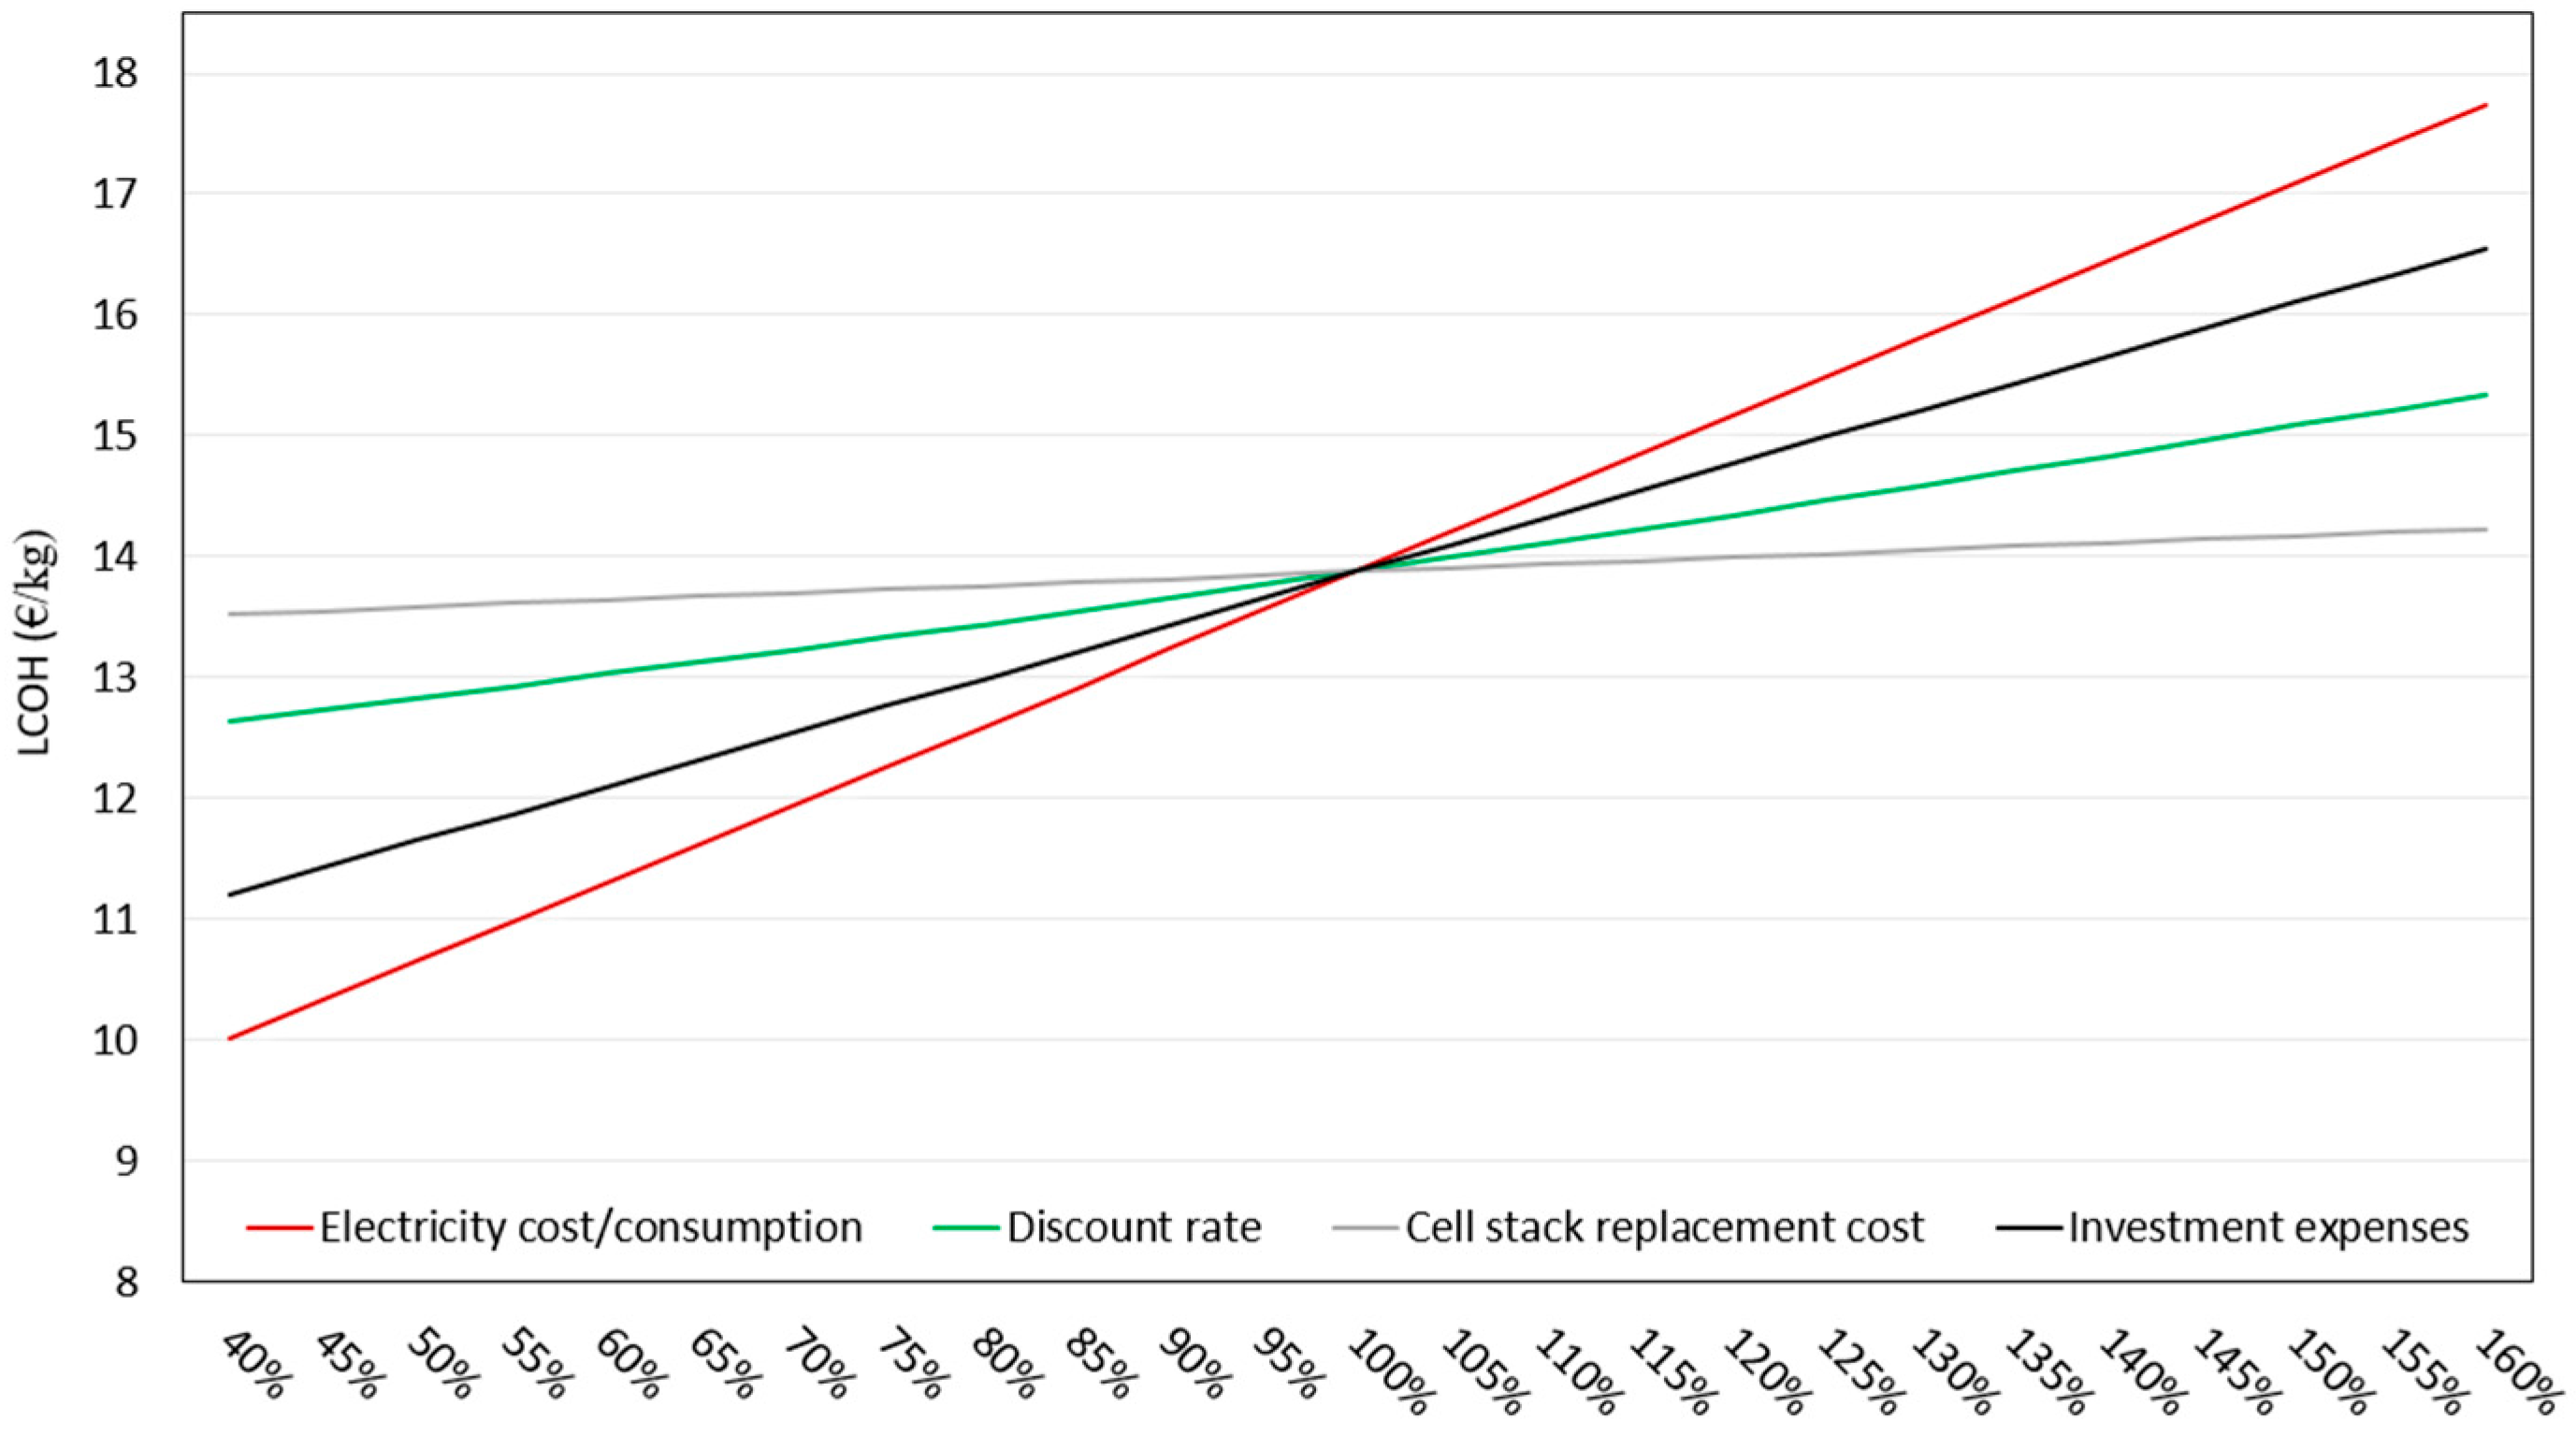
Figure 10. The second largest cost factor, which is consistent with the literature [6,16,40], is the electricity cost, as demonstrated in this study with the sensitivity analysis. Investment expenses together with replacement costs form the third important category.
The cost figures used in this study date back to the year 2011 and represent relatively high costs as DQ is a small-scale demonstration project. A larger scale commercial system could yield lower initial and running costs where WE costs tend to follow a non-linear cost curve [4,11]. The sensitivity analysis in Section 4.2 depicts the underlying potential in reducing these costs.

6. Conclusions

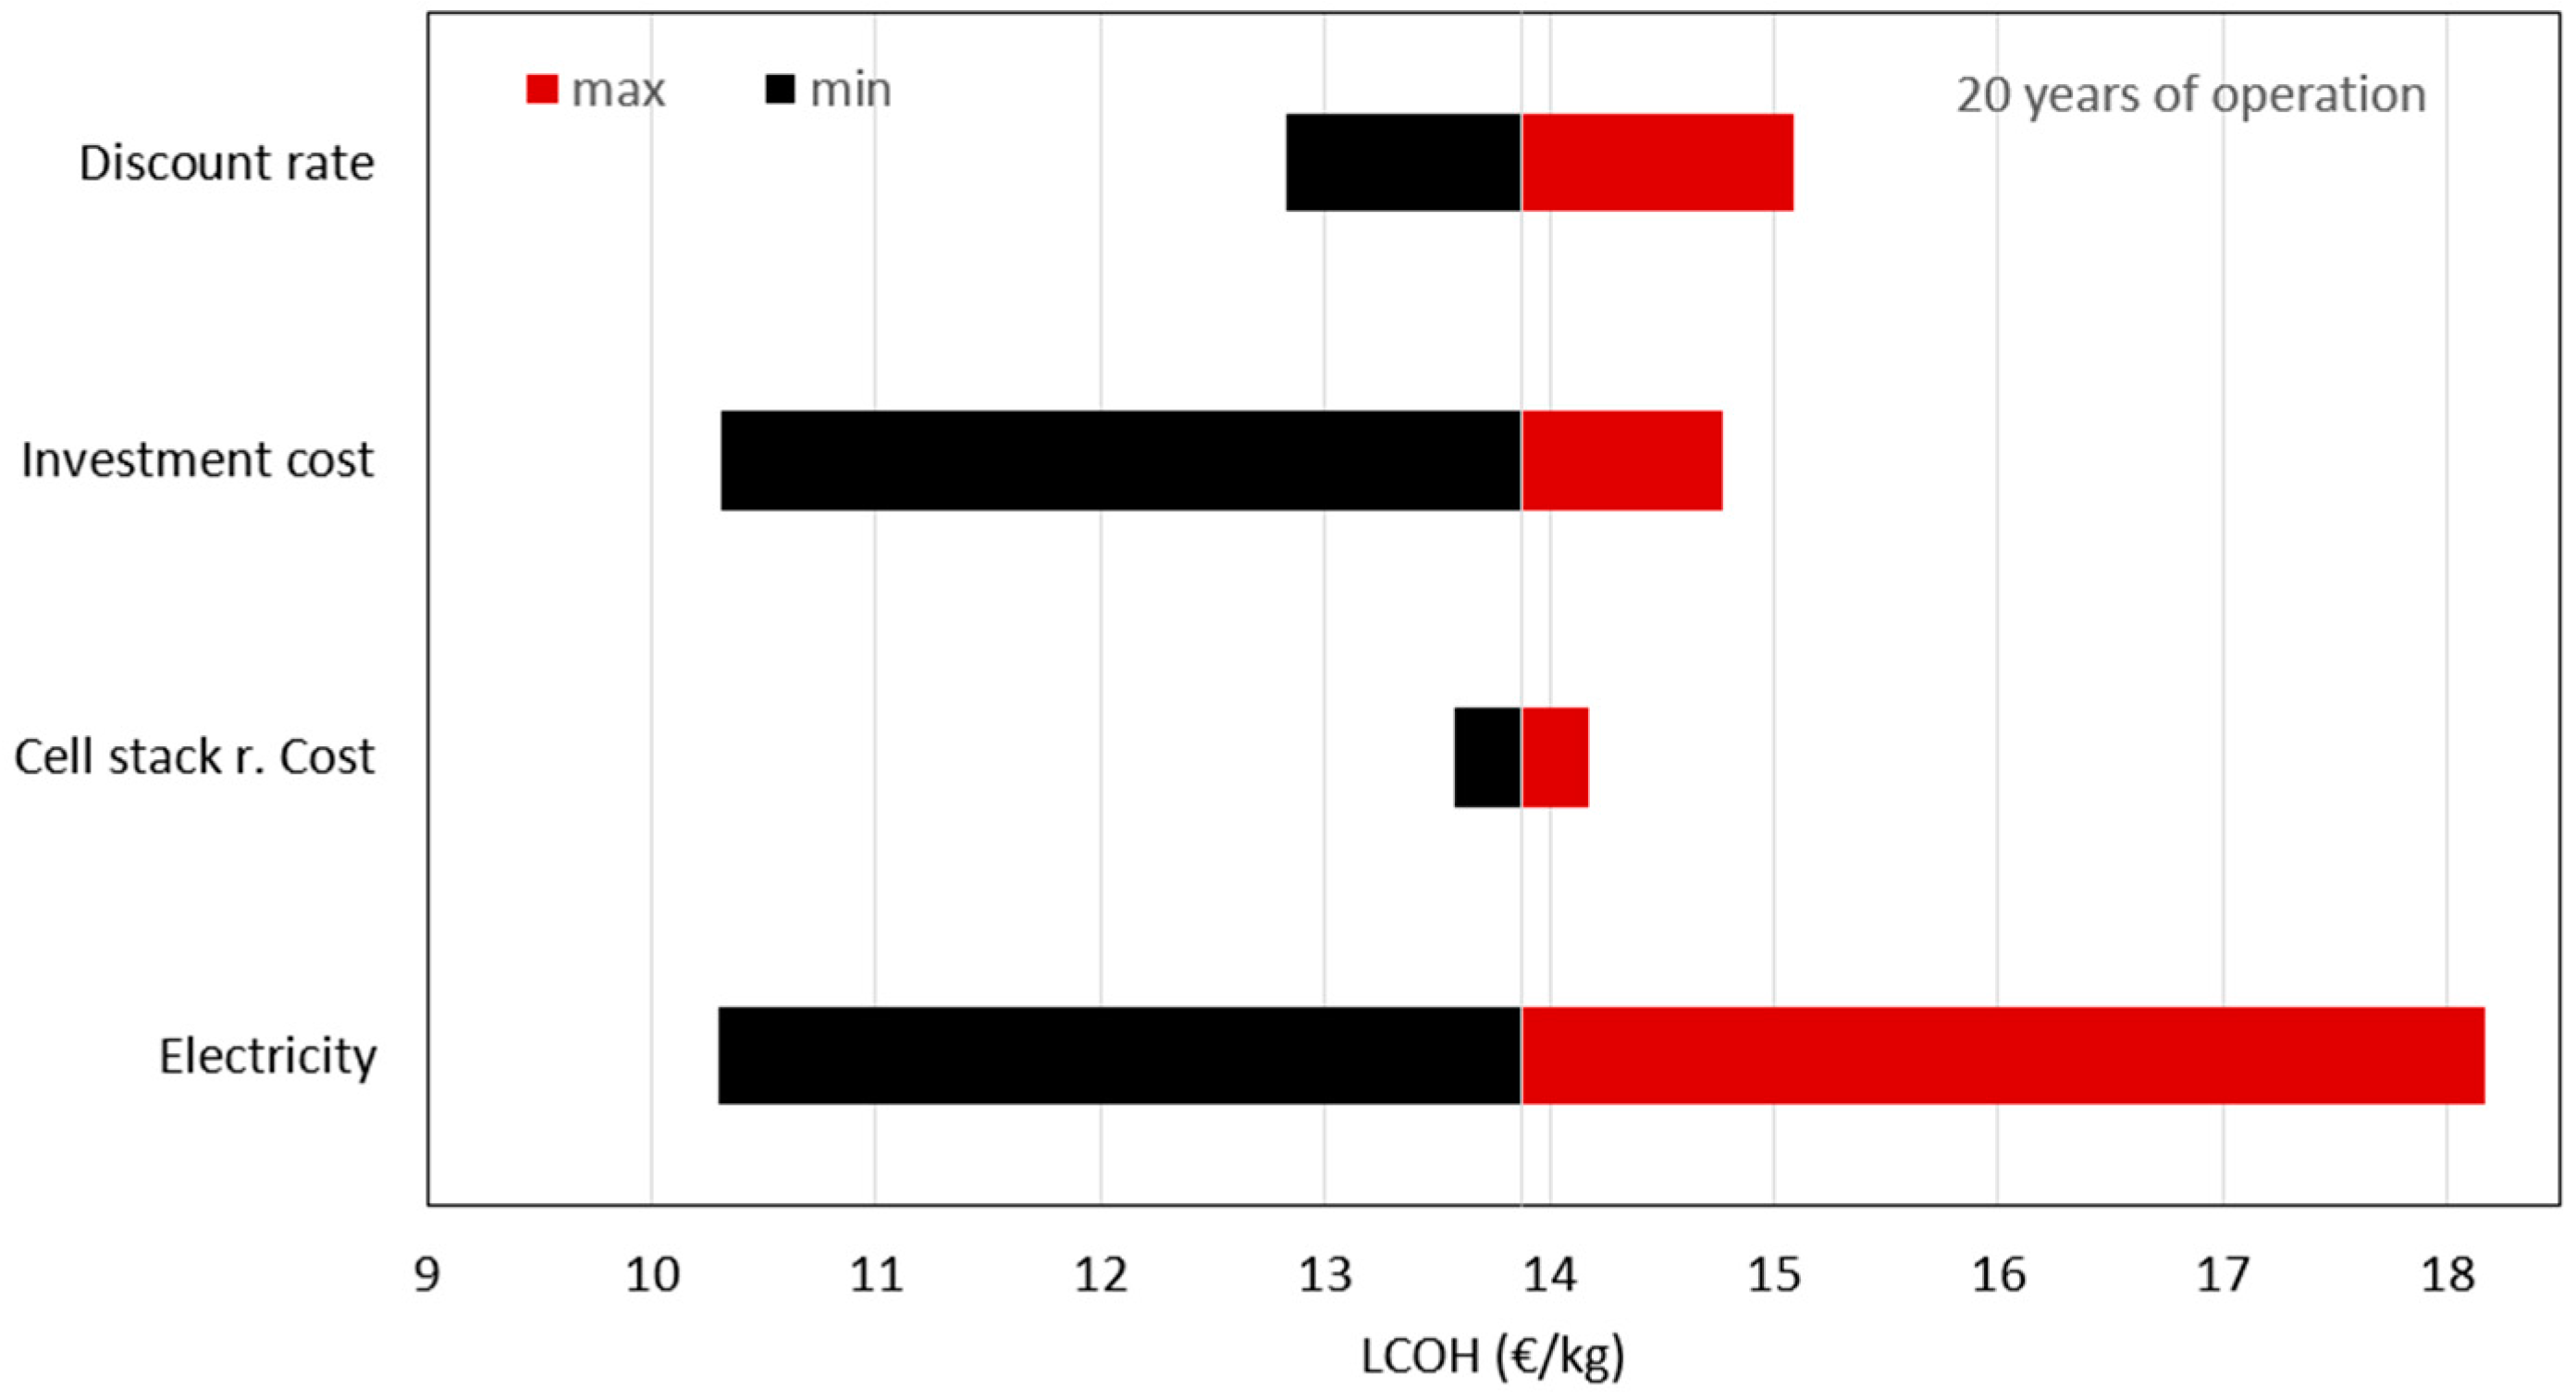
The main results showed that a LCOH of 13.9 €/kg could be reached if the operational hours are maximized. However, as seen in the sensitivity analysis, by reducing the electricity cost down to 0.04 €/kWh, the investment expenses down by −80% of the total cost and maintaining 80% operating hours a LCOH of 6.7 €/kg could be reached.
The results indicated that the critical cost factors are the electricity and investment expenses as they have the largest impact on the LCOH. As hydrogen production is evidently capital intensive and requires cheap and environmentally friendly electricity, combining the large quantity of renewables installed every year and green policies is critical to achieve the cost levels required. However, a system such as the studied DQ could, together with selected RE technologies, provide an option for a comprehensive off the grid solution even before the aimed cost competitiveness is achieved. Demand for reliable low-carbon off the grid solutions with high self-sufficiency is growing fast, and the cost requirement for competitiveness is less demanding.
Although the model and the results in this study were solely based on phase 1 of the DQ project, this study takes a small but yet important step towards the hydrogen economy by demonstrating the realistic cost of small scale hydrogen production and provides a benchmark for new hydrogen technologies.

Acknowledgments

This study was carried out as a part of the Don Quichote (DQ) project which is co-funded by the 7th Framework Programme (FP7) under the initiative of the Fuel Cell and Hydrogen Joint Undertaking (FCH JU) under grant agreement number 303411. The author would like to use the opportunity to thank the project partners for their assistance and for letting this paper become a reality. The project partners are: Hydrogenics, Colruyt, Thinkstep, TUV, Icelandic New Energy, FAST and Waterstofnet. Special thanks to Denis Thomas at Hydrogenics for the input he provided.

Author Contributions

Ludvik Viktorsson conducted the assessments and wrote the main part of the paper. Jukka Taneli Heinonen helped defining the methodology and writing the paper. Jon Bjorn Skulason provided the opportunity and assisted with data acquisition and the design of the study. Runar Unnthorsson provided comments and helped designing the study.

Conflicts of Interest

The authors declare no conflict of interest.

References

  1. Pachauri, R.K.; Meyer, L.; The Core Writing Team. Synthesis Report. Available online: http://epic-reports.awi.de/37530/1/IPCC_AR5_SYR_Final.pdf (accessed on 25 May 2017).
  2. Socolow, R.H.; Pacala, S.W. A plan to keep carbon in check. Sci. Am. 2006, 295, 50–57. [Google Scholar] [CrossRef] [PubMed]
  3. IRENA. Renewable Energy Capacity Statistics 2015. Available online: http://www.irena.org/DocumentDownloads/Publications/IRENA_RE_Capacity_Statistics_2015_slide_deck.pdf (accessed on 25 November 2016).
  4. Mazloomi, K.; Gomes, C. Hydrogen as an energy carrier: Prospects and challenges. Renew. Sustain. Energy Rev. 2012, 16, 3024–3033. [Google Scholar] [CrossRef]
  5. Sherif, S.A.; Barbir, F.; Veziroglu, T. Wind energy and the hydrogen economy-review of the technology. Sol. Energy 2005, 78, 647–660. [Google Scholar] [CrossRef]
  6. Winter, C.-J. Hydrogen energy—Abundant, efficient, clean: A debate over the energy-system-of-change. Int. J. Hydrog. Energy 2009, 34, S1–S52. [Google Scholar] [CrossRef]
  7. Midilli, A.; Ay, M.; Dincer, I.; Rosen, M. On hydrogen and hydrogen energy strategies: I: Current status and needs. Renew. Sustain. Energy Rev. 2005, 9, 255–271. [Google Scholar] [CrossRef]
  8. Stiegel, G.J.; Ramezan, M. Hydrogen from coal gasification: An economical pathway to a sustainable energy future. Int. J. Coal Geol. 2006, 65, 173–190. [Google Scholar] [CrossRef]
  9. Balat, M. Potential importance of hydrogen as a future solution to environmental and transportation problems. Int. J. Hydrog. Energy 2008, 33, 4013–4029. [Google Scholar] [CrossRef]
  10. Contreras, A.; Yiğit, S.; Özay, K.; Veziroğlu, T. Hydrogen as aviation fuel: A comparison with hydrocarbon fuels. Int. J. Hydrog. Energy 1997, 22, 1053–1060. [Google Scholar] [CrossRef]
  11. Bertuccioli, L.; Chan, A.; Hart, D.; Lehner, F.; Madden, B.; Standen, E. Development of Water Electrolysis in the European Union; Fuel Cells Hydrogen Joint Undertaking: Lausanne, Switzerland, 2014. [Google Scholar]
  12. Zakeri, B.; Syri, S. Electrical energy storage systems: A comparative life cycle cost analysis. Renew. Sustain. Energy Rev. 2015, 42, 569–596. [Google Scholar] [CrossRef]
  13. Bičáková, O.; Straka, P. Production of hydrogen from renewable resources and its effectiveness. Int. J. Hydrog. Energy 2012, 37, 11563–11578. [Google Scholar] [CrossRef]
  14. Kothari, R.; Buddhi, D.; Sawhney, R. Comparison of environmental and economic aspects of various hydrogen production methods. Renew. Sustain. Energy Rev. 2008, 12, 553–563. [Google Scholar] [CrossRef]
  15. Holladay, J.D.; Hu, J.; King, D.L.; Wang, Y. An overview of hydrogen production technologies. Catal. Today 2009, 139, 244–260. [Google Scholar] [CrossRef]
  16. Ogden, J.M. Prospects for building a hydrogen energy infrastructure. Annu. Rev. Energy Environ. 1999, 24, 227–279. [Google Scholar] [CrossRef]
  17. McDowall, W.; Eames, M. Forecasts, scenarios, visions, backcasts and roadmaps to the hydrogen economy: A review of the hydrogen futures literature. Energy Policy 2006, 34, 1236–1250. [Google Scholar] [CrossRef]
  18. Bockris, J. The hydrogen economy—An ultimate economy? Environ. Mon. 1972, 1, 29–35. [Google Scholar]
  19. Bockris, J. The origin of ideas on a hydrogen economy and its solution to the decay of the environment. Int. J. Hydrog. Energy 2002, 27, 731–740. [Google Scholar] [CrossRef]
  20. Maack, M.H.; Skulason, J.B. Implementing the hydrogen economy. J. Clean. Prod. 2006, 14, 52–64. [Google Scholar] [CrossRef]
  21. Sigfusson, T.I. Planet Hydrogen: The Taming of the Proton; Coxmoor Publishing Company: Oxford, UK, 2008. [Google Scholar]
  22. Bakker, S. The car industry and the blow-out of the hydrogen hype. Energy Policy 2010, 38, 6540–6544. [Google Scholar] [CrossRef]
  23. Lee, J.-Y.; An, S.; Cha, K.; Hur, T. Life cycle environmental and economic analyses of a hydrogen station with wind energy. Int. J. Hydrog. Energy 2010, 35, 2213–2225. [Google Scholar] [CrossRef]
  24. Lee, J.-Y.; Yoo, M.; Cha, K.; Lim, T.W.; Hur, T. Life cycle cost analysis to examine the economical feasibility of hydrogen as an alternative fuel. Int. J. Hydrog. Energy 2009, 3, 4243–4255. [Google Scholar] [CrossRef]
  25. Greiner, C.J.; KorpÅs, M.; Holen, A.T. A Norwegian case study on the production of hydrogen from wind power. Int. J. Hydrog. Energy 2007, 32, 1500–1507. [Google Scholar] [CrossRef]
  26. Khan, M.; Iqbal, M. Pre-feasibility study of stand-alone hybrid energy systems for applications in Newfoundland. Renew. Energy 2005, 30, 835–854. [Google Scholar] [CrossRef]
  27. Zoulias, E.; Lymberopoulos, N. Techno-economic analysis of the integration of hydrogen energy technologies in renewable energy-based stand-alone power systems. Renew. Energy 2007, 32, 680–696. [Google Scholar] [CrossRef]
  28. Hessami, M.-A.; Campbell, H.; Sanguinetti, C. A feasibility study of hybrid wind power systems for remote communities. Energy Policy 2011, 39, 877–886. [Google Scholar] [CrossRef]
  29. Gökçek, M. Hydrogen generation from small-scale wind-powered electrolysis system in different power matching modes. Int. J. Hydrog. Energy 2010, 35, 10050–10059. [Google Scholar] [CrossRef]
  30. Gahleitner, G. Hydrogen from renewable electricity: An international review of power-to-gas pilot plants for stationary applications. Int. J. Hydrog. Energy 2013, 38, 2039–2061. [Google Scholar] [CrossRef]
  31. Fabrycky, W.J.; Blanchard, B.S. Life-Cycle Cost and Economic Analysis; Prentice Hall: Bergen, NJ, USA, 1991. [Google Scholar]
  32. Woodward, D.G. Life cycle costing—Theory, information acquisition and application. Int. J. Proj. Manag. 1997, 15, 335–344. [Google Scholar] [CrossRef]
  33. Harvey, G. Life-cycle costing: A review of the technique. Manag. Account. 1976, 54, 343–347. [Google Scholar]
  34. IRENA Secretariat. Renewable Energy Technologies: Cost Analysis Series. Available online: https://www.irena.org/DocumentDownloads/Publications/RE_Technologies_Cost_Analysis-WIND_POWER.pdf (accessed on 25 November 2016).
  35. Thomas, D.; Mertens, D.; Meeus, M.; Van der Laak W, F.I. Roadmaps for Economic Challenges: Power-to-Gas Roadmap for Flanders. Available online: http://www.power-to-gas.be/final-report (accessed on 25 May 2017).
  36. Linnemann, J.; Steinberger-Wilckens, R. Realistic costs of wind-hydrogen vehicle fuel production. Int. J. Hydrog. Energy 2007, 32, 1492–1499. [Google Scholar] [CrossRef]
  37. Electricity Prices by Type of User: Medium Sized Industries. Available online: http://ec.europa.eu/eurostat/tgm/refreshTableAction.do?tab=table&plugin=1&pcode=ten00117&language=en (accessed on 26 March 2016).
  38. Gerdesmeier, D. Price Stability: Why Is It Important to You? Available online: https://www.ecb.europa.eu/pub/pdf/other/whypricestability_en.pdf (accessed on 25 May 2017).
  39. Ammermann, H.; Hoff, D.P.; Atanasiu, M.; Ayllor, J.; Kaufmann, M.; Tisler, O. Advancing Europe’s Energy Systems: Stationary Fuel Cells in Distributed Generation. Available online: http://www.fch.europa.eu/sites/default/files/FCHJU_FuelCellDistributedGenerationCommercialization_0.pdf (accessed on 25 May 2017).
  40. Levene, J.I.; Mann, M.K.; Margolis, R.M.; Milbrandt, A. An analysis of hydrogen production from renewable electricity sources. Sol. Energy 2007, 81, 773–780. [Google Scholar] [CrossRef]
Figure 1. System boundary.
Energies 10 00763 g001
Figure 2. The Don Quichote station in Halle.
Energies 10 00763 g002
Figure 3. Investment expense share from phase 1.
Energies 10 00763 g003
Figure 4. Monthly electricity consumption of the complete station in 2014.
Energies 10 00763 g004
Figure 5. Monthly water consumption of the complete station in 2014.
Energies 10 00763 g005
Figure 6. Monthly hydrogen production in 2014.
Energies 10 00763 g006
Figure 7. LCOH in terms of individual factors for a 20 year lifetime.
Energies 10 00763 g007
Figure 8. Sensitivity star for 20 years’ lifetime at 80% operating hours.
Energies 10 00763 g008
Figure 9. Sensitivity analysis for 20 years of lifetime.
Energies 10 00763 g009
Figure 10. Effects on the LCOH with different operating hours.
Energies 10 00763 g010
Table 1. Investment expenses without VAT.
Cost FactorSizeTotal Cost (€)
Electrolyzer~156 kW422,760
Compressor450 bar216,000
H2 storage50 kg (450 bar)157,500
1 × Dispenser350 bar218,000
Integration-41,800
CE certification-8000
Civil work-75,000
Permits-14,000
Total1,153,060
Table 2. Fixed annual operational expenses.
Cost FactorValue
Service contract/spear and wear7.1% of WE investment expenses
Compressor maintenance6% of compressor investment expenses
Cell stack change (2 × 15 N m3/h)60,600 €/stack change
Table 3. Variable operational expenses.
Cost FactorCost/Unit
Water cost 4.9 €/m3
Electricity cost 0.09 €/kWh
Table 4. Summary of the field data for phase 1 based on one year dataset.
ParameterNumerical Value
Electricity consumption~71.6 kWh/kg
Annual H2 production~1111 kg
Availability/annum~8322 h
Water consumption~0.023 m3/kg
Max potential daily H2 production~65 kg/day
Table 5. Values of selected design variables for the selected utilization (18,896 kg/year).
Cost FactorCost/UnitAnnual Cost
Water cost 4.9 €/m3~2120 €
Electricity cost 0.09 €/kWh~121,717 €
Service contract/spear and wear7.1% of WE investment expenses~30,011 €
Compressor maintenance6% of compressor investment expenses~12,931 €
Cell stack change (2 × 15 Nm3/h)60,600 €/stack change-
Table 6. Summary of the main LCC results.
Lifetime101520
LCOH (€/kg)16.614.713.9
Table 7. Results and assumptions from selected studies.
ReferenceWE SizeAnnual Load HoursElectricity CostLCOH
[36]~305 kW40000.091 €/kWh~27.5 €/kg 1
[36]~297 MW65000.091 €/kWh~11.4 €/kg 1
[25]~1.1 MW--2.8 €/kg
[25]~2.2 MW--6.2 €/kg
Current study~156 kW70080.09 €/kWh13.9 €/kg
1 Values converted by authors based on ~39.4 kWh/kg (HHV H2).

