Article

Comparison of Liquid Water Dynamics in Bent Gas Channels of a Polymer Electrolyte Membrane Fuel Cell with Different Channel Cross Sections in a Channel Flooding Situation

1
Department of Mechanical and Automotive Engineering, Kongju National University, 1223-24 Cheonan Daero, Seobuk-gu, Cheonan, Chungnam 31080, Korea
2
School of Mechanical and Automotive Engineering, Kyungil University, 50 Gamasil-gil, Hayang-eup, Gyeongsan, Gyeongbuk 38428, Korea
*
Author to whom correspondence should be addressed.
Energies 2017, 10(6), 748; https://doi.org/10.3390/en10060748
Submission received: 7 April 2017 / Revised: 15 May 2017 / Accepted: 19 May 2017 / Published: 26 May 2017
(This article belongs to the Section L: Energy Sources)

Abstract

:
The transport characteristics of water slugs in a bent gas channel of a polymer electrolyte membrane (PEM) fuel cell are numerically studied using the volume of fluid (VOF) method. To investigate the effects of channel cross-sectional shape in a channel flooding situation, the gas channels (GCs) with one rectangular and two trapezoidal cross sections are compared. Parametric studies are also conducted to evaluate the effects of the contact angle of the top and side walls, the contact angle of the gas diffusion layer (GDL) surface, and the air inlet velocity. Considering both of the water volume fraction (WVF) and GDL water coverage ratio (WCR), the trapezoidal channel with open angles of 60 degrees provides the most favorable performance in a channel flooding condition. Among all the top and side wall contact angles considered, the hydrophobic contact angle of 120 degrees shows the best results. Among the three GDL contact angles of 90, 110 and 140 degrees, the hydrophobic GDL contact angle of 140 degrees provides the most favorable water removal characteristics in a channel flooding situation. For all cross-sectional shapes, the water removal rate increases and the liquid water interface shows more complex patterns as the air inlet velocity increases.

1. Introduction

The polymer electrolyte membrane (PEM) fuel cell has received considerable attention due to its many advantages, including zero/low emissions, high power density, low operating temperature, and a broad range of applications [1,2,3,4,5,6,7,8]. The PEM fuel cell generates electricity and by-product water through the electrochemical reaction of hydrogen and oxygen. For the best performance, the water content level inside the PEM fuel cell must be controlled properly. The level of membrane hydration needs to be in a suitable range and the cathode reaction sites must be cleared of water to contact sufficient amounts of reactants. While the membrane dehydration can cause performance degradation and material damage, excess water in the gas channel (GC) results in the so-called water flooding phenomena which has a negative effect on the performance of the fuel cell. In automotive vehicle applications of PEM fuel cells where the demand for high current density is frequent, water flooding is a critical issue. Therefore, the water removal in the GC is one of the most important issues in PEM fuel cell studies, especially in a GC flooding condition [1,2,3].
Many experimental methods have been applied to study the liquid water dynamics in the GCs and gas diffusion layers (GDLs) of PEM fuel cells. The two-phase pressure drop measurement in the GCs can be used to diagnose the effectiveness of water management [2,4,5]. Grimm et al. proposed flow pattern transition criteria (slug-film and film-mist) and developed a new variable water flow rate pressure drop model having mean error less than 14% [5]. A number of fuel cell visualization techniques can show the quantitative and qualitative behaviors of the liquid water [2]. Based on the experimental studies, the observed two-phase flow patterns correspond to one of the mist flow, droplet flow, film flow, and slug flow at different fuel cell operating conditions [2]. To compensate the shortcomings of the experimental studies, a large number of numerical simulations have also been performed. Anderson et al. critically reviewed the two-phase flow models applied to micro-channels in PEM fuel cell applications together with the experimental studies [2]. Recently, Ferreira et al. extensively reviewed the volume of fluid (VOF) numerical simulations of two-phase flow in PEM fuel cells [7]. These numerical simulations can be classified as one of the following categories; a study on the behavior of liquid water initially in the GCs or emerging uniformly from the GDL surfaces, a study on the droplet development behavior emerging from micro pores on the GDL surfaces, a study on the effect of the GDL microstructure, a study on the impact of the two-phase flow in the fuel cell performance, and a study on novel GDL/GC designs [7].
Among many factors affecting the water transport characteristics in the GCs, the design of cross-sectional geometry is also found to be important based on experimental and numerical investigations [8,9,10,11,12,13,14]. Applying the neutron radiography method to operating PEM fuel cells, Owejan et al. [8] compared the volume of accumulated water in the GCs between rectangular and triangular cross-sectional geometries. At the same experimental conditions, the triangular channels retain less water and smaller droplets than the rectangular channels. Zhu et al. [9] studied the sensitivity of liquid water behavior to the cross-sectional geometry of the cathode GC in low-temperature fuel cells via the VOF simulations. Numerical investigation was performed for the six different shapes of cross section including triangle, semicircle, trapezoid, upside-down trapezoid, rectangle with variable aspect ratio, and rectangle with a curved bottom wall. Their results showed that the GC geometry has considerable effects on the detachment time, detachment diameter, and the removal time of water droplet as well as the coverage ratio and water saturation. Manso et al. [10] reviewed the influence of the GC geometric parameters including cross-sectional shape, channel and rib width, channel depth, and height to width ratio on the performance of a PEM fuel cell. Rath and Kandlikar [11] applied the Concus-Finn condition [15] to determine either fill or not-fill conditions at the lower corner of a trapezoidal GC at a microscopic level. For typical GDL and hydrophilic channel wall surfaces commonly used in fuel cells, the results suggested that the optimal open angle of a trapezoidal GC to promote water removal is less than about 52° not to fill the corner with water. Lu et al. studied the effects of channel cross-sectional geometry, surface wettability, and orientation on the two-phase flow characteristics [12]. Among the three cross-sectional geometries, sinusoidal channels showed a favorable film flow pattern and lower pressure drop than trapezoidal and rectangular channels. To investigate the effect of GDL materials and different trapezoidal open angles, Gopalan and Kandlikar [13] developed models to predict the minimum velocity required to remove droplet from channel and the pressure drop criteria to eliminate the droplet for both corner filling and non-filling cases. Further, Shah and Kandlikar [14] studied water droplet and side wall interactions with and without transverse micro-grooves on the side walls in a trapezoidal GC with 50° open angle. The micro-grooves relieved water blockage at the channel exit by introducing a wetting regime.
In addition to the geometry of the GCs, the effect of GDL and channel wall wettability is critical to the two-phase flow patterns [16,17,18,19,20,21]. Turhan et al. [16] investigated the effect of channel wall wettability on through-plane liquid water distribution in a PEM fuel cell via high resolution neutron imaging. On hydrophobic channel surfaces, discrete liquid droplets were formed and removed quickly whereas hydrophilic channel walls enhanced the liquid suction from under-the-land locations and the resulting film layer on the walls promoted steadier operation. However, the film layer on the hydrophilic surface was more difficult to purge. Ding et al. [17] performed three-dimensional numerical simulations to study the effect of the GDL surface microstructure on the two-phase flow patterns. For the given GC geometry, the results suggested that more hydrophilic channel walls and a more hydrophobic GDL surface would be favorable to move the liquid water from the GDL surface to the channel walls. Lu et al. [12] conducted ex situ experiments to investigate the effects of the three different kinds of surface wettability (hydrophilically coated, uncoated, and hydrophobically coated channel surfaces). In the flow pattern map, the slug-film transition line observed to move to a lower air superficial velocity for the hydrophilic channel. Thus, the hydrophilically coated GCs favor film flow patterns compared to the uncoated and the hydrophobic GCs. In addition, the pressure drop factor which is the normalized mean pressure drop at each superficial water velocity with respect to the corresponding dry air pressure drop was compared for the three different kinds of channel wettability and the two water flow rates. At the lower water flow rate, hydrophilic channels showed a lower pressure drop factor than uncoated or hydrophobic channels. However, hydrophilic channels showed a higher pressure drop factor at the higher water flow rate which corresponded to water film flow regime. For the hydrophilic channel, the surface contact angle is small enough to meet the Concus-Finn condition and liquid water filled the top corner along the channel. Therefore, the hydrophilic channel may result in a higher pressure drop at higher water flow rates although film flow patterns induced by the hydrophilic channel provide stable water and air flow distribution. Lorenzini-Gutierrez et al. [18] studied the effects of channel cross-sectional geometry, channel surface wettability, and superficial air velocity on the liquid water film and slug flow features in straight GCs with the five different shapes of channel cross section. To find a suitable balance between a hydrophobic surface which reduces the surface tension forces and a hydrophilic surface which promotes top wall film flow and a clear GDL surface, a range of hydrophilic contact angles for the top and side channel walls were compared together with a fixed hydrophobic GDL surface contact angle of 140°. The range of contact angles between 60° and 65° was found to provide the formation of stable top wall films and a fair removal rate of liquid structures for the GC with the rectangular cross section. In regard to the GC cross-sectional geometry, the trapezoidal cross section with open angles of 50° and 60° showed a more favorable water removal characteristics compared to the rectangular, semicircular, trapezoidal open angle of 40° geometries. Jo and Kim investigated the effect of the water inlet pore location on the GDL surface in the bent GC of a PEM fuel cell [19]. Although the two-phase flow patterns were different depending on the locations of water inlet pore, the GDL surface water coverage ratio (WCR) increased and the water volume fraction (WVF) decreased as the contact angle of the top and side walls increased. Here, the WCR is defined as the ratio of the surface area covered by water to the total surface area of interest. The WVF is defined as the ratio of the volume occupied by the liquid water to the total spatial volume of interest. Flipo et al. conducted an ex situ PEM fuel cell GC experiment to study the effect of surface wettability on the liquid water dynamics [20]. On the contrary to the previous researches, the results suggested that the wettability effect was so unclear for flow rates representative of a fuel cell application due to a lack of reproducibility.
In this paper, the behavior of liquid water slug and film flow inside the three-dimensional bent GCs with the three different channel cross sections is studied to understand the water removal mechanism in a channel flooding situation. Parametric studies are conducted to evaluate the effects of the contact angle of the top and side walls, the contact angle of the GDL surface, and the air inlet velocity. The temporal evolution of gas-liquid interface, the WVF, and the WCR of the GDL surface are presented to describe the slug and film flow characteristics inside the bent GCs. Although Lorenzini-Gutierrez et al. investigated the effects of channel cross-sectional geometry [18], only the straight GC geometry was considered and the effect of channel surface wettability was studied only for the rectangular cross-sectional geometry. In contrast, this work investigates on how the presence of the corner section in the bent GCs can affect the liquid water removal characteristics by inspecting a control volume located in the corner section of GCs. Moreover, the effect of the top and side wall contact angle is investigated for the two trapezoidal cross sections in addition to the rectangular cross section. The effect of the GDL surface contact angle is also discussed for the bent GCs with the three channel cross sections.

2. Model Formulation

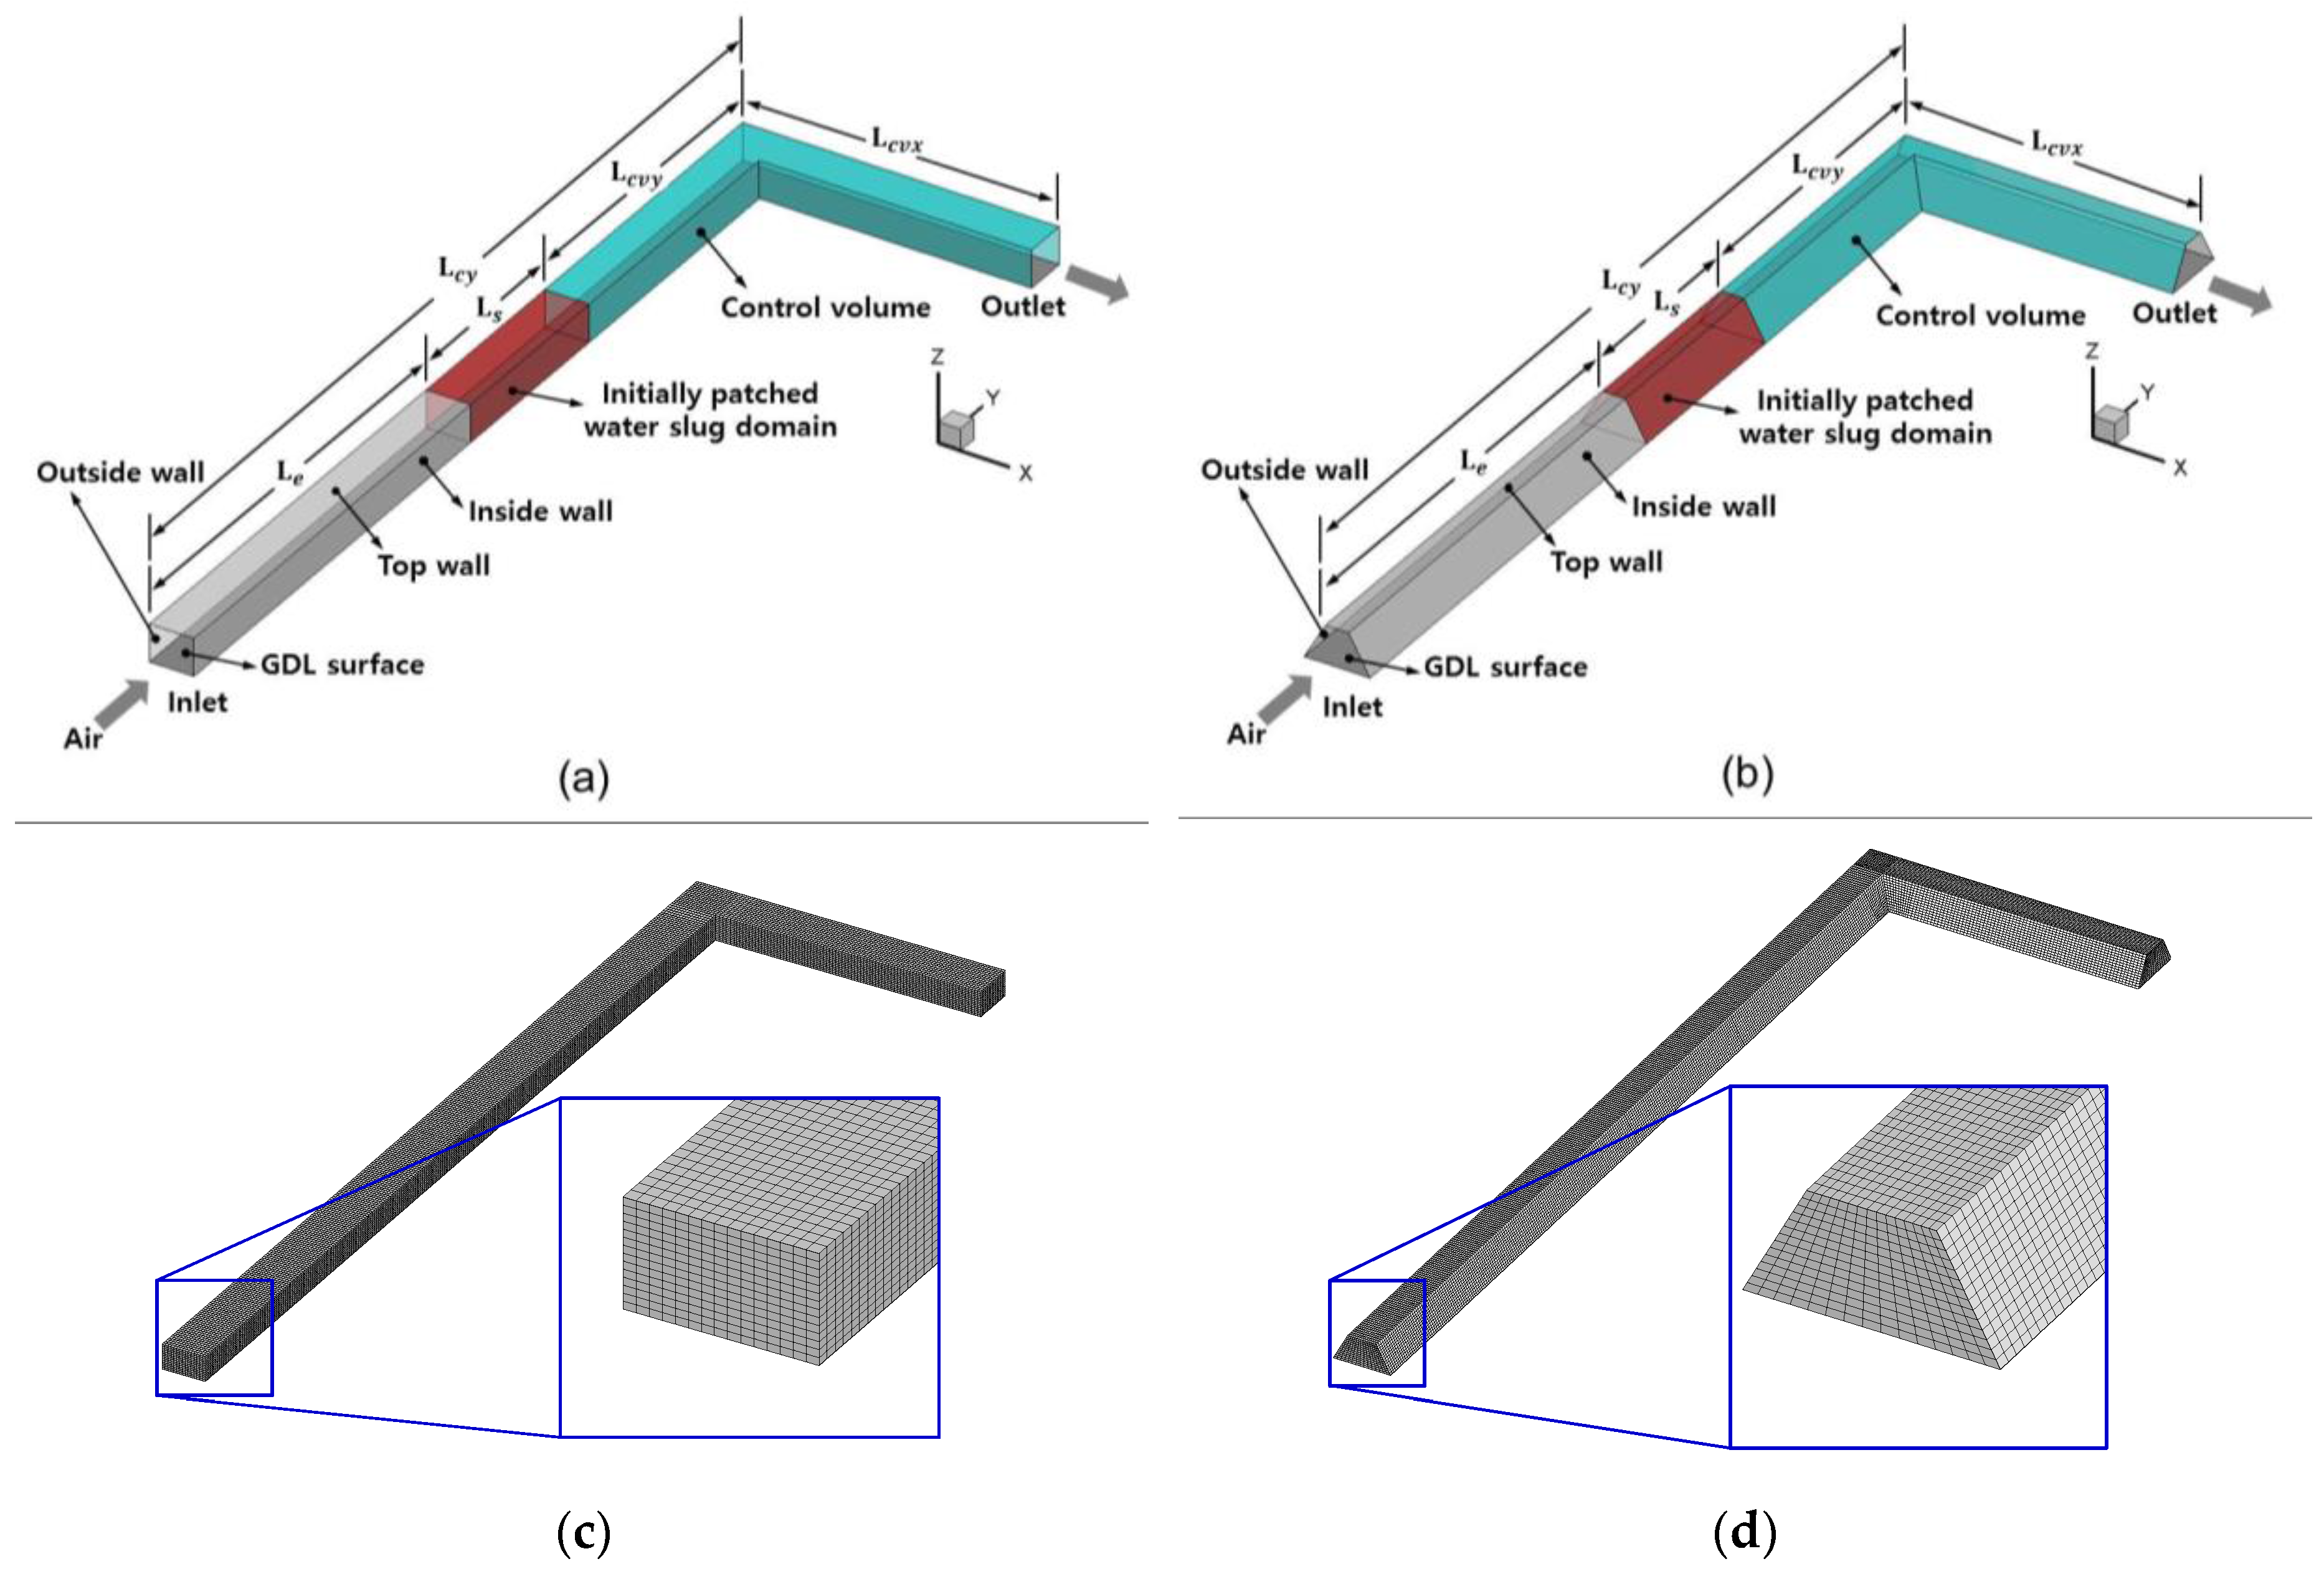
2.1. Computational Domain

Though the number of different GC geometric configurations is increasing, the most common flow channel configurations are a serpentine flow field channel, a straight parallel flow field channel, an interdigitated flow field channel, a pin or mesh flow field, and a cascade flow field [10]. Usually, liquid water in the GCs passes through a complex combinations of straight and bent channel sections as shown in [10] (p. 15261). To understand the extremely complex interactions of liquid water with the channel wall, edge, and corner sections, the three dimensional computational domains of three different bent GCs with a rectangular and two trapezoidal channel cross sections are considered in this paper. In Figure 1a, the rectangular channel cross section (REC configuration) has a width of 0.7 mm and a height of 0.4 mm. This channel geometry is proposed by Owejan et al. to meet the enhanced performance targets of the United States Department of Energy for automotive fuel cells [18,21]. An entrance length of L e = 7   mm is used to allow the incoming air flow from the inlet to form a fully developed velocity profile before interacting with an initially patched liquid water slug with a length of L s = 3   mm . To analyze the liquid water removal characteristics, a control volume with the size of L c v x × L c v y ( = 5   mm × 5   mm ) is defined. In addition to the rectangular channel, the trapezoidal channels are considered following the several investigations which paid attention to the merits of the trapezoidal cross-sectional shape for a PEM fuel cell GC [11,12,13,14,18]. In Figure 1b, the two trapezoidal channels with open angles of 50° (T50 configuration) and 60° (T60 configuration) have the same geometric dimensions as Figure 1a except the cross-sectional shape which has the same cross-sectional area and height of the rectangular channel. Structured meshes with 80,850 hexahedral computational cells are used for all the three configurations in Figure 1c,d.
The grid dependency test was performed for the three levels of grid resolutions, 10   ×   11, 15   ×   14, and 19   ×   18 for the channel cross section with the corresponding resolution adjustment along the channel length. The simulation results showed that two finer meshes provided very similar computed gas-liquid interfaces and two-phase pressure drops, as observed in the previous study for similar simulation conditions [18]. Considering both the accuracy and efficiency of the calculation, the medium grid resolution is adopted in the present study. The GC width and height have 15 and 14 mesh elements, respectively.

2.2. Numerical Method

In this study, the fluid flow in the bent GCs is assumed to be three-dimensional, unsteady, isothermal, and laminar. The Reynolds number based on air density, air viscosity, channel height, and the maximum air inlet velocity is calculated as 137 which value is in the laminar flow regime. The fluid properties and surface tension are assumed to be constant. Also, condensation and evaporation effects of liquid water inside the GCs are assumed to be negligible during the simulation period. The VOF method is employed to calculate the position of the interface between the two immiscible fluids by applying a surface tracking technique on a fixed Eulerian mesh [19,22]. The volume fraction of the qth fluid in the computational cell, α q , is the main variable used in the VOF method. When the computational cell is empty of the qth fluid, the corresponding volume fraction is zero. When the computational cell is full of the qth fluid, the corresponding volume fraction is one. Because only the two fluids are considered, the gas and liquid phases are denoted by q = 1 and q = 2, respectively. The interface between the phases is tracked by solving the following continuity equation for α 2 in every computational cell:
t ( α 2 ρ 2 ) + · ( α 2 ρ 2 u 2 ) = 0
Here, ρ 2 and u 2 are the density and the velocity vector, respectively, of the liquid phase. The volume fraction of the gas phase is computed based on the following constraint:
α 1 + α 2 = 1
Momentum conservation is given by:
t ( ρ u ) + · ( ρ u u ) = p + · [ μ ( u + u T ) ] + ρ g + F
where p is the static pressure, g is the gravitational acceleration vector, and F is a momentum source term related to surface tension. The density and dynamic viscosity of the mixture are given by:
ρ = α 1 ρ 1 + α 2 ρ 2
μ = α 1 μ 1 + α 2 μ 2
The velocity vector of the mixture is defined as:
u = α 1 ρ 1 u 1 + α 2 ρ 2 u 2 α 1 ρ 1 + α 2 ρ 2
The surface tension effect is accounted for by the continuum surface force (CSF) model [23] which adds an extra source term to the momentum equation:
F = σ κ 2 ρ α 2 ( 1 / 2 ) ( ρ 1 + ρ 2 )
where σ is the surface tension coefficient and κ 2 is the surface curvature of the gas-liquid interface:
κ 2 = · n 2
Here, the unit normal vector, n 2 , is computed from local gradients in the surface normal at the gas-liquid interface as:
n 2 = α 2 | α 2 |
Near the solid wall surface, wall adhesion effects are taken into account by matching the curvature of the gas-liquid interface to the prescribed surface contact angle. The gas-liquid interface shape is represented using the geometric reconstruction scheme which calculates the interface using a piecewise-linear approach [24].
The governing equations are implemented into the commercial CFD software package, ANSYS FLUENT 14.0 (ANSYS, Inc., Canonsburg, PA 15317, USA, http://www.ansys.com) which is based on the finite volume method [22]. In the transient formulation, the first order implicit scheme is used and the pressure-velocity coupling is treated by the pressure-implicit with splitting of operators (PISO) scheme. The least squares cell based, pressure staggering option (PRESTO), and second order upwind schemes are adopted for the spatial discretization of gradient terms, pressure equation, and momentum equations respectively. In the multiphase model, air and liquid water are considered as the primary and the secondary phases respectively. The surface tension coefficient between the air and liquid water is held as a constant [19,22]. The explicit scheme is adopted for the VOF method with the maximum allowed a Courant number of 0.25 near the gas-liquid interface. A fixed time step size of 10−6 s is used throughout all the simulation cases.

2.3. Boundary and Operating Conditions

The proper boundary conditions are specified at all the external surfaces of the computational domain in Figure 1. At the channel inlet, the air is supplied with the uniform velocity profile at a prescribed constant speed. The boundary layer is developed near the channel walls as the air flow approaches the water slug located inside the GCs. A constant pressure outflow condition is used at the channel outlet. On all the walls of the channel, the no-slip velocity boundary condition is imposed and the static contact angle is specified. The contact angle ( θ ) is defined as the geometric angle between the liquid-gas interface and liquid-solid interface at the wall where gas, liquid, and solid intersect.
In the GCs of an operating PEM fuel cell, liquid water is formed through condensation or water emergence through the GDL surfaces. The water accumulation time may vary from minutes to hours depending on current density and other operating conditions [18]. Therefore, it is a very time consuming task to numerically reproduce a realistic water flooding situation in the GC with the time step in the order of 10−6 s. Moreover, very complex water flooding patterns may complicate the analysis of the interactions of liquid water and the bent channel walls and corners. To assess the slug and film flow characteristics, an alternative simulation technique is adopted following Lorenzini-Gutierrez et al. [18]. The calculations are performed in the following three steps. In the first step, a water slug domain is filled with liquid water and the corresponding contact angles are specified on each boundary wall surfaces. In the second step, the simulation is started without the air flow through the inlet until the liquid water slug forms the prescribed contact angles with each boundary wall surfaces. In the third step, the main calculation is started after the incoming air flow boundary condition is turned on. As the simulation proceeds, the air flow field interacts with the liquid water slug and induces the complex liquid water dynamics in the bent GC.
All the simulations are performed at a temperature of 298 K and a pressure of 1 bar. The air inlet velocity ( V i n , a i r ) is varied in the range of 1.0–5.0 m s−1. The GDL surface contact angle ( θ g ) is varied in the range of 90°–140° based on the previous studies [4,13,25,26]. The contact angle at the top and side wall surfaces ( θ t s ) is varied in the range of 45°–120°. The baseline case simulation conditions are V i n , a i r = 2.5 m s−1, θ g = 140°, and θ t s = 65°. In the simulation of slug and film flow in a straight GC, Lorenzini-Gutierrez et al. selected 2.5 m s−1 as a base V i n , a i r for a 3 mm long water slug because of the stable formation of film flows in the upper edges and a relatively fast GDL clearance process [18].

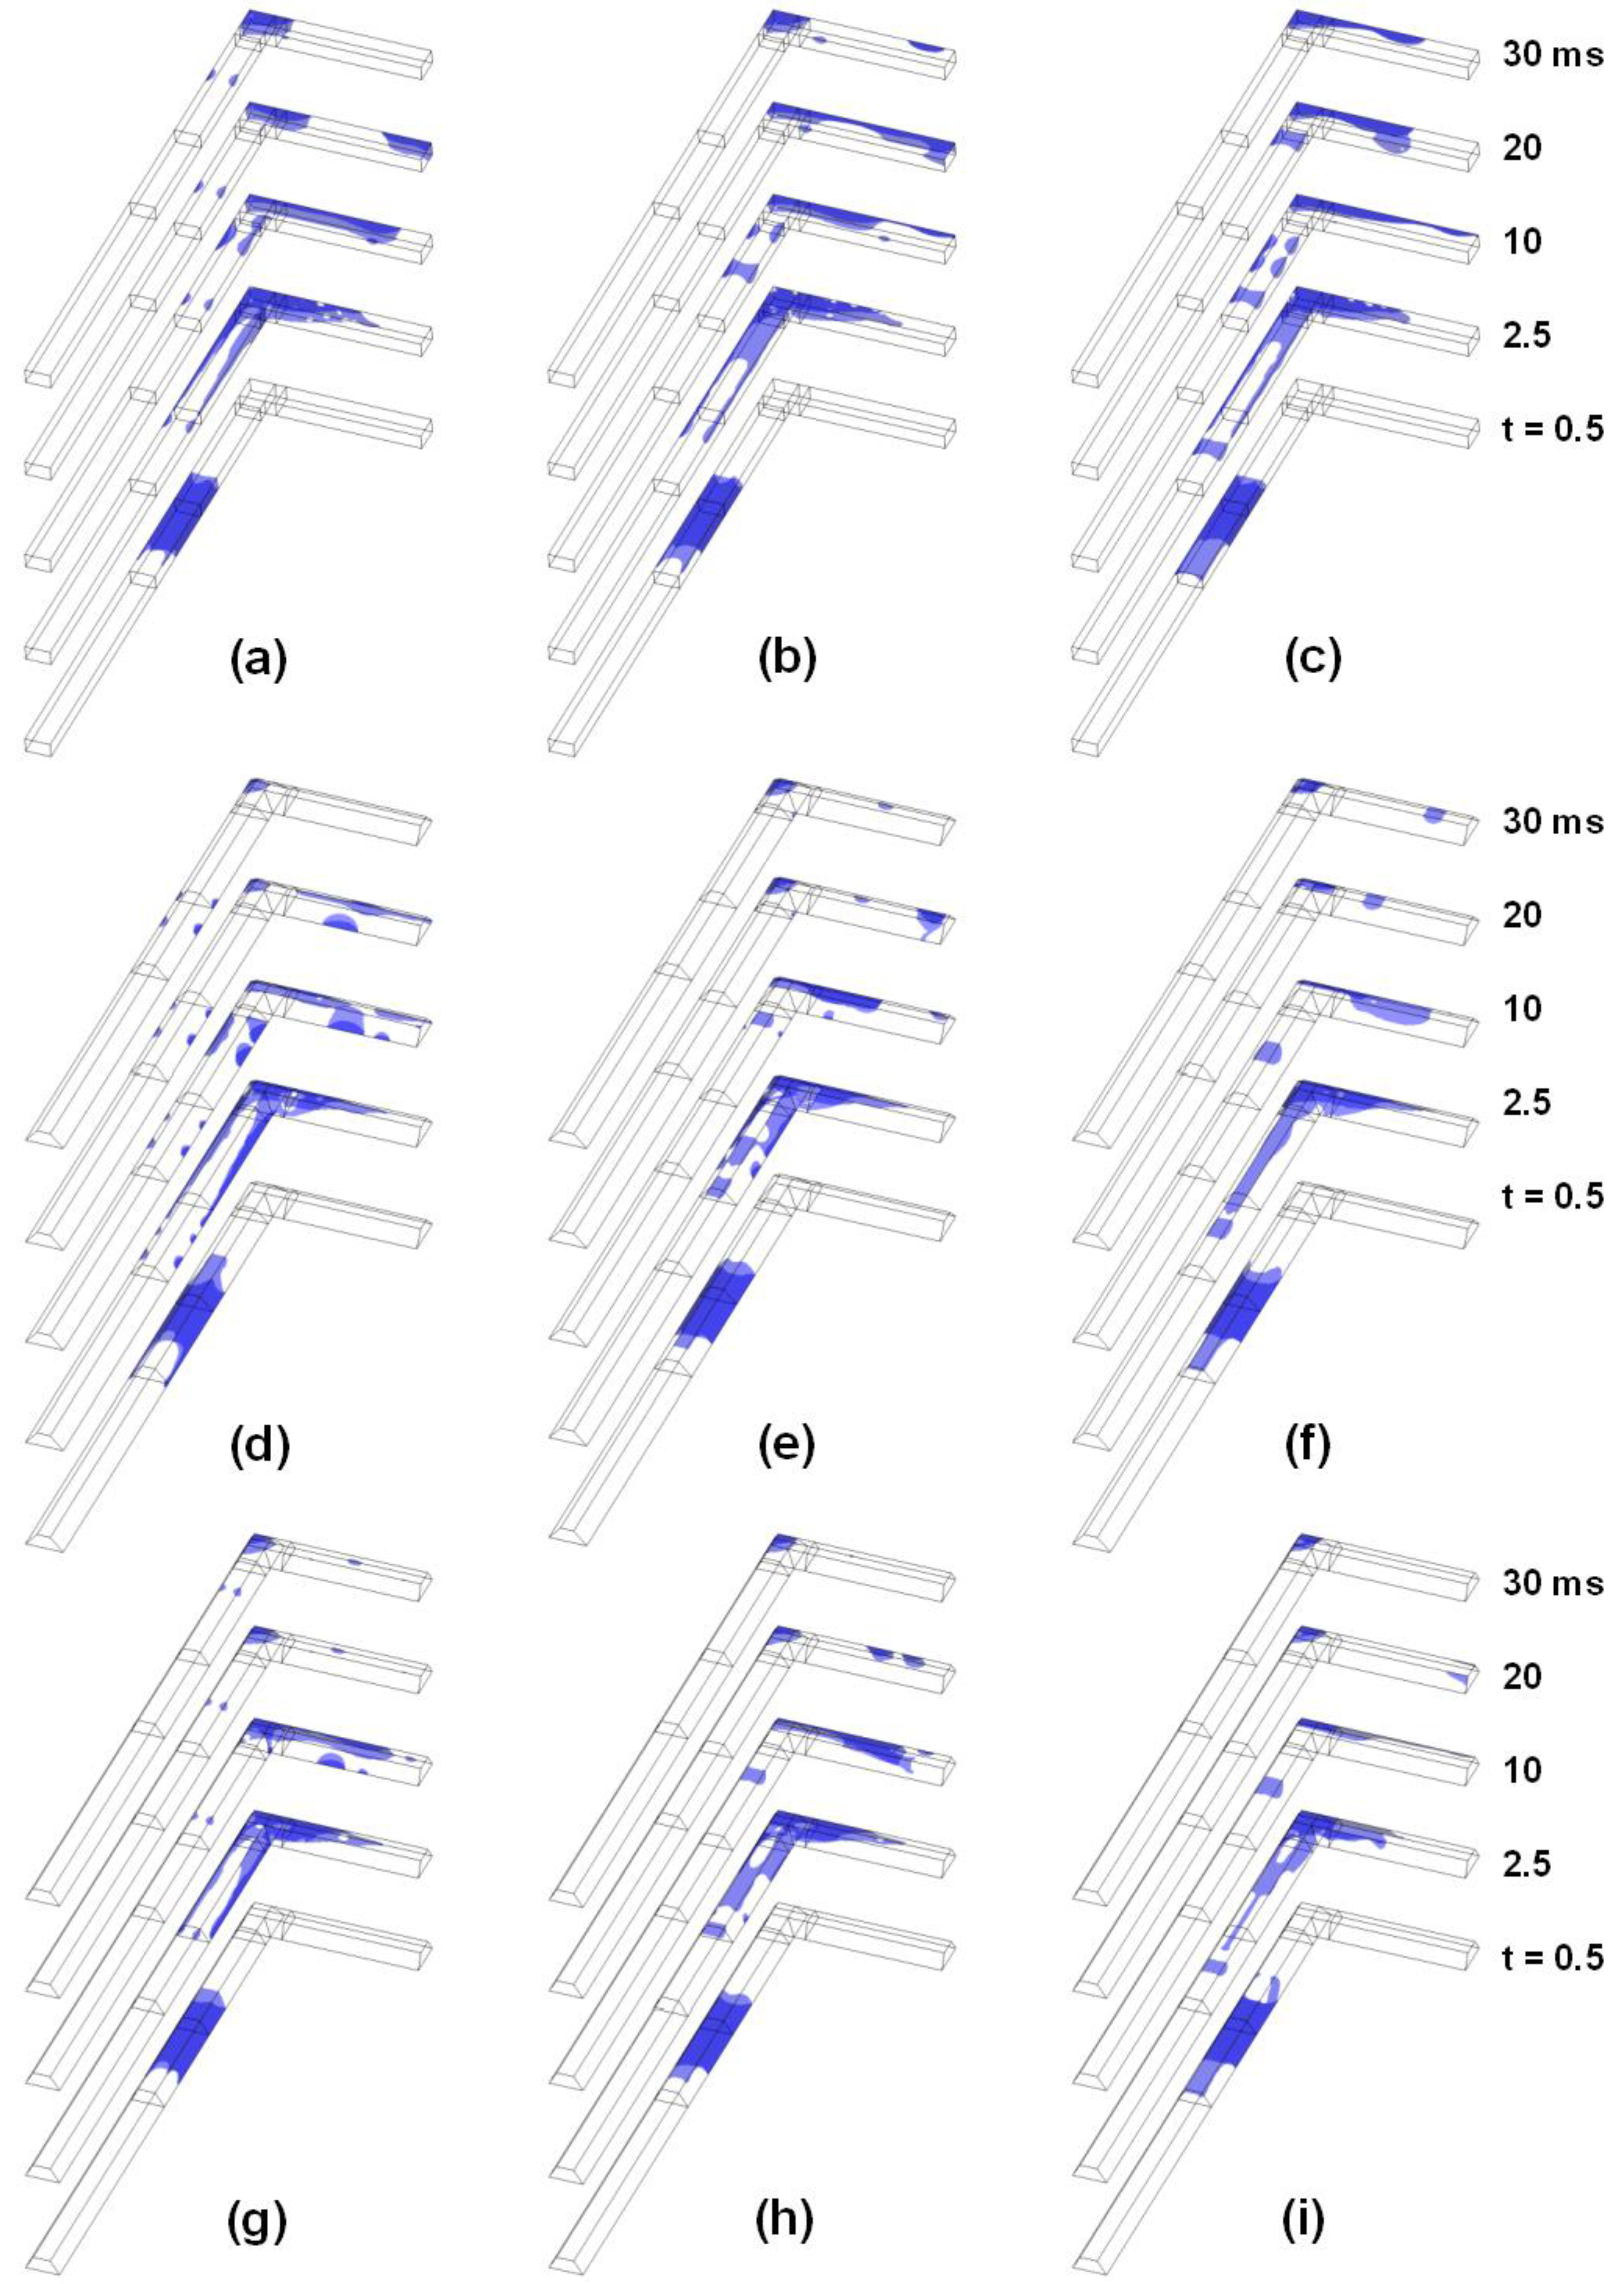
3. Results and Discussion

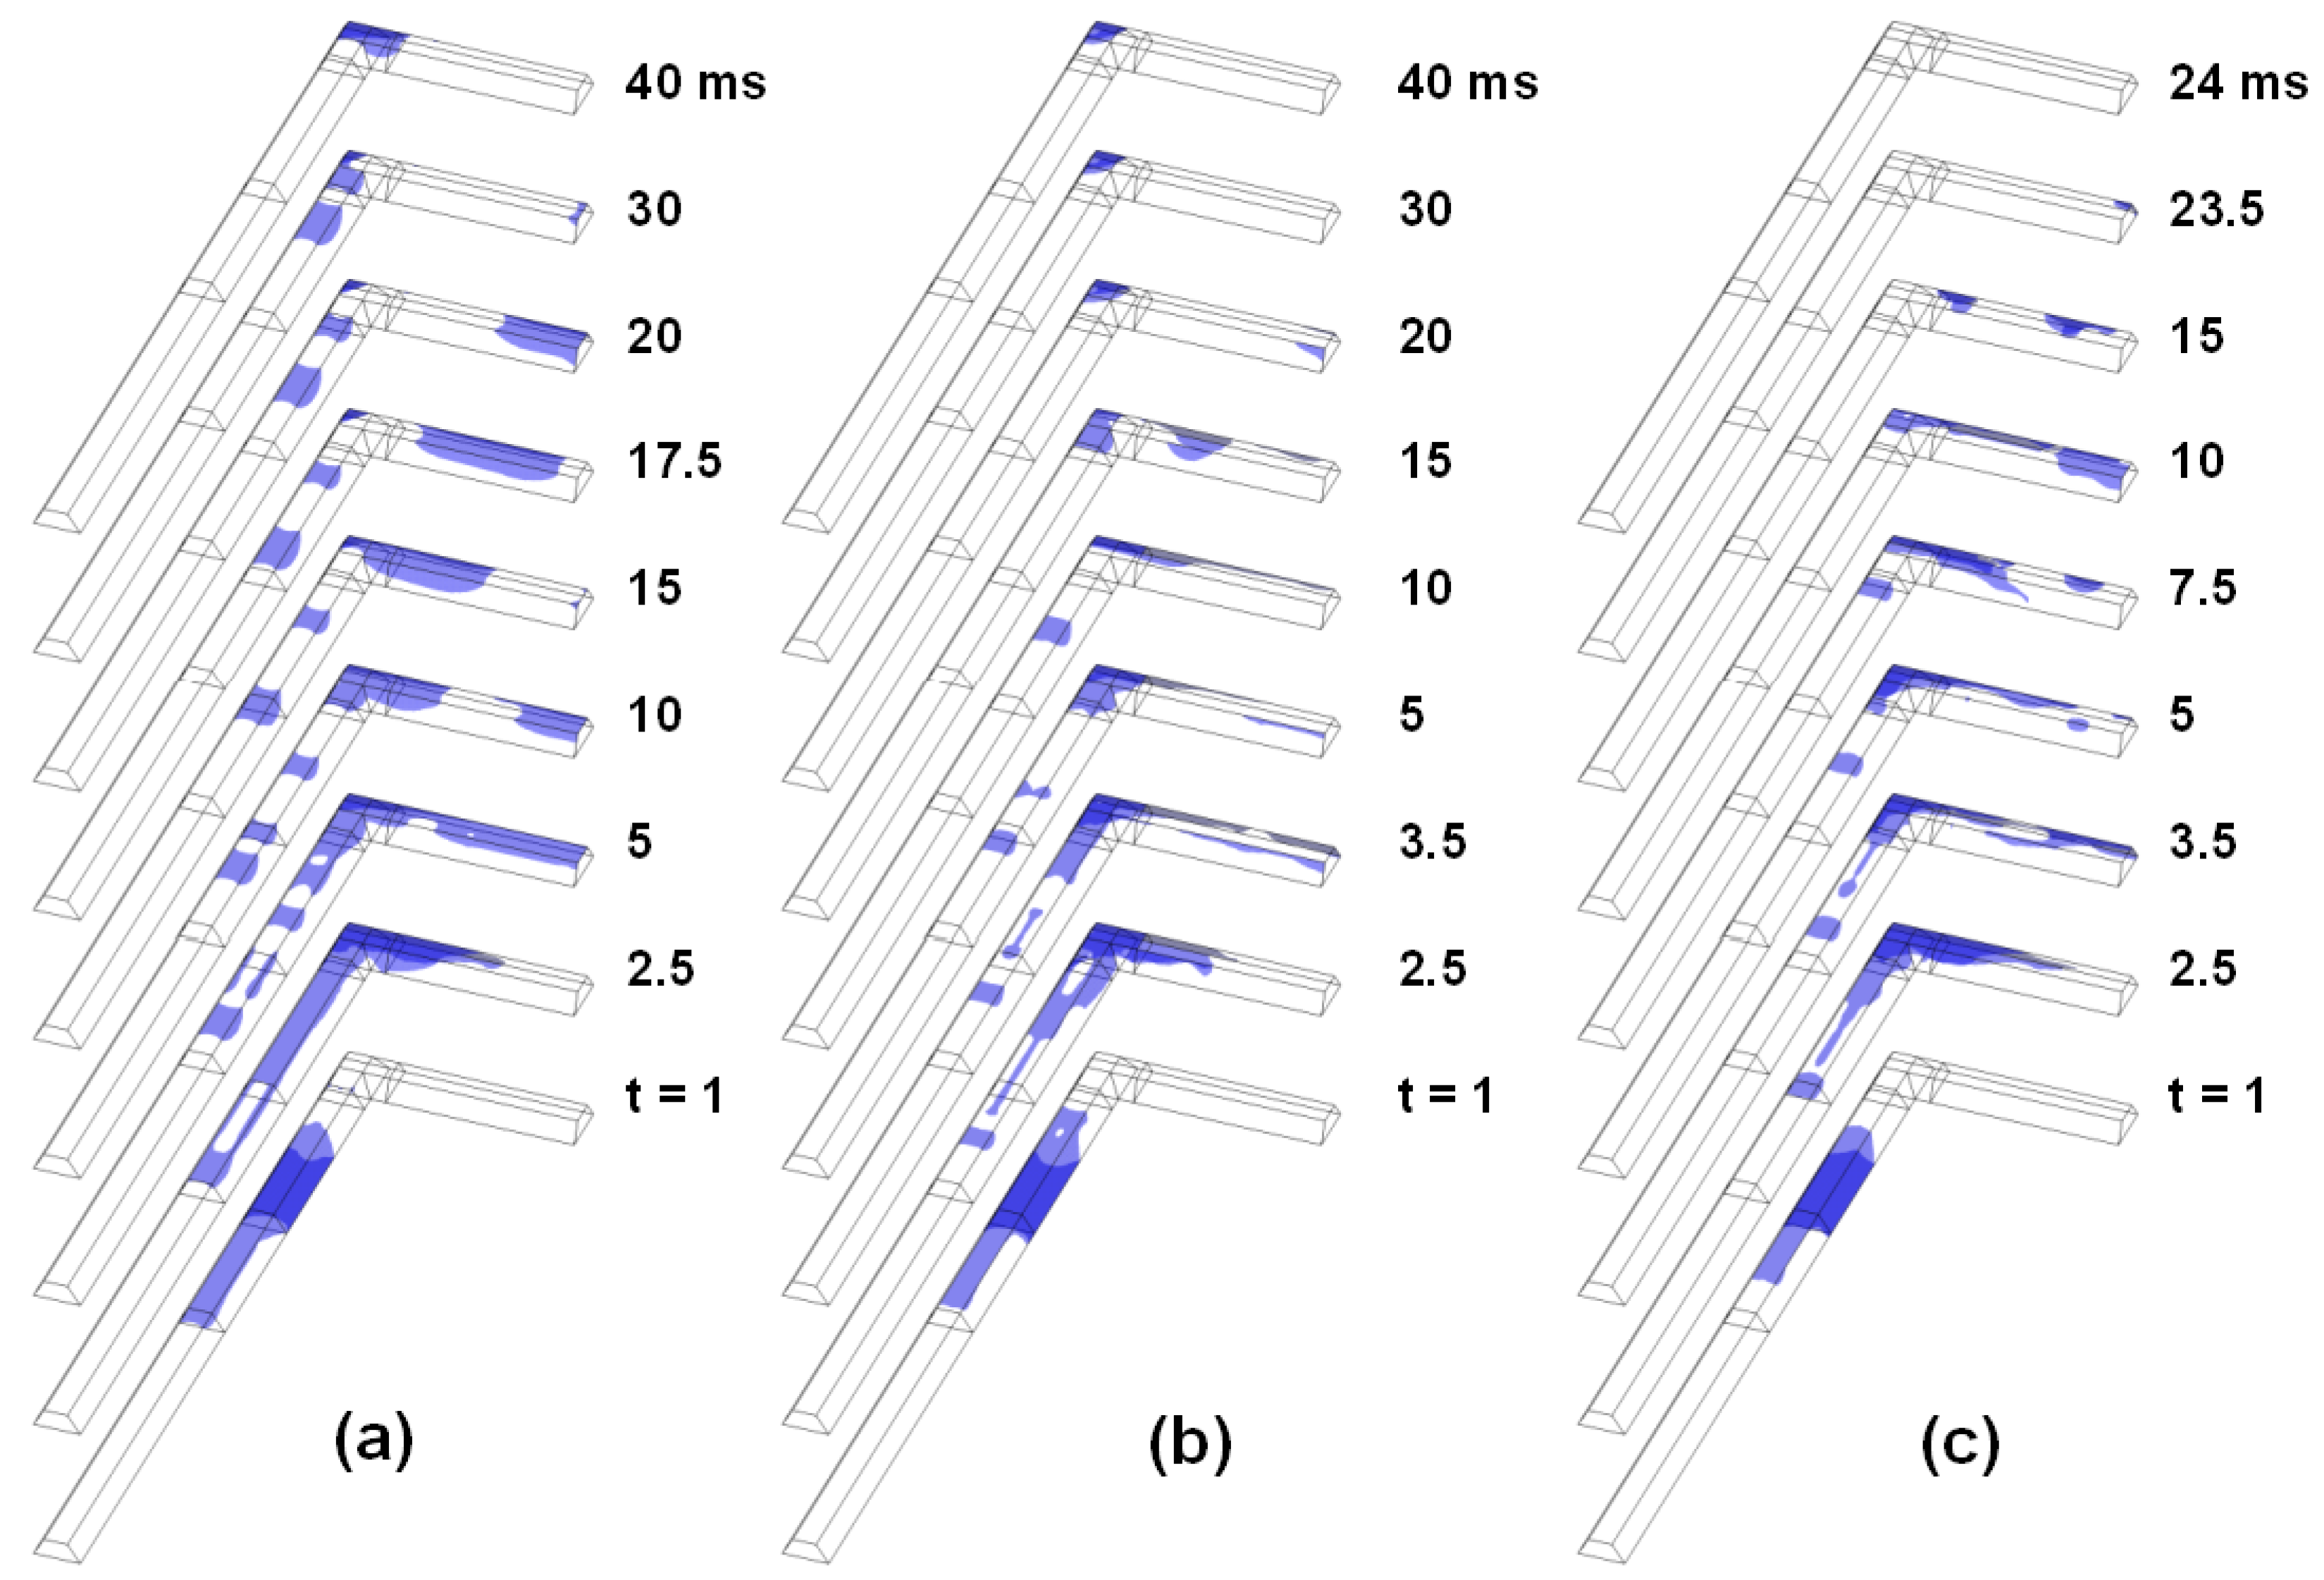
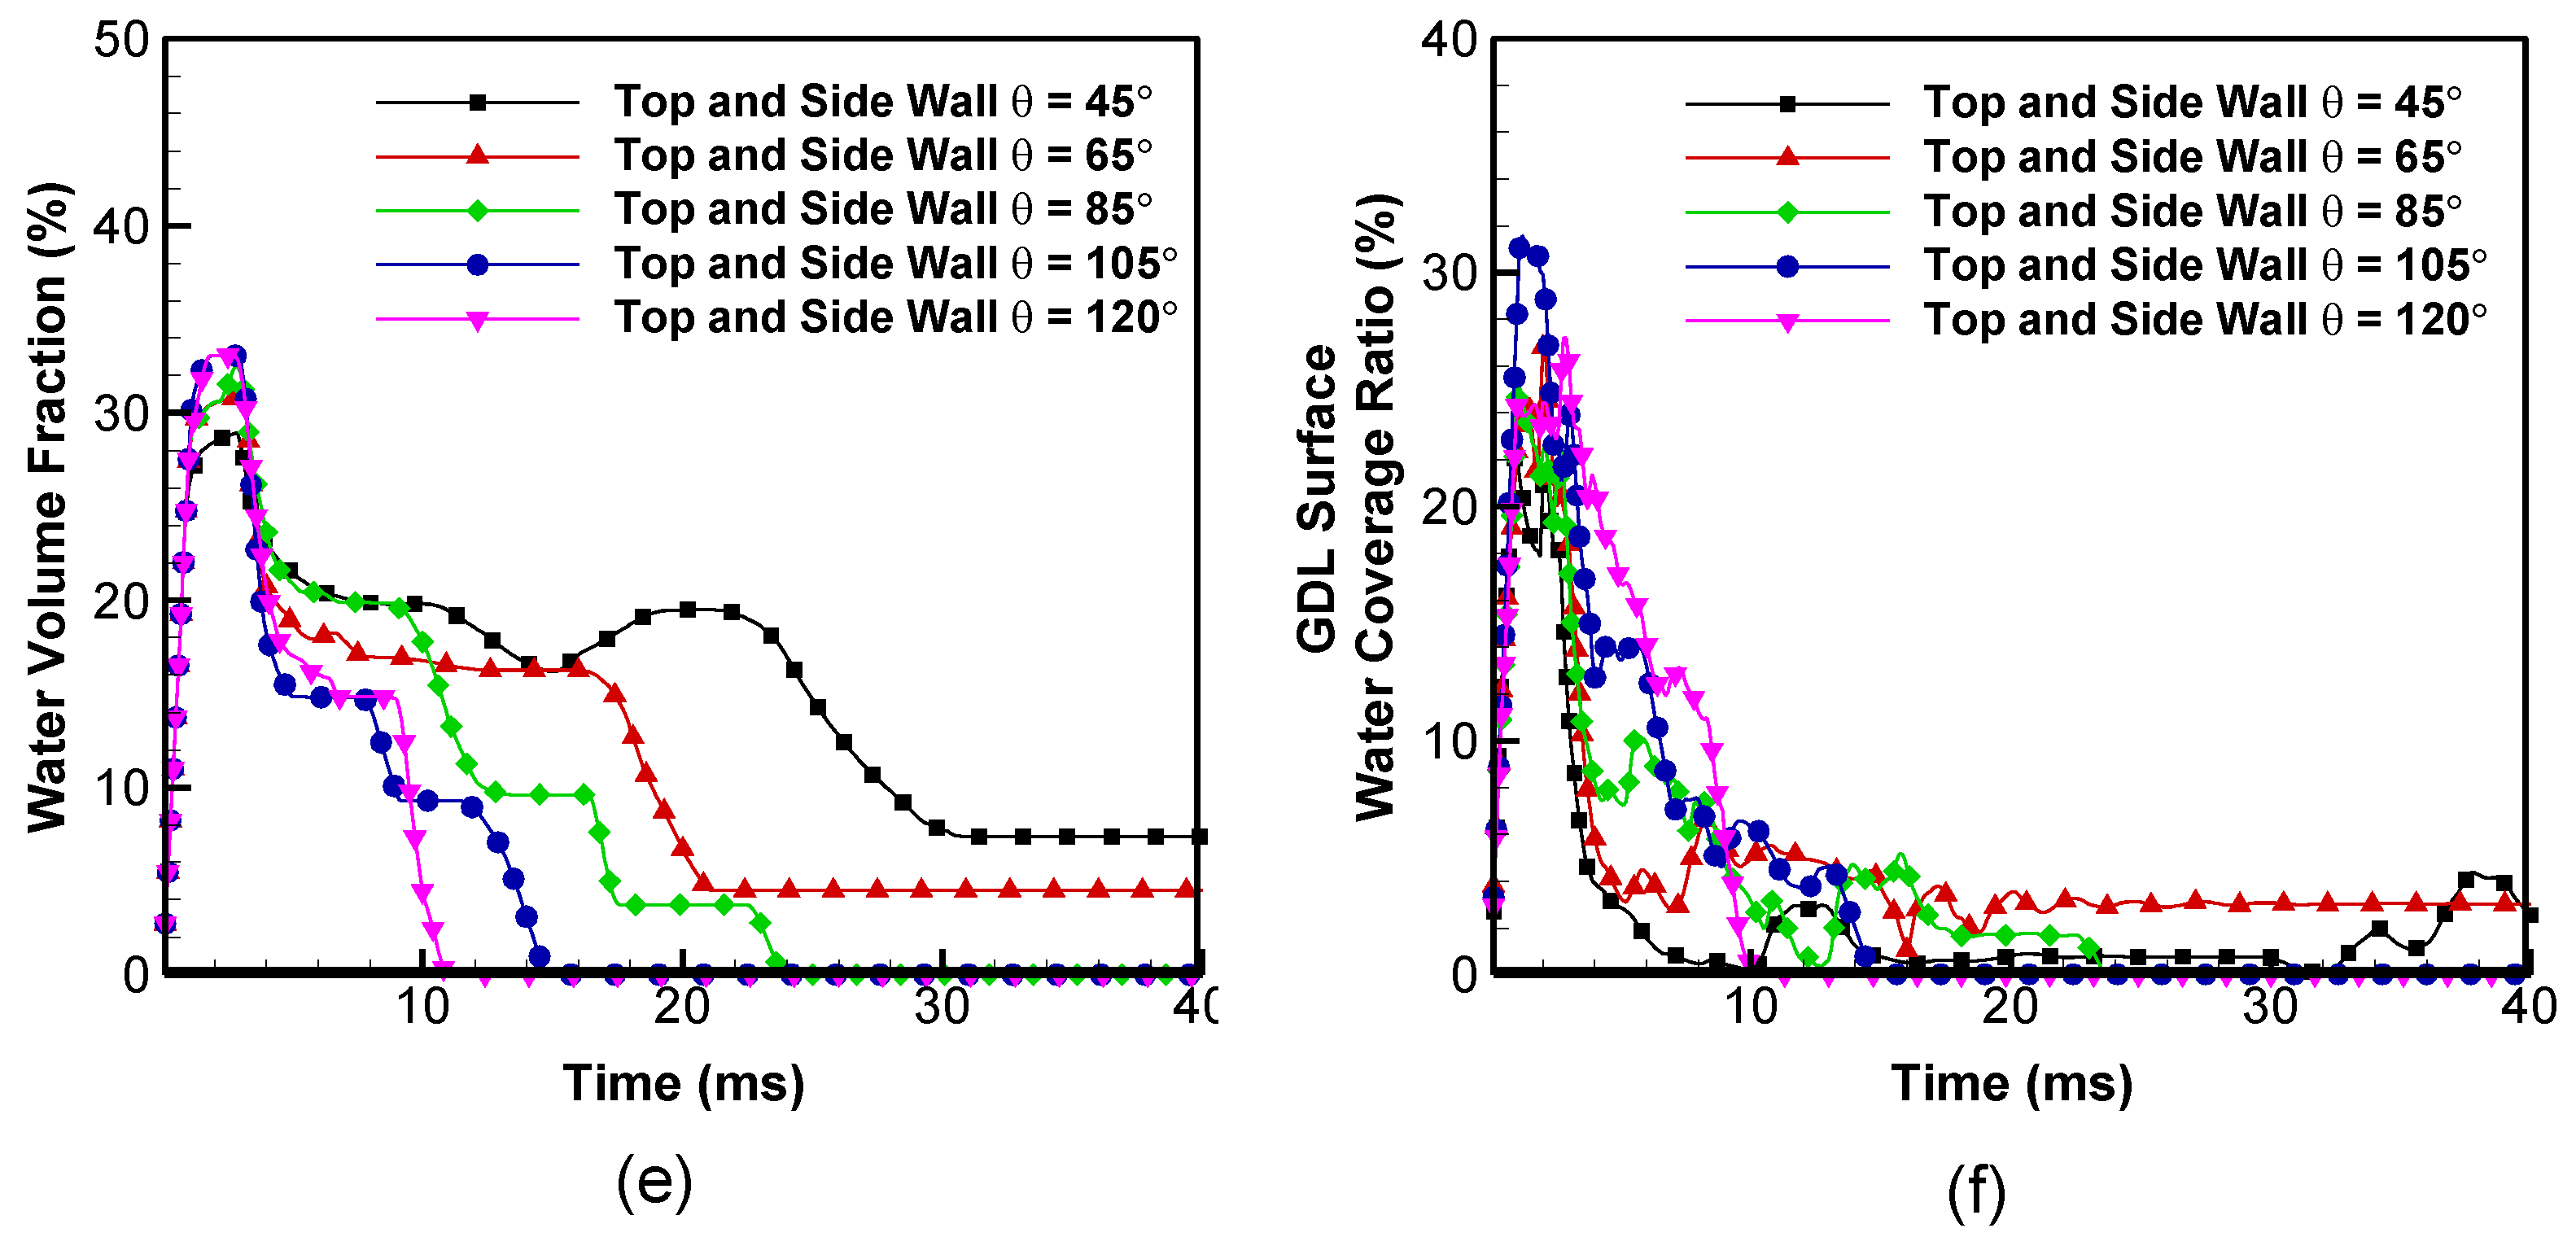
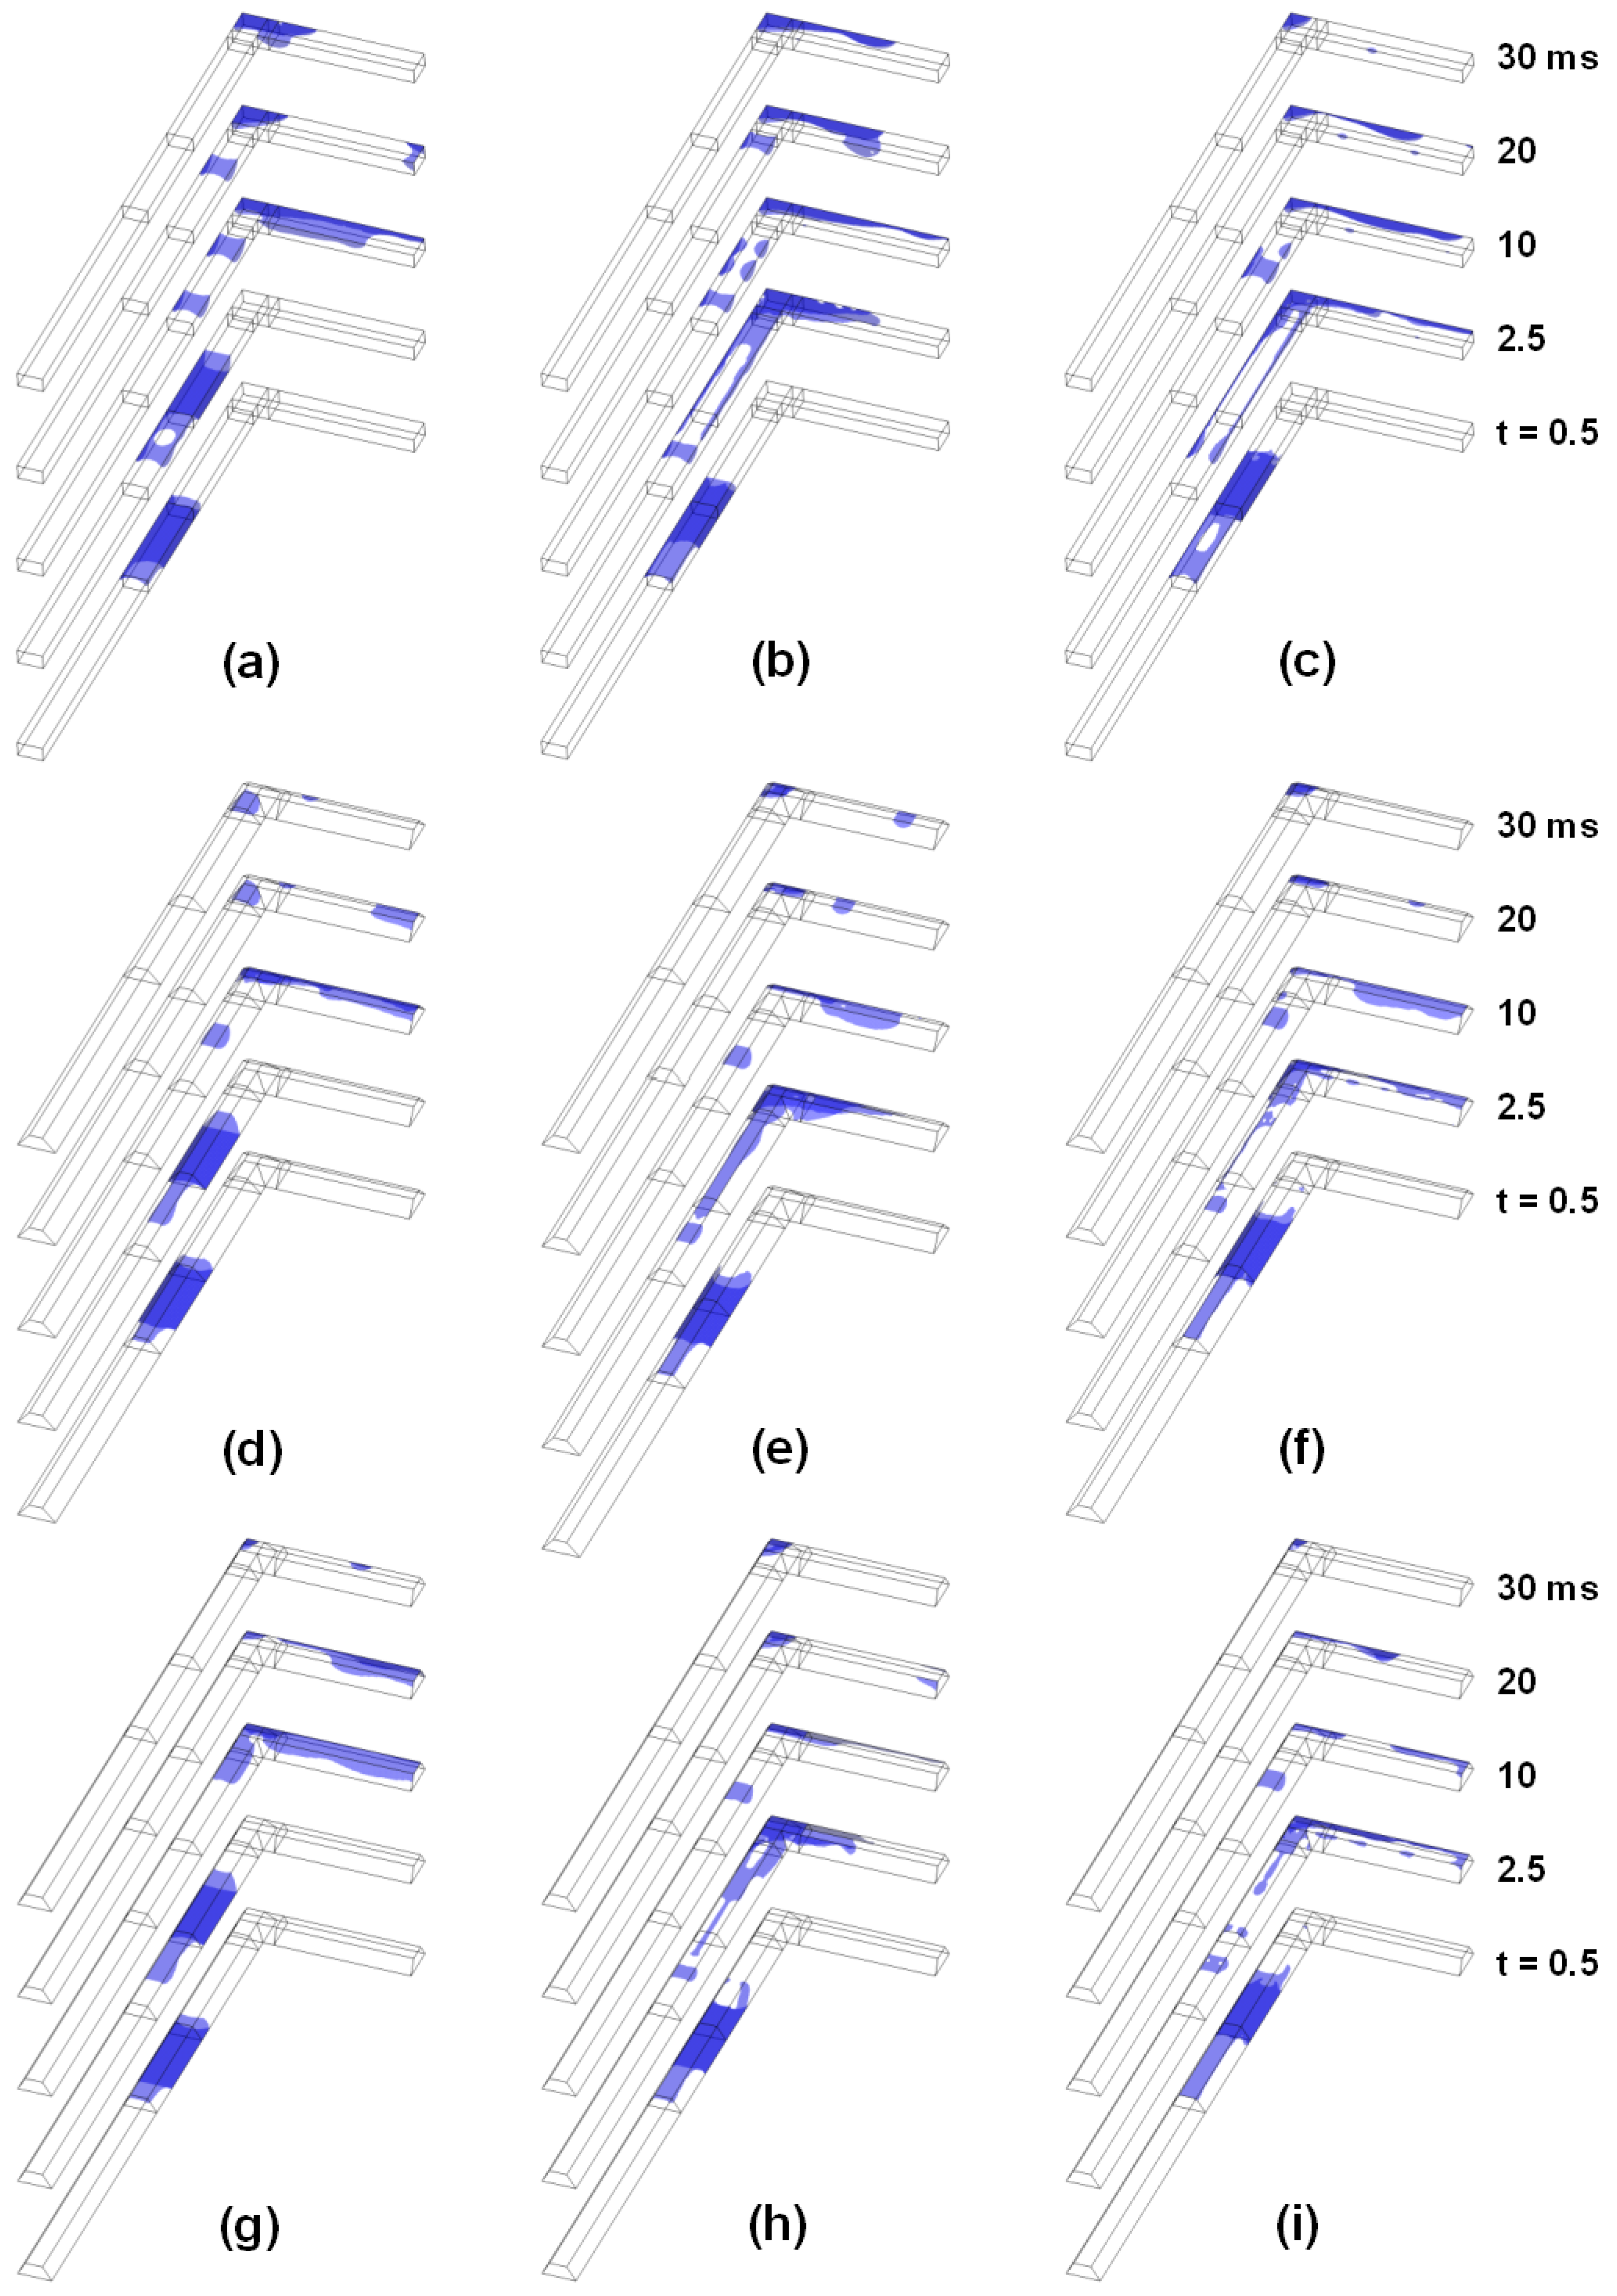
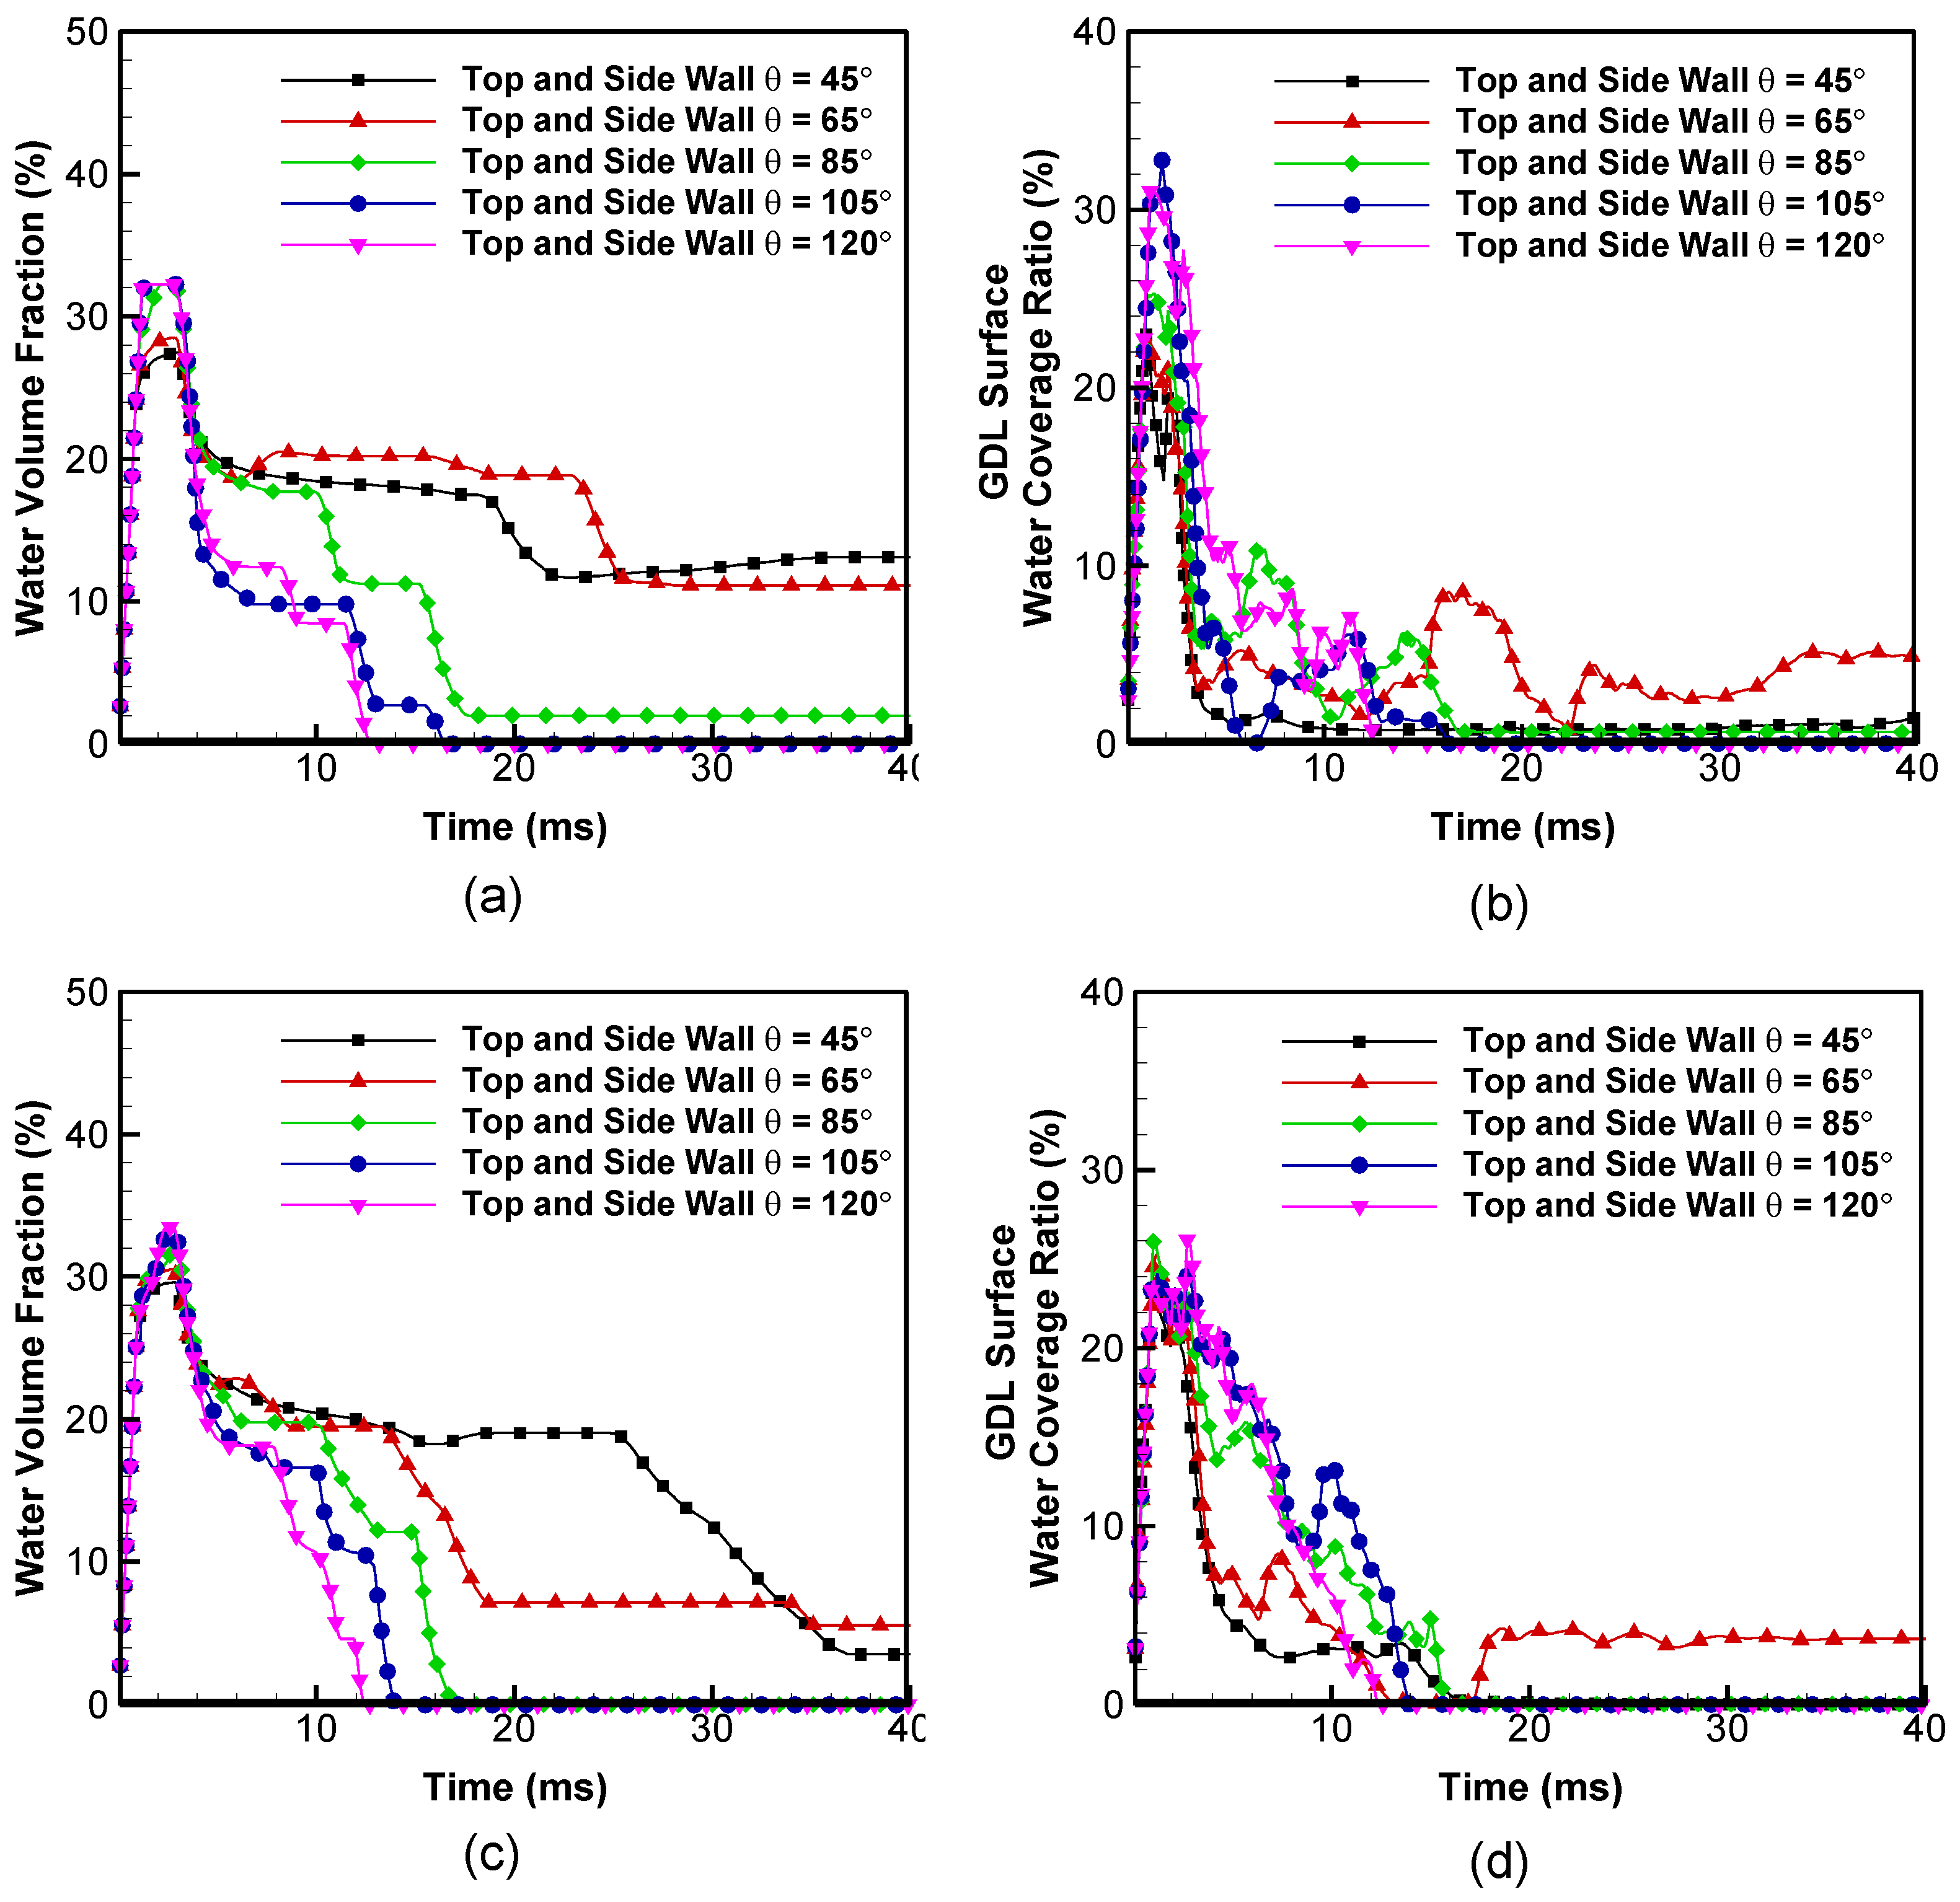
3.1. Effect of Surface Contact Angle of Top and Side Walls

The two-phase flow inside a GC of a PEM fuel cell is mainly affected by various factors such as channel geometric configuration, surface properties, liquid water generation rate, gravity, etc. In particular, surface wettability is very important due to the relatively small length scale of the channel geometry. Several researches reported that a hydrophobic GDL surface is favorable to move liquid water from the GDL surface to channel walls so that sufficient amount of reactants could access the cathode reaction sites [17,18]. While holding the static θ of the GDL surface as 140° following the baseline simulation conditions, the effect of the static θ of the top and side channel walls is investigated first. Figure 2, Figure 3 and Figure 4 show the time evolution of the liquid water interface in the bent GC for the REC, T50 and T60 configurations, respectively. Snapshot images at the nine different times are chosen for the five different θ t s . For θ t s = 45° (Figure 2a), the water slug moves about 3 mm at t = 1 ms while leaving the long tails along the upper edges of the GC and then turns the direction toward the exit after hitting the front side wall and the corner at t = 2.5 ms. After the first discharge of the partial slug mass around t = 3.5 ms, another water mass starts to move toward the exit from the channel corner at t = 10 ms. Until t = 40 ms, the remaining water mass attached in the upper edges moves slowly due to the strong surface tension forces. Moreover, the shape of the liquid water at the upper corner does not change much although the air flow exerts shearing forces. Pekula et al. [27] and Trabold et al. [28] applied neutron imaging on an operating PEM fuel cell to study the water distribution and transport in GCs with a rectangular cross section. The results showed that the liquid water tends to accumulate at specific areas which include the 90° and 180° bent sections in the GCs near the edges of the cell active area. Although the contact angle of the channel surfaces was not reported in the experiment, the behavior of liquid water near the bent section in Figure 5 of Pekula et al. [27] is similar to Figure 2a. Le et al. [29] performed numerical simulation and experimental validation of liquid water behaviors in a PEM fuel cell with serpentine channels. Similar contact angles for GC and GDL surfaces with Figure 2a,b are used in the experiment. Although the size of the GC cross section is different, liquid water motion near the bent sections in the GCs is similar to Figure 2a,b [29]. In Figure 2b, the initial movement of the water slug is similar to that of Figure 2a except that the trailing tails in the upper edges move faster. However, the second water mass discharge proceeds slower than Figure 2a around t = 20 ms. This phenomenon can be observed in the time evolution of the WVF plot for the REC configuration in Figure 5a. The WVF is defined as the ratio of the volume occupied by the liquid water inside the control volume (Figure 1) to the total volume of the control volume. In contrast to Figure 2a, the trailing tails in the upper edges in the initial straight channel part are cleared around t = 20 ms. At t = 40 ms, a considerable amount of liquid water is tightly attached to the upper corner as evidenced in the long and flat line portion of the non-zero WVF in Figure 5a. In Figure 2c, the liquid water removal proceeds much faster and cleaner than Figure 2a,b. During 40 ms of the time interval, three major water mass discharges are observed around t = 3.5, 10, 15 ms for θ t s = 85° case which can be also confirmed from the three stepwise decreases in the WVF plot (Figure 5a). At the time of 40 ms, a small amount of liquid water is still present at the upper corner. In Figure 2d,e, and Figure 5a, the flow patterns and the WVF plots for θ t s = 105° and 120° cases are very similar to each other although the time of complete water removal is slightly different. Notice that the upper edges are free of the trailing tails of liquid water because of the hydrophobic contact angles. Figure 5b shows the effect of θ t s on the WCR on the GDL surface (GWCR) in the control volume (Figure 1) for the REC configuration. Except θ t s = 45° case, the GWCR shows complex oscillations which represent the contacting events of liquid water mass with the GDL surface. Due to the strong surface tension force, most of liquid water is lifted up to the upper edges in θ t s = 45° case. For θ t s = 65° case, it is considered that a chunk of liquid water clinging to the top wall touches the GDL surface momentarily during t = 15–20 ms (Figure 2b and Figure 5b). For θ t s = 85° case, a similar liquid water mass touching events to θ t s = 65° case occurs twice around t = 7.5 and 14 ms (Figure 2c and Figure 5b). For θ t s = 105° and 120° cases, the GWCR drops to zero quickly due to the fast water removal mechanism but shows the highest value in the early stage because the liquid water is not lifted up to the upper edges. When the performance of the five θ t s cases are compared for the REC configuration, two hydrophobic cases ( θ t s = 105° and 120°) show better WVF and GWCR. This result is different from the conclusion drawn from the straight channel with the rectangular cross-sectional shape in the previous literature [18]. Although the complete water removal time for θ t s = 105° case is greater than θ t s = 120° case in Figure 5a, the GWCR for θ t s = 105° case provides a lower average value than θ t s = 120° case in Figure 5b as more liquid water could be attached on the top or side walls.
Figure 3 shows the time evolution of the liquid water interface in the bent GC for the T50 configuration. Due to the cross-sectional shape, the liquid water moves along the channel guided by the narrow top wall passage. As observed in Figure 3 and Figure 5d, the upper part of the channel is so narrow that naturally less water is lifted up to the top or side walls and more water is contacting the GDL surface compared to the corresponding REC configuration cases. As shown in Figure 5c, the liquid water removal rate increases as θ t s increases. Especially, the combination of the small upper space and the strong surface tension force results in the relatively slow water removal for θ t s = 45° case. The WVF at t = 40 ms is lower than that of the REC cases for the hydrophilic top and side wall conditions ( θ t s = 45°, 65°, and 85°). The GWCR for the T50 configuration is higher than that of the REC configuration in average during the calculation time interval as shown in Figure 5b,d. When the performance of the five θ t s cases are compared for the T50 configuration, θ t s = 120° shows the most favorable combination of WVF and GWCR. Note that the WVF for θ t s = 65° case is favorable than that of θ t s = 45° case in Figure 5a but the GWCR for θ t s = 65° case is higher than θ t s = 45° case in Figure 5d. Thus, a mass of liquid water located in the corner section is considered to contact the GDL surface from Figure 3b and Figure 5d.
Figure 4 shows the time evolution of the liquid water interface in the bent GC for the T60 configuration. Figure 4 shows a very similar trend with Figure 3 in overall. When the performance of the five θ t s cases are compared for the T60 configuration, θ t s = 120° shows the most favorable combination of WVF and GWCR. If the two trapezoidal configurations are compared, the water removal rate for the T60 configuration is higher or lower than that of T50 configuration depending on θ t s . The GWCR for the T60 configuration is lower than that of the T50 configuration in average (Figure 5d,f). Considering both of the WVF and the GWCR, the T60 configuration provides a favorable option. Furthermore, the WVF for the T60 configuration is better than that of the REC configuration in overall (Figure 5a,e). The GWCR for the T60 configuration is similar to that of the REC configuration in average except the two hydrophobic channel wall conditions as shown in Figure 5b,f. Summing up all the discussions for the effect of θ t s (Figure 2, Figure 3, Figure 4 and Figure 5), the T60 configuration shows the best performance among the three channel cross sections considered in a PEM fuel cell channel flooding situation.

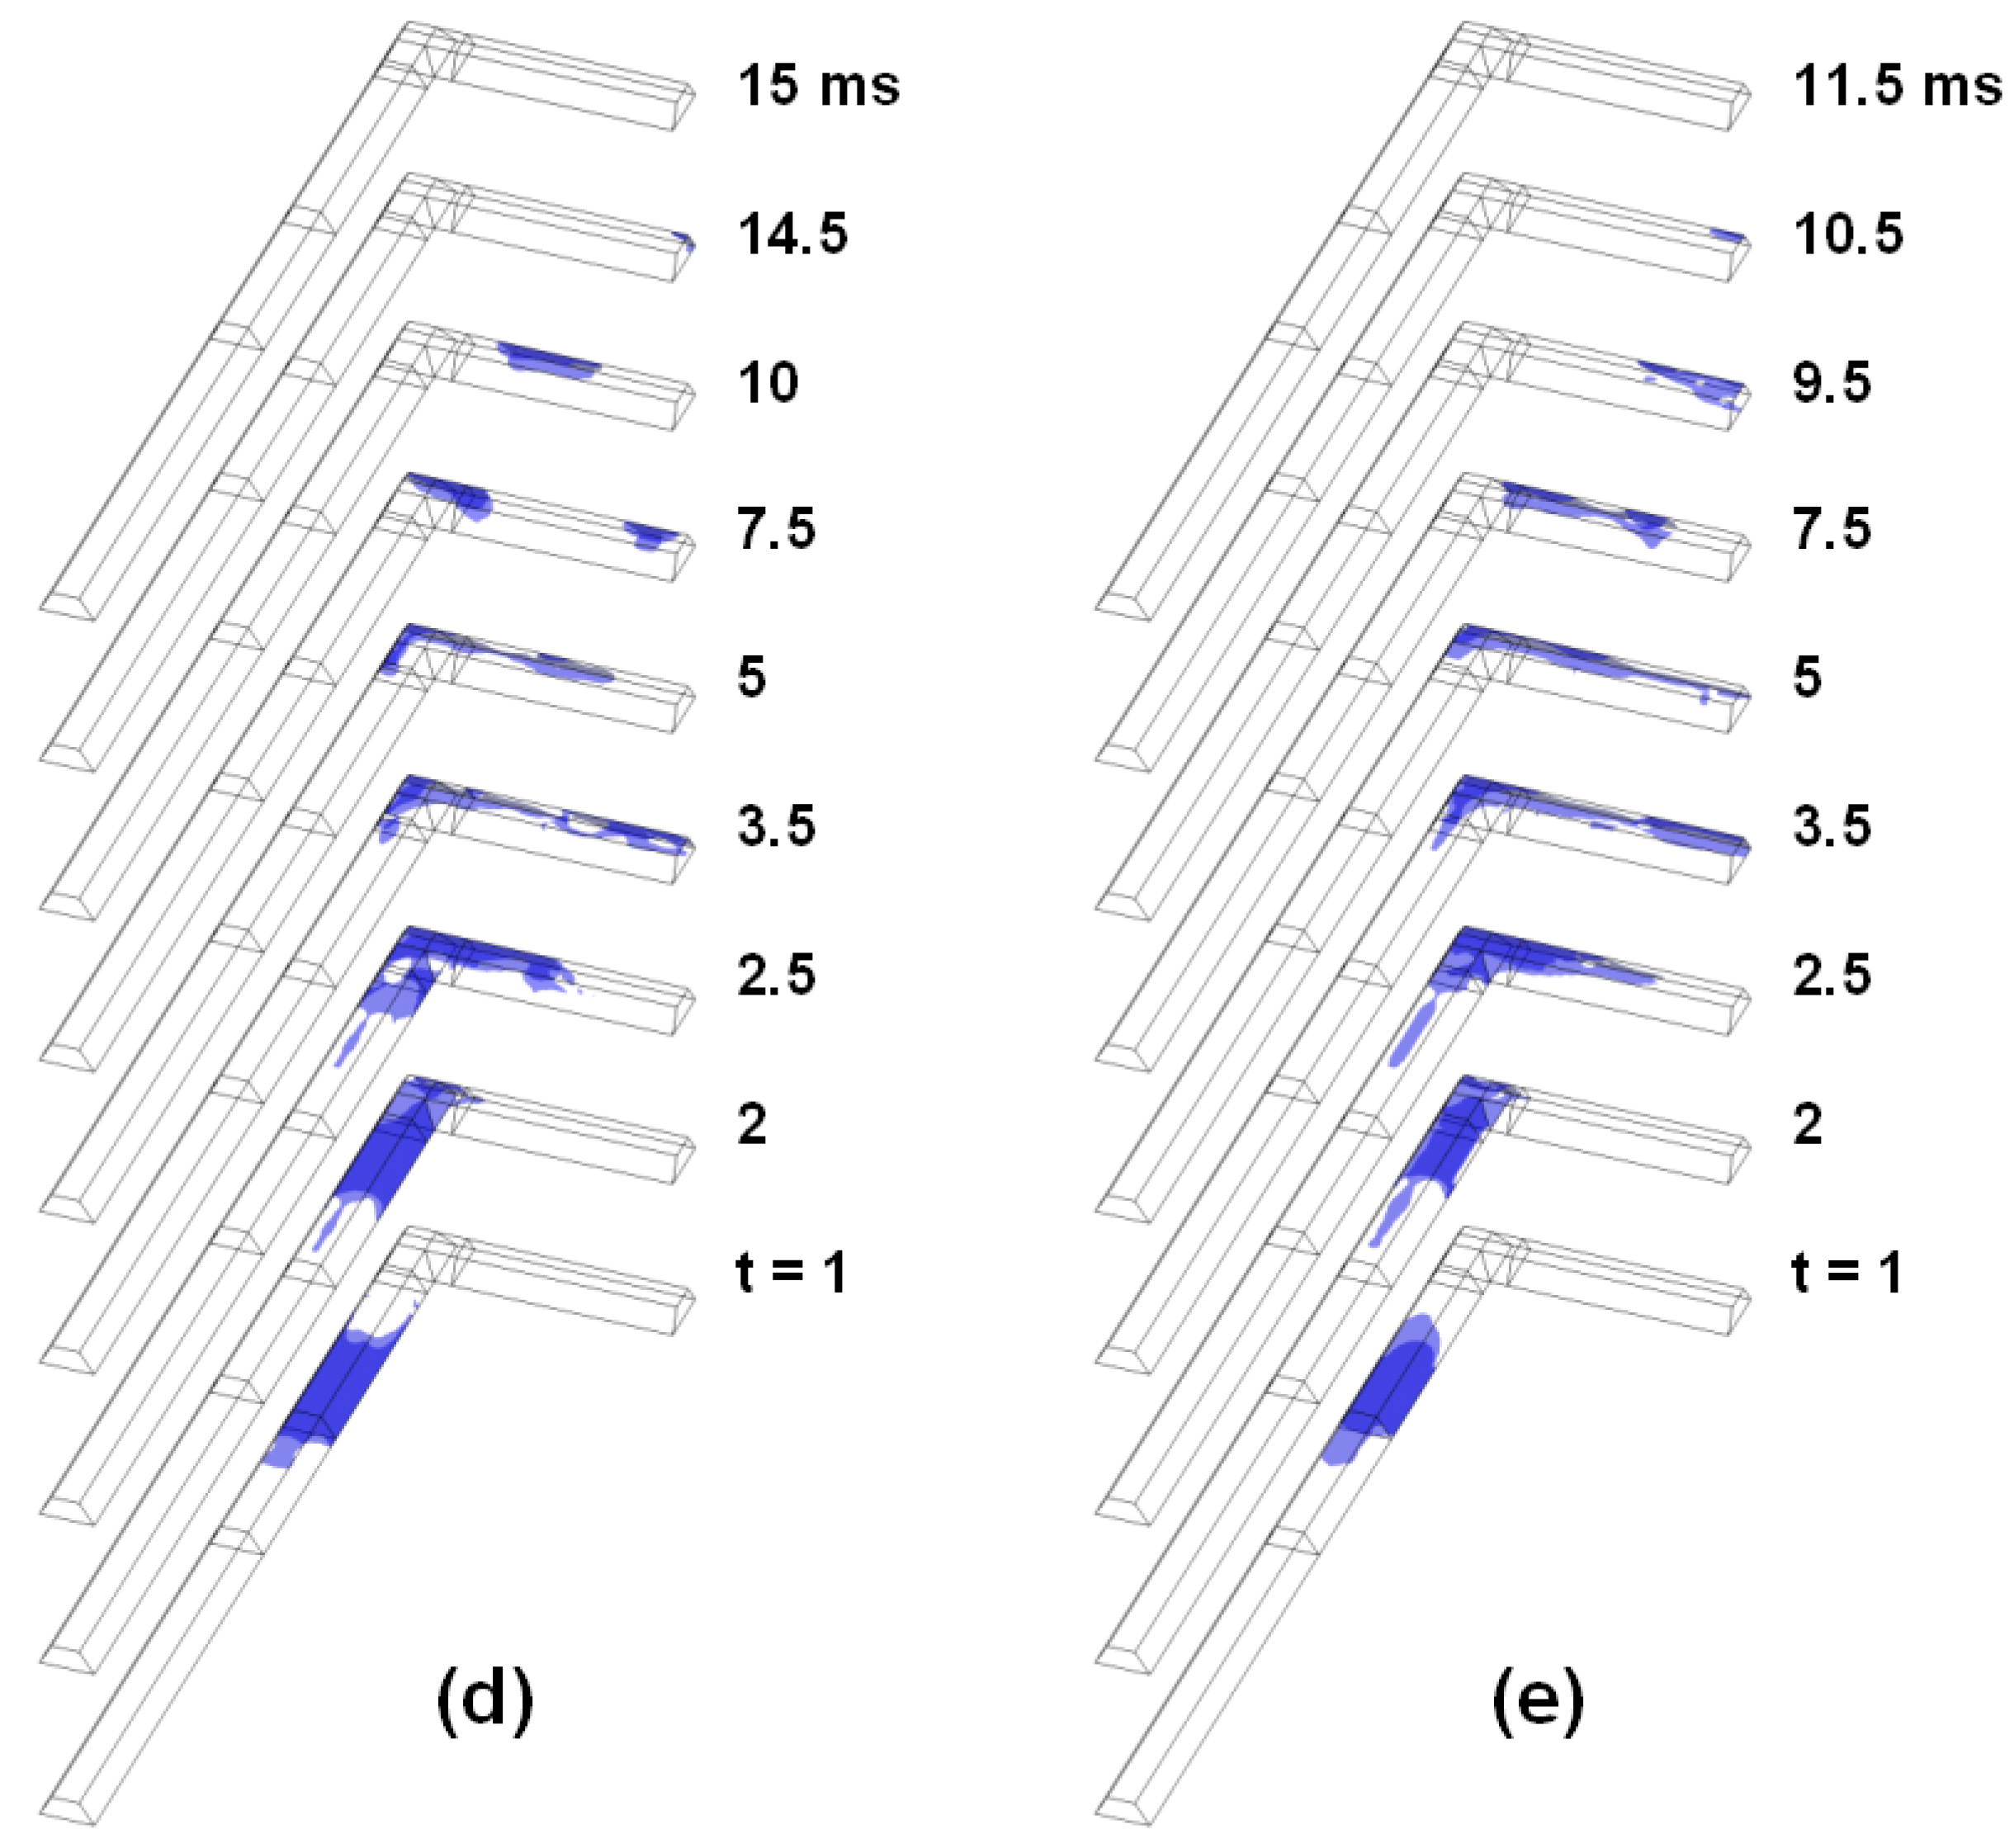
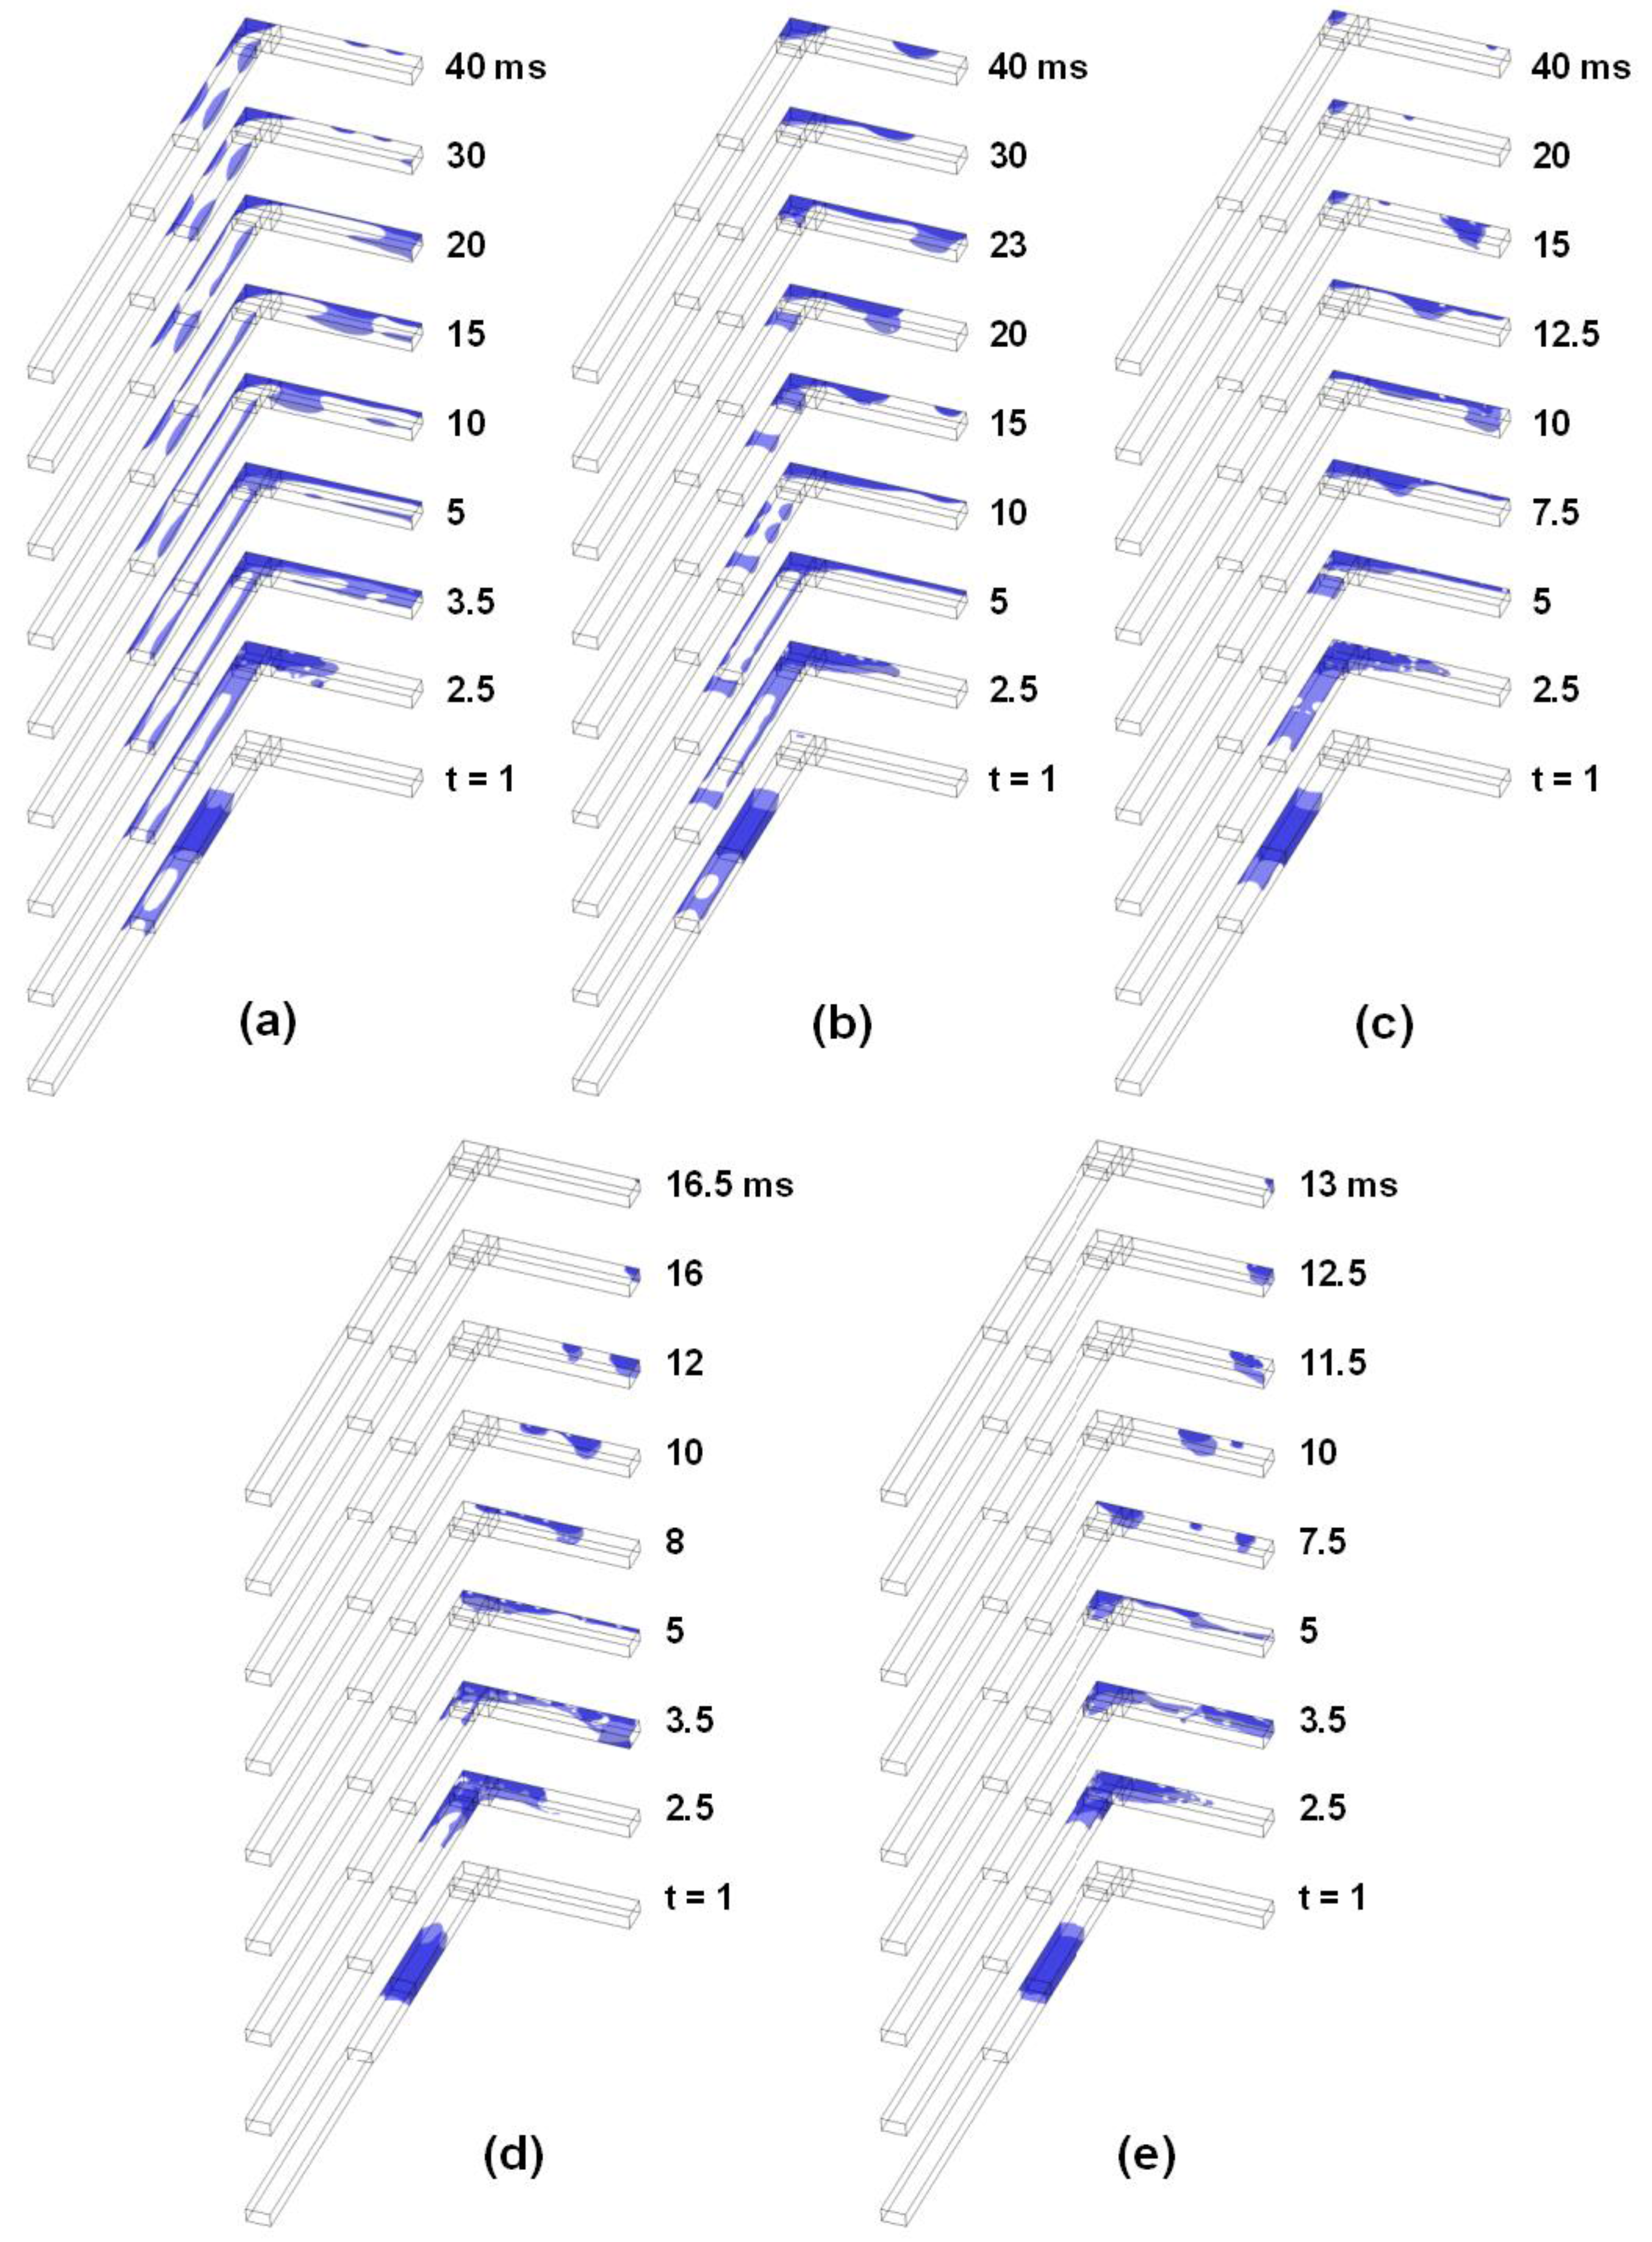
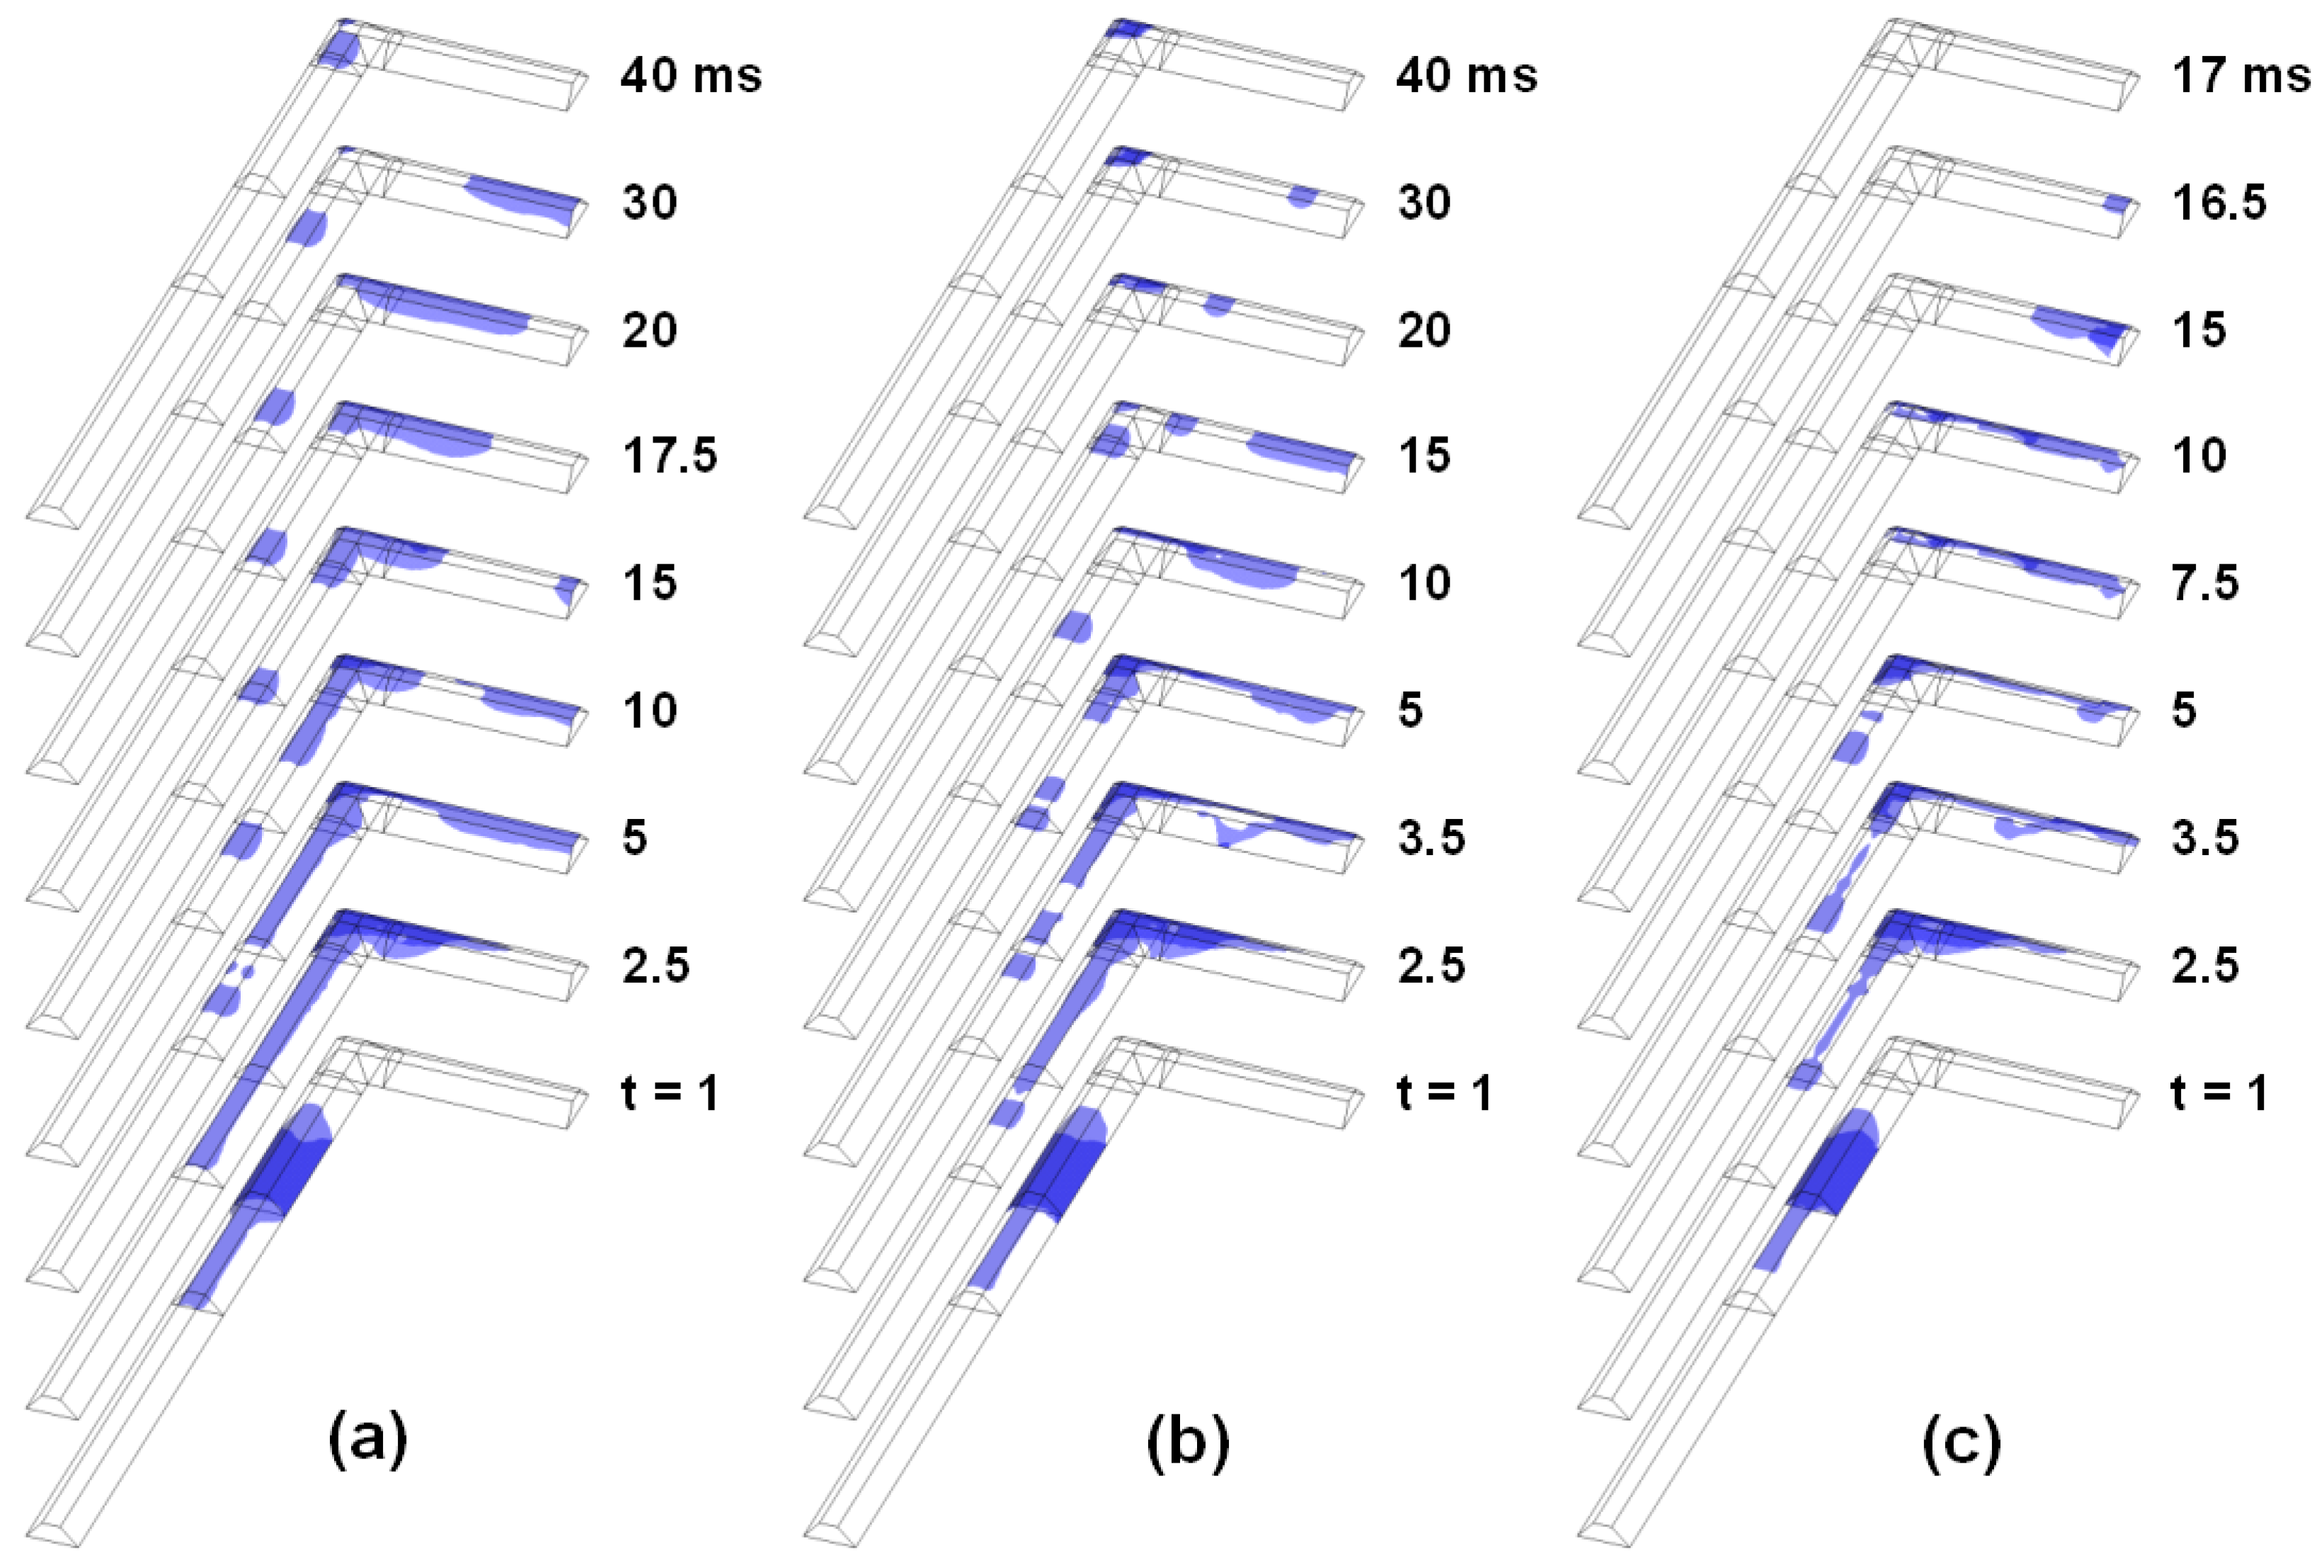
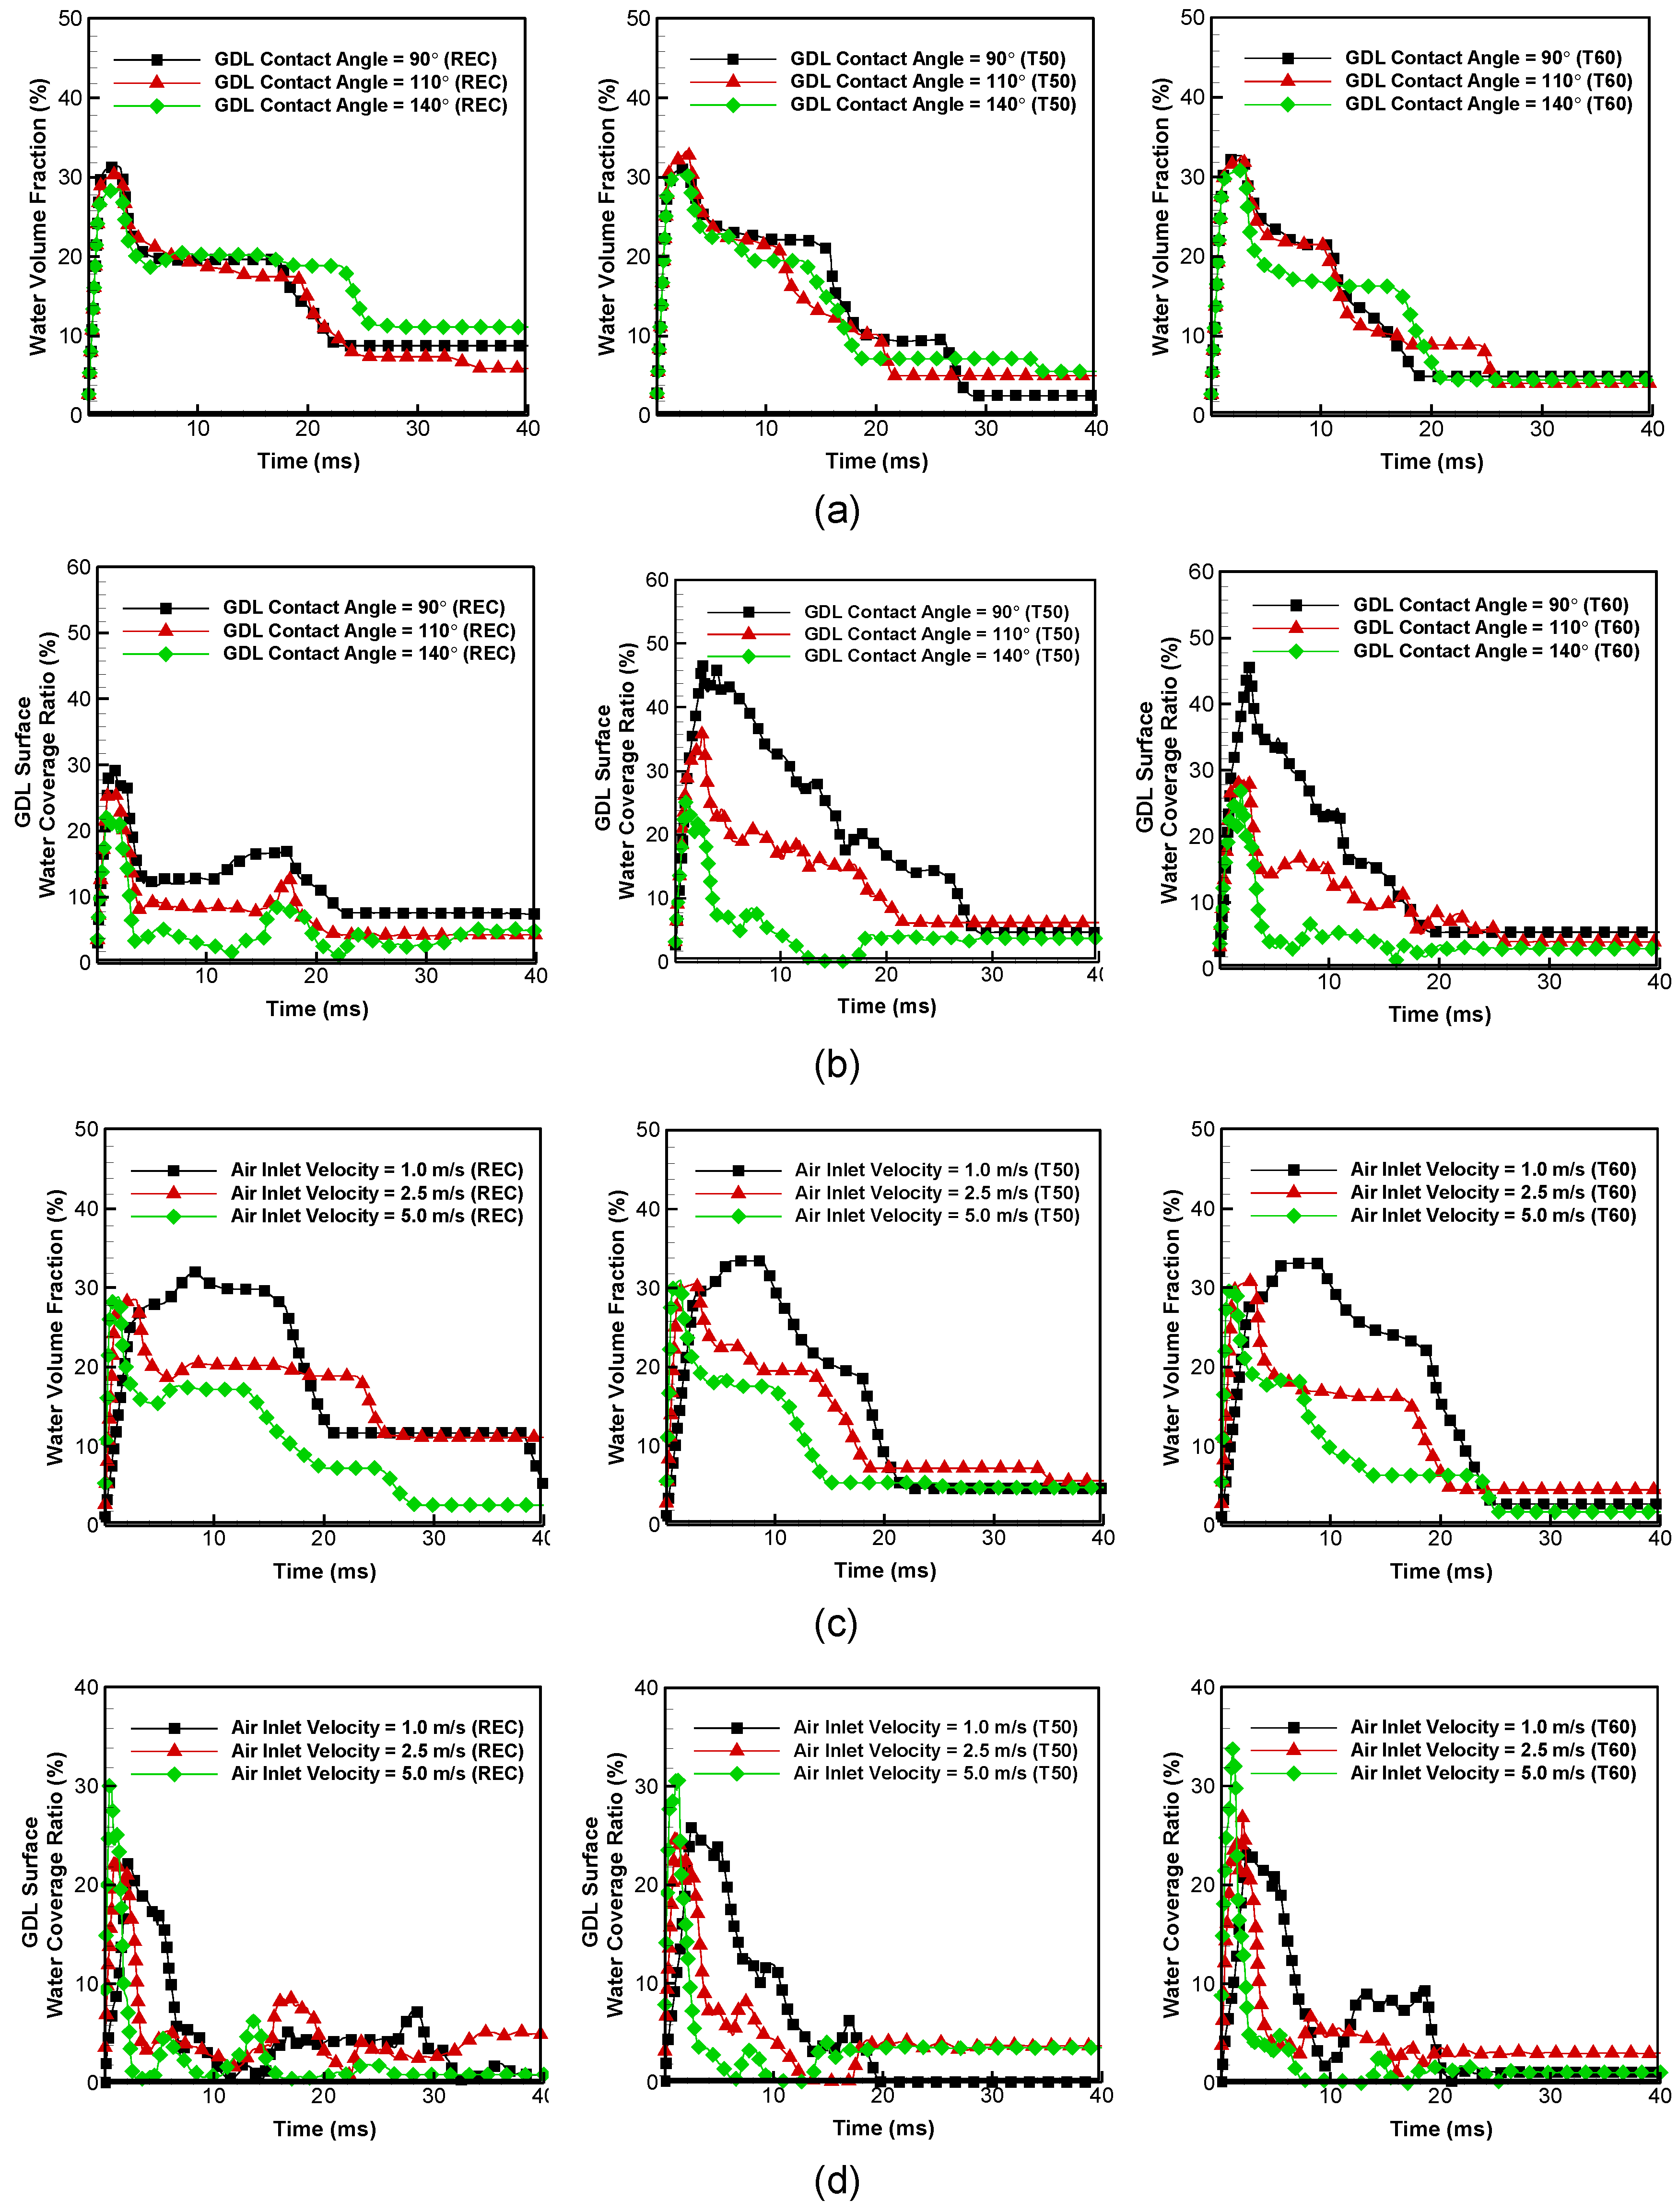
3.2. Effect of GDL Surface Contact Angle and Air Inlet Velocity

By adjusting the polytetrafluoroethylene (PTFE) content of the GDL, θ g can be changed. In addition to θ t s , the effect of θ g is studied for the three different values of 90°, 110°, and 140°. Figure 6 shows the effect of θ g on the time evolution of the liquid water interface for the three different channel cross sections at V i n , a i r = 2.5 m s−1 and θ t s = 65°.
Also, the effect of V i n , a i r on the liquid water dynamics is investigated by changing the magnitude from 1.0 to 5.0 m s−1 in Figure 7. Figure 6a–c show the time evolution of the liquid water interface for the REC configuration. For all θ g cases, most of the water is attached along the upper edges or top and side walls. The time evolution of the liquid water interface shows a similar trend except that the liquid water film attached to the top wall exhibits slower movements in the early stage as θ g increases. Although θ g is considerably different, the WVF for the REC configuration shows very similar trend for all θ g cases in Figure 8a. Especially, θ g = 110° case produces the lowest WVF. As θ g increases for the REC configuration, the GWCR decreases in Figure 8b. In Figure 6, the T50 and T60 configurations show similar patterns for the liquid water interface. For θ g = 90° cases, the liquid water is trapped in the lower edges more or less and thus the GWCRs maintain high values in Figure 8b. When compared all configuration cases, the WVF at t = 40 ms shows the highest value for the REC configuration and the lowest value for the T60 configuration in Figure 8a. Considering the time evolution of the liquid water interface, the WVF, and the GWCR, θ g = 140° cases (representative of the most hydrophobic surface) show the most favorable water removal characteristics as suggested by many researchers [17,18,19].
For all the three configurations, the water removal rate increases and the liquid water interface shows more complex patterns as V i n , a i r increases as shown in Figure 7 and Figure 8d. At t = 40 ms, the T60 configuration has the least amount of remaining liquid water inside the GC in Figure 8c. For the REC configuration, the GWCR decreases and shows more fluctuations as V i n , a i r increases in Figure 8d. In Figure 7a–c, more water is squeezed into the upper edges and strained along the channel direction as V i n , a i r increases. For V i n , a i r = 1.0 m s−1 cases of the T50 and T60 configurations, the GWCR shows the lowest values after t = 20 ms which corresponds to the time just after the main mass of the initial water slug is expelled from the channel. When a little amount of water is present in the trapezoidal channels, the remaining water is attached on the top wall for V i n , a i r = 1.0 m s−1 in Figure 7d,g while they resize on the top and side walls as well as the lower edges for V i n , a i r = 2.5 m s−1 and V i n , a i r = 5.0 m s−1 in Figure 7e,f,h,i. Comparing the T50 and T60 configurations, more liquid water is lifted up to the top or side walls for the T60 configuration as shown Figure 8d. Gopalan and Kandlikar conducted an ex situ experiment to study the effect of trapezoidal corner angles and air velocities in GCs with the same cross-sectional shapes and similar surface contact angles with this paper [13]. High speed videos showed that the liquid droplets interacted with the channel walls at air velocities lower than 4 m s−1 and did not contact the channel walls and slid off from the GDL surface at air velocities higher than 4.1 m s−1. Compared to the air velocity of 5.0 m s−1, the relatively bigger spikes in the GWCR at air velocities of 1.0 and 2.5 m s−1 confirm that more vigorous interactions between the liquid droplets and the channel walls are occurring in Figure 8d as observed by Gopalan and Kandlikar [13].

4. Conclusions

In a channel flooding situation which is one of the most important issues in PEM fuel cell studies, the dynamics of the liquid water slug inside the bent GCs is investigated via the VOF method. The water removal characteristics in the GCs with one rectangular and two trapezoidal cross sections are compared. The effects of the contact angle of the top and side walls, the contact angle of the GDL surface, and the air inlet velocity are studied based on the temporal evolution of gas-liquid interface, the WVF, and the WCR of the GDL surface. The main conclusions can be summarized as follows:
  • Considering both of the WVF and the WCR for the GDL surface, the trapezoidal channel with open angles of 60° provides the most favorable performance in a channel flooding situation. While changing the top and side wall contact angles from 45° to 120°, the hydrophobic contact angle of 120° shows the best results.
  • Among the three GDL contact angles of 90°, 110°, and 140°, the hydrophobic GDL contact angle of 140° provides the most favorable water removal characteristics in a channel flooding situation.
  • For all the three channel cross-sectional shapes, the water removal rate increases and the liquid water interface shows more complex patterns as the air inlet velocity increases.

Acknowledgments

This work was supported by the Human Resources Development program (No. 20154030200940) of the Korea Institute of Energy Technology Evaluation and Planning (KETEP) grant funded by the Korean Government Ministry of Trade, Industry and Energy.

Author Contributions

Jin Hyun Kim performed the numerical simulations. Gwang Goo Lee analyzed the data. Woo Tae Kim conceived the idea. All authors contributed to the paper writing.

Conflicts of Interest

The authors declare no conflict of interest.

References

  1. Wang, C.; Wang, S.; Peng, L.; Zhang, J.; Shao, Z.; Huang, J.; Sun, C.; Ouyang, M.; He, X. Recent progress on the key materials and components for proton exchange membrane fuel cells in vehicle applications. Energies 2016, 9, 603–641. [Google Scholar] [CrossRef]
  2. Anderson, R.; Zhang, L.; Ding, Y.; Blanco, M.; Bi, X.; Wilkinson, D.P. A critical review of two-phase flow in gas flow channels of proton exchange membrane fuel cells. J. Power Sources 2010, 195, 4531–4553. [Google Scholar] [CrossRef]
  3. Vinh, N.D.; Kim, H.-M. Comparison of numerical and experimental studies for flow-field optimization based on under-rib convection in polymer electrolyte membrane fuel cells. Energies 2016, 9, 844–860. [Google Scholar] [CrossRef]
  4. Liu, X.; Guo, H.; Ye, F.; Ma, C.F. Water flooding and pressure drop characteristics in flow channels of proton exchange membrane fuel cells. Electrochim. Acta 2007, 52, 3607–3614. [Google Scholar] [CrossRef]
  5. Grimm, M.; See, E.J.; Kandlikar, S.G. Modeling gas flow in PEMFC channels: Part I—Flow pattern transitions and pressure drop in a simulated ex situ channel with uniform water injection through the GDL. Int. J. Hydrog. Energy 2012, 37, 12489–12503. [Google Scholar] [CrossRef]
  6. Wan, Z.; Chang, H.; Shu, S.; Wang, Y.; Tang, H. A review on cold start of proton exchange membrane fuel cells. Energies 2014, 7, 3179–3203. [Google Scholar] [CrossRef]
  7. Ferreira, R.B.; Falcão, D.S.; Oliveira, V.B.; Pinto, A.M.F.R. Numerical simulations of two-phase flow in proton exchange membrane fuel cells using the volume of fluid method: A review. J. Power Sources 2015, 277, 329–342. [Google Scholar] [CrossRef]
  8. Owejan, J.P.; Trabold, T.A.; Jacobson, D.L.; Arif, M.; Kandlikar, S.G. Effects of flow field and diffusion layer properties on water accumulation in a PEM fuel cell. Int. J. Hydrog. Energy 2007, 32, 4489–4502. [Google Scholar] [CrossRef]
  9. Zhu, X.; Liao, Q.; Sui, P.C.; Djilali, N. Numerical investigation of water droplet dynamics in a low-temperature fuel cell microchannel: Effect of channel geometry. J. Power Sources 2010, 195, 801–812. [Google Scholar] [CrossRef]
  10. Manso, A.P.; Marzo, F.F.; Barranco, J.; Garikano, X.; Mujika, M.G. Influence of geometric parameters of the flow fields on the performance of a PEM fuel cell. A review. Int. J. Hydrog. Energy 2012, 37, 15256–15287. [Google Scholar] [CrossRef]
  11. Rath, C.D.; Kandlikar, S.G. Liquid filling in a corner with a fibrous wall—An application to two-phase flow in PEM fuel cell gas channels. Colloid Surf. A 2011, 384, 653–660. [Google Scholar] [CrossRef]
  12. Lu, Z.; Rath, C.; Zhang, G.; Kandlikar, S.G. Water management studies in PEM fuel cells, Part IV: Effects of channel surface wettability, geometry and orientation on the two-phase flow in parallel gas channels. Int. J. Hydrog. Energy 2011, 36, 9864–9875. [Google Scholar] [CrossRef]
  13. Gopalan, P.; Kandlikar, S.G. Effect of channel materials and trapezoidal corner angles on emerging droplet behavior in proton exchange membrane fuel cell gas channels. J. Power Sources 2014, 248, 230–238. [Google Scholar] [CrossRef]
  14. Shah, M.M.; Kandlikar, S.G. Water emergence from the land region and water-sidewall interactions in proton exchange membrane fuel cell gas channels with microgrooves. J. Power Sources 2015, 297, 127–139. [Google Scholar] [CrossRef]
  15. Concus, P.; Finn, R. Capillary surfaces in a wedge differing contact angles. Microgravity Sci. Technol. 1994, 7, 152–155. [Google Scholar]
  16. Turhan, A.; Kim, S.; Hatzell, M.; Mench, M.M. Impact of channel wall hydrophobicity on through-plane water distribution and flooding behavior in a polymer electrolyte fuel cell. Electrochim. Acta 2010, 55, 2734–2745. [Google Scholar] [CrossRef]
  17. Ding, Y.; Bi, H.T.; Wilkinson, D.P. Three-dimensional numerical simulation of water droplet emerging from a gas diffusion layer surface in micro-channels. J. Power Sources 2010, 195, 7278–7288. [Google Scholar] [CrossRef]
  18. Lorenzini-Gutierrez, D.; Kandlikar, S.G.; Hernandez-Guerrero, A.; Elizalde-Blancas, F. Residence time of water film and slug flow features in fuel cell gas channels and their effect on instantaneous area coverage ratio. J. Power Sources 2015, 279, 567–580. [Google Scholar] [CrossRef]
  19. Jo, J.H.; Kim, W.T. Numerical simulation of water droplet dynamics in a right angle gas channel of a polymer electrolyte membrane fuel cell. Int. J. Hydrog. Energy 2015, 40, 8368–8383. [Google Scholar] [CrossRef]
  20. Flipo, G.; Josset, C.; Bellettre, J.; Auvity, B. Clarification of the surface wettability effects on two-phase flow patterns in PEMFC gas channels. Int. J. Hydrog. Energy 2016, 41, 15518–15527. [Google Scholar] [CrossRef]
  21. Owejan, J.P.; Gagliardo, J.J.; Sergi, J.M.; Kandlikar, S.G.; Trabold, T.A. Water management studies in PEM fuel cells, Part I: Fuel cell design and in situ water distributions. Int. J. Hydrog. Energy 2009, 34, 3436–3444. [Google Scholar] [CrossRef]
  22. ANSYS Inc. Ansys Fluent Theory Guide Release 14.0; ANSYS Inc.: Canonsburg, PA, USA, 2011. [Google Scholar]
  23. Brackbill, J.U.; Kothe, D.B.; Zamach, C. A continuum method for modeling surface tension. J. Comput. Phys. 1992, 100, 335–354. [Google Scholar] [CrossRef]
  24. Youngs, D.L. Time-dependent multi-material flow with large fluid distortion. In Numerical Methods for Fluid Dynamics; Morton, K.W., Baines, M.J., Eds.; Academic Press: New York, NY, USA, 1982. [Google Scholar]
  25. Park, S.; Lee, J.-W.; Popov, B.N. A review of gas diffusion layer in PEM fuel cells: Materials and designs. Int. J. Hydrog. Energy 2012, 37, 5850–5865. [Google Scholar] [CrossRef]
  26. Gurau, V.; Bluemle, M.J.; De Castro, E.S.; Tsou, Y.-M.; Adin Mann, J., Jr.; Zawodzinski, T.A., Jr. Characterization of transport properties in gas diffusion layers for proton exchange membrane fuel cells 1. Wettability (internal contact angle to water and surface energy of GDL fibers). J. Power Sources 2006, 160, 1156–1162. [Google Scholar] [CrossRef]
  27. Pekula, N.; Heller, K.; Chuang, P.A.; Turhan, A.; Mench, M.M.; Brenizer, J.S.; Ünlü, K. Study of water distribution and transport in a polymer electrolyte fuel cell using neutron imaging. Nucl. Instrum. Meth. A 2005, 542, 134–141. [Google Scholar] [CrossRef]
  28. Trabold, T.A.; Owejan, J.P.; Jacobson, D.L.; Arif, M.; Huffman, P.R. In situ investigation of water transport in an operating PEM fuel cell neutron radiography: Part 1—Experimental method and serpentine flow field results. Int. J. Heat Mass Transf. 2006, 49, 4712–4720. [Google Scholar] [CrossRef]
  29. Le, A.D.; Zhou, B.; Shiu, H.-R.; Lee, C.-I.; Chang, W.-C. Numerical simulation and experimental validation of liquid water behaviors in a proton exchange membrane fuel cell cathode with serpentine channels. J. Power Sources 2010, 195, 7302–7315. [Google Scholar] [CrossRef]
Figure 1. Three dimensional computational domains and grids considered in the present study: (a) rectangular channel cross section (REC); (b) trapezoidal channel cross sections with open angles of 50° (T50) and 60° (T60); (c) REC; and (d) T60.
Energies 10 00748 g001
Figure 2. Time evolution of the liquid water interface in the bent GC for the REC configuration ( V i n , a i r = 2.5 m s−1, θ g = 140°): (a) θ t s = 45°; (b) θ t s = 65°; (c) θ t s = 85°; (d) θ t s = 105°; (e) θ t s = 120°.
Energies 10 00748 g002
Figure 3. Time evolution of the liquid water interface in the bent GC for the T50 configuration ( V i n , a i r = 2.5 m s−1, θ g = 140°): (a) θ t s = 45°; (b) θ t s = 65°; (c) θ t s = 85°; (d) θ t s = 105°; (e) θ t s = 120°.
Energies 10 00748 g003aEnergies 10 00748 g003b
Figure 4. Time evolution of the liquid water interface in the bent GC for the T60 configuration ( V i n , a i r = 2.5 m s−1, θ g = 140°): (a) θ t s = 45°; (b) θ t s = 65°; (c) θ t s = 85°; (d) θ t s = 105°; (e) θ t s = 120°.
Energies 10 00748 g004aEnergies 10 00748 g004b
Figure 5. Effect of the top and side wall contact angle on the time evolution of (a) the WVF for the REC, (b) the GWCR for the REC, (c) the WVF for the T50, (d) the GWCR for the T50, (e) the WVF for the T60, and (f) the GWCR for the T60 ( V i n , a i r = 2.5 m s−1, θ g = 140°).
Energies 10 00748 g005aEnergies 10 00748 g005b
Figure 6. Effect of the GDL surface contact angle on the time evolution of the liquid water interface in the bent GCs ( V i n , a i r = 2.5 m s−1, θ t s = 65°): (a) θ g = 90° (REC); (b) θ g = 110° (REC); (c) θ g = 140° (REC); (d) θ g = 90° (T50); (e) θ g = 110° (T50); (f) θ g = 140° (T50); (g) θ g = 90° (T60); (h) θ g = 110° (T60); (i) θ g = 140° (T60).
Energies 10 00748 g006
Figure 7. Effect of the air inlet velocity on the time evolution of the liquid water interface in the bent GC ( θ g = 140°, θ t s = 65°): (a) V i n , a i r = 1.0 m s−1 (REC); (b) V i n , a i r = 2.5 m s−1 (REC); (c) V i n , a i r = 5.0 m s−1 (REC); (d) V i n , a i r = 1.0 m s−1 (T50); (e) V i n , a i r = 2.5 m s−1 (T50); (f) V i n , a i r = 5.0 m s−1 (T50); (g) V i n , a i r = 1.0 m s−1 (T60); (h) V i n , a i r = 2.5 m s−1 (T60); and (i) V i n , a i r = 5.0 m s−1 (T60).
Energies 10 00748 g007
Figure 8. Effect of the GDL surface contact angle on (a) the WVF & (b) the GWCR ( V i n , a i r = 2.5 m s−1, θ t s = 65°) and effect of the air inlet velocity on (c) the WVF & (d) the GWCR ( θ g = 140°, θ t s = 65°).
Energies 10 00748 g008

