Abstract
In the context of the global potential energy crisis and aggravating regional environmental pollution, Chinese photovoltaic power generation still faces the key problems of sustainable development, even given its favorable background in large-scale exploitation. Scientific evaluation of the comprehensive efficiency of photovoltaic power generation is of great significance because it will improve investment decision-making and enhance management level, evaluate the development conditions of photovoltaic power generation and then promote sustainable development capability. The concept of “comprehensive efficiency” is proposed in this paper on the basis of the resource development of solar energy and exploitation of photovoltaic power generation. A system dynamics model is used to study the conduction mechanism of the comprehensive efficiency of photovoltaic power generation. This paper collects data from 2005 to 2015 as research models, establishes the evaluation model of the comprehensive efficiency of photovoltaic power generation and conducts empirical analysis based on a super-efficient data envelopment analysis (SE-DEA) model. With the evaluation results, this paper puts forward political suggestions as to the optimization of the comprehensive efficiency of photovoltaic power generation. The research results may provide policy-oriented references on the sustainable development of photovoltaic power generation and give theoretical guidance on the scientific evaluation and diagnosis of photovoltaic power generation efficiency.
1. Introduction
In recent years, faced with the slowdown of the global economy and energy consumption, the outputs of fossil fuel appeared to decrease; however, the data show that crude oil, natural gas and the raw coal account for 85.9% of primary energy consumption, among which crude oil accounts for 32.9%, and crude oil is still the most important energy source []. According to the prediction of the International Energy Agency (IEA), global crude oil can be exploited for 45 years, and coal can be exploited for 230 years. Moreover, at this time of an unavoidable crisis of energy, the usage of fossil energy will lead to the increase of carbon dioxide in the atmosphere, which to some extent will bring about the environmental problems of thawing of frozen soil, ice-shelves collapsing, and regional haze pollution. In order to deal with the increasingly energy crisis and environmental pollution, popularizing and applying solar energy and other renewable clean energy comes to the fore [].
Solar energy, as a desirable renewable energy source, boosts properties such as common existence, availability and cleanness, which enables the photovoltaic power generation to be highly regarded and enjoy rapid development. According to the IEA and National Energy Administration (NEA), at the end of 2015, global photovoltaic total installed capacity has amounted to 227 gigawatts (GW), with a 20.23% year-on-year increase. The photovoltaic industry in the global market has undergone a stable increase. According to IEA’s predictions, the scale and tendency from 2016 to 2020 is listed in the Figure 1: the average growth rate in five years will reach 13.18%, the future market will improve and there are bright development prospects.
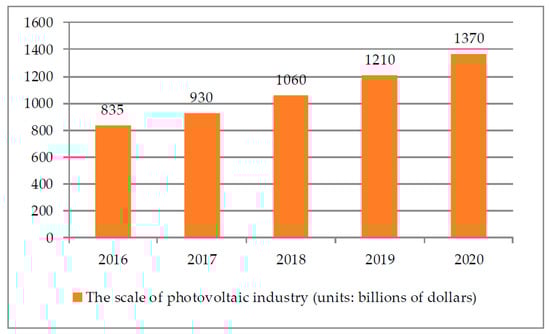
Figure 1.
The scale and tendency of global photovoltaic industry from 2016 to 2020 (Data from IEA).
Compared with Europe and America, photovoltaic industry in China started late. However, with the policies of the “The 12th Five-Year Plan” and “The 13th Five-Year Plan”, which pay much attention to the photovoltaic industry, China ends up with 43.18GW accumulated installed capacity that enabled it to become the country with the biggest photovoltaic power generation capacity in the world in 2015 []. The newly installed capacity in the world and China from 2011 to 2015 is shown in the Figure 2.
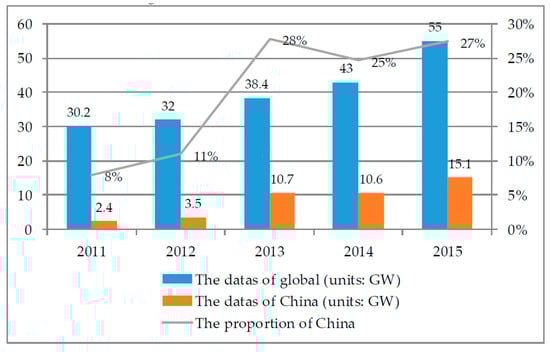
Figure 2.
The comparison between China and World’s new installed capacity (Data from IEA and NEA).
From the Figure, it can be seen that the proportion of newly increased installed capacity in China increased from 8% in 2011 to 27% in 2015 with significant growth rate. Since 2013, China has maintained the record for adding a new installed capacity of over 10 million for 4 consecutive years; the Chinese photovoltaic power generation industry presents great potential.
In recent years, the development of Chinese photovoltaic power generation has made great progress; however, the problems of photovoltaic power generation itself restrict the efficient popularization and scale usage []. Based on the comparison between China and other countries and the summary of the current situation of photovoltaic industry, we can conclude that the main issues of Chinese photovoltaic power generation are as follows:
- (1)
- The usage of photovoltaic power generation is heavily influenced by climate. The energy of photovoltaic power generation comes directly from the sunlight. Unstable factors of solar energy, together with the technical limit mean that the utilization rate of photovoltaic power generation only 50–70% at present. Photovoltaic power generation relies heavily on climate, which will lead to insufficient comprehensive efficiency from the source [].
- (2)
- The efficiency of photovoltaic power generation is low. Compared with other electricity generation, the equipment of photovoltaic power is only used for nearly 2000 h per year. However, the equipment of thermal power generation can be used over 5000 h; the equipment of emerging hydro-electric generation also can be used for 3500 h. Influenced by the distribution of solar energy and reverse distribution of electricity demand, light discarding in the northwest and supply shortage in the southern area reveal the low comprehensive efficiency of the Chinese photovoltaic power generation industry [,].
- (3)
- The cost of photovoltaic power generation is comparatively high. Compared with others, the cost of generating 1 Kw thermal power is 0.4–0.5 yuan, the cost of hydro-electric generation is 0.2–0.3 yuan. However, the cost of generating 1 Kw photovoltaic electricity is more than 1 yuan []. In respect to the cost of transporting electricity to the power rid, compared with the thermal and hydro-power, photovoltaic electricity is comparatively low. Photovoltaic power generation does not boost economic advantages due to difference in cost. Considering its economic performance, the photovoltaic industry fails to compete with conventional energy sources [].
To summarize, under the influence of climatic environment, installed capacity and on-grid energy of photovoltaic power generation is far from the ideal situation due to the bottlenecks of low systemic efficiency and high generation cost. The low efficiency of exploiting and using is a key factor that restricts the development of photovoltaic power generation. Scientific evaluation of photovoltaic power generation is conducive for judging the development condition, enhancing investment decision-making and enhancing the benefit level []. The input in the usage of resources, exploited installed capacity, the usage of land, the cost of construction and operation, technology development and other aspects is studied in this paper. Moreover, the output variation of on-grid photovoltaic electricity is analyzed. On this basis, the paper defines that the photovoltaic power generation comprehensive efficiency covers three main parts, namely: resources efficiency, exploitation efficiency and usage efficiency, and the comprehensive efficiency is used to measure the photovoltaic power generation overall level of exploitation and use. By exploring the conducting mechanism of photovoltaic power generation comprehensive efficiency, we constructed the analytic structure of investments and outputs of comprehensive efficiency, introducing a reasonable evaluation model, and undertaking scientific evaluation of the photovoltaic power generation comprehensive efficiency in China from 2005 to 2015. Then we proposed policy suggestions for improving the efficiency of future photovoltaic power generation on the basis of evaluation results.
In Section 1, this paper analyzes the current situation of the development of photovoltaic power generation in the world and China, reveals the bottleneck of the current development, and puts forward the significance of evaluating the comprehensive efficiency of photovoltaic power generation. Section 2 summarizes the research situation regarding comprehensive efficiency, and introduces the model and method adopted in the efficiency evaluation. Section 3 is about empirical analysis, which constructs the input-output index based on the analysis of the comprehensive efficiency conduction mechanism using the system dynamics. Data of Chinese photovoltaic power generation efficiency from 2005 to 2015 is used as the research object. On the basis of the hierarchical cluster analysis, the efficiency evaluation method based on SE-DEA model is constructed and the empirical analysis is carried out. Section 4 proposes policy suggestions on photovoltaic power generation comprehensive efficiency improvement based on the analysis of evaluation results. Section 5 concludes the discussion.
2. Materials and Methods
2.1. Literature Review
Solar photovoltaic power generation, as the renewable energy source with most potential, has received wide attention internationally; the efficient utilization of solar energy has been discussed []. Comprehensive efficiency of photovoltaic power generation will directly influence the operating capability and electricity output [,]. At present, the research on photovoltaic power generation comprehensive efficiency include: analysis of influence factors, optimization of a technological path, design of political assurance and other details.
From the perspective of influential factors, the change in solar energy supply as a result of natural environmental differences is the primary factor that influences the comprehensive efficiency of photovoltaic power generation []. Geographic latitude, solar elevation angle, the transparency of atmosphere, altitude, surrounding architecture and the shelter from trees all exert influence on the energy and quality of solar energy [,,]. The technical issue of photovoltaic equipment is still a key factor in comprehensive efficiency improvement. The energy efficiency ratio will be comprehensively improved by decreasing the loss of the current transformer, optimizing the transformation efficiency of photovoltaic array and enhancing the overall efficiency of inverter [,]. In addition, Chiu and Chang conclude that the condition of photovoltaic equipment, the load situation of photovoltaic power generation system, operation capability and control level are also key factors that influence the comprehensive efficiency of photovoltaic power generation [,].
As for the influence factors, Bao et al. [] advocate that photovoltaic power generation efficiency improvement can be achieved by technical methods. Then, we can guarantee steady and sustainable development of photovoltaic electricity generation industry. Tavares et al. and Singh et al. [,] put forward the idea that we can promote photovoltaic system comprehensive efficiency by the methods of tracing solar energy, max power point tracing technology, islet disturbance recognition technology and other aspects. Almonacid et al. [] found that a soft cut-in grid-connection would, to some extent, decrease the electricity grid impact created by photovoltaic power generation. In regard to indemnificatory policy research, Algieri et al. [] proposed that we can target the photovoltaic industry precisely by combining it with a real situation. Granić et al. and Rohankar et al. [,] put forward the proposal that government should invest more and provide more support for related industry by financial or taxation methods. Hence, we can create a larger market place for the photovoltaic power generation industry, just as Curreli et al. proposed [].
2.2. Research Method
Efficiency evaluation is an important basis for efficiency optimization. Only when we consider the overall analysis based on the scientific evaluation can we find targeted optimization direction []. Currently, the most common research methods in this field are: synthetic index method, analytic hierarchy process, fuzzy comprehensive evaluation method and TOPSIS (Technique for Order Preference by Similarity to an Ideal Solution), etc. []. Among these, the non-parametric method which takes DEA as the efficiency assessment is widely used in the field.
2.2.1. The Method of SE-DEA
Data Envelopment Analysis (DEA) is a nonparametric statistical method that uses the mathematical programming model to evaluate whether the same type of multi-input and multi-output decision-making unit is technically effective []. After determining the input-output index, a decision-making unit is projected to the front of the DEA by mathematical programming method and we can judge its effectiveness by comparing the deviation of different decision-making unit from the DEA front, which is scientific, objective and easy to handle. The basic C2R model in traditional DEA is only applicable to determine whether the jth decision-making unit is effective [,]. However, in practical application, a large number, or possibly even all of the decision-making units may be effective, and then we cannot evaluate or sort the efficiency of all the decision-making units. To improve this defect, the super-efficient data envelopment analysis model (SE-DEA) came into being.
SE-DEA is a new method originating from the traditional DEA model which is put forward by Anderen and Petersen. It overcomes the disadvantages of traditional model that can only recognize the effectiveness of decision-making unit, but fails to rank and compare. The super efficiency value is no longer limited to the range from 0 to 1, and a value greater than or equal to 1 is obtained. In this way, we can sort and select the best ones from these decision-making units and then make a scientific evaluation [,]. The model is listed below:
If the amount of the decision-making units is n, the data of input and output are (,) (j = 1, 2, ..., n). For the (1 ≤ ≤ n) decision-making unit, the expression of the SE-DEA of decision-making unit is:
Among these, θ is the super efficiency value of the j0 decision-making unit; ε is the Archimedes dimensionless; n is the number of decision-making units, every decision-making unit includes “m” input variables and “s” output variables; and respectively are the slack variables of input and output, λ is the weight coefficient of the input and output index. When θ ≥ 1 and = = 0, the decision-making unit is effective, the θ is bigger, the effectiveness is more powerful; when θ ≥ 1, and ≠ ≠ 0, the decision-making unit is weakly effective; when θ < 1, and ≠ ≠ 0, the decision-making unit is invalid [].
2.2.2. The Method of Hierarchical Cluster Analysis
Hierarchical cluster analysis is a type of technology with a multivariate numerical analytical method, by measuring the distances between the samples to confirm their similarities []. It uses the fact that the samples that are close to each other cluster more quickly than those that are far away from each other. The Euclidean distance calculation method used to measure the distance between samples is:
In the formula, , the distance matrix is:
In the formula, , is the distance between i and j.
According to the nearest distance matrix, we can combine the closest samples. We can adopt the sum of squares of deviations to the cluster category based on Euclidean distance. When and are merged into , the recursion formula of distance is:
In the formula, represents respectively the sample number of .
2.2.3. Combined Method of SE-DEA and Hierarchical Cluster Analysis
SE-DEA has advantages in the field of scientific evaluation without estimating parameters and hypothesis of weight, but it requires the decision-making unit to be no less than the twice of the sum of the input-output system. The photovoltaic power generation has a short history in China, which leads to the short span of related statistical data. When evaluating the change of comprehensive efficiency of decision-making units by year, it is unavoidable to face the issue that the number of decision-making units is smaller than that in the input-output index. Nowadays, the majority of researches adopt the method of combining PCA (Principal Components Analysis) and DEA, by means of effective dimensionality reduction, eliminating the disturbance of unrelated factors so as to make up the shortfall []. On the basis of analysis of all kinds of evaluation methods, in this paper, we are going to finish the early-stage integration of input-output index by hierarchical cluster analysis, paving the way for SE-DEA.
The research methods of each model in this paper are shown in Figure 3.
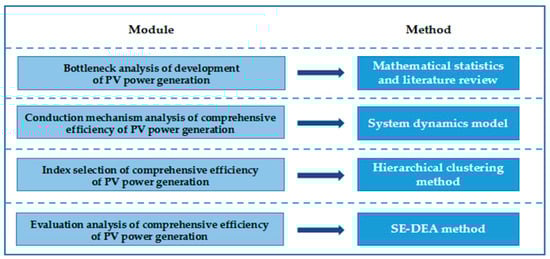
Figure 3.
The contents and methods of the research in this paper.
3. Empirical Analysis
3.1. The Concept of Comprehensive Efficiency of Photovoltaic Power Generation
Photovoltaic power generation is a dynamic process in which solar energy is collected to produce electricity. It relates to energy, economy, environment and other factors. Therefore, the photovoltaic power generation efficiency cannot be measured by a single-dimension factor. Moreover, its significant relationship between resource development level, equipment utilization, power production capacity and other aspects determines its comprehensiveness. Therefore, based on the analysis of the internal structure and external environment of PV power generation, taking the importance and effect of influence factor of efficiency into account, this paper puts forward the concept of comprehensive efficiency of photovoltaic power generation and divides the comprehensive efficiency into three parts: resource efficiency, development efficiency and utilization efficiency so as to carry out the targeted analysis of conduction mechanism.
3.2. The Analysis of Conduction Mechanism of Photovoltaic Power Generation Comprehensive Efficiency Based on System Dynamics
3.2.1. The Applicability of System Dynamics to Comprehensive Efficiency Conduction Mechanism
System dynamics analyzes and reveals the causal relationship between the factors of inner components, explores the main factors that influence the system function and provides evidence for targeted improvement of the system operation [,]. Photovoltaic power generation refers to the whole process from solar energy utilization to electricity output, so the comprehensive efficiency is a complex analysis system which takes demand and supply, plans and technology and other factors into account. If we apply system dynamics to do research, we can divide system science into several subsystems and reveal the positive and negative causal relationship between different system elements and the subsystems’ impacts on photovoltaic power generation. Thus, we can find the key factors that influence the photovoltaic power generation comprehensive efficiency on the basis of conduction mechanism between different factors and provide a reference for evaluation research of determining input-output index. Thus, system dynamics is applicable for the conduction mechanism research of photovoltaic power generation comprehensive efficiency; based on the analysis of the system dynamics we can determine the internal and external environment of photovoltaic power generation. According to the conduction direction and intensity of conduction mechanism, we can specify the key indexes that will influence photovoltaic power generation comprehensive efficiency.
3.2.2. The Figure of Conduction Mechanism
Based on the existing research results, according to the basic process of photovoltaic power generation from resources supply to output utilization, this paper divides the photovoltaic power generation comprehensive efficiency into: resources efficiency, development efficiency and utilization efficiency. We analyzed efficiency from the following perspectives: installed capacity, hours of utilization and on-grid electricity. The conduction mechanism of the comprehensive efficiency of photovoltaic power generation based on the system dynamics structure is shown in Figure 4.
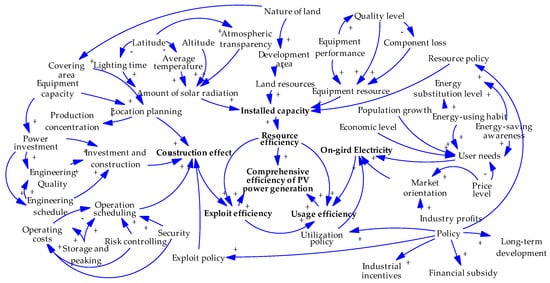
Figure 4.
The analysis graphics of conduction mechanism of the comprehensive efficiency of photovoltaic power generation.
From Figure 4, we can see that resource efficiency, development efficiency and utilization efficiency measure photovoltaic power generation comprehensive efficiency from the perspective of resource investment, planning construction and construction and electricity utilization respectively. Moreover, they are all in a positive relationship with comprehensive efficiency. Combined action of three efficiencies contributes to the optimal comprehensive efficiency of photovoltaic power generation.
3.2.3. Conduction Analysis
This section may be divided by subheadings. It should provide a concise and precise description of the experimental results and their interpretation as well as the experimental conclusions that can be drawn.
(1) The Analysis of Resource Efficiency
The resource efficiency of photovoltaic power generation depends on the installed capacity; and the measuring standard is the ratio of resource utilization of the developed installed capacity to the utilization of developing installed capacity. The main conduction factors in the utilization of an installed machine are: energy resource, land resource, equipment resource and resource policy. Among these, solar radiation is the main resource to generate photovoltaic electricity. The land can be exploited. Land property is the representative factor of land resources. The equipment resources can be influenced by: equipment performance, quality level, loss of components and other factors.
(2) The Analysis of Development Efficiency
The development efficiency of photovoltaic power generation is represented by the utilization hours. More utilization hours lead to higher development efficiency. The index is the result of comprehensive conduction of four indexes, namely: the level of location planning, investment and construction, operation and dispatching and development policy. Moreover, this reflects the development capability of photovoltaic power generation in the context of considering resource conditions. We did not make a detailed analysis of technical factors since this is not the research object. The covering area and equipment capacity are key factors that we need to consider when we make location planning. The result of the location depends on the level of production centralization. Investment in the power source and operation cost are economic factors that influence the development efficiency.
(3) The Analysis of Utilization Efficiency
The on-grid electricity decides the utilization efficiency of photovoltaic power generation. The measuring standard is the ratio of generated electricity to the maximum electricity that can be used. The standard is influenced by the needs of the user, the direction of the market and the utilization policy. Among these, the users’ habits of energy use and their sense of conservation determines the users’ behavior in choosing photovoltaic power generation. This reflects the situation that photovoltaic power has taken place of other energies; the price of electricity and the profits of the industry are key factors that influence the photovoltaic power generation market.
(4) The Analysis of Policy
From Figure 4, we can see that policy is the common conduction factor in the comprehensive efficiency of photovoltaic power generation. The resources policies that will have an impact on resource efficiency include: utilization planning of solar energy, standard of project land use, tax exemption of imported equipment, and so on. Exploitation policies refer to the construction of demonstration projects, subsidies for the initial investment, and other details. Utilization policies cover: electricity-selling-side reform, market transactions, subsidy of on-grid electricity price, etc. The three parts of policy can be summed up and defined as: industrial encouragement, financial subsidy and long-term development.
3.3. The Evaluation Index of Photovoltaic Power Generation Comprehensive Efficiency
3.3.1. The Selection of the Index
China’s annual solar radiation changes slightly, so if we measure the monthly changes then we oppose the goal of taking annual changes as the research object. Moreover, there are some difficulties in quantifying the indexes of the quality of equipment performance and projects. Moreover, location planning and peak-regulation of stored energy are not the key study objects of this paper. Thus, on the basis of fully considering the result of the conduction mechanism and the level of data acquisition, we proposed the evaluation index of photovoltaic power generation comprehensive efficiency and this shown in Table 1.

Table 1.
The evaluation index of comprehensive efficiency.
3.3.2. Data Collection
Photovoltaic power generation has a short development history in China. Standardization and continuity of related data disclosure are poor. So we adopted methods such as tendency analysis and ratio analysis to present data which is difficult to collect on a practical basis after we widely collected data. This kind of data has no great impact on the results, and the authenticity of the data can be guaranteed. The data that is unmarked in this paper comes from the NEA.
(1) The Index of Installed Capacity
Among input indexes, installed capacity is the most important factor that influences the comprehensive efficiency of photovoltaic power generation. The newly installed capacity and cumulative installed capacity not only reflect the change in scale of Chinese photovoltaic power generation industry in the past 10 years, but also provide evidence for calculating other indexes. The data of the newly installed capacity and cumulative installed capacity of Chinese photovoltaic power generation from 2005 to 2015 are shown in Figure 5.
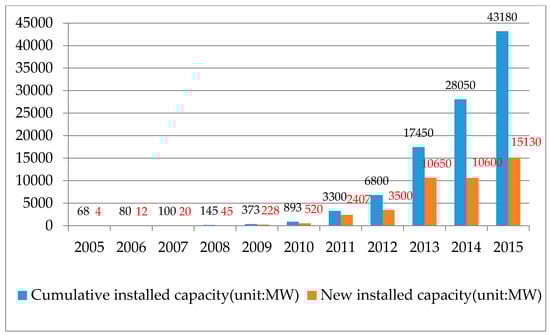
Figure 5.
The changes of cumulative and new installed capacity of photovoltaic power generation in China from 2005 to 2015 (Data from NEA).
(2) Cost Index
As for investment cost and operation cost, this paper uses the data of photovoltaic electricity investment in the official report published by the China Electricity Council (CEC) to show the investment costs of photovoltaic power generation. With regard to operation cost, according to the results of an official research report that analyzes the Chinese representative photovoltaic power stations, the depreciation expenses are counted by the crystalline silicon photovoltaic modules, we take into account the Chinese tax law and fixed assets nature of the ground photovoltaic power stations and their conditions of use. Depreciation years are counted in 20-year increments, the ratio of the remaining value is 5%, the counting process of the depreciation cost is shown in Table 2.
Table 2.
The calculation process of depreciation cost of Chinese photovoltaic power generation from 2005 to 2015.
In addition, repair costs are mostly used for dealing with equipment failure of the combiner box, inverter and other equipment. The average repair cost of a 30 MW photovoltaic power station is 880 thousand yuan, the calculated repair cost is 1400 yuan/MW. Water washing and manual scrubbing are major cleaning methods for modules. The cleaning cost of a 20 MW photovoltaic power station is 210 thousand yuan with 11 cleaning sessions per year. The price of cleaning is 10,500 yuan/MW. If a 10 MW power station needs 10 managers for a year, based on the Chinese average salary, the salaries and profits of operation personnel are 100,000 yuan/MW; other fees which include manufacturing costs, management costs and sales expenses are nearly 25,000 yuan/MW. The structure and the condition of operation costs are shown in Figure 6.
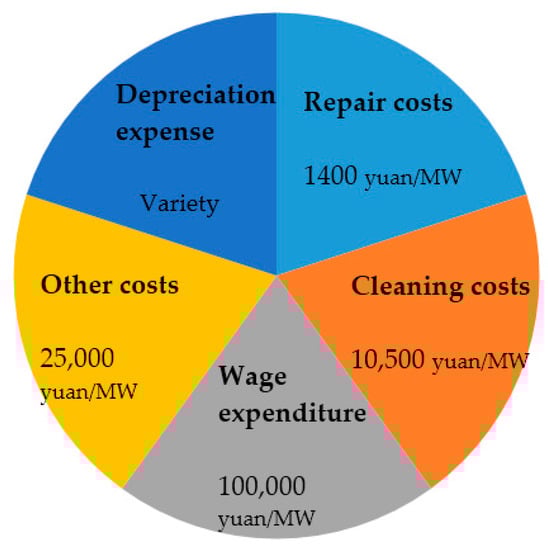
Figure 6.
The structure of operation costs of photovoltaic power generation.
Without taking into account the depreciation expense, the operation expense per unit of photovoltaic power generation is the sum of the other four expenses, which is 136,900 yuan (Repair costs + Cleaning costs + Wage expenditure + Other costs = 1400 + 10,500 + 100,000 + 25,000 = 136,900 yuan); thus, the calculation of the operation cost of photovoltaic power generation is shown in Table 3.
Table 3.
The calculation process of operation costs from 2005 to 2015.
(3) The Index of the Covering Area
Project land use of photovoltaic power generation is influenced by the following factors:
- Installation method. The installation methods are mainly divided into fixed, flat single axis, oblique single axis, and double axis. Different installation methods vary in covering areas.
- Grid-connected voltage grade. Different grid-connected voltage grades including 10 kV, 35 kV, 66 kV, 110 kV, 220 kV, 330 kV have different covering areas.
- The transformation efficiency of photovoltaic modules. Powers of commonly used photovoltaic modules are 260 W, 265 W, 270 W. Different latitudes lead to different transformation efficiency. The values are shown in Table 4.
Table 4. The transformation efficiency of photovoltaic modules with different powers at different latitudes.
Comprehensively considering the Chinese geographical location, the characteristics of voltage and development level of the photovoltaic industry, this paper takes the covering area of a fixed 265 W photovoltaic power generation system as the average. It is located at 40° N and the voltage is 66 kV. According to the standard of The Controlling Index of Engineering Project Land Use of Photovoltaic Power Station published by the Ministry of Land and Resources, we used an interpolation method for our calculations, and the results showed that the covering area of the photovoltaic power station is 220 thousand square meters per 10 MW. The covering area of photovoltaic power generation from 2005 to 2015 is shown in Table 5.
Table 5.
The calculation process of the covering area of Chinese photovoltaic power generation.
(4) Other Indexes
The energy substitution rate that is proposed in this paper means the condition that solar energy replaces other energies. The ratio of on-grid photovoltaic electricity to total on-grid electricity is used to measure the substitution rate. Production centralization refers to the regional distribution condition of the photovoltaic power generation industry and it is determined by the ratio of provinces with photovoltaic power generation to the total provinces of China (except Hong Kong, Macao and Taiwan) and the ratio of installed capacity to the total installed capacity of each province. The regional proportion of photovoltaic cumulative installed capacity of 2015 is shown in Figure 7. From 2005 to 2015, Chinese photovoltaic industry expanded in terms of production regions. At first, it was only distributed in northwest areas such as Qinghai and Gansu and then it spread over all provinces.
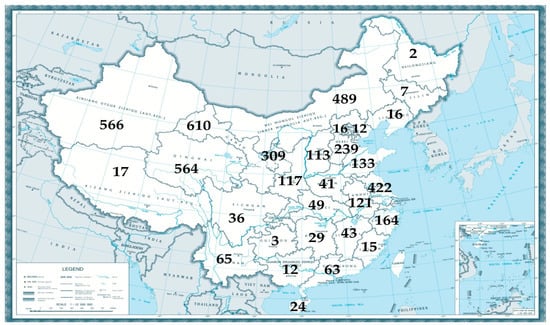
Figure 7.
The distribution of accumulated installed capacity in every province in 2015.
3.3.3. Data Presentation
The reduced input-output data is shown in Table 6.
Table 6.
The summarizing data of the input-output index of Chinese photovoltaic power generation from 2005 to 2015.
3.4. The Research of Photovoltaic Power Generation Comprehensive Efficiency Evaluation
3.4.1. The Selection of Input Indexes Based on the Hierarchical Cluster Method
SE-DEA models have requirements for the quantitative relationship between input-output index and decision-making unit. The decision-making unit in the above table is from 2005 to 2015 and the total amount is 11, which is less than twice the total of input-output index. Thus, this paper turns to the hierarchical cluster method to select the input-output index, eliminating the index that has little correlation with photovoltaic power generation comprehensive efficiency thus it can satisfy the operation requirements of SE-DEA models as well as improve the effectiveness of the data.
(1) The standardization analysis of data
With the help of the SPSS (22.0, IBM, Armonk, NY, USA), a hierarchical cluster analysis is carried out. At first, we imported the input index from 2005 to 2015 to the data editor, and made a descriptive statistical analysis about the seven input indexes based on discrete analysis, saving standardization scores as variables. The results of data standardization analysis are shown in Table 7.
Table 7.
The standardization data of the input-output index of Chinese photovoltaic power generation from 2005 to 2015.
(2) The results of hierarchical cluster
Taking seven input indexes as variables, we choose the approximation matrix in our analysis, based on the hierarchical cluster method of nearest neighbor element. Taking the square Euclidean distance as standard, we took data that has been standardized to conduct a system hierarchical cluster analysis. As shown in Table 8, we can see that the effectiveness of the observed value reaches 100% and there is no data left out.
Table 8.
Observed Value Summary.
The approximation matrix is shown in Table 9.
Table 9.
Approximation Matrix.
From the results of approximation matrix, we can see that these two indexes, annual utilization hours and production concentration, do not fit with the other five indexes, so we should make more analysis with a better chart.
We used the single tree diagram to test our results (shown in the Figure 8) and we found that larger dispersion means poor correlation with other indexes and this does not fit with the target of our research. Analyzing the indexes in the tree diagram from right to left, the index of annual utilization hours is firstly eliminated. This is followed by the production centralization and energy substitution ratio, so we can make sure that the sum of input-output index meets the operation requirements of SE-DEA model.
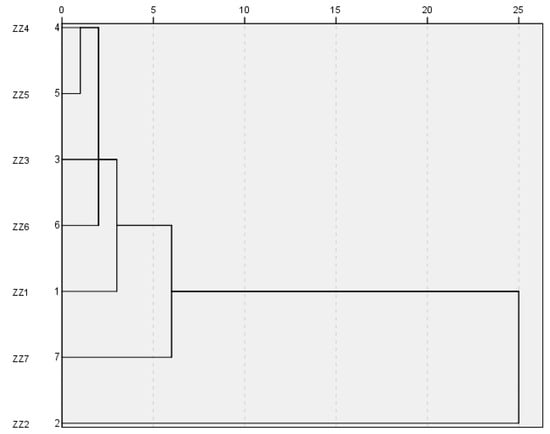
Figure 8.
The tree diagram of system hierarchical cluster.
3.4.2. The Comprehensive Efficiency Evaluation Based on SE-DEA
According to the results of the system hierarchical cluster and alignment requirements of SE-DEA model on the input-output index, the data of the input model is shown in Table 10.
Table 10.
The input-output index based on the method of system hierarchical cluster from 2005 to 2015.
This paper uses MATLAB (2016a, MathWorks, Natick, MA, USA) to conduct SE-DEA analysis of related indexes and data of photovoltaic power generation comprehensive efficiency. We imported the input matrix X and output matrix Y in MATLAB 2015a and we operated according to the specific procedure of SE-DEA. The results are shown in Table 11.
Table 11.
The output result based on super-efficient data envelopment analysis (SE-DEA) model.
According to the judgement standard, the effectiveness of 11 decision-making units are effective, but in the decision-making unit that θ > 1, the and in 2008 are not 0, so it is not entirely effective. According to the operation results of the SE-DEA model, for efficiency index θ, we can sort the photovoltaic power generation comprehensive efficiency from 2005 to 2015. The results show that the efficiency of photovoltaic power generation of 2009 is the highest and the results are all effective since and are zero. Morever, the efficiency of photovoltaic power generation of 2012 is the loweset. During the evaluation period, the efficiency showed an up-down-up trend.
4. Results and Recommendations
4.1. Results Analysis
4.1.1. Division of Development Stage
Data picked up in this paper has a limited time span. International market, technology improvement, policy environment, human cognition and other factors will have an impact on research samples at different times. Overall analysis is not helpful for us to understand the phase characteristics and then define the influential factors of comprehensive efficiency. Therefore, we divided the development stage from 2005 to 2015 into different parts, which is of great importance to effectively understand the evaluation result of comprehensive efficiency of the SE-DEA models.
Comprehensively considering the influential factors of the development stage division of photovoltaic power generation, we chose cumulative installed capacity which is the representative index, to divide the data, selecting the 100 MW and 10,000 MW as nodes, dividing the development of photovoltaic power generation into three stages. Cumulative installed capacity from 2005 to 2007 is below 100 MW, which is the initial stage. The period from 2008 to 2012 it is the fast developing stage. Since 2013, Chinese photovoltaic power generation, the cumulative installed capacity is above 10,000 MW, and it enters into the multiple large-scale development stage. This is shown in Figure 9.
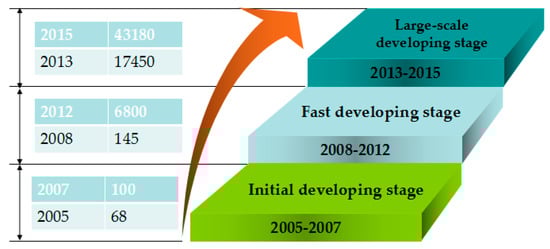
Figure 9.
The division of development stage of photovoltaic power generation.
4.1.2. The Staged Evaluation Analysis of Comprehensive Efficiency Based on Policy Direction
The development situation of the photovoltaic industry in China and analytical results of conduction mechanism of comprehensive efficiency based on the system dynamics show that the release and implementation of national policy play an important role in changing input-output index and improving the overall photovoltaic power generation comprehensive efficiency. National policies not only demonstrate the support and determination of the government regarding the photovoltaic industry but also offer guidance for the stable and sustainable development of the photovoltaic power generation industry. Therefore, analyzing the SE-DEA efficiency results by studying the policy can help us to find out the reasons for efficiency from the perspective of policy, avoid the adverse effect of ineffective policy and maintain and carry forward an effective policy. All of these are of great practical significance to provide a policy guarantee for promoting the comprehensive efficiency of photovoltaic power generation.
The ranking results and political analysis of SE-DEA are shown as below:
1. Initial Development Stage: the Comprehensive Efficiency is High in 2008 and 2009
The results of SE-DEA show that the comprehensive efficiency of photovoltaic power generation improves steadily in the initial development stage, which mainly benefits from the release and implementation of The 11th Five-Year Plan of renewable energy. Measures proposed in The 11th Five-Year Plan including major project construction, support of technology development, the financial subsidy from the central government and the approval of electricity price by government and other methods not only alleviate photovoltaic power generation operation pressure from the perspective of input but also guarantee effective output so that comprehensive efficiency can be improved.
In this stage, the efficiency indexes of 2008 and 2009 are both greater than 1, showing that the ratio of input and output almost reaches the ideal condition. Among these, the result of 2008 is close to the critical value. The comprehensive efficiency of 2009 improved a lot when compared with that of 2008. We analyzed this by understanding the policy and found that the supportive polity and national guidance are the reason why Chinese photovoltaic power generation can sustain high efficient level in later economic crisis. We can see from the following aspects.
- (1)
- Macro-plan. Although the Law of Renewable Energy announced in 2006 has made strategic plans for on-grid photovoltaic electricity price and the application of a photovoltaic project, the expected goals were not realized due to the limit of the actual development level. In 2009, the Chinese government made specific regulations regarding the capital source of photovoltaic investment, the proportion and limit of subsidy and the declaration process of demonstration projects. Moreover, the Chinese government made a targeted limitation the duty of the NEA and Ministry of Finance in the development of photovoltaic power generation, which provides a guarantee for the investment and operation of the photovoltaic power generation project from the macro perspective.
- (2)
- Micro-guidance. Considering capital, the Chinese government provides funded subsidies for the photovoltaic power generation demonstration project, comprehensively adopting the following measures including financial subsidies, discount loans and establishment of a seed fund to increase the benefits of fund application. As for technology, a technical standard is set up and improved. The government adopts a series of incentive measures to encourage the technical progress and industrial innovation. As for supervision, the government intensifies the test of photovoltaic equipment performance and improves the management level of the photovoltaic application project. In addition, a related evaluation mechanism is set up for effective tracing and spot check.
- (3)
- Response measures. In 2009, economic downturn caused by the global economic crisis and oil price fluctuation brought challenges and opportunities to the development of photovoltaic power generation. The Chinese government maintained a continuous GDP by efficient economic policies and improved photoelectricity architecture application as an important step towards economic structural reform under such a situation. The government continued to provide financial subsidies for the photovoltaic industry and carried out the declaration and approval of the photovoltaic demonstration project, which enables the cost advantage of the Chinese photovoltaic industry to expand in international terms and ensures that the industry scale expands. Thus, the Chinese photovoltaic industry is still competitive after the economic crisis.
2. Rapid Development Stage: Poor Comprehensive Efficiency of 2012
From 2008 to 2012, the cumulative installed capacity of photovoltaic power generation in China increased from 145 MW to 6800 MW, which indicates that the photovoltaic power generation industry entered into a rapid development stage. The Chinese government has made a more detailed policy for the photovoltaic power generation industry. The status of photovoltaic energy has been enhanced from the following aspects: industry transformation and upgrade, the construction of supporting service system and improvement of technical management system and other perspectives. However, suffering from the financial crisis, international trade dispute and other impacts of external environment, the comprehensive efficiency of photovoltaic power generation fluctuated fiercely.
From 2010 to 2012, the comprehensive efficiency index of photovoltaic power generation decreased continually and in 2012 the efficiency decreased to its minimum point of the past 11 years. The development of the Chinese photovoltaic industry got into trouble in 2012. We faced problems of supply and demand imbalance and the pressure of price decline. In the international market, China suffered from the trade barrier represented by American “Dual anti-policy”, which led to the decrease of photovoltaic modules production in China and the reduction of an increasing ratio of newly installed capacity. Moreover, the profits of the photovoltaic industry were compressed and the overall operation capacity photovoltaic power industry was adversely influenced. The photovoltaic power generation comprehensive efficiency was low in 2012 due to various influential factors.
At that time, the Chinese government released The 12th Five-year Plan of Solar Photovoltaic Industry, which mainly put forward technical improvement and upgrade of key modules and equipment. A service system to support the photovoltaic industry should be established and improved. By developing the smart electricity grid, we can support the development of the distributed photovoltaic industry. Although some reasonable analysis of the serious situation at home and abroad has been made, we failed to formulate targeted solutions to decrease the degree of dependency of the Chinese photovoltaic industry on the external market. The plan proposed some expectations for long-term development of the photovoltaic industry; however, it is not applicable to reverse the situation of photovoltaic power generation. The political system was not good enough to support the photovoltaic application. The market-driven policy is not strong enough to provide a political guarantee for stimulation of internal demand and orderly development of th photovoltaic industry. Moreover, it cannot provide effective guidance for the improvement of the comprehensive efficiency of photovoltaic power generation.
3. Multiple Scale-Development Stage: the Comprehensive Efficiency Needs to be Improved
China surpassed America to become the biggest photovoltaic installed market in the world in 2013 for the first time. The photovoltaic power generation took on scale-development and the comprehensive efficiency also improved. The 12th Five-Year Plan was the major political factor to influence the change of comprehensive efficiency. In contrast to the shortage of feasibility in 2012, after 2013, the comprehensive efficiency of photovoltaic power generation improved significantly with the improvement of the industrial chain, the transformation of key equipment and the supportive policy of the distributive photovoltaic energy. Multiple scale development has been gradually established such that the centralized photovoltaic power generation acts as the main part and the distributed photovoltaic power generation develops collaboratively.
During the period of The 13th Five-Year Plan, the Chinese government proposed photovoltaic effective routes: the development pattern of photovoltaic would be transformed to detailed progress from extensive expansion by means of industrial improvement, the adjustment of distribution and technical innovation. With the vigorous guidance of national policy, it is predicted that the quality of Chinese photovoltaic power generation and comprehensive efficiency will be further enhanced.
4.2. Policy Recommendations
Drawing from the above analysis, national policy can exert a great influence on the photovoltaic power generation industry. Driving the policy mechanism can provide an effective system that guarantees to improve the photovoltaic power generation comprehensive efficiency. According to the changing tendency from 2005 to 2015, on the basis of combination with policy analysis of key years, this paper puts forward policy suggestions to improve the photovoltaic power generation comprehensive efficiency in China from the perspectives of industrial encouragement, financial subsidies and long-term development.
4.2.1. Industrial Encouragement
Learning from the previous sections, the Chinese photovoltaic market has great potential for future development; however, the results of efficiency evaluation show that the input-output of photovoltaic power generation are not optimal. Key factors that influence comprehensive efficiency include: imperfect market cultivating policy, defective policy improvement of technical innovation and incomplete policy of supporting operation and service. Formulation and improvement of industrial encouragement policy will play an important role in accelerating the construction of photovoltaic power generation, as well as promoting the efficient sustainable development on the basis of enhancing comprehensive efficiency.
- (1)
- Market policy. The government should issue regulating policy, improve photovoltaic power generation industry development by industrial integration and consolidate the advantageous status of the new energy industry by optimizing the distribution of resources. In addition, we should exploit a diversified international market, encourage overseas mergers and acquisitions and cooperation of international projects and apply a flexible market strategy to avoid the adverse effects of the trade barrier. Therefore, we can create a stable domestic and overseas market environment for the improvement of photovoltaic power generation comprehensive efficiency.
- (2)
- Technical policy. At present, the photovoltaic industry in China focuses on production and investment links, we do not attach great importance to cultivation of talents and technical innovation. In the future, the government should speed up the formation of a talent cultivation system for the photovoltaic industry, and build up the national photovoltaic technology research center. In addition, we should encourage talent introduction and independent innovation with the help of research and development.
- (3)
- Supporting policies. The government should pay attention to the problem of the regional production surplus and structural imbalance brought by the rapid development of the photovoltaic power generation industry, take measures to enhance the confidence of investors, and at the same time, improve the management of early stage approval and later period production of the photovoltaic power generation projects. We should try our best to form a multi-layered management system which includes government, and non-governmental organizations and enterprises; thus, we can promote the development of photovoltaic power generation.
4.2.2. Finance Subsidies
Aiming at the anti-subsidy investigation that China suffered in 2012, the government should regulate the financial subsidy policy of the photovoltaic power generation industry properly to effectively deal with industrial crisis brought by other countries and to maximize the values of financial subsidies. In addition, the government should impose tax on photovoltaic enterprises taking the preferential tax rate of high-tech enterprise, which is highly supported by government as standard, and give discounts to some extent to the individual income tax of technical talents. It is necessary to adopt tariff exemption and other measures to encourage the imports of foreign photovoltaic equipment, as well as comprehensively consider the international and national conditions in order to decrease the export rebate rate, supporting the development of photovoltaic industry from many perspectives.
4.2.3. The Long-Term Development
The long-term electricity price return mechanism will lead to the development of the photovoltaic industry with the help of investment returns channels. The photovoltaic quota mechanism relies on the law to confirm the use of on-grid electricity in order to clarify the market shares, which plays an important role in enhancing the market share ratio of photovoltaic power generation and increasing competitiveness in the field. The regulating mechanism of on-grid price considers the changing condition of different regions and years, which is conducive for timely adjustment and cost control. The implementation of the above three mechanisms is aimed at development problems of photovoltaic energy. The direction is determined by the requirements the policy will provide guarantees for the sustainable development of the photovoltaic power generation industry.
5. Conclusions
This paper defines the boundary and evaluates the comprehensive efficiency of photovoltaic power generation on the basis of analyzing the development prospects and revealing the development problems of photovoltaic power generation. The main conclusions are shown below:
- (1)
- This paper defines comprehensive efficiency as the ratio of photovoltaic power generation input and output, analyzing comprehensive efficiency from the perspectives of resource efficiency, development efficiency and utilization efficiency, making a conduction mechanism analysis of interactive key indexes such as installed capacity, utilization hours and on-grid electricity. Moreover, this paper reveals the influential factors of the comprehensive efficiency of photovoltaic power generation from the perspective of resource utilization, investment and construction and policy market and lays a solid foundation for the establishment of the input-output index of comprehensive efficiency.
- (2)
- According to the conduction mechanism of comprehensive efficiency, we constructed the input-output index to evaluate the comprehensive efficiency of photovoltaic power generation on the basis of considering the acquirement of data. We took the period from 2005 to 2015 as the decision-making unit, introducing the hierarchical cluster analysis methods to eliminate the indexes with poor correlation, putting forward the evaluation model of photovoltaic power generation comprehensive efficiency based on the SE-DEA. In addition, we proposed policy suggestions for the optimization of future photovoltaic power generation comprehensive efficiency based on the evaluation results. This paper provides theoretical guidance for the scientific evaluation on comprehensive efficiency of photovoltaic power generation. The exploration of research methods is of great significance for efficiency evaluation and research in related fields.
Acknowledgments
This study is supported by the National Natural Science Foundation of China (NSFC) (71501071), the China Postdoctoral Science Foundation (2014M550937), the Ministry of Education in China Project of Humanities and Social Sciences (14JF005), and the Beijing Social Science Fund (16YJC064).
Author Contributions
All authors contributed equally to this work. Jinpeng Liu proposed the original idea and designed the overall framework of this paper; Yun Long conducted data analysis and completed the manuscript; Xiaohua Song modified and refined the manuscript. All authors read and approved the final manuscript.
Conflicts of Interest
The authors declare no conflict of interest.
References
- BP Statistical Review of World Energy June 2016. Available online: http://www.bp.com/en/global/corporate/energy-economics/statistical-review-of-world-energy.html (accessed on 1 June 2016).
- Devabhaktuni, V.; Alam, M.; Depuru, S.S.S.R.; Green, R.C.; Nims, D.; Near, C. Solar energy: Trends and enabling technologies. Renew. Sustain. Energy Rev. 2013, 19, 555–564. [Google Scholar] [CrossRef]
- REthinking Energy 2017: Accelerating the Global Energy Transformation. Available online: http://www.irena.org/DocumentDownloads/Publications/IRENA_REthinking_Energy_2017.pdf (assecced on 24 February 2017).
- Sahu, B.K. A study on global solar PV energy developments and policies with special focus on the top ten solar PV power producing countries. Renew. Sustain. Energy Rev. 2015, 43, 621–634. [Google Scholar] [CrossRef]
- Xiao, C.; Luo, H.; Tang, R.; Zhong, H. Solar thermal utilization in China. Renew. Energy 2004, 9, 1549–1556. [Google Scholar] [CrossRef]
- Qiang, Z.; Sun, H.; Li, Y.; Xu, Y.; Su, J. China’s solar photovoltaic policy: An analysis based on policy instruments. Appl. Eng. 2014, 129, 308–319. [Google Scholar]
- Ma, L.W.; Liu, P.; Fu, F.; Li, Z.; Ni, W.D. Integrated energy strategy for the sustainable development of China. Energy 2011, 36, 1143–1154. [Google Scholar] [CrossRef]
- Yan, N.; Tao, L.V. A Comparative Study on the Cost of Coal-fired with Considering the Environmental Cost and Photovoltaic Power Generation. China Popul. Resour. Environ. 2015, 25, 88–94. [Google Scholar]
- Yazdanpanahi, J.; Sarhaddi, F.; Adeli, M.M. Experimental investigation of exergy efficiency of a solar photovoltaic thermal (PVT) water collector based on exergy losses. Sol. Energy 2015, 118, 197–208. [Google Scholar] [CrossRef]
- Hasan, M.A.; Sumathy, K. Photovoltaic thermal module concepts and their performance analysis: A review. Renew. Sustain. Energy Rev. 2010, 14, 1845–1859. [Google Scholar] [CrossRef]
- Rubbia, C. Concentrated solar power in the future of electricity generation: A synthesis of reasons. Philos. Trans. R. Soc. A 2013, 371, 20110437. [Google Scholar] [CrossRef] [PubMed]
- Knoop, K.; Lechtenböhmer, S. The potential for energy efficiency in the EU Member States–A comparison of studies. Renew. Sustain. Energy Rev. 2016, 68, 1097–1105. [Google Scholar] [CrossRef]
- Thollander, P.; Palm, J. Industrial energy management decision making for improved energy efficiency-strategic system perspectives and situated action in combination. Energies 2015, 8, 5694–5703. [Google Scholar] [CrossRef]
- Tiba, C.; Ricardo, E.D.A. Siting PV plant focusing on the effect of local climate variables on electric energy production—Case study for Araripina and Recife. Renew. Energy 2012, 48, 309–317. [Google Scholar] [CrossRef]
- Skoplaki, E.; Palyvos, J.A. Operating temperature of photovoltaic modules: A survey of pertinent correlations. Renew. Energy 2008, 34, 23–29. [Google Scholar] [CrossRef]
- Chen, C.S.; Duan, S.X.; Cai, T.; Liu, B.Y. Online 24-h solar power forecasting based on weather type classification using artificial neural network. Sol. Energy 2011, 85, 2856–2870. [Google Scholar] [CrossRef]
- Shi, J.; Lee, W.J.; Liu, Y.Q. Forecasting Power output of photovoltaic systems based on weather classification and support vector machines. IEEE Trans. Ind. Appl. 2012, 48, 1064–1069. [Google Scholar] [CrossRef]
- Fernandez, E.F.; Perez-Higueras, P.; Loureiro, A.J.G.; Vidal, P.G. Outdoor evaluation of concentrator photovoltaic systems modules from different manufacturers: First results and steps. Prog. Photovolt. 2013, 21, 693–701. [Google Scholar] [CrossRef]
- Dharmadasa, I.M.; Tolan, G.J.; Cazaux, M. Effects of defects in semiconductors on reproducibility and performance of thin-film photovoltaic solar cells. Semiconduct. Sci. Technol. 2008, 23, 587–594. [Google Scholar] [CrossRef]
- Chiu, Y.H.; Ke, T.Y.; Zhou, Z.S.; Cheng, S.C. A performance evaluation of the cross-strait solar photovoltaic industry. Renew. Sustain. Energy Rev. 2014, 6, 104–108. [Google Scholar] [CrossRef]
- Chang, C.W.; Wu, C.R.; Lin, J.Y. Constructing a BSC model for evaluation of photovoltaic industry performance. J. Inf. Optim. Sci. 2008, 29, 1085–1100. [Google Scholar] [CrossRef]
- Bao, S.J.; Zhang, S.Q.; Li, H.T.; Qin, X.D.; Niu, C.H. A research on the measuring method and case analysis of PV power generation efficiency. Electr. Autom. 2016, 38, 59–61. (In Chinese) [Google Scholar]
- Tavares, C.A.P.; Leite, K.T.F.; Suemitsu, W.I.; Bellar, M.D. Performance evaluation of photovoltaic solar system with different MPPT methods. Proceedings of 35th Annual Conference of IEEE, Industrial Electronics, 2009, IECON’09, Porto, Portugal, 3–5 November 2009. [Google Scholar]
- Singh, R.; Rajpurohit, B.S. Performance Evaluation of Grid-Connected Solar Photovoltaic (SPV) System with Different MPPT Controllers. In Renewable Energy Integration; Springer: Singapore, 2014; pp. 97–124. [Google Scholar]
- Almonacid, F.; Rus, C.; Pérez, P.J.; Hontoria, L. Estimation of the energy of a PV generator using artificial neural network. Renew. Energy 2009, 34, 2743–2750. [Google Scholar] [CrossRef]
- Algieri, B.; Aquino, A.; Succurro, M. Going “green”: Trade specialisation dynamics in the solar photovoltaic sector. Energy Policy 2011, 39, 7275–7283. [Google Scholar] [CrossRef]
- Granić, G. CO2 tax or fee as a single economic instrument for climate protection policy promoting Renewable Energy Sources and enhancing Energy Efficiency. Nafta Sci. J. 2014, 65, 107–113. [Google Scholar]
- Rohankar, N.; Jain, A.K.; Nangia, O.P.; Dwivedi, P. A study of existing solar power policy framework in India for viability of the solar projects perspective. Renew. Sustain. Energy Rev. 2016, 56, 510–518. [Google Scholar] [CrossRef]
- Curreli, A.; Serra-Coch, G.; Isalgue, A.; Crespo, I.; Coch, H. Solar energy as a form giver for future cities. Energies 2016, 9, 544. [Google Scholar] [CrossRef]
- Cui, Q.; Li, Y. The evaluation of transportation energy efficiency: An application of three-stage virtual frontier DEA. Transp. Res. Part D Transp. Environ. 2014, 29, 1–11. [Google Scholar] [CrossRef]
- Wu, Q.; Peng, C. Comprehensive benefit evaluation of the power distribution network planning project based on improved IAHP and multi-Level extension assessment method. Sustainability 2016, 8, 796. [Google Scholar] [CrossRef]
- Sala-Garrido, R.; Molinos-Senante, M.; Hernández-Sancho, F. Comparing the efficiency of wastewater treatment technologies through a DEA metafrontier model. Chem. Eng. J. 2011, 173, 766–772. [Google Scholar] [CrossRef]
- Tone, K.; Tsutsui, M. Dynamic DEA: A slacks-based measure approach. Omega 2010, 38, 145–156. [Google Scholar] [CrossRef]
- Bruni, M.E.; Conforti, D.; Beraldi, P.; Tundis, E. Probabilistically constrained models for efficiency and dominance in DEA. Int. J. Prod. Econ. 2009, 117, 219–228. [Google Scholar] [CrossRef]
- Huang, C.; Dai, C.; Guo, M. A hybrid approach using two-level DEA for financial failure prediction and integrated SE-DEA and GCA for indicators selection. Appl. Math. Comput. 2015, 251, 431–441. [Google Scholar] [CrossRef]
- Mu, L.; Fang, L.; Wang, H.; Chen, L.; Yang, L.; Qu, X.J.; Wang, C.Y.; Yuan, Y.; Wang, S.B.; Wang, Y.N. Exploring Northwest China’s agricultural water-saving strategy: Analysis of water use efficiency based on an SE-DEA model conducted in Xi’an, Shaanxi Province. Water Sci. Technol. 2016, 74, 1106–1115. [Google Scholar] [CrossRef] [PubMed]
- Avkiran, N.K. Association of DEA super-efficiency estimates with financial ratios: Investigating the case for Chinese banks. Omega 2011, 39, 323–334. [Google Scholar] [CrossRef]
- Bae, E.; Bailey, J.; Dong, G. A clustering comparison measure using density profiles and its application to the discovery of alternate clusterings. Data Min. Knowl. Discov. 2010, 21, 427–471. [Google Scholar] [CrossRef]
- Chen, J.H.; Wan, Z.; Zhang, F.W.; Park, N.-K.; He, X.H.; Yin, W.Y. Operational Efficiency Evaluation of Iron Ore Logistics at the Ports of Bohai Bay in China: Based on the PCA-DEA Model. Math. Probl. Eng. 2016, 2016, 9604819. [Google Scholar] [CrossRef]
- Han, D.; Yan, Z.; Song, Y.Q.; Sun, Q.; Zhang, Y.B. Dynamic assessment method for smart grid based on system dynamic. Autom. Electr. Power Syst. 2012, 36, 16–21. [Google Scholar]
- Tan, J.J.; Wang, B.B.; Li, Y. Application of System Dynamics on Comprehensive Benefits Valuation of Demand Response. Autom. Electr. Power Syst. 2014, 38, 128–134. [Google Scholar]
© 2017 by the authors. Licensee MDPI, Basel, Switzerland. This article is an open access article distributed under the terms and conditions of the Creative Commons Attribution (CC BY) license (http://creativecommons.org/licenses/by/4.0/).