1. Introduction
In the field of ship propulsion the reduction of pollutant emissions to the atmosphere is becoming ever more a crucial issue, as evidenced by the increasingly stringent regulations adopted in recent years by the International Maritime Organization (IMO) [
1]. The legislation, initially focused on sulfur oxides (SO
x) and nitrogen oxides (NO
x), currently considers also the theme of reducing vessels’ carbon dioxide (CO
2) emissions, in relation to the need to control the greenhouse effect on the planet, as confirmed by the mandatory measures proposed by IMO for the evaluation and control of the Energy Efficiency Design Index (EEDI) for new ships [
2,
3,
4]. The CO
2 engines emissions can be reduced by employing fuels characterized by low carbon content (for instance natural gas) and/or using more efficient propulsion systems.
In addition to the above mentioned environmental aspects, economic considerations, related to the uncertainties on the cost of fuels, encourage nowadays the search for even more efficient solutions to be adopted in energy conversion plants for ship power and propulsion systems. Among these solutions, those based on the concept of combined cycles have acquired, in recent times, particular importance, as evidenced by the papers the other authors and researchers, reported in references.
The starting point is to recover the heat contained in the exhaust gases of the used prime movers (gas turbines, diesel engines) by means of a Waste Heat Recovery (WHR) steam plant, characterized mainly by a heat recovery steam generator (HRSG), and generally including a steam turbine, in some cases a power gas turbine, pumps, heat exchangers, as well as electric machinery. These components may be used in various ways and through different plant layouts, whose optimization can be pursued by means of simulation models developed for the purpose. The results presented in the article refer to two lines of research which differ depending on the adopted type of thermal prime mover: gas turbine or diesel engine.
According to the first line of research, an analysis has been performed to assess the applicability of Combined Gas and Steam (COGAS) installations for the propulsion of different ship types (container ships, cruise ships, LNG ships), characterized by different values of dimensions, speeds and installed power. Indeed, this idea is not new. Combined gas turbine and steam turbine cycles have been developed since the 70’s for terrestrial power plants. Since then, use of this plant typology has been continuously studied and also considered for ship propulsion.
In a first period, the interest in this type of application was justified also by the increasing availability of aero-derivative gas turbines for naval ships. In 1972 Merz and Pakula [
5] presented the design and operational characteristics of a COGAS marine system, highlighting its low fuel consumption rate, flexibility, simplicity and minimum environmental impact. In 1974 Abbott and Baham [
6] presented a detailed description of a possible COGAS propulsion system (with two gas turbine and two steam turbines) for a naval vessel (destroyer), highlighting its operational and economical advantages compared to the plant with only two gas turbines. Some years later (in 1977) the control and dynamic behaviour of COGAS plants were studied by Abbott et al. [
7]. The advantages of combined cycle propulsion systems, in terms of energy saving, were confirmed in 1977 by Mills [
8] and by Giblon and Rolih [
9] in 1979. A paper of Brady [
10] suggested in 1981 the possibility to reduce the fuel consumption of a naval ship by about 33% by introducing a COGAS plant.
More recently, as reported exhaustively in Haglind’s article [
11], a number of studies have been submitted for the application of combined cycle power plants to non-naval vessels, such as cruise ships, LNG vessels, container ships. In the wake of these studies, the contributions of Wiggins [
12] and Benvenuto et al. [
13,
14], pertaining respectively to LNG vessels and large commercial ships, have to be mentioned. It should be noted, however, that in past years, to the authors’ knowledge, (see also [
11,
12]), only few vessels have been built adopting this type of propulsion system: two Russian Ro-Ro ships with mechanical power transmission and some cruise vessels such as the Celebrity Cruise’s Millennium, Infinity and others as well as the Royal Caribbean’s Radiance of the Seas, with electric transmission (COGES). The reason of the low diffusion of this type of propulsion systems is due, in authors’ opinion, mainly to costs considerations [
11,
13], but nowadays the situation is different because of the increasing attention to environmental issues and thanks to possible performance gains achievable by COGAS/COGES optimized solutions.
In this paper, starting from the performance characteristics of a marine aero-derivative gas turbine and from the selected type of heat recovery steam generator (HRSG), a systematic analysis of different steam plant layouts and operating characteristics has been carried out by means of dedicated mathematical models, in order to obtain optimized solutions for different ship types. The presented results refer in particular to a 9000 TEU container ship, selected here as the specific application of the developed procedures.
According to the second line of research, a study has been addressed to ship propulsion and power systems with diesel engines as prime movers. Also in this case, as shown in different papers reported in references, an increase of the overall energy conversion efficiency can be achieved by recovering part of the wasted thermal energy through WHR dedicated installations. In 1984 Ioannidis [
15] presented a pioneering study on waste heat recovery from exhaust gases and cooling media of diesel engines on board ships. This research was developed in the following years by MAN Diesel & Turbo, which proposed [
16] innovative WHR systems, called Thermo Efficiency Systems (TES), able to reduce both fuel consumption and CO
2 emissions. Ito and Akagi [
17] developed in 1986 a planning method for designing a marine heat and power generation plant with particular concern on operational aspects. More recently (in 2004) Schmid [
18] proposed WHR systems as a means to achieve, among other advantages, less emissions from ships. On the other hand, the possible efficiency increase of a ship power plant, with combined diesel-steam cycle and a cooperating gas turbine, was discussed by Dzida [
19] in 2009. Grimmelius et al. [
20] presented, in 2010, diesel engine models for dynamic WHR analysis. Recent studies regarding the design optimization and modeling of WHR installations were presented by Theotokatos and Livanos [
21] in 2011 and by Benvenuto et al. [
22,
23] in 2013 and 2014. Lastly, Altosole et al. [
24] presented in 2014 a WHR system for a cruise ship, by comparing new design and retrofitting solutions. As briefly described before, in the mentioned studies, the introduction of WHR installations on board of ships with diesel engines as prime movers, was focused on the advantage of better energy conversion from thermal to mechanical form. However it must be observed that generally the ship energy needs typically include, in addition to the mechanical power for the propulsion engines, also the mechanical power for electric generation and thermal power for the on board services. Following this more comprehensive approach, in the present study, applied to a ship of known characteristics, different plant layouts have been proposed, optimized and compared by simulation in order to identify the best configuration to meet the propulsive, electric and thermal power request of the considered ship.
As briefly explained above, the main objective of the paper is to provide a contribution in the direction of improving the performance of WHR systems in marine applications. The development of dedicated computational models, briefly introduced in
Section 2, has allowed to obtain quantitative results for the application of a COGAS propulsion system to a large container ship. The advantages of this solution compared to the traditional two-stroke diesel engine, in terms of energy conversion efficiency, dimensions and weights of the installation, ship load capacity, environmental aspects, are shown in detail in
Section 3.
Similarly, by using the aforementioned mathematical models, it has been possible to propose innovative solutions for the WHR propulsion and power system of an oil tanker, with a two-stroke diesel engine as prime mover. As before, the calculated advantages of the optimized plant layouts, compared to the traditional ones, in terms of annual saving in the fuel outlay, payback time of the installation, carbon dioxide (CO
2) emissions, are shown in detail in
Section 4.
2. Calculation Methodology
The mathematical models able to describe the considered WHR systems have been implemented in two main computer codes (developed in MATLAB
® language). The first code, described in detail in [
13,
22], is able to calculate dimensions, weights and performance of the steam plant components in design conditions (i.e., with the main engine running at Normal Continuous Rating (NCR), starting from available data of the main engine (such as: power, specific fuel consumption, mass flow rate and temperature of the exhaust gases, etc.) and the input data of the steam cycle. The second computer code, described in detail in [
13], is used for the simulation of the WHR system (and relative components) in off-design working conditions.
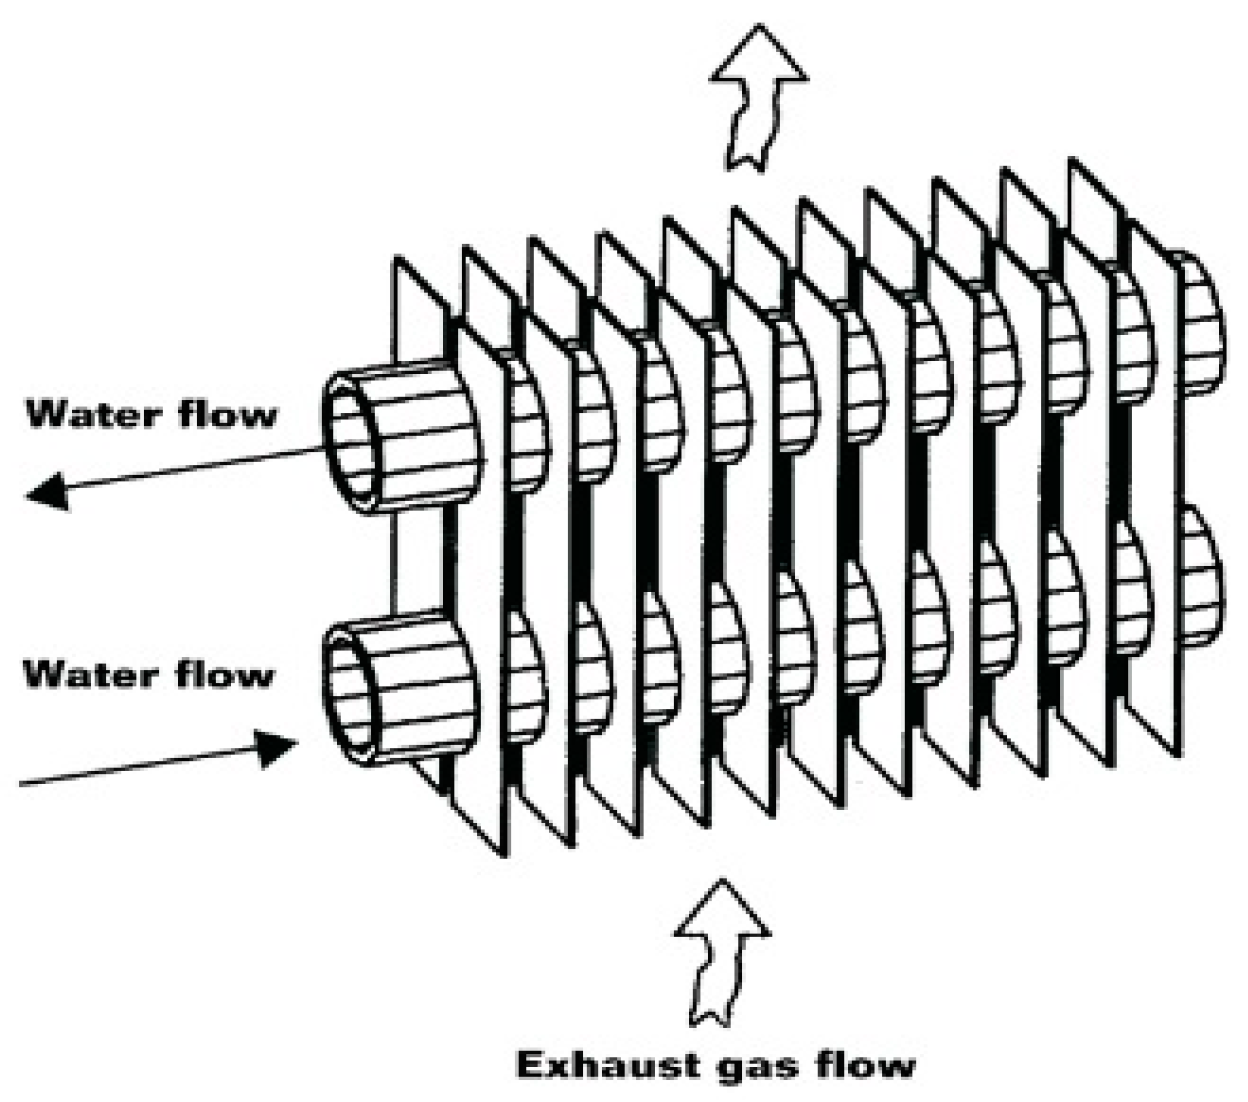
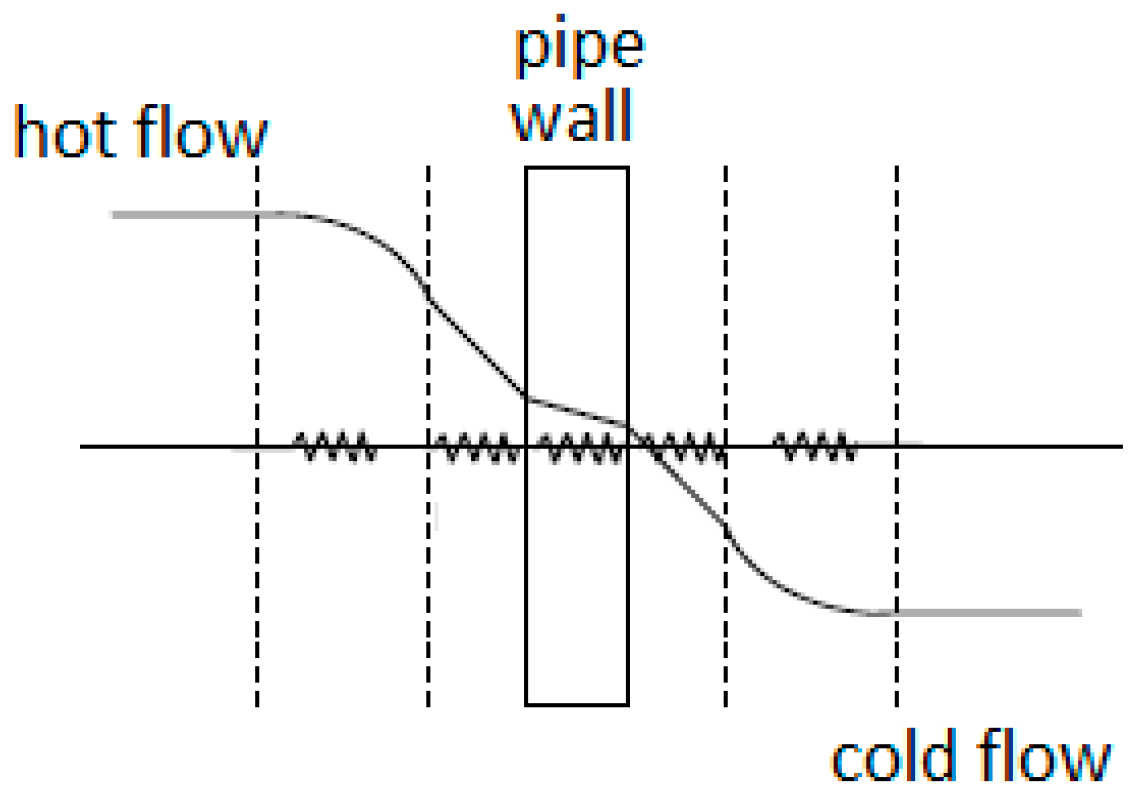
The calculation procedure used to define the components of a steam plant characterized by a single pressure cycle is briefly described in this section. The procedure can be easily extended to the case of a dual pressure cycle. In order to minimize space requirements, an HRSG with vertical gas flow has been adopted, mounted directly above to thermal prime mover (gas turbine, diesel engine) discharge duct. The adopted drum-type solution includes a circulation pump for the boiler and a vertical disposition of the heat exchangers (economizer, evaporator and superheater), equipped with horizontal finned tubes (shown in
Figure 1), characterized by a cross-counter flow configuration.
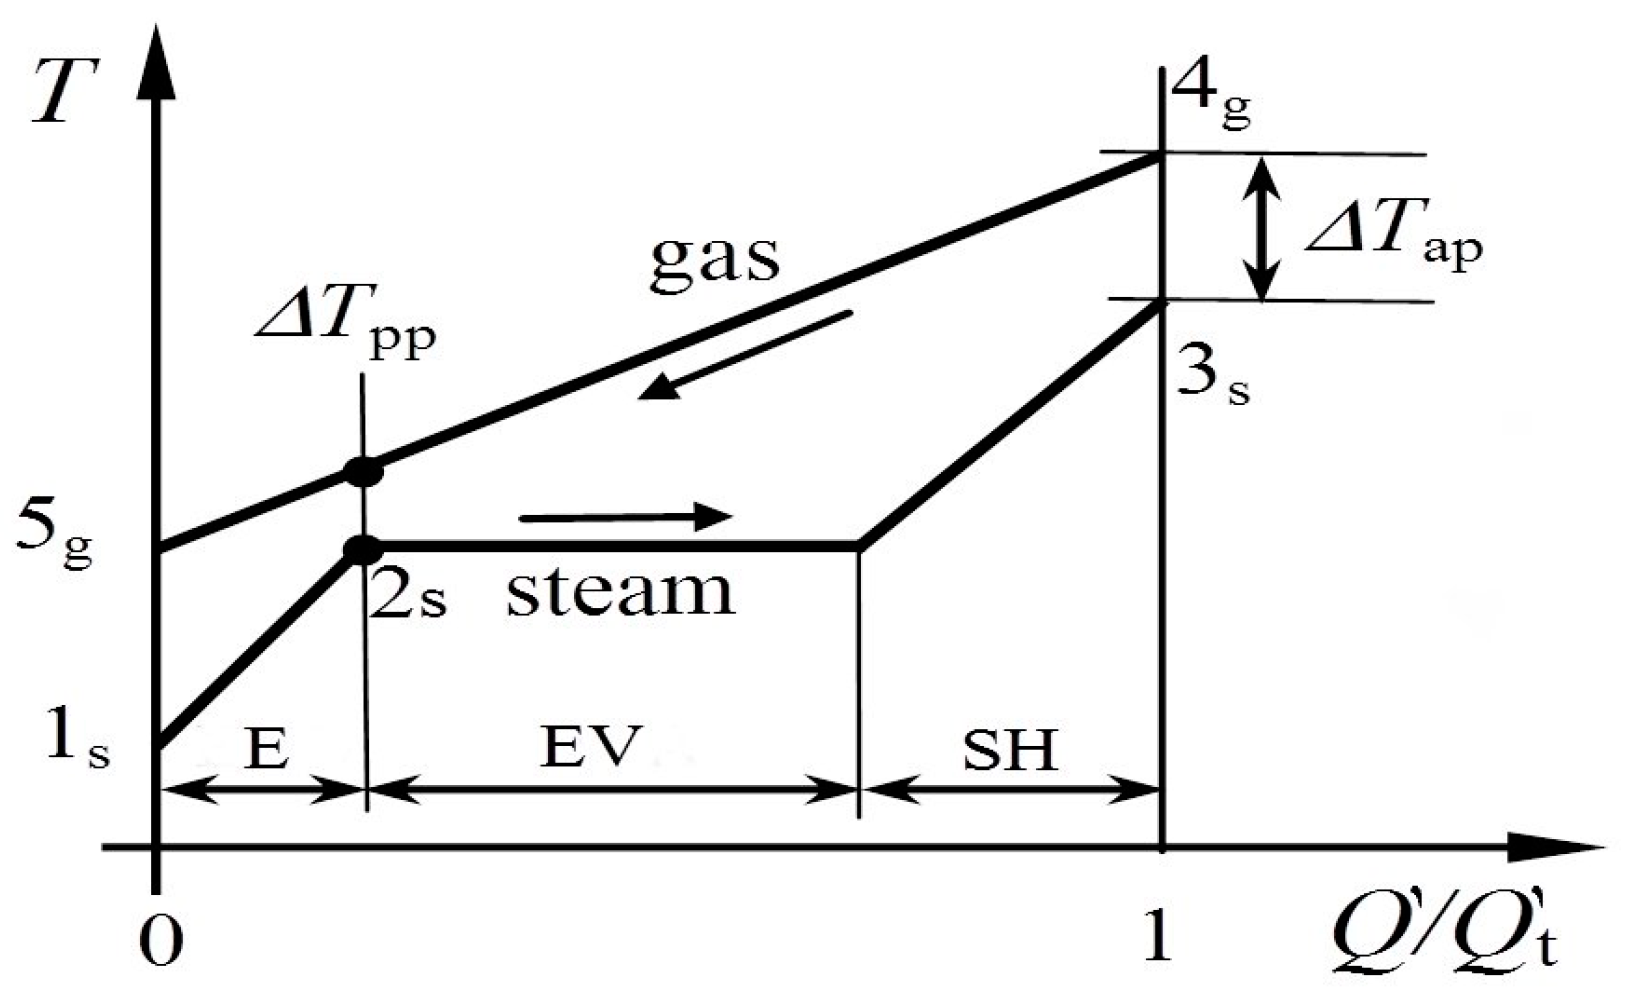
For each heat exchanger, the heat exchange between the hot and cold fluid is determined with the procedure here summarized, described more in detail in [
13]. In
Figure 2a typical temperature distribution for a single pressure HRSG is shown. The study of this component, i.e., the calculation of its heat exchangers requires the following input data: superheater outlet pressure (p3s), temperature difference between gas and steam in the superheater (Δ
T approach point: Δ
Tap) and in the economizer (Δ
T pinch point: Δ
Tpp), water temperature at the economizer inlet (T1s), gas turbine mass flow rate and exhaust temperature (
T4g).
By applying the steady state continuity and energy equations (see Nomenclature for the meaning of the symbols):
to economizer, evaporator and superheater, the steam mass flow rate and the HRSG outlet gas temperature (
T5g) are obtained.
Figure 3 shows the pipe wall calculation scheme (conductive and convective resistances in series) used for evaluating the global heat exchange coefficient (
ke) of the HRSG heat exchangers. This coefficient is given by:
where the various terms are defined in nomenclature. Using the Nusselt number and finned pipes correlations, the convective heat exchange coefficient is determined as reported in [
13].
For each HRSG heat exchanger, the total heat exchange area (
A), necessary for the pipes length evaluation, is determined by means of the following heat exchange balance equation:
where (Δ
T)
g-s is the logarithmic mean temperature difference between gas and steam. Knowing the thermal exchange area
A, it is possible to evaluate the total length of the pipes and so the dimensions and weight of the HRSG. The design of the steam plant condenser is carried out with a procedure very similar to that described above. In the deaerator feed tank (DFT) the steam drawn off from the turbine expansion warms the water introduced in the economizer. An energy balance equation applied to DFT determines the water temperature at the economizer inlet (
T1s).
The design approach followed for the considered axial steam turbine is based on steady state performance maps, similar to those used to model the gas turbines [
25]. The estimate of steam turbine power, size, weight and efficiency is based on existing similar steam turbines data.
The developed simulation procedure has been applied to two different COGAS steam plants of known performance and characteristics [
26,
27] for validation purposes: in both cases the errors between the simulation results and the reference data were less than 1% at design conditions.
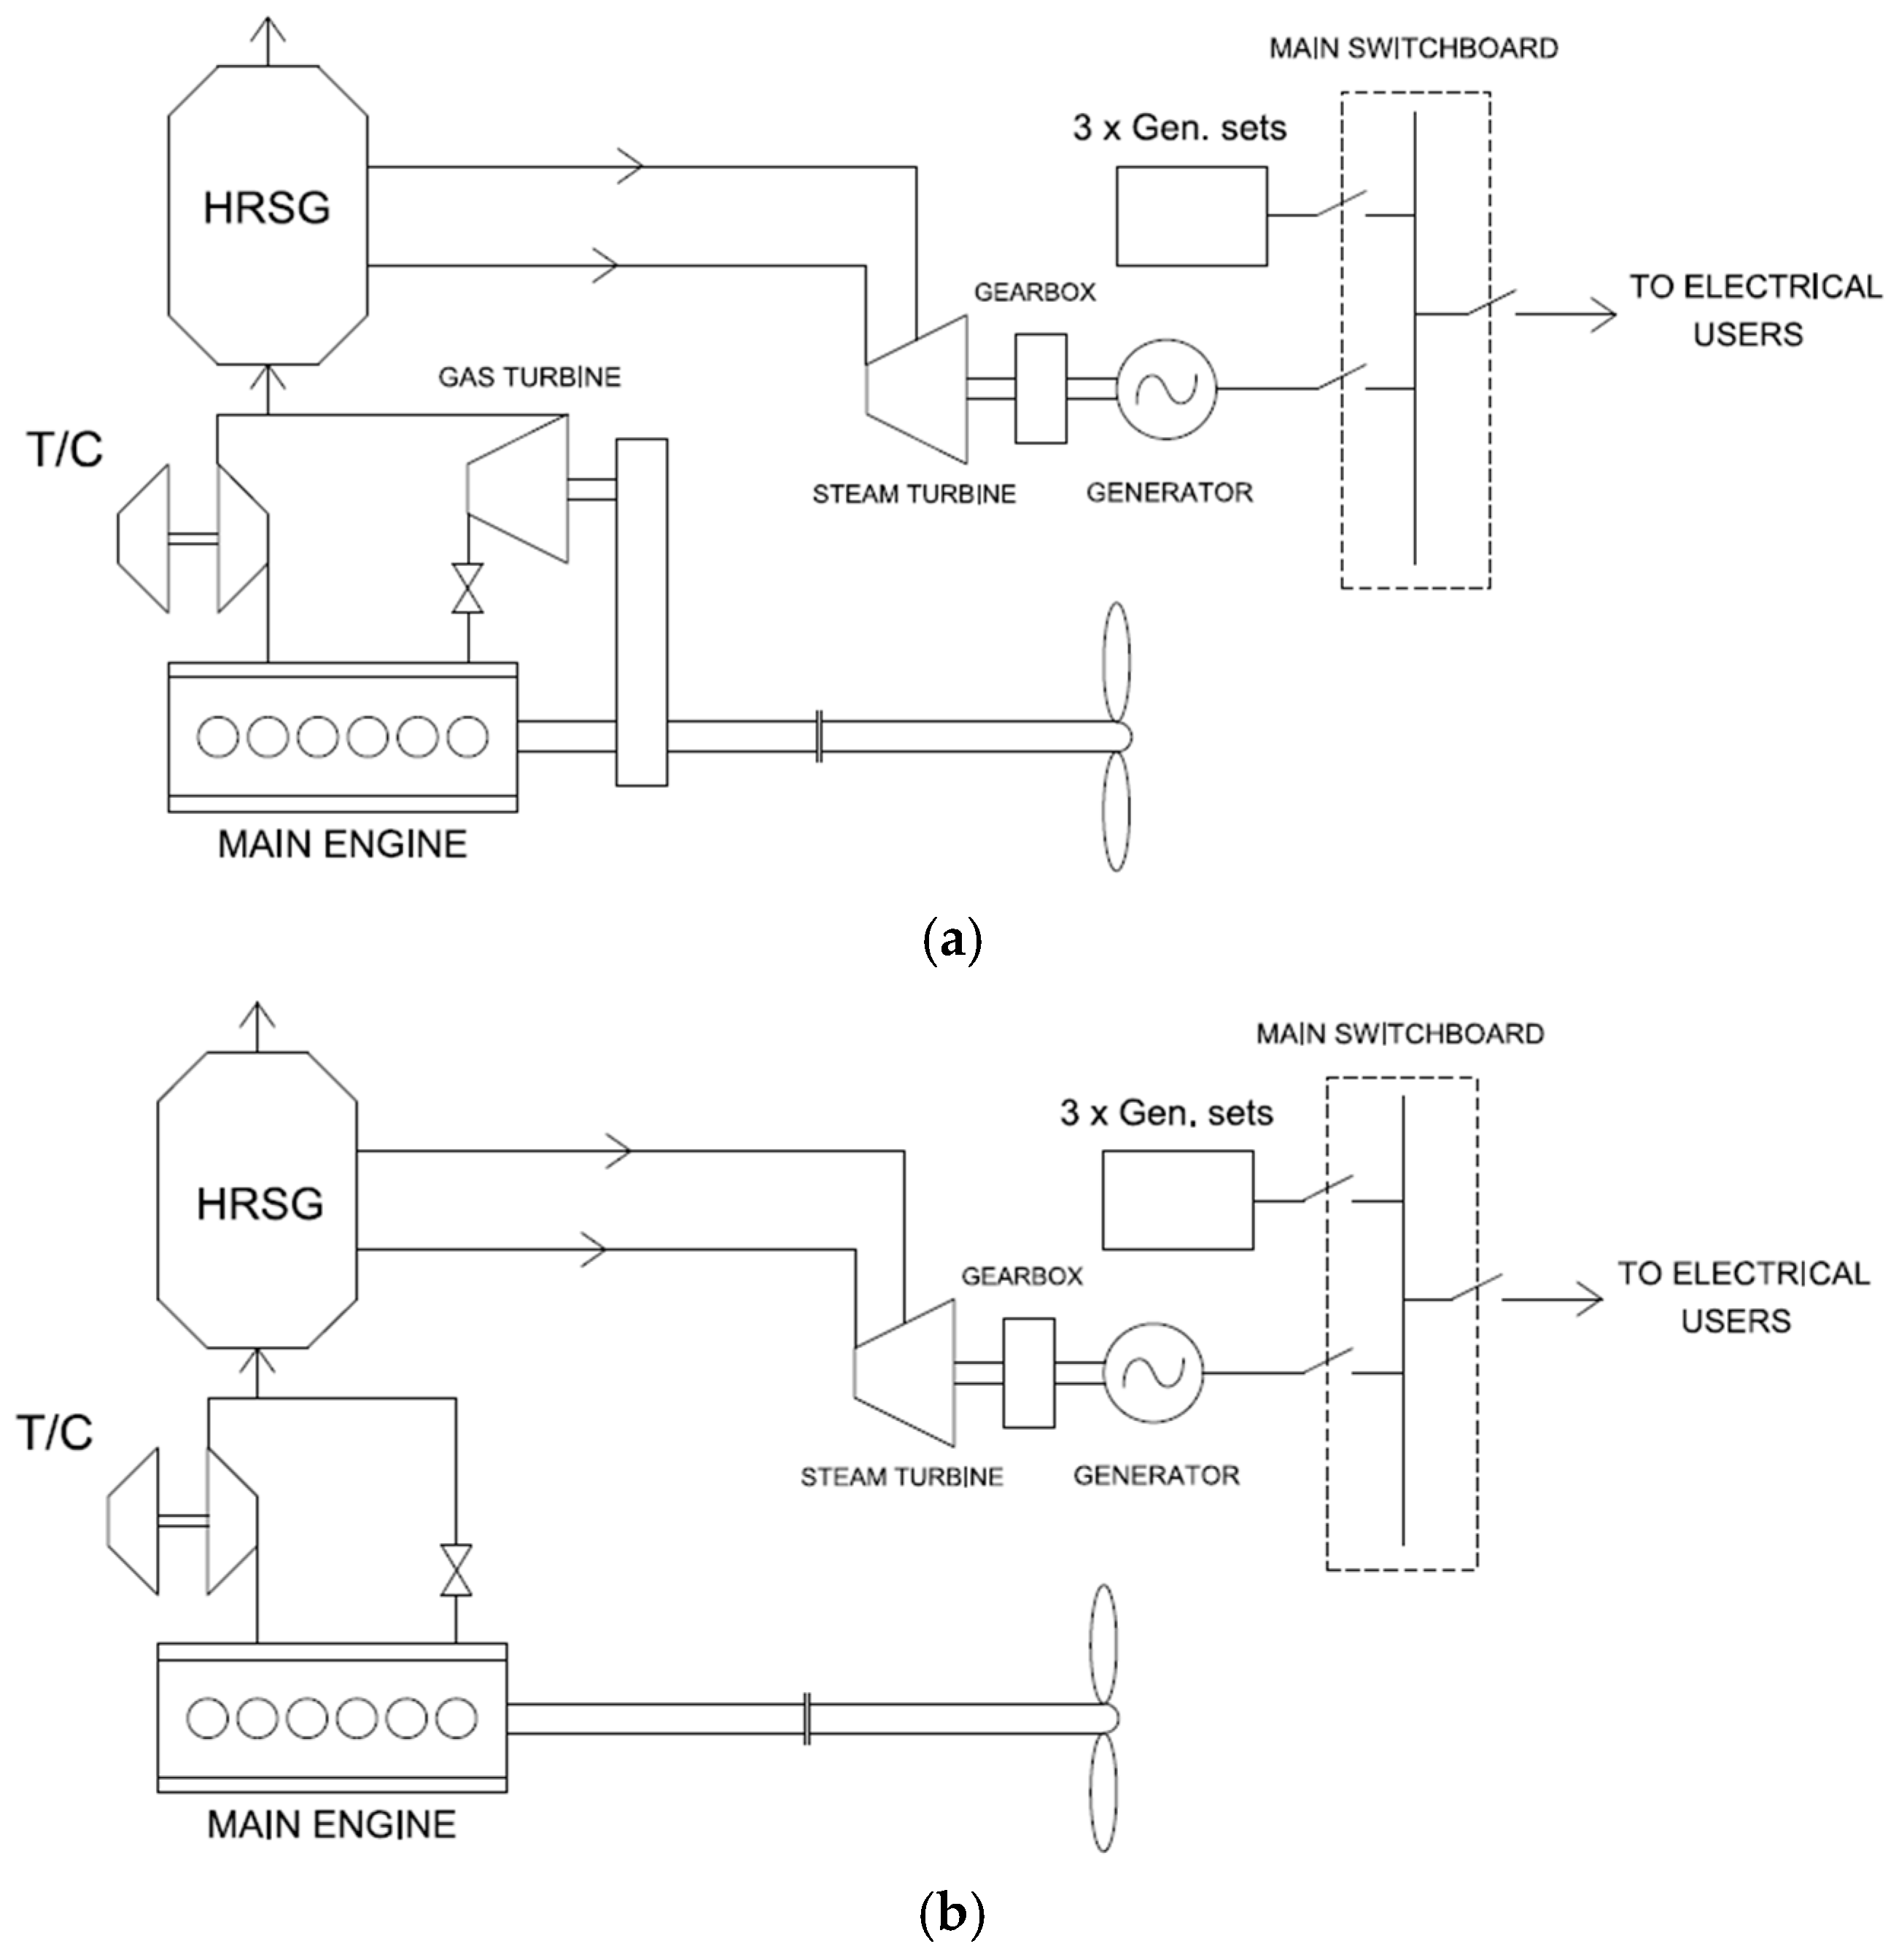
3. Combined Gas and Steam Turbine (COGAS) Propulsion System
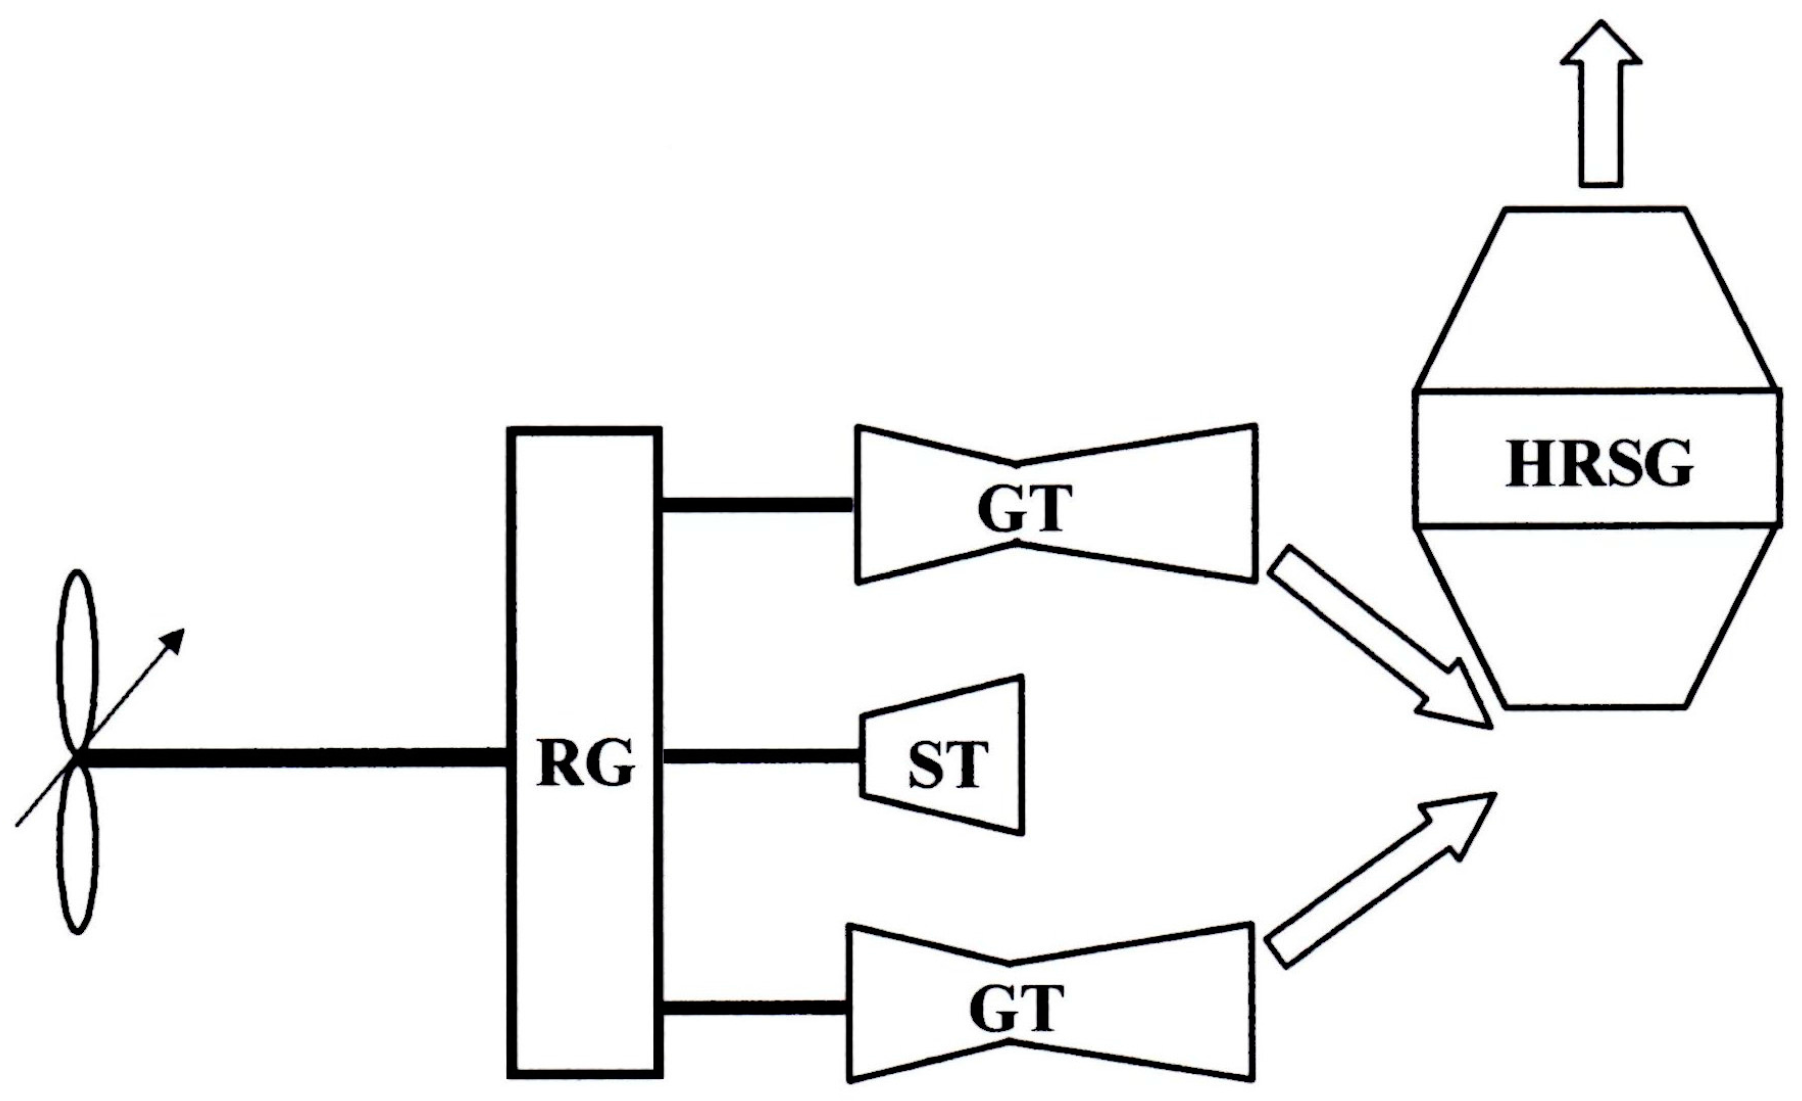
The COGAS ship propulsion plant considered in this study is schematically shown in
Figure 4. The exhaust gas heat coming from two LM 2500 gas turbines is recovered by the water circulating in the HRSG, able to produce steam which feeds the steam turbine. The two gas turbines (GT) and the steam turbine (ST) are connected to a controllable pitch propeller through a reduction gear (RG) as shown in
Figure 4.
The General Electric LM 2500 marine gas turbine is an aero-derivative, simple cycle, two shafts engine, consisting of a gas generator and a power turbine. The version here considered is characterized by an output power of 26.6 MW at 3600 rpm with a specific fuel consumption of 247 g/kWh of distillate fuel. In these running conditions, each gas turbine produces 83.93 kg/s of hot gas at 567 °C.
Three different solutions, proposed in literature, or corresponding to existing power plants, are examined in order to identify the best steam plant layout for the considered COGAS propulsion plant.
In all cases, the thermal energy for the steam plant is supplied by two LM 2500 gas turbines, whose output power is assumed constant and equal to the above reported nominal value, minus a power loss that can be estimated from the energy equation in about 0.3 MW due to the exhaust back pressure determined by the HRSG flow resistance.
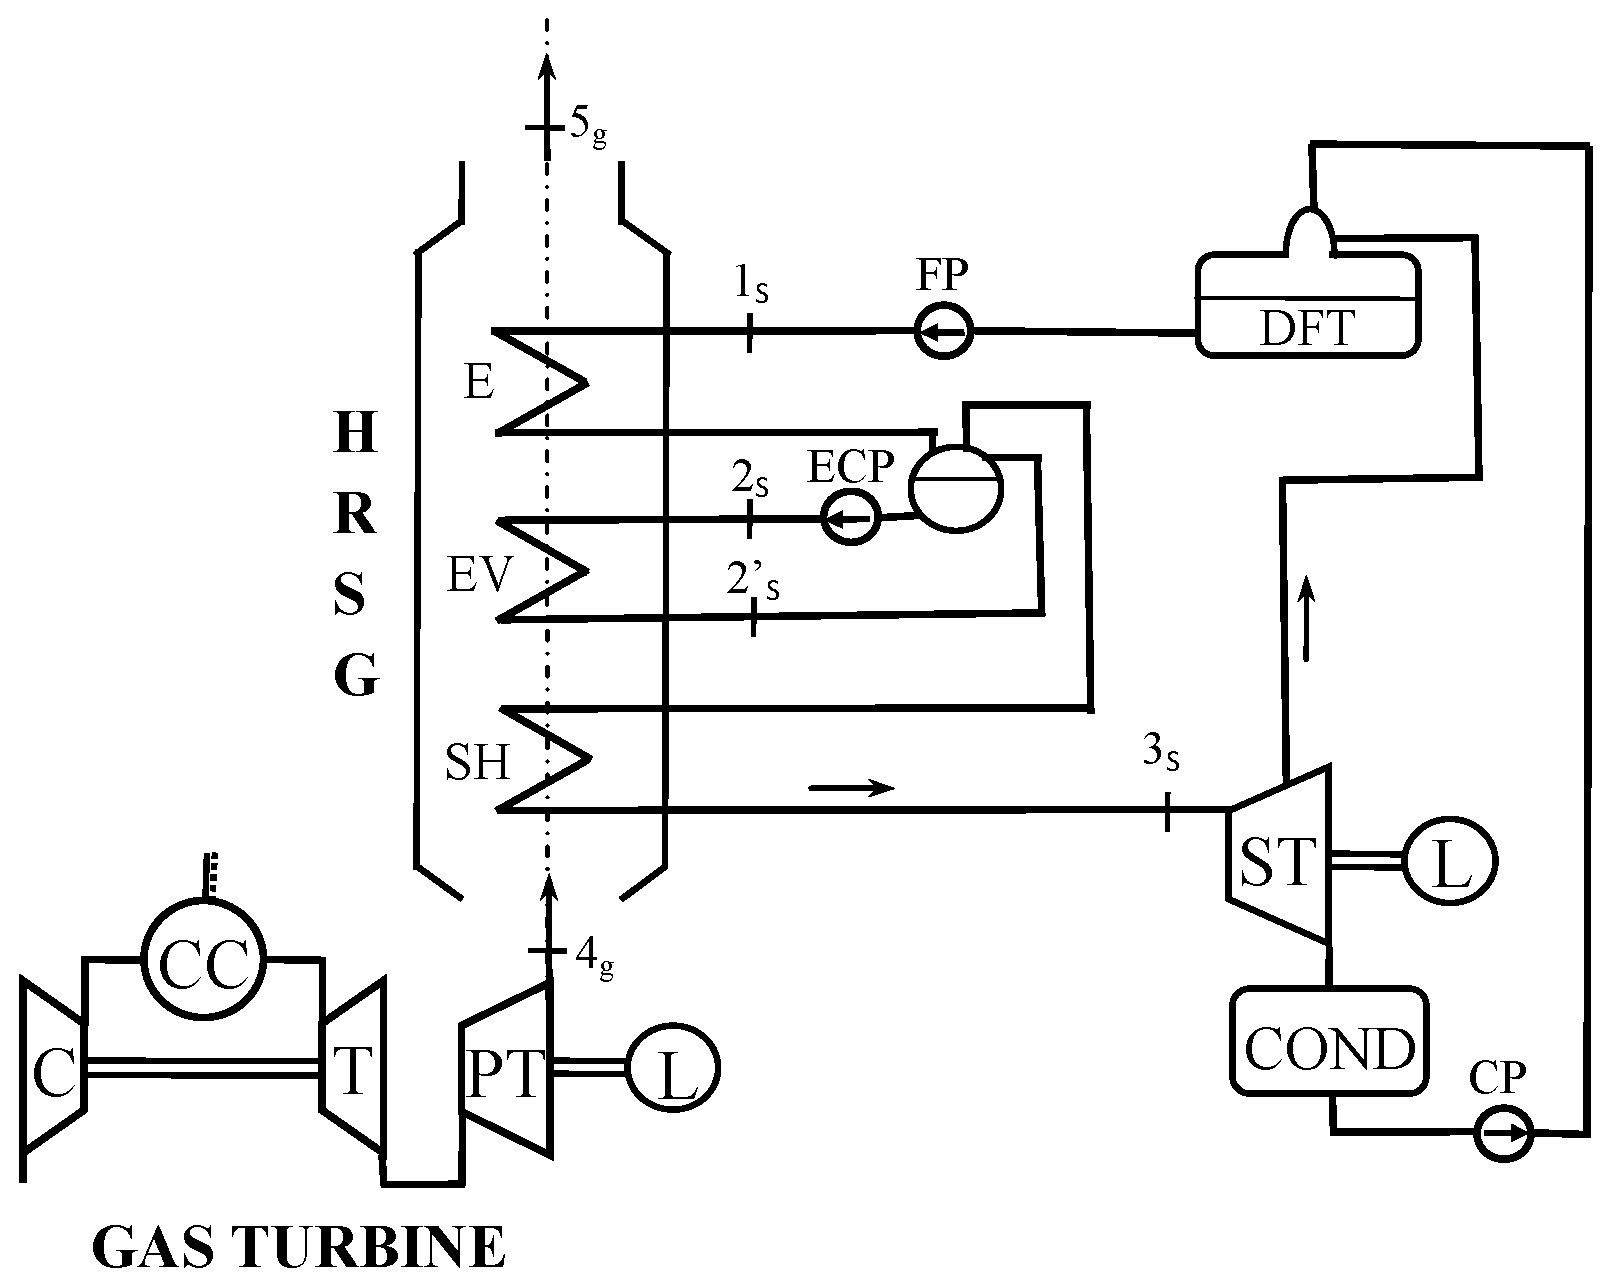
Figure 5 shows a single-pressure steam plant scheme. In this solution, the feedwater pump (FP in
Figure 5) supplies the HRSG economizer (E) which is followed by the evaporator (EV) water/steam drum, equipped with circulating pump (ECP), followed in turn by the superheater (SH).
After the expansion in the turbine (ST), the exhaust steam is condensed in the condenser (COND) from which, by means of the condenser pump (CP), is sent to deaerator feed tank (DFT). As in the patterns of steam plant presented in [
6,
11], the steam enters in the DFT coming from an intermediate stage of the steam turbine.
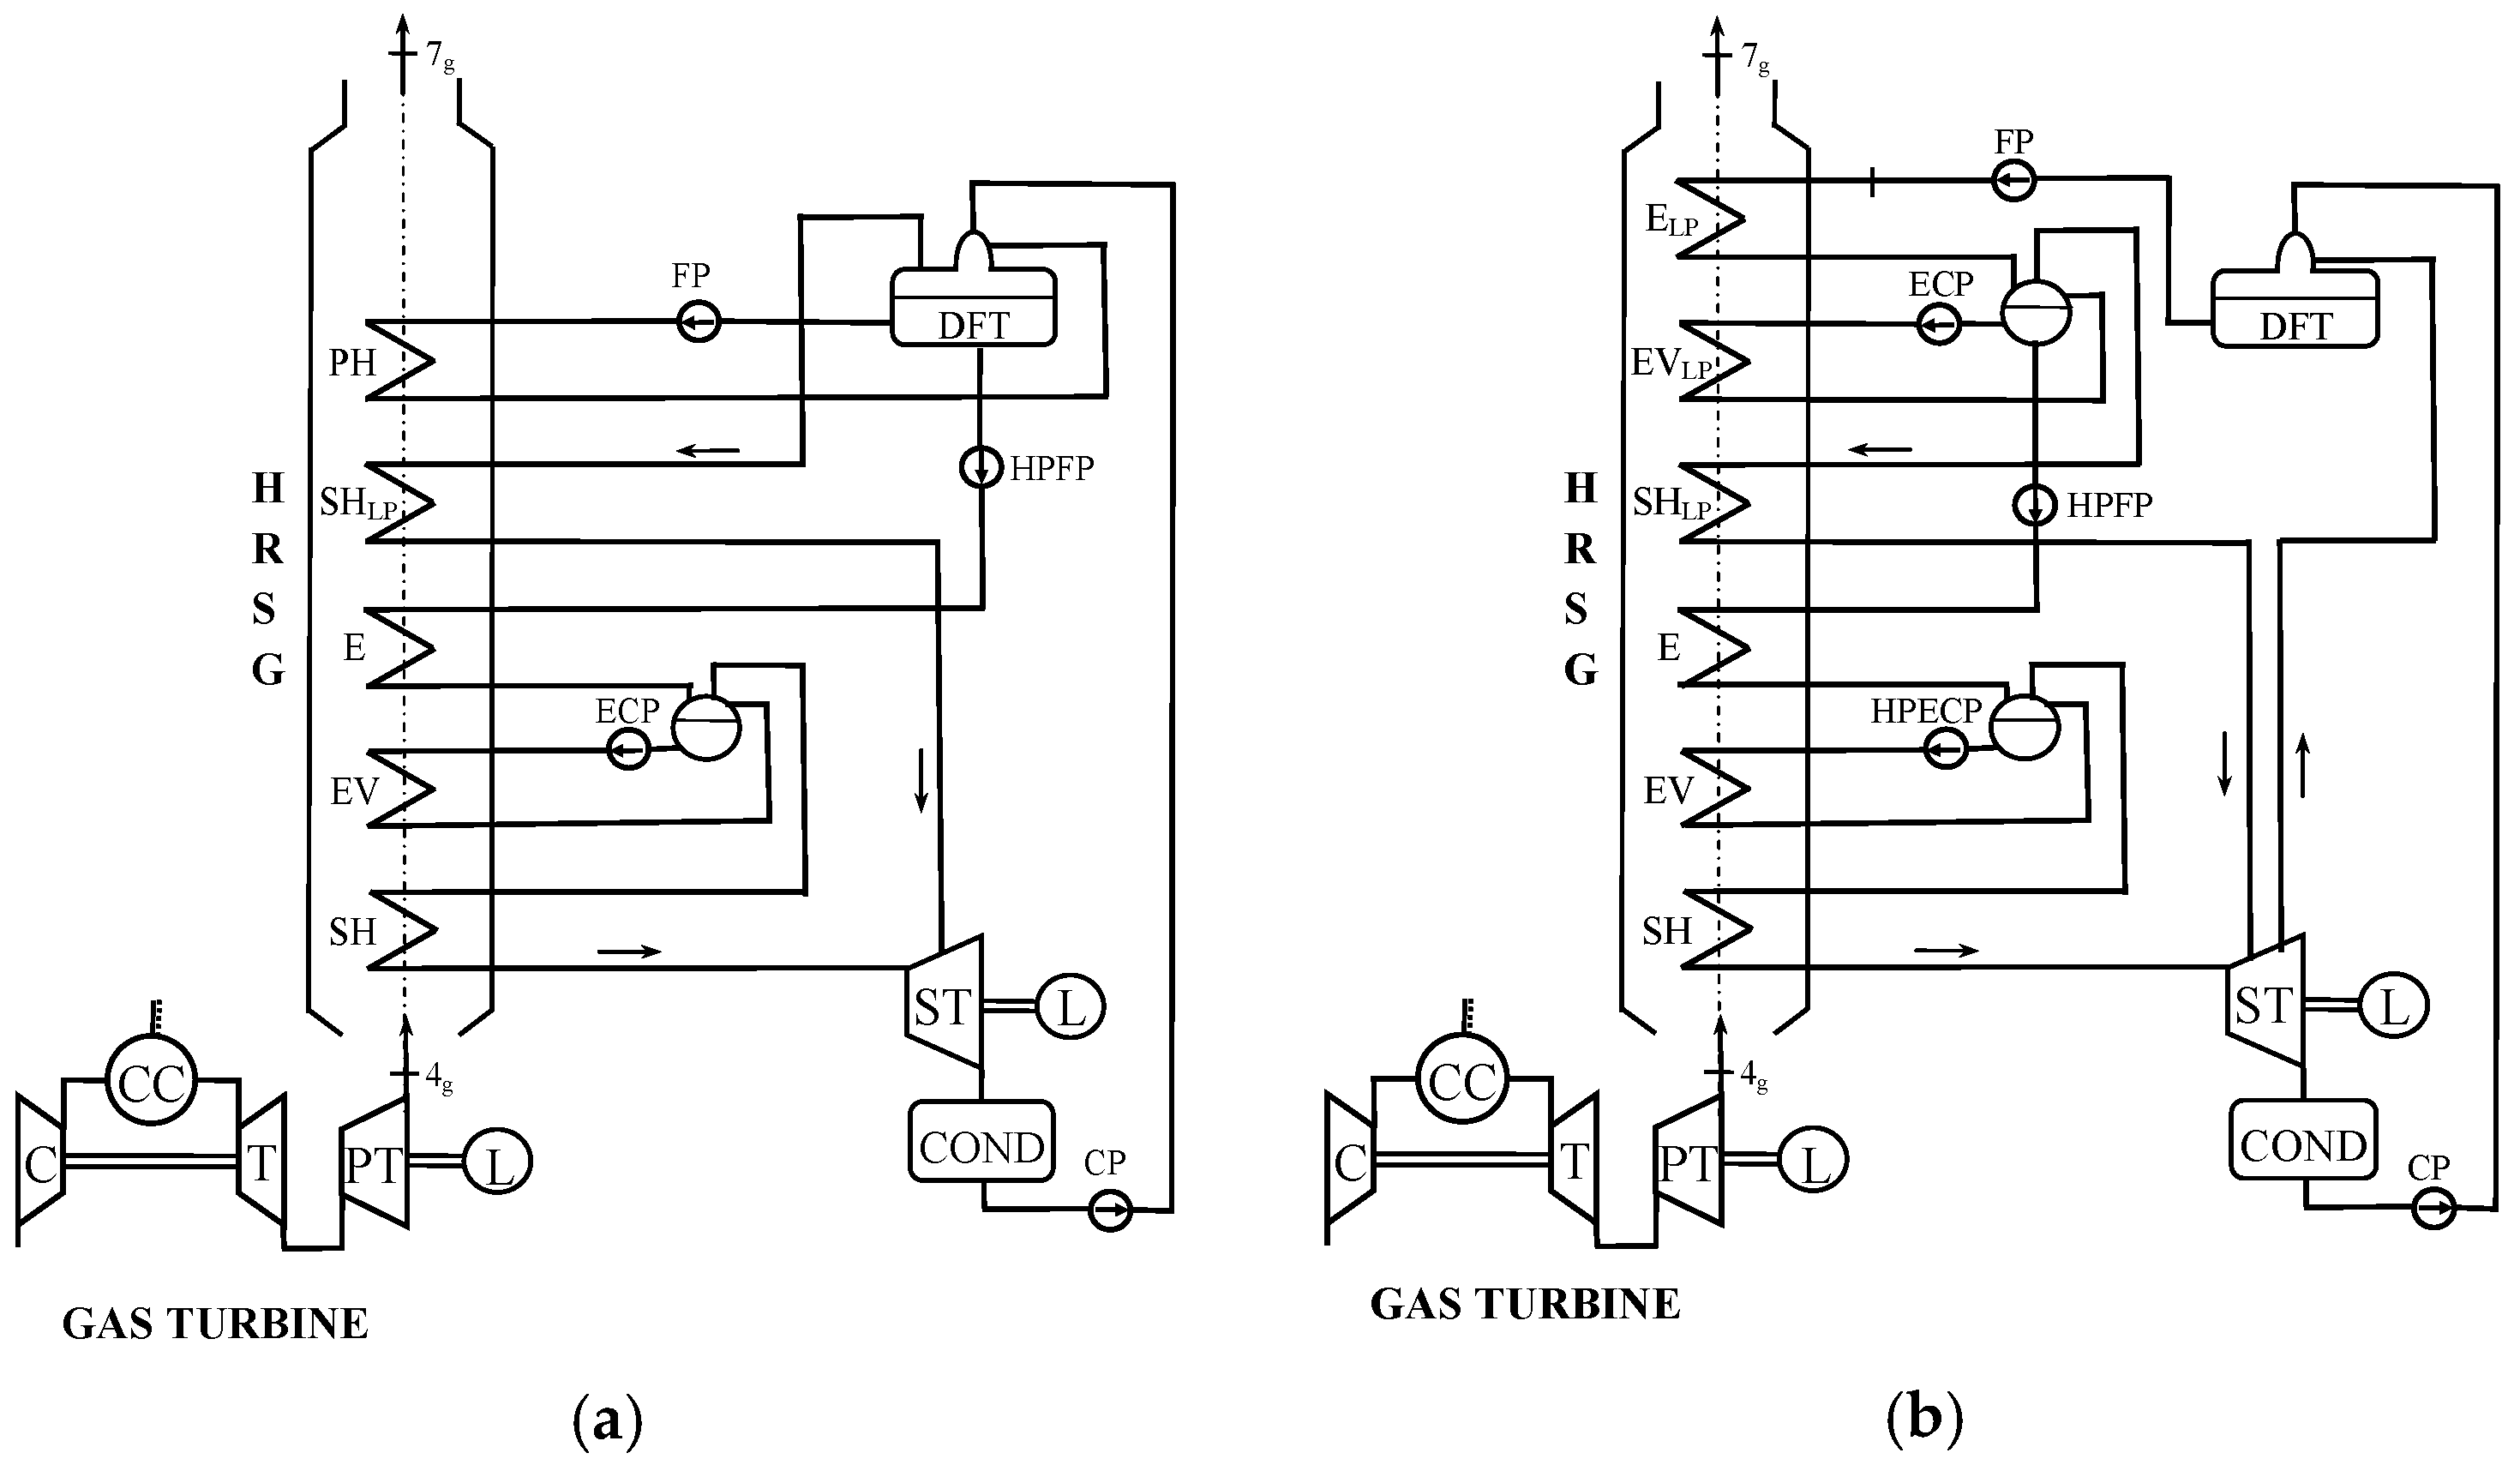
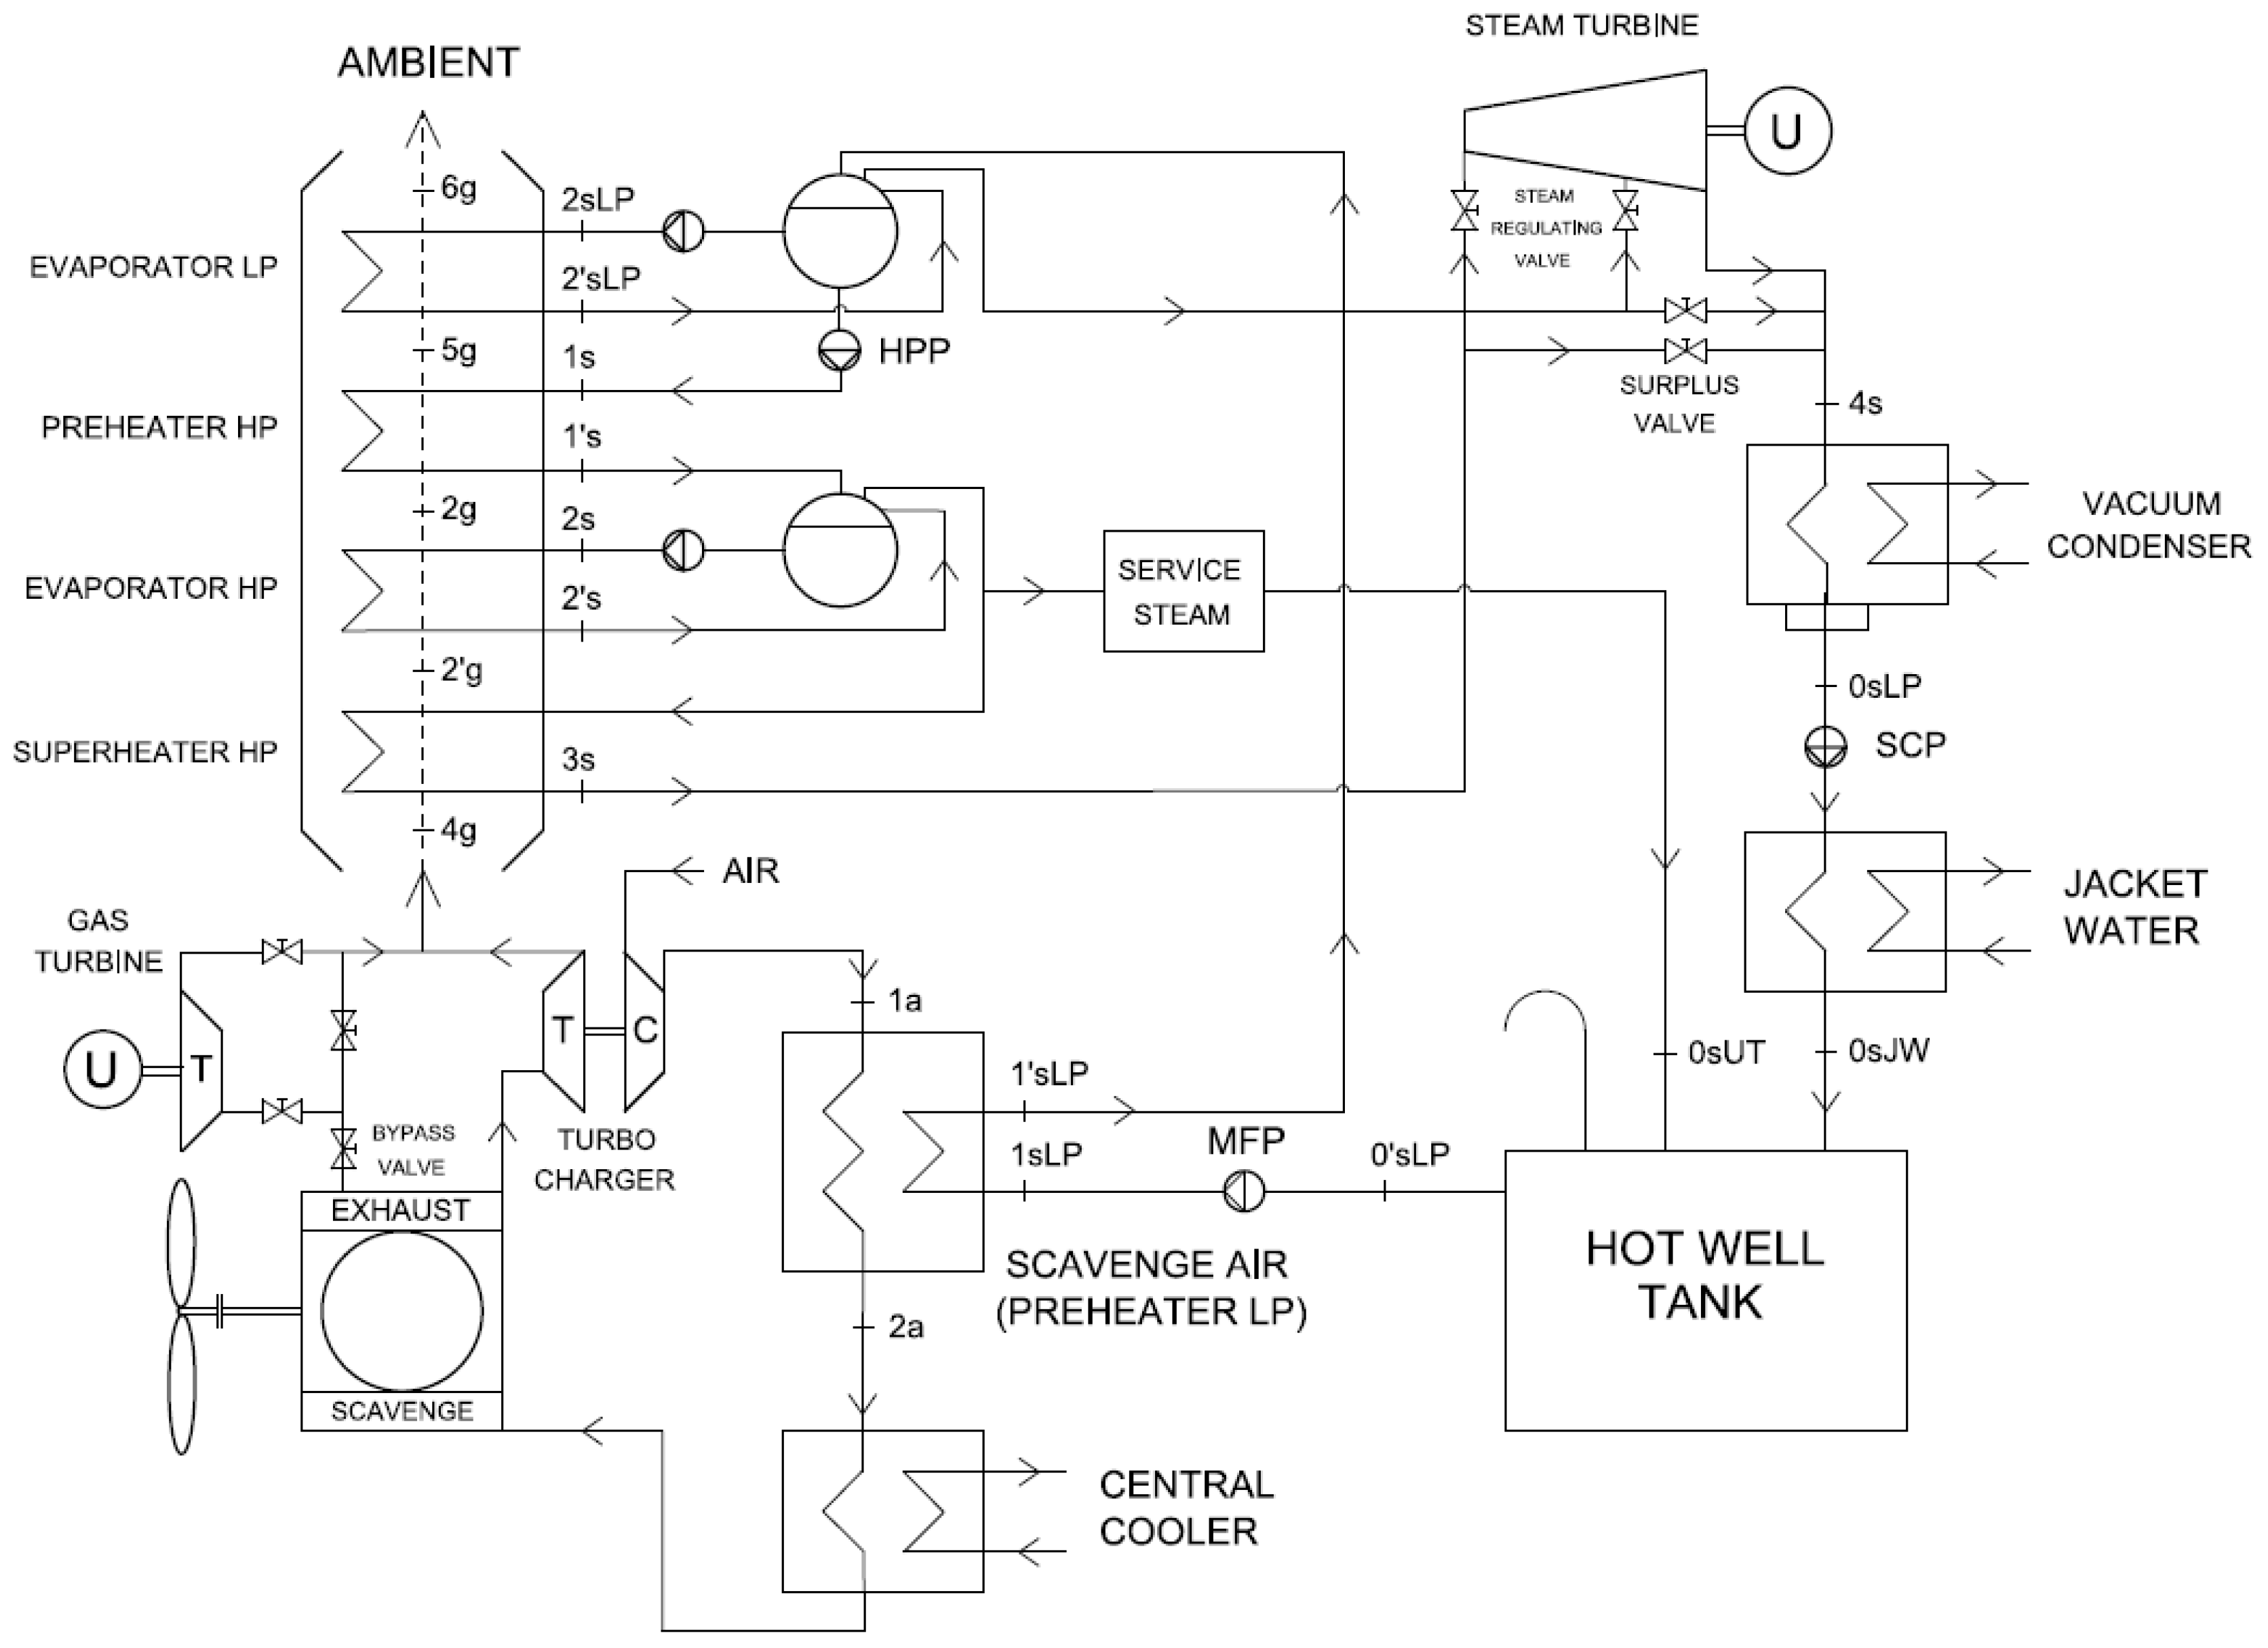
In
Figure 6, showing dual-pressure steam plant schemes, a substantial difference may be observed between the two considered layouts.
In the scheme of
Figure 6a, although relative to a dual-pressure steam cycle, only a single evaporator (EV in figure) is adopted. In this plant layout, in fact, the deaerator feed tank (DFT) is used also as a low pressure steam drum, in combination with the preheater (PH) which has the task of both economizer and evaporator. The DFT saturated steam is sent to the low pressure superheater (SHLP) and thence to the steam turbine (ST). Part of the DFT saturated liquid is sent to the high pressure economizer (E) by means of a high pressure feedwater pump (HPFP), and subsequently to the high pressure evaporator (EV) and superheater (SH), in the same way as described for the single-pressure HRSG. After the expansion in the turbine (ST), the steam is condensed in the condenser (COND) and sent to the DFT by means of the condenser pump (CP). This steam plant layout presents the advantage of a reduced complexity when compared with the more conventional dual-pressure steam plant configuration, shown on
Figure 6b.
In this last plant configuration, the low pressure steam part is very similar to that observed in the single-pressure scheme of
Figure 5. In this case the low pressure superheated steam is sent to an intermediate turbine section. Also in this solution the steam enters the DFT coming from an intermediate point of the turbine expansion.
As regards the high pressure steam part, the plant layout is very similar to that adopted for the single-pressure configuration. The water is taken from the low pressure steam drum by a high pressure feedwater pump (HPFP) and sent in sequence to the high pressure economizer (E), evaporator (EV) and superheater (SH). Finally, the superheated steam is sent to the turbine inlet.
3.1. Steam Plant Sensitivity Analysis and Optimization
The three COGAS steam plant layouts considered before are simulated and optimized by the above described computer code, aimed to the design of the steam plant components and to the evaluation of the steam plant performance. The calculation procedure starts from a series of fixed plant parameters, as reported in
Table 1, while the plants optimization is obtained by varying in a systematic way the values of the steam cycle variables (each one in a proper interval), as shown in the same
Table 1.
It is to be noted that in a combined cycle power plant for terrestrial applications, the optimization objective is typically the maximum efficiency of the energy conversion (with also an attention to the plant machinery and maintenance costs). Differently, marine propulsion COGAS plant optimization criteria should take into account other important aspects, such as installation dimensions and weights reduction, in order to increase ship load capacity. For these reasons, the adopted optimization criteria balance energy conversion efficiency increase and installation dimensions and weights minimization.
In presence of sulfur in the exhaust gases (although limited when using distillate fuel), in order to preserve the low temperature section of the HRSG and the chimney stack from sulfur acid attack, the calculation results are acceptable only if the gas temperature at HRSG outlet is above the sulfuric acid dew point. By varying the steam plant optimization parameters and applying the mentioned calculation procedures to the three considered steam plant layouts, a sensitivity analysis has been carried out, as reported in detail in [
14], aimed at providing information to select the steam plant layout and steam cycle thermodynamic parameters able to ensure the best performance for a COGAS system.
Table 2 shows the results of this optimization process, where the optimal steam cycle parameters are reported for the three considered solutions:
- -
Single-pressure steam plant;
- -
Dual-pressure steam plant with one boiler;
- -
Dual-pressure steam plant with two boilers.
In the same table the corresponding COGAS propulsion systems characteristics (GT and ST powers, overall efficiencies and specific fuel consumptions, steam plant efficiencies, steam mass flow rates, HRSG outlet gas temperatures) are shown.
The comparison between the obtained results suggests that the COGAS propulsion system equipped with a dual-pressure steam plant with two boilers is the best solution in terms of energetic efficiency. It allows an efficiency improvement of 1.3% and 2.3%, compared with the dual pressure (single-boiler) and single pressure steam plant respectively. These conclusions are similar to those reported in [
28], considering similar delivered powers and steam plant layouts in case of combined gas and steam turbine power plants for terrestrial applications.
As already mentioned, in case of ship propulsion, besides the energetic efficiency, other important aspects have to be considered, such as the ship load capacity, determined by weights and volumes of the COGAS plant components. The data reported in
Table 3 allow a comparison of the three examined COGAS propulsion solutions from this point of view.
3.2. Feasibility Study to Apply COGAS Propulsion to a Container Ship
The good results obtained in terms of COGAS efficiency, obtained in the case of dual-pressure steam plant with two boilers (see
Table 2), have encouraged the authors to assess the applicability of a COGAS propulsion system to a 9000 TEU container ship, whose main dimensions are reported in
Table 4.
The original main engine of this ship is a MAN Diesel 14K98MC-7 (Man Diesel & Turbo, Augsburg, Germany), fourteen cylinders two-stroke diesel engine, whose nameplate data are reported in
Table 5.
In the same table are reported also the data of the COGAS plant main power components (in case of dual-pressure steam plant with two boilers). The presented data show clearly that the diesel engine is characterized by much higher size and weight if compared with the turbines, even if, as in this case, two gas turbines are adopted in order to obtain comparable power outputs.
The ship auxiliary engines for electric power generation are three four-stroke diesel engines, each one developing 900 kW at MCR load condition.
As regards the engine room layout, the multi-component structure of the COGAS plant, together with the smaller size and weight of its components (compared to the diesel engine), allows a more flexible arrangement and a substantial reduction in size, especially if it is possible to move backward the rear bulkhead of the engine room (new construction project).
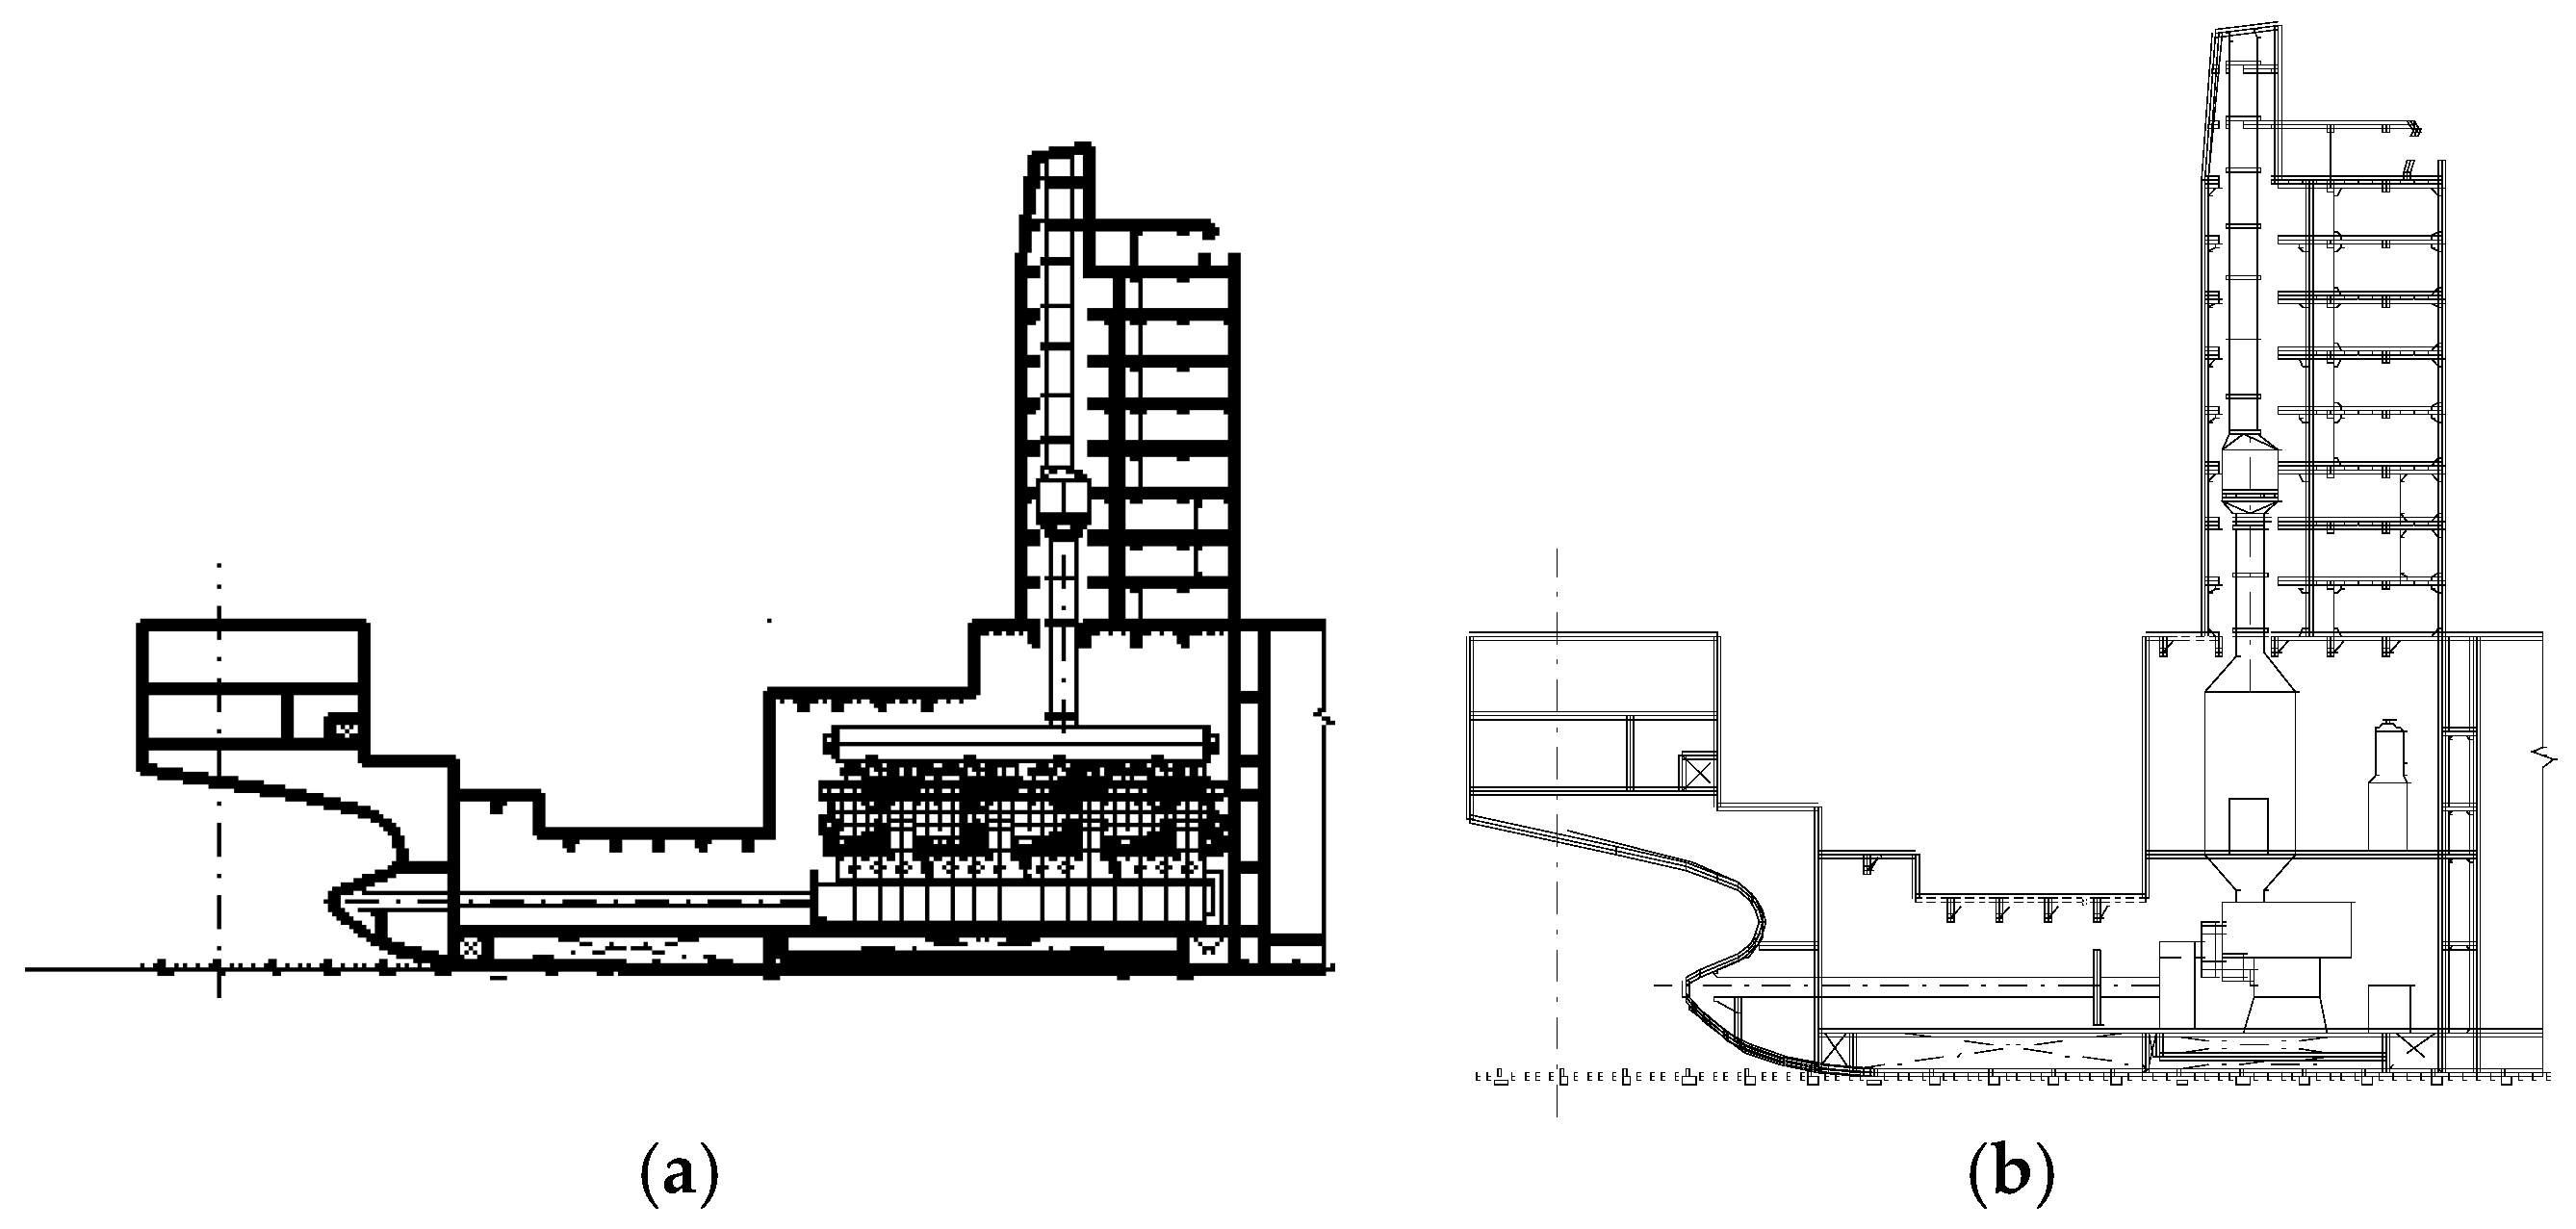
This is clearly evidenced by the ship’s stern sections shown in
Figure 7, relating respectively to the diesel solution (
Figure 7a) and the COGAS solution (
Figure 7b). Of course, the reduction in size of the engine room and the reduced machinery weights for the COGAS solution involve an increase of the load capacity of the ship.
Table 6 summarizes the possible advantages deriving from the application of the COGAS solution to the container ship.
Of particular importance is the reduction of the machinery weight, the significant reduction of fuel consumption and consequently of the CO2 emissions, and the increase of the ship load capacity.
These advantages are partly counterbalanced by a certain increase in the costs of installations and operation. Although a detailed economic analysis is beyond the scope of this study, it can be said that these costs are currently in favor of the diesel solution. Currently the cost of a two-stroke diesel engine developing a MCR power near to 80 MW is about 22 MUSD, while the cost of a COGAS plant (including the reduction gear), calculated by summing the components costs, indicated by various manufacturers contacted by the authors, is comprised between 1.2 and 1.4 times that of the diesel engine. As regards the operating costs, the substitution of the diesel engine with the COGAS plant allows a reduction of the specific fuel consumption of more than 8%, but currently the cost of the distillate fuel used in the gas turbine is about 1.4 times the cost of the heavy fuel oil used in the diesel engine. However, the adoption of stringent emission regulations in the shipping sector (in particular the restrictions on sulfur content in marine fuels from 2020 [
1]), is likely to produce an increase in equipment costs of diesel engines (because of the apparatus to reduce pollutant emissions), but most probably a significant increase in marine fuels costs due to more stringent specifications related to their chemical composition. The problem is further influenced by the increasing use of natural gas as marine fuel, because of its relatively low cost and reduced emissions. The advantages of this fuel could be beneficial for both the COGAS system and the recently introduced dual fuel engines. All these situations could significantly reduce the difference in the costs of installation and operation of the two examined propulsion plant solutions.
The points highlighted above allow to conclude that the COGAS plant could represent in a near future an advantageous, innovative alternative to the traditional two stroke diesel engine for the propulsion of large ships.
4. Combined Diesel and Steam Turbine Propulsion and Power Plants
As already mentioned in the introduction, a second research line developed by the authors consists in the application of Waste Heat Recovery (WHR) plants to ship propulsion and power systems with diesel engines as prime movers.
Nowadays the diesel engines are the most popular prime movers for ship propulsion and auxiliary plants; their thermal efficiency is about 50% for two-stroke slow speed engines and slightly lower for four-stroke medium and high speed ones. This means that a great part of the thermal energy generated by the combustion in the cylinders is generally wasted and discharged into the atmosphere, together with a considerable amount of pollutant emissions. This last problem is made even worse by the low quality fuel used especially by the propulsion engines.
As shown in recent literature [
16,
19,
20,
21,
22,
23,
24], an increase in the energy conversion efficiency can be achieved recovering part of this wasted thermal energy through WHR devices. In previous studies [
22,
23] the authors optimized and compared some different Thermo Efficiency Systems (TES), capable to recover part of the exhaust gas thermal energy of a two-stroke marine diesel engine, by means of a steam plant, assisted in some cases by a gas turbine. In the mentioned study the TES plants optimization was focused on the advantage of better energy conversion from thermal to mechanical form. However, as already said, the ship energetic requirements typically include, in addition to the mechanical power for ship propulsion, also the mechanical power for electric generation and thermal power for the on board services. This more extended approach is considered in the present study where, starting from a main propulsion diesel engine with WHR plant and diesel generators, the fulfillment of the ship energy needs, in their various forms, is investigated by examining different possible combinations of the installation components. The analysis carried out, aimed to optimize the propulsion and power plant layout, has been applied to a crude oil tanker ship, belonging to Premuda company (Trieste, Italy), whose known characteristics are given below.
4.1. Ship Main Data and Power Requirements
The ship taken as reference unit in this study is a 158.000 DWT (dead weight tonnage) crude oil tanker, whose main dimensions are reported in
Table 7.
The main engine of the ship is the two-stroke low speed diesel engine 6S70ME-C8.2 built by MAN Diesel & Turbo (Augsburg, Germany), characterized by a Maximum Continuous Rating (MCR) power of 19,620 kW at 91 rpm. At the Normal Continuous Rating NCR (90% of MCR) the main engine data are as follows: Power = 17,658 kW; Speed = 87.9 rpm; SFOC = 172 g/kWh; Exhaust gas amount: 138.63 kg/h; Exhaust gas Temperature = 276.2 °C. In the considered vessel the power requirements are known on the basis of shipowner indications: the demanded propulsion power is 17.66 MW at NCR, for a ship speed of 16.2 knots at design draught, heavy running with 15% sea margin, or 16.8 knots at design draught, light running. The ship demand for electric power is reported in
Table 8.
As from shipowner indications the ship works 270 days per year, of which 70% (189 days) in normal sea going condition (without tank heating) and the remaining 30% (81 days) in normal sea going with the electrical equipment required to perform the tank heating. The ship thermal power demand is 1.4 t/h of saturated steam flow with a pressure of at least 7 bar. This estimate does not take account of the steam required for tank heating.
4.2. Considered WHR Steam Plants
To recover the thermal energy from the main engine of the ship, two basic steam plant layouts are taken into consideration to be part of a more complex TES [
15,
26] system.
The first one is a typical steam plant layout, based on a two pressure levels Heat Recovery Steam Generator (HRSG), similar to that proposed by MAN Diesel & Turbo [
16]. In this “traditional” TES system, whose scheme is presented in
Figure 8, the diesel engine hot gases supply two groups of gas turbines in parallel: the turbocharging set (turbo charger in
Figure 8) and a gas turbine (gas turbine in
Figure 8) for power production. The exhaust gases of both groups of turbines feed a two pressure level HRSG that provides the steam necessary to power the dual pressure steam turbine (steam turbine in
Figure 8).
The diesel engine jacket water thermal energy is used to preheat the hot well tank inlet water coming from the steam plant condenser.
In the “improved” TES scheme proposed by the authors (
Figure 9), the sLP evaporator receives heat from the scavenge air exchanger, not from exhaust gases in the boiler as in the case of the original plant layout (
Figure 8).
Both TES schemes shown in
Figure 8 and
Figure 9 include, in addition to the steam turbine, a power gas turbine (ST+EGT solutions). In fact, the results presented below consider also the cases where the power gas turbine is not included (ST solutions).
4.3. Performance Comparison of the Optimized WHR Plants
Thanks to the calculation procedures described above, the optimization of the WHR plants was obtained by systematically varying the steam plant’s operating parameters (HP: steam high pressure; LP: steam low pressure; ΔTap: approach point temperature differences; ΔTpp: pinch point temperature differences) in a range of plausible values.
Each optimization parameter of the steam plant was varied individually (to better investigate the influence of any single parameter on the output plant values), while the remaining parameters were fixed. This optimization process has allowed to obtain a detailed sensitivity analysis, reported in [
22]. In this way we have found the optimal set of operating parameters for each plant considered, i.e., the set which provides the greatest amount of energy recovered without reducing the temperature of the exhaust gas at the HRSG outlet below 150 °C (i.e., a temperature reasonably distant from the sulfuric acid dew point). By using the design procedure it was also possible to obtain a good compromise between the heat recovered and the amount of heat exchange surface needed in the plant, so as to contain dimensions and costs of the HRSG.
From the optimization procedure, applied to the original manufacturer WHR plant (scheme of
Figure 8), the following set of optimum parameters has been obtained, shown in
Table 9.
In
Table 10 a series of data relative to the above optimized WHR plant (for both ST and ST+EGT solutions) is shown. The reported quantities are subdivided in: fixed parameters, optimizing parameters and system performances results, and refer to four diesel engine load conditions (MCR, 90% MCR, 70% MCR and 50% MCR).
Similarly the
Table 11 and
Table 12 show the same typology of data reported in
Table 9 and
Table 10 respectively, referred in this case to the modified WHR plant layout proposed by the authors (scheme of
Figure 9). In
Table 10 and
Table 12 the HRSG height is a parameter representing the required amount of heat exchange surface, once fixed the boiler’s plan dimensions.
The performance comparison of the considered TES plant schemes may be synthesized in the results reported in
Table 13.
The results reported in
Table 13 refer to the TES plants optimized for the engine running at NCR condition (90% of the MCR). In the table the quantity Δ
ηTES indicates the difference between the whole efficiency of the installation (diesel engine running at ship design condition + TES plant), evaluated with the following equation:
and the efficiency of the same diesel engine, without TES plant, setted with the tuning method suitable for an engine without WHR systems (“Heavy Load Tuning Method”), running at the same load condition.
It is to observe that the efficiency of the diesel engine at the design load, in presence of the WHR system (ηDE = 51.28%), is less than the efficiency of the same engine, at the same load, in absence of the WHR system (ηDE = 53.16%). The reason is that, in presence of the WHR system, a different engine tuning method has to be adopted, because of the greater pressure loss in the engine exhaust duct leading to the heat recovery steam generator.
Table 13 reports also the results obtained in terms of cogeneration efficiency (
ηCOG) of the installation (evaluated always with the diesel engine running at NCR load condition), this parameter being defined as:
The data reported in
Table 13 show that the WHR plant layout proposed by the authors guarantees better performance if compared with the original one.
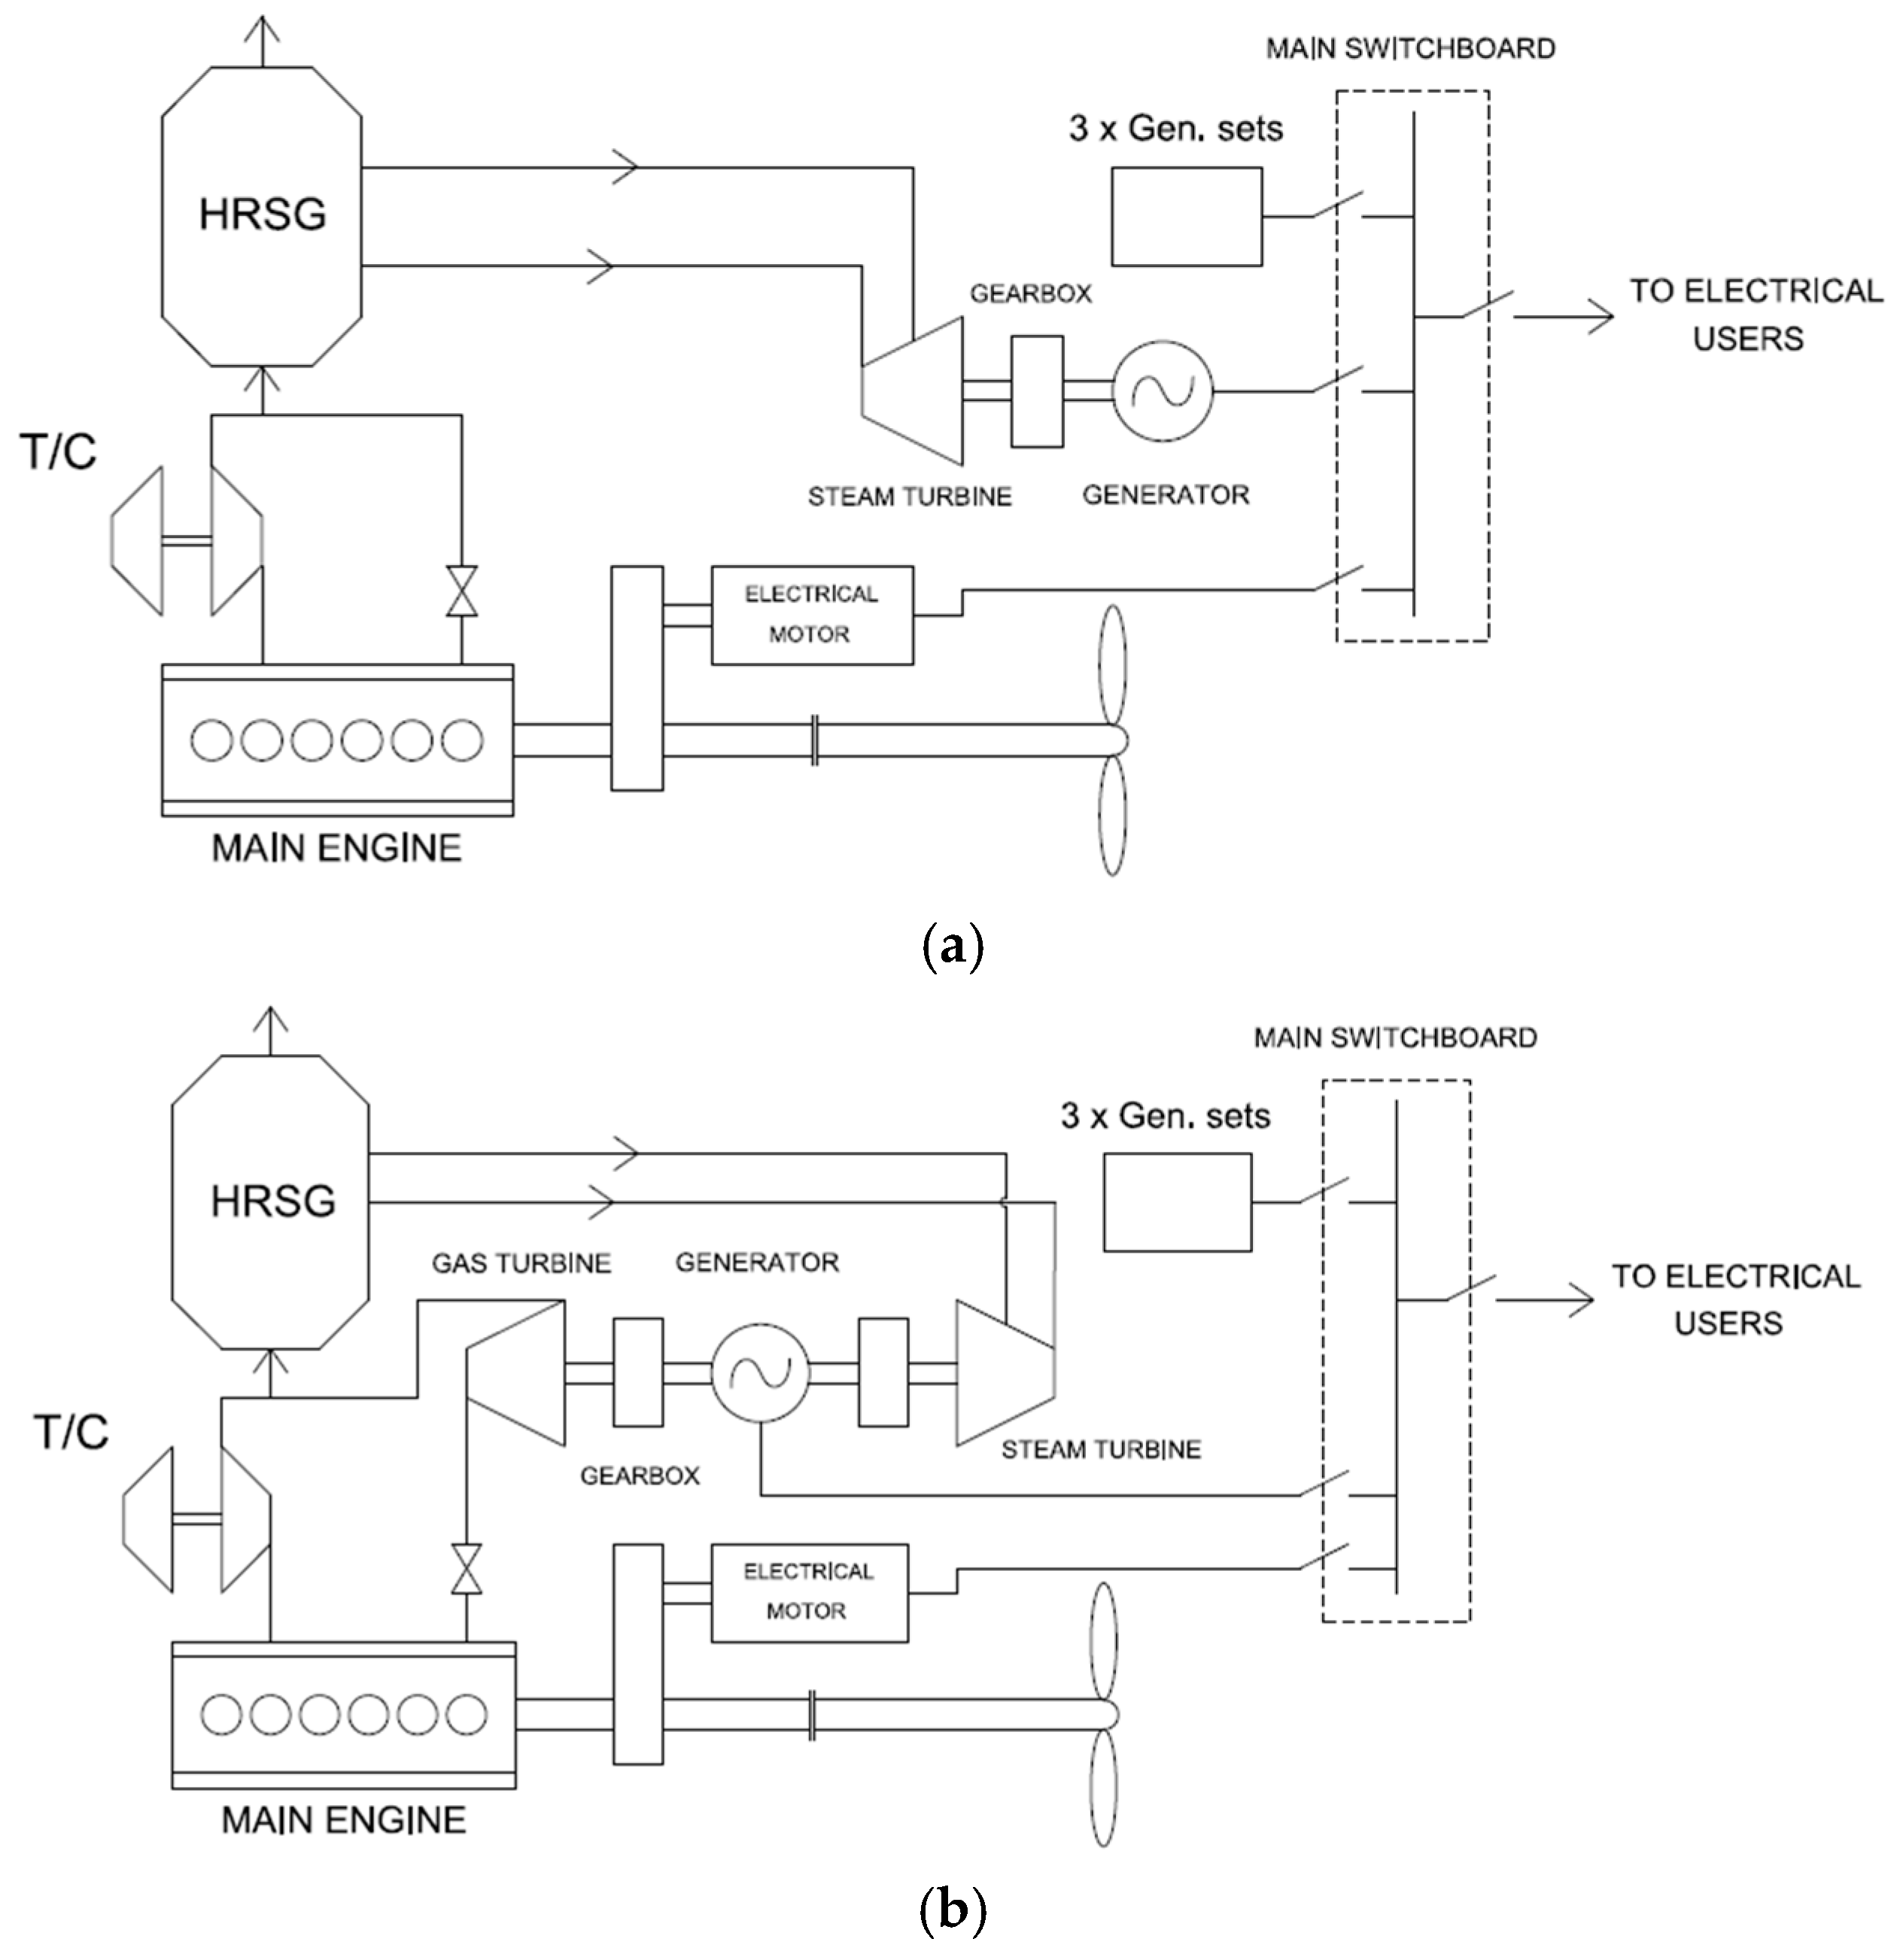
4.4. Power and Propulsion System Layouts
The waste heat recovery plants examined so far can be coupled in different manner with the board services of the reference ship [
23]. In what follows four different machinery plant schemes are proposed to satisfy the mechanical, electrical and thermal power requirements of the considered tanker ship. It should be noted that each of the schemes presented below can be provided indifferently with a typical (original) steam plant or with that one proposed by the authors [
22].
The first and the second proposed Power & Propulsion System schemes (PPS1) and (PPS2) are presented in
Figure 10.
In the PPS1 scheme (
Figure 10a), the exhaust gas heat of the main diesel engine supplies the TES plant identified by the ST+EGT solution. The Steam Turbine, used for electric power generation only, is connected to a generator which is linked to the main switchboard in parallel with the three original auxiliary diesel engines. The Exhaust Gas Turbine, instead, is mechanically connected (by a gear) to the propeller shaft, providing additional power to the ship main propulsion plant.
The plant scheme PPS2 (
Figure 10b) includes only the Steam Turbine (ST solution), which is connected to the main switchboard as in the previous scheme PPS1. The absence of the Exhaust Gas Turbine increases the steam turbine power, due to the greater thermal energy available to the HRSG.
Figure 11 shows the third and the fourth Power & Propulsion System schemes considered (PPS3) and (PPS4).
The plant layout PPS3 (
Figure 11a), is similar to the PPS2 one (with ST solution only), with the addition of an electric motor to assist the main propulsion diesel engine to move, through a gear, the propeller shaft. The electric motor offers a great flexibility in the use of the recovered energy, allowing the full exploitation of the electric power produced by the steam turbine in every working condition. Finally, the fourth Power & Propulsion System scheme (PPS4), shown in
Figure 11b, is the most complex among those here proposed. It follows the typical TES plant configuration proposed by the marine engines manufacturers. In this case the Steam Turbine and the Exhaust Gas Turbine are both connected (via clutches) to the same shaft that moves the electric generator (see figure). Similarly to the PPS3 plant layout, an electric motor assists the main propulsion diesel engine to move, through a gear, the propeller shaft. Among the four Power and Propulsion Systems here presented, this last guarantees the maximum flexibility of the produced power, at the expense of greater system complexity and cost.
4.5. Power and Propulsion Systems Comparison
This section aims to quantify the benefits, in terms of performance, economic gain and carbon dioxide (CO2) emissions, obtained by applying the described Power and Propulsion Systems (equipped with the different WHR plants examined before) to the reference tanker ship.
To calculate this gain, an unambiguous criterion has been adopted for the use of the recovered energy:
First, the needs of saturated steam of the ship is, if possible, fully satisfied by the WHR plant (the service steam flow rate is inserted as a parameter in the steam plant design code).
Secondly, the further energy recovered by the TES plant is used to meet, partly or wholly, the demand for electrical energy of the ship.
Finally, if any recovered energy is still available and if the PPS layout does not prevent it, this power is sent to the propeller shaft, allowing the vessel to reach the same design speed with a lower power produced by the diesel engine, and therefore a lower fuel consumption.
The main technical and economical results of the comparisons relative to the considered PPS and steam plants layouts, in normal sea going condition (without ship tank heating), are reported in
Table 14.
For the PPS1 plant it can be noted that the authors’ steam plant allows a greater ST power if compared to the original one, with the same EGT power. In this plant layout, however, the electric power generated by ST can be used only for board services (see
Figure 10a). This power is greater as compared with the average electrical load required on board (
Table 8), so the exceeding quantity is not utilizable (‘nu’ in the ‘TES electric power’, line 16 in
Table 14); this is true also for the original steam plant, although in less quantity.
In a real application, this “not utilizable” energy will not be produced simply partializing the ST flow in the WHR steam plant.
The PPS2 plant is similar to the PPS1 except for the absence of the EGT (
Figure 10b). So, in this case the TES power delivered to the propulsion (line 7 in
Table 14) is zero; this involves a greater DE power compared to the PPS1 case. Since the DE SFC is less in absence of the TES plant, with the PPS2 solution the annual fuel outlay saving for MP (line 11 in
Table 14) is negative. This strongly reduces the total fuel outlay annual saving (line 21 in
Table 14) compared to the PPS1 case. The PPS2 plant, with the original steam plant scheme, produces a great amount of not utilized (nu) electric power (line 16 of
Table 14).
As previously explained, the authors’ steam plant layout is characterized by a higher value of ST power, so it can produce a greater amount of electric power, that in the PPS2 plant cannot be used for the propeller; this will generate an even larger amount of “nu” power. For this reason the authors steam plant scheme is not considered for the PPS2 solution.
The PPS3 plant layout allows to use the steam plant power exceeding the ship electrical needs for moving the propeller by an electric motor (as shown in
Figure 11a). This improves the fuel cost annual saving of this solution compared to the PPS2 one (see line 21 in
Table 14), because it allows to set to zero the value of “nu” power (line 16 in
Table 14). The PPS3 annual saving is however worse than that of the PPS1 plant type, due the absence of the EGT which implies a reduction in the amount of overall recovered power.
The PPS4 plant scheme is characterized by the biggest fuel outlay annual saving, compared to the others PPS considered (line 21 of
Table 14), if combined with the authors steam plant layout. This depends on the great flexibility of the PPS4 plant layout in using ST and EGT power for propulsion and/or electric energy production, as shown in
Figure 11b.
Table 15 summarizes the data regarding the annual fuel outlay saving and the subsequent payback time (i.e., the time required for the savings to repay the cost of the investment) of the considered PPS plant types. The results presented in
Table 15 are valid even in the case of normal seagoing condition with tank heating, condition not considered in this paper, but reported in [
23].
The cost of each PPS used to calculate the payback time is merely indicative and it has been roughly estimated with the support of MAN. These costs include the purchase and installation of components required to build the WHR system and are highly variable, depending on several factors (nationality of the yard, negotiations between shipowner and shipyard, negotiations between the yard and the licensed manufacturer of the components etc.). The cost of the installation has been assumed the same for both traditional and authors’ steam plant. This last is an innovative proposal, so any comparison with existing applications is not available. This approximation was anyway considered acceptable because the two systems, as evidenced in [
22], have about the same heat exchange surface in contact with the DE exhaust gases.
The comparison between the four considered PPS plants has been carried out taking into consideration also the dioxide carbon emissions (CO
2), this last parameter being considered through the evaluation of the Energy Efficiency Design Index (EEDI) for the reference ship in sea going conditions. The conceptual meaning of the EEDI index, introduced by IMO resolutions [
3,
4], may be summarized as follows:
IMO has developed the EEDI index to express the performance of each ship design, in order to stimulate the quantification and the progressive reduction of green-house gas emissions in marine field. To this aim IMO prescribes the progressive reduction of the maximum allowable EEDI index for new constructions over time. The entire index formula and the values considered for the present application are specified in a previous authors’ paper [
23]. In order to assess how the possible adoption of an innovative WHR system can affect the CO
2 emissions of the vessel, the authors have determined the EEDI index values of the reference ship, both in its original configuration and simulating the adoption of each of the PPS plant schemes described before.
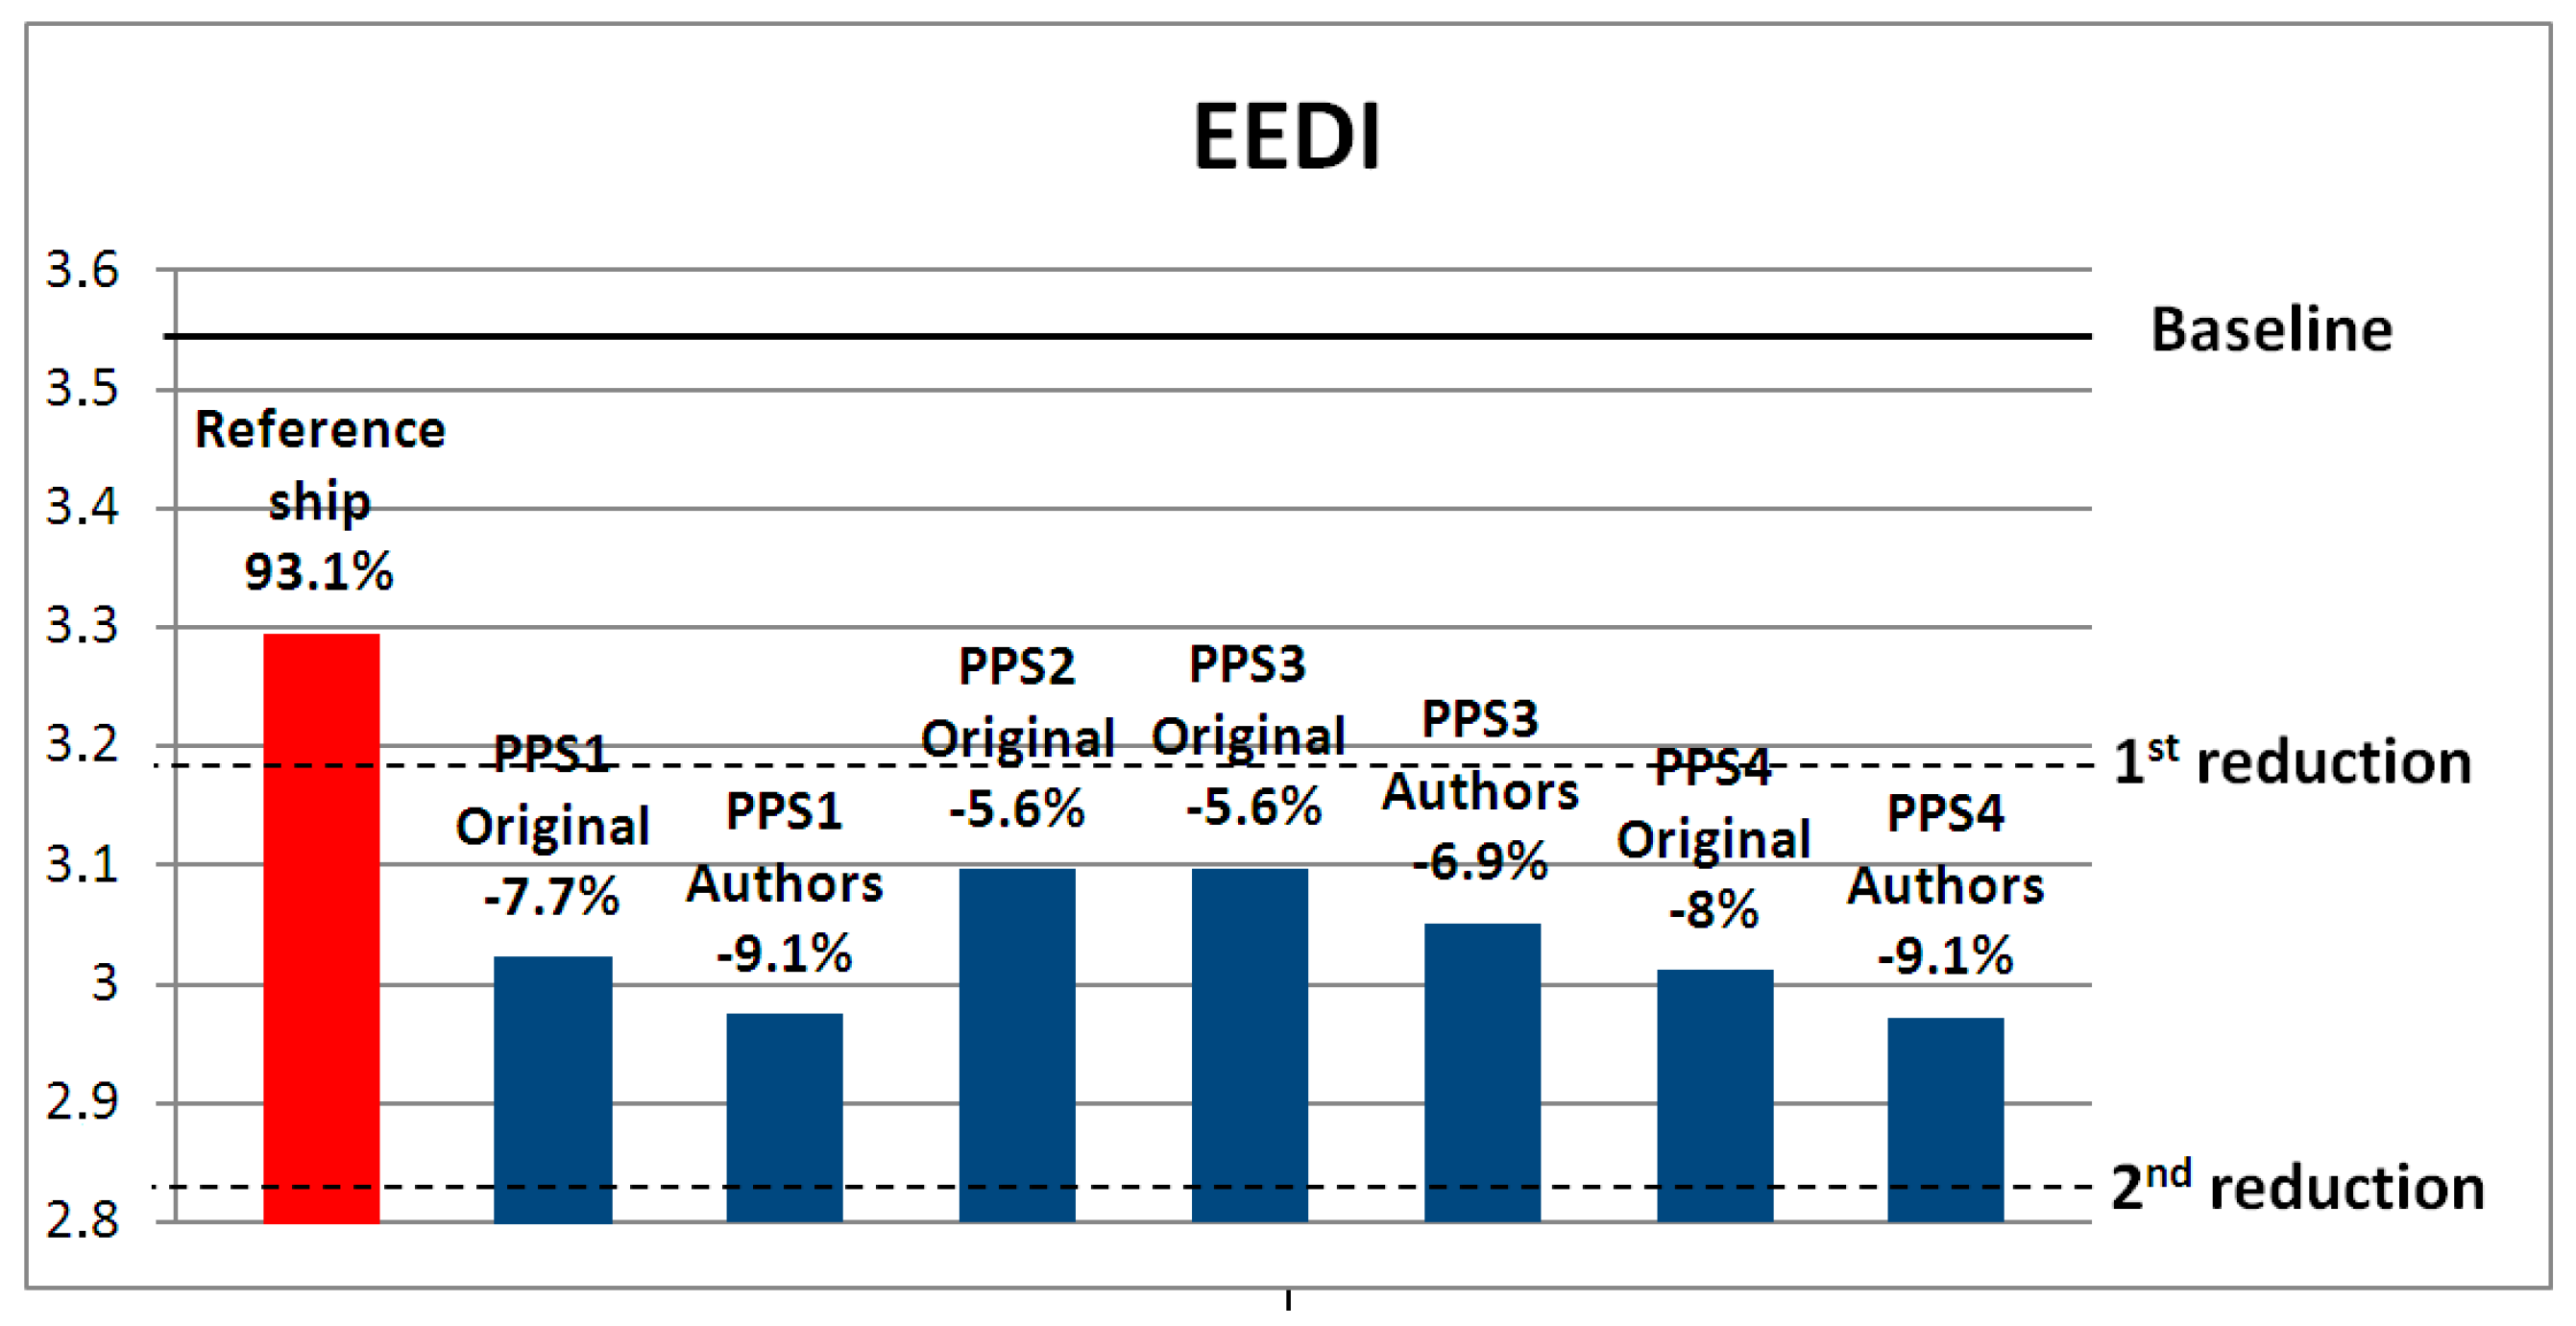
The results are summarized in
Figure 12, where the horizontal solid black line indicates the reference EEDI index (baseline) given by IMO for a tanker with the same tonnage of the considered Premuda ship, while the dash-dot black lines indicate the EEDI maximum allowed values expected in the next two phases of the CO
2 emissions abatement project.
Always in
Figure 12 the first column indicates the EEDI index value of the reference ship in its original design; in the same figure the other columns report the EEDI index values of the same vessel with the different PPS plant layouts (with original or authors’ steam plant options) presented in the paper. It can be seen that the proposed PPS plant schemes allow a reduction of the EEDI index, referred to the ship original design, between −5.6% for the PPS2 and PPS3 solutions (original steam plant), and −9.1% for the PPS1 and PPS4 solutions (authors’ steam plant). Considering that the percentage drop of the maximum allowable EEDI value during the different phases of the project is 10% every phase, it means that the adoption of these WHR systems allows to cover at least more than half of the imposed reduction. This is a very good result, considering that the adoption of an innovative “waste heat recovery system” is only one of many possible design precautions indicated by IMO in order to reduce the greenhouse gas emissions of international shipping [
4].


