Article

Watching the Smoke Rise Up: Thermal Efficiency, Pollutant Emissions and Global Warming Impact of Three Biomass Cookstoves in Ghana

1
Technology Consultancy Centre, College of Engineering, Kwame Nkrumah University of Science and Technology, PMB UPO, Kumasi, Ghana
2
Barrett, The Honors College, Arizona State University, Mesa, AZ 85212, USA
3
Department of Agricultural Engineering, College of Engineering, Kwame Nkrumah University of Science and Technology, PMB UPO, Kumasi, Ghana
4
Faculty of Renewable Natural Resources, College of Agriculture and Natural Resources, Kwame Nkrumah University of Science and Technology, PMB UPO, Kumasi, Ghana
5
Department of Information Systems and Decision Sciences, KNUST School of Business, Kwame Nkrumah University of Science and Technology, PMB UPO, Kumasi, Ghana
6
D-Lab, Massachusetts Institute of Technology, 77 Massachusetts Avenue, Cambridge, MA 02139, USA
*
Author to whom correspondence should be addressed.
Energies 2017, 10(5), 641; https://doi.org/10.3390/en10050641
Submission received: 3 December 2016 / Revised: 28 April 2017 / Accepted: 2 May 2017 / Published: 6 May 2017
(This article belongs to the Collection Bioenergy and Biofuel)

Abstract

:
In Ghana, about 73% of households rely on solid fuels for cooking. Over 13,000 annual deaths are attributed to exposure to indoor air pollution from inefficient combustion. In this study, assessment of thermal efficiency, emissions, and total global warming impact of three cookstoves commonly used in Ghana was completed using the International Workshop Agreement (IWA) Water Boiling Test (WBT) protocol. Statistical averages of three replicate tests for each cookstove were computed. Thermal efficiency results were: wood-burning cookstove: 12.2 ± 5.00% (Tier 0); coalpot charcoal stove: 23.3 ± 0.73% (Tier 1–2); and Gyapa charcoal cookstove: 30.00 ± 4.63% (Tier 2–3). The wood-burning cookstove emitted more CO, CO2, and PM2.5 than the coalpot charcoal stove and Gyapa charcoal cookstove. The emission factor (EF) for PM2.5 and the emission rate for the wood-burning cookstove were over four times higher than the coalpot charcoal stove and Gyapa charcoal cookstove. To complete the WBT, the study results showed that, by using the Gyapa charcoal cookstove instead of the wood-burning cookstove, the global warming impact could be potentially reduced by approximately 75% and using the Gyapa charcoal cookstove instead of the coalpot charcoal cookstove by 50%. We conclude that there is the need for awareness, policy, and incentives to enable end-users to switch to, and adopt, Gyapa charcoal cookstoves for increased efficiency and reduced emissions/global warming impact.

1. Introduction

Inefficient burning of biomass fuels in poorly designed and fabricated cookstoves results in indoor air pollution that affects the health of users and contributes to global warming and climate change. In poorly ventilated dwellings, indoor smoke can be 100 times higher than acceptable levels for fine particles. Smoke from cooking fuels is estimated to account for nearly 2 million deaths in 2004, 3.5 million deaths in 2010, and 4.3 million deaths in 2012, more than 99% of which occur in developing countries [1,2,3]. In Ghana, about 73% of households use firewood (41.3%) or charcoal (31.5%) for cooking, with LPG (liquid petroleum gas) (22.3%) and other sources, like kerosene (0.2%), electricity (0.3%), and crop residue (0.4%), constituting the rest [4]. Further, over 13,000 annual deaths are attributed to exposure to household air pollution from inefficient indoor combustion [5]. Personal exposure to smoke from cookstoves is particularly high among women and young children, who spend the most time near the domestic hearth [6,7].
Incomplete burning of solid biomass releases a toxic mix of health damaging pollutants that contribute to climate change at local, regional, and global levels. Black carbon, which results from incomplete combustion, contributes substantially to carbon dioxide warming globally [8]. It is, therefore, estimated that universal adoption of advanced biomass cookstoves could have a significant impact on carbon dioxide (CO2) emissions reduction [9]. Well-designed cookstoves have been shown to mitigate 1.5 to 3.6 tons of carbon dioxide equivalent (CO2e), thus reducing emissions of greenhouse gases [10]. There is mounting evidence that biomass burned inefficiently contributes to climate change at the local, regional, and global levels, suggesting that the climate change debate needs to take household energy issues into consideration [11,12]. According to Stockholm Energy Institute (SEI) [12] the global technical potential for greenhouse gas (GHG) emission reductions from improved cookstove projects has been estimated at 1 gigatonne of carbon dioxide (1 Gt CO2) per year, based on an estimate of 1–3 tons of CO2e per stove.
The reliance on solid fuels for cooking and heating has drawn attention lately because of the role of black carbon in global warming. Black carbon originates from incomplete combustion of fossil fuels, particularly diesel, but also of biomass and other solid fuels at the household level. There is a growing body of evidence that black carbon alone may be the second-most-important factor affecting the rise in global temperatures after carbon dioxide (CO2) [13,14]. Inhaling particulate matter (PM2.5) can cause acute respiratory infections and a host of other diseases [15], and particulate matter can increase global climate change [16]. To protect the health of the family, high levels of indoor air pollution must be prevented. Similarly, carbon monoxide (CO) is one of the primary products of incomplete combustion (PICs). It has a global warming potential (GWP) of 1.9 times that of CO2 [17].
The objectives of this study are, in summary, to: (1) analyze thermal efficiency, carbon dioxide (CO2), fine particulate matter (PM2.5), and CO emissions; and (2) determine the global warming impact and estimate annual global warming impact potential of three biomass cookstoves that are commonly used in Ghana for improvements in design and development. The results are intended to contribute to knowledge in regard to performance metrics of different biomass cookstoves. This will contribute to raise awareness of the need for design improvements and provide evidence-based data for policy and incentives to enable end-users to switch to better-designed and improved cookstoves for economic, heath, and climate benefits.

2. Materials and Methods

2.1. Materials

The wood-burning cookstove (a), coalpot charcoal stove (b), and Gyapa charcoal cookstove (c) were the three cookstoves evaluated in this study (Figure 1). The three cookstoves were selected because they are among the most commonly used biomass cookstoves in small towns and cities of Ghana. These cookstoves were purchased at random in local markets.

2.2. Initial Test Conditions

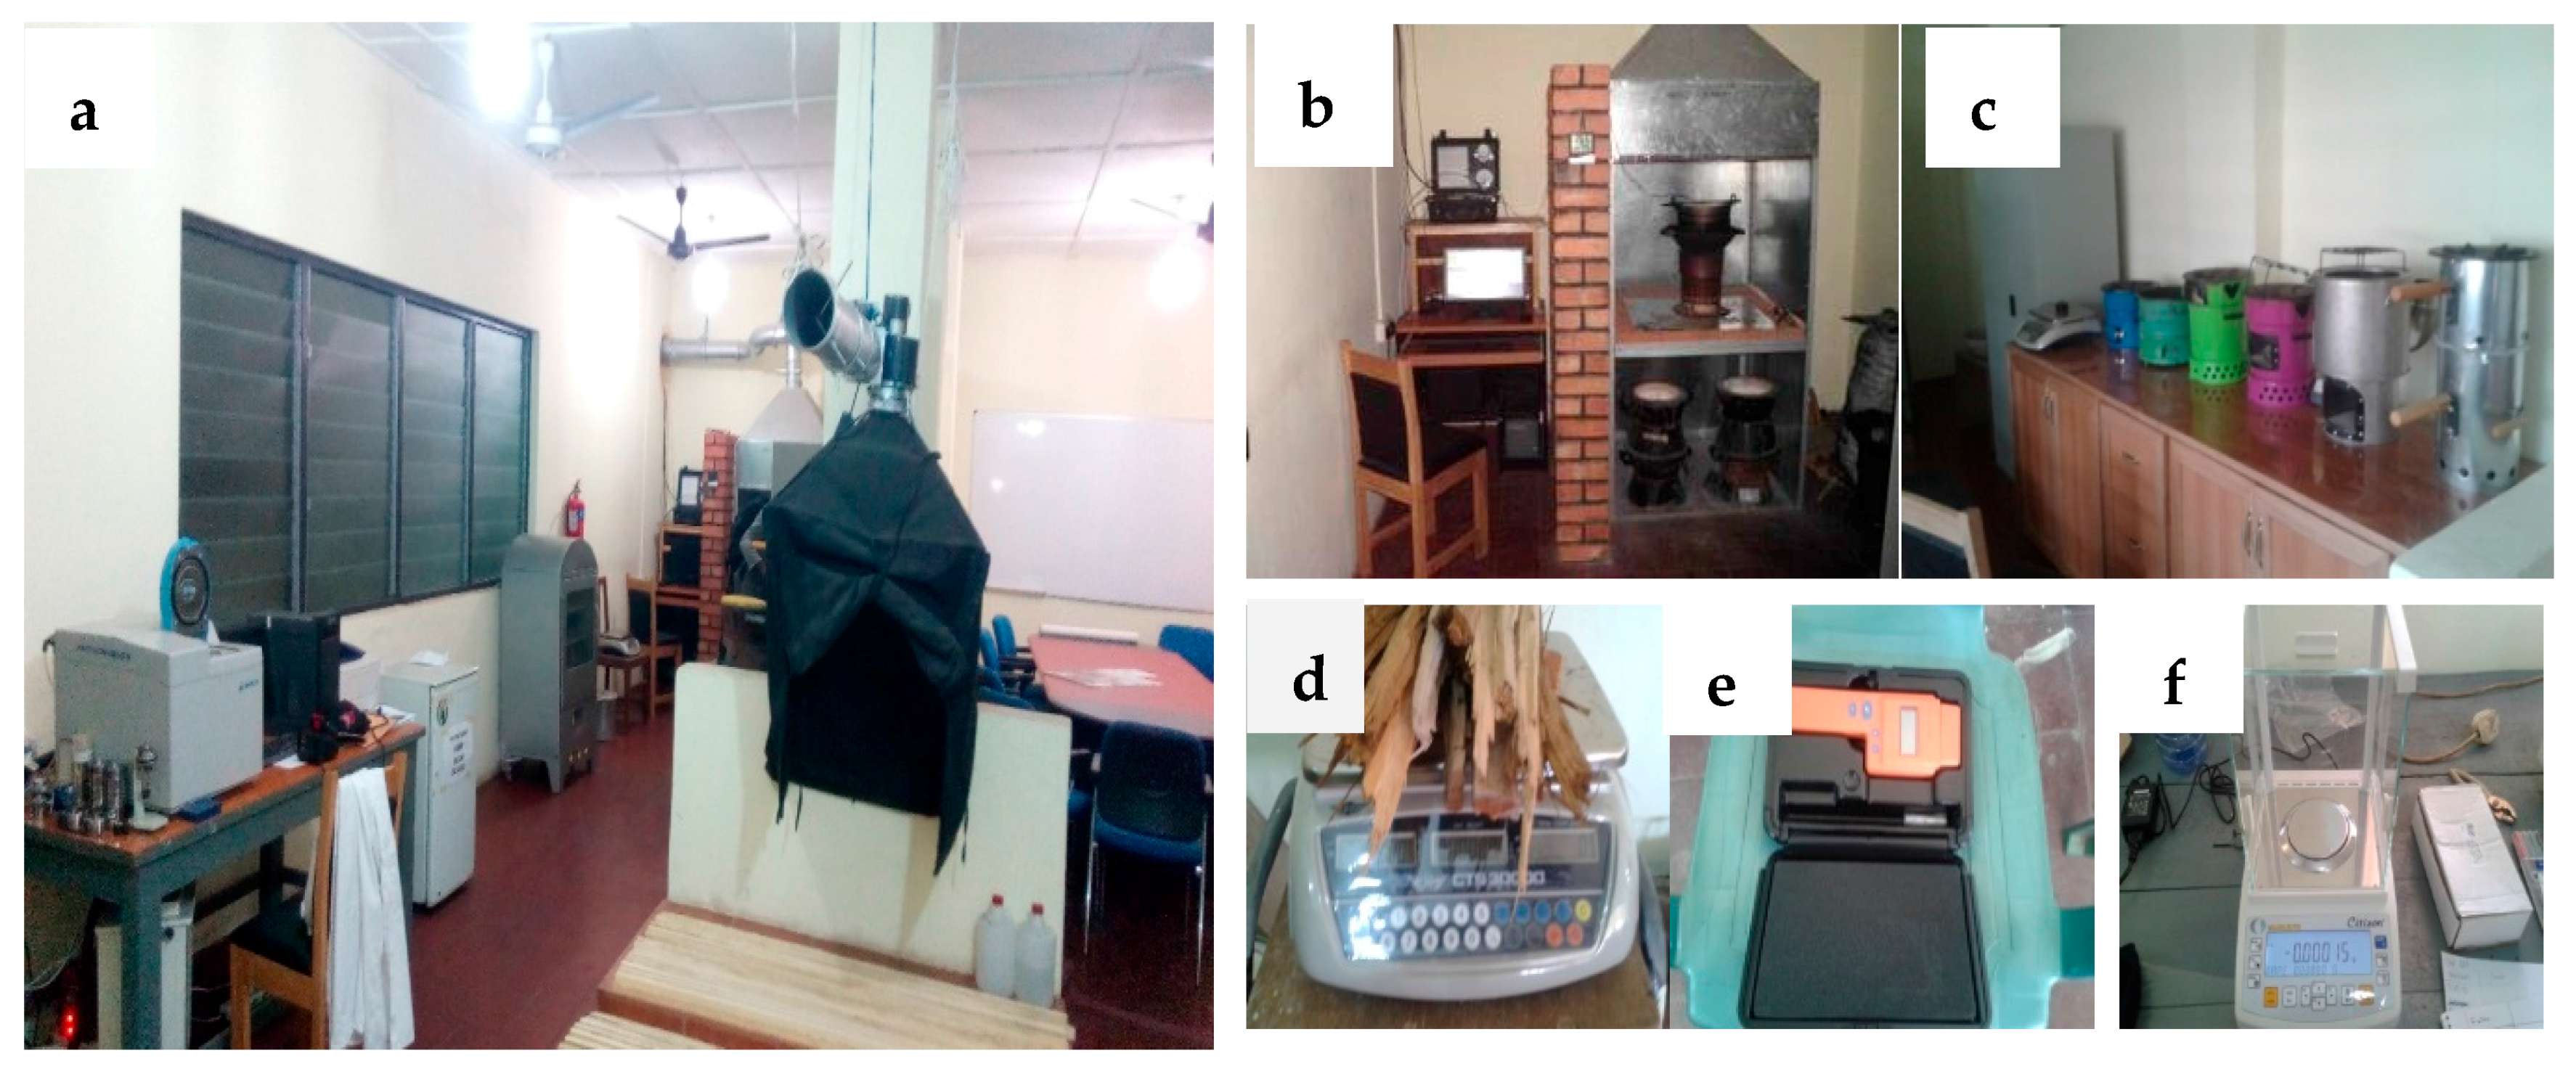
Appropriate fuels for each cookstove were used during testing. Fuel properties were measured from representative samples and are included in Table 1. Figure 2 shows the laboratory, equipment, and measuring devices that were used for the tests. Note that this testing does not account for emissions during the production of charcoal.

2.3. Methods and Data Analysis

The cookstoves were evaluated at the Cookstove Testing and Expertise Laboratory (C-Lab) at the Technology Consultancy Centre, KNUST, Kumasi-Ghana. The laboratory emission monitoring system (LEMS, Aprovecho Research Centre, Cottage Grove, OR, USA) is used to perform water boiling tests (WBTs) according to the current protocol [18]. The LEMS uses an actively-ventilated, total capture hood to remove emissions. The sheet metal hood and large variable speed blower enable the LEMS to accurately measure the emissions from cookstoves (CO, CO2, PM2.5) over a range of sizes and firepower. The laboratory allows for careful control of the environment so that tests are more consistent and repeatable.
A continuous sample is pumped from the total emissions and analyzed for CO2, CO, and PM2.5 concentrations. Analog signals from the sensors are read by a data acquisition board, and concentration data are displayed in real-time on a computer monitor. Total PM was measured gravimetrically and used to calibrate the optically-measured PM according to the ISO/IWA guidelines [19]. Identical 7 L stainless steel cooking pots were used in the study to boil water. Fuel moisture content was determined using a moisture meter (Delmhorst J-2000, Delmhorst Instrument Company, Towaco, NJ, USA) and calorific value is measured using a bomb calorimeter (Sundy SDC5015, HunanSundy Science and Technology Co., Ltd., Changsha, China).
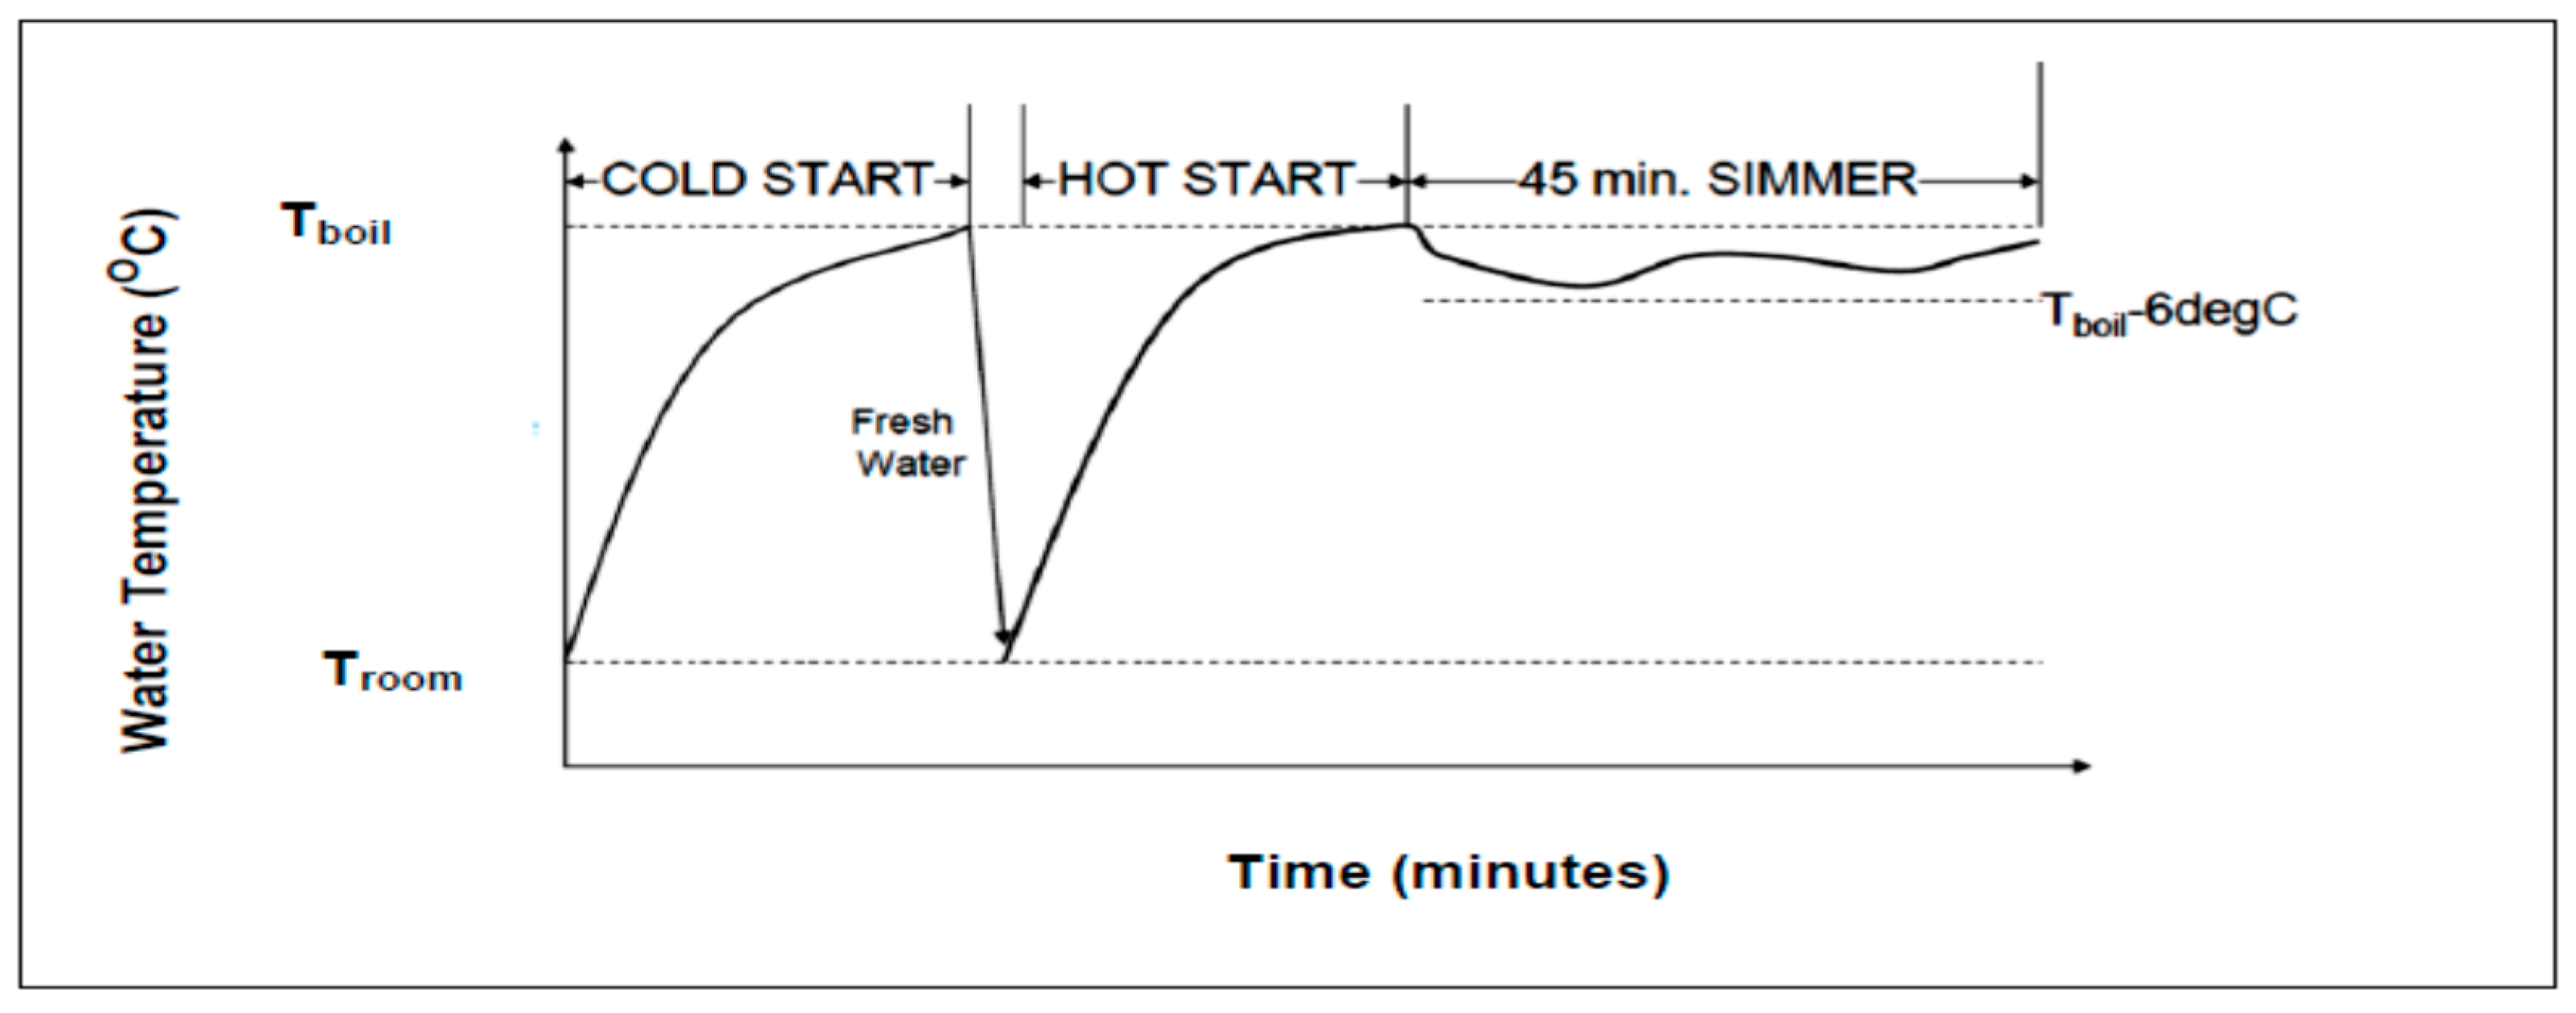
The protocol used for the test was the water boiling test (WBT). This is a standardized test in which 5 L of water is boiled for each phase—high power with the cookstove at room temperature (high power, cold start); at steady operating temperature (high power, hot start); and at a simmer for 45 min (low power, 3–6 °C below full-boiling temperature). The WBT is composed of three phases: cold-start, hot-start, and simmer. McCarty in Global Alliance for Clean Cookstoves (GACC) [18] used the temperature and time model depicted in Figure 3 for providing a clear and vivid understanding of the three phases involved in the process.
The fuel consumed and emissions produced for each of the three stages are measured and analyzed as a time-weighted average to determine the WBT key indicators [18,20]. Three (3) replicate WBTs were conducted for each cookstove to calculate the average performance metrics. Data were analyzed in conjunction with the WBT 4.2.3 data calculation spreadsheet. IWA performance metrics are connected with tier ratings (Tiers 0–4) to allow for easier comparability and communication of results. Statistical significance and standard error for all tests were determined using the Student's t-test with 95% confidence interval. This is appropriate when measurements are assumed to be normally distributed, but the sample size is small (n < 30) [21,22].

3. Results and Discussion

3.1. Fuel and Energy Consumption, Time to Boil, and Thermal Efficiency

3.1.1. Fuel and Energy Consumption

Fuel used and energy consumption rate values were computed by averaging the cold start and hot start values and then adding the low power values [23]. The results in Table 2 indicate that the Gyapa charcoal cookstove (Gyapa type) used 1036 ± 212 (824–1248) g of fuel, the coalpot cookstove used 1178.1 ± 230 (948–1408) g of fuel, while the wood-burning cookstove used 2872.3 ± 390 (2482.3–2972.3) g of fuel. The fuel used correlated with the energy consumed per minute. The results indicated that the Gyapa charcoal cookstove consumed less energy per minute 669 ± 75 (594–744) kJ/min to boil the water compared to coalpot charcoal stove 844 ± 152 (692–996) kJ/min and wood-burning cookstove 1237 ± 269 (968–1509) kJ/min.

3.1.2. Time to Boil

The time required to bring 5 L of water to a boil was computed by averaging the cold start and hot start values Time to boil is an important practical metric because users often value time savings and convenience [23]. Among the stoves tests, the Gyapa charcoal cookstove was the fastest to boil 5 L of water. A typical temperature time profile during the WBT is presented in Figure 3.

3.1.3. Thermal Efficiency

Thermal efficiency is a metric representing the fraction of heat produced by the burning fuel that is transferred into the pot. The remaining energy is lost to the environment. The cookstove performance test results in Table 2 indicate that the average high power thermal efficiency of the Gyapa charcoal cookstove (30%) was 6.7% and 17.8% percentage points higher than the coalpot charcoal cookstove and the wood-burning cookstove, respectively.
According to Energica Ghana, the efficiency of wood-burning stoves available on the Ghanaian market is 8–15% [24]. Coalpot charcoal cookstove thermal efficiency determined from this work is consistent with Boafo-Mensah et al., who determined a thermal efficiency at high power, cold start of 22.7% and at hot start of 24.0% for coalpot charcoal cookstove [25]. Aidkins et al. reported thermal efficiencies of up to 36% for charcoal cookstoves [26]. For the Gyapa charcoal cookstove, Kshirsagar and Kalamkar reported that some researchers tested many African charcoal stoves, including the Gyapa charcoal cookstove, to calculate the average efficiency of 34% [27]. This result is consistent with our study, which measured thermal efficiency of the Gyapa charcoal cookstove at high power, hot start of 27.3 ± 5.7%.
The Gyapa charcoal cookstoves in Ghana have some design features that help them to reach higher efficiency. Typically, they consist of a ceramic liner in a metal cladding (see Figure 1c). The ceramic liner encloses the fire and provides better insulation compared to the traditional wood-burning cookstove or coalpot and all-metal charcoal cookstoves. Such design features lead to higher efficiency, a hotter flame, and improved combustion. However, there are opportunities to optimize some design characteristics, such as the shape of the stove, the gap between the pot and the burning charcoal, and the size of the grate holes [27]. Optimizing such features can bring about improvement in the air circulation to recycle heat and create the draft needed for more efficient combustion [27].

3.2. Emission Performance Results

3.2.1. General Emissions

From the results in Table 3, the wood-burning cookstove emitted more total CO, CO2, and PM2.5 than the coalpot charcoal stove and the Gyapa charcoal cookstove. In general charcoal cookstoves emit less PM2.5, but can have considerable CO emissions compared to wood cookstoves [23]. The fuel type (wood or charcoal) and combustion conditions (e.g., mixing, temperature, residence time) influence the emissions performance. Charcoal is made by carbonizing wood, during which volatile compounds are burnt off, which results in relatively few smoke emissions compared to unprocessed firewood during cooking. Although the Gyapa charcoal cookstove showed better thermal performance, its indoor emission PM2.5 were slightly higher than those of the coalpot charcoal stove. A reason for this is that in the Gyapa charcoal cookstove the fire is enclosed in a ceramic liner which has a large mass that is used to insulate and reduce heat loss. The ceramic liner walls absorb heat and cool the fire as they heat up causing higher emissions of products of incomplete combustion (PIC), including PM2.5 [28].

3.2.2. CO2 and CO Emissions

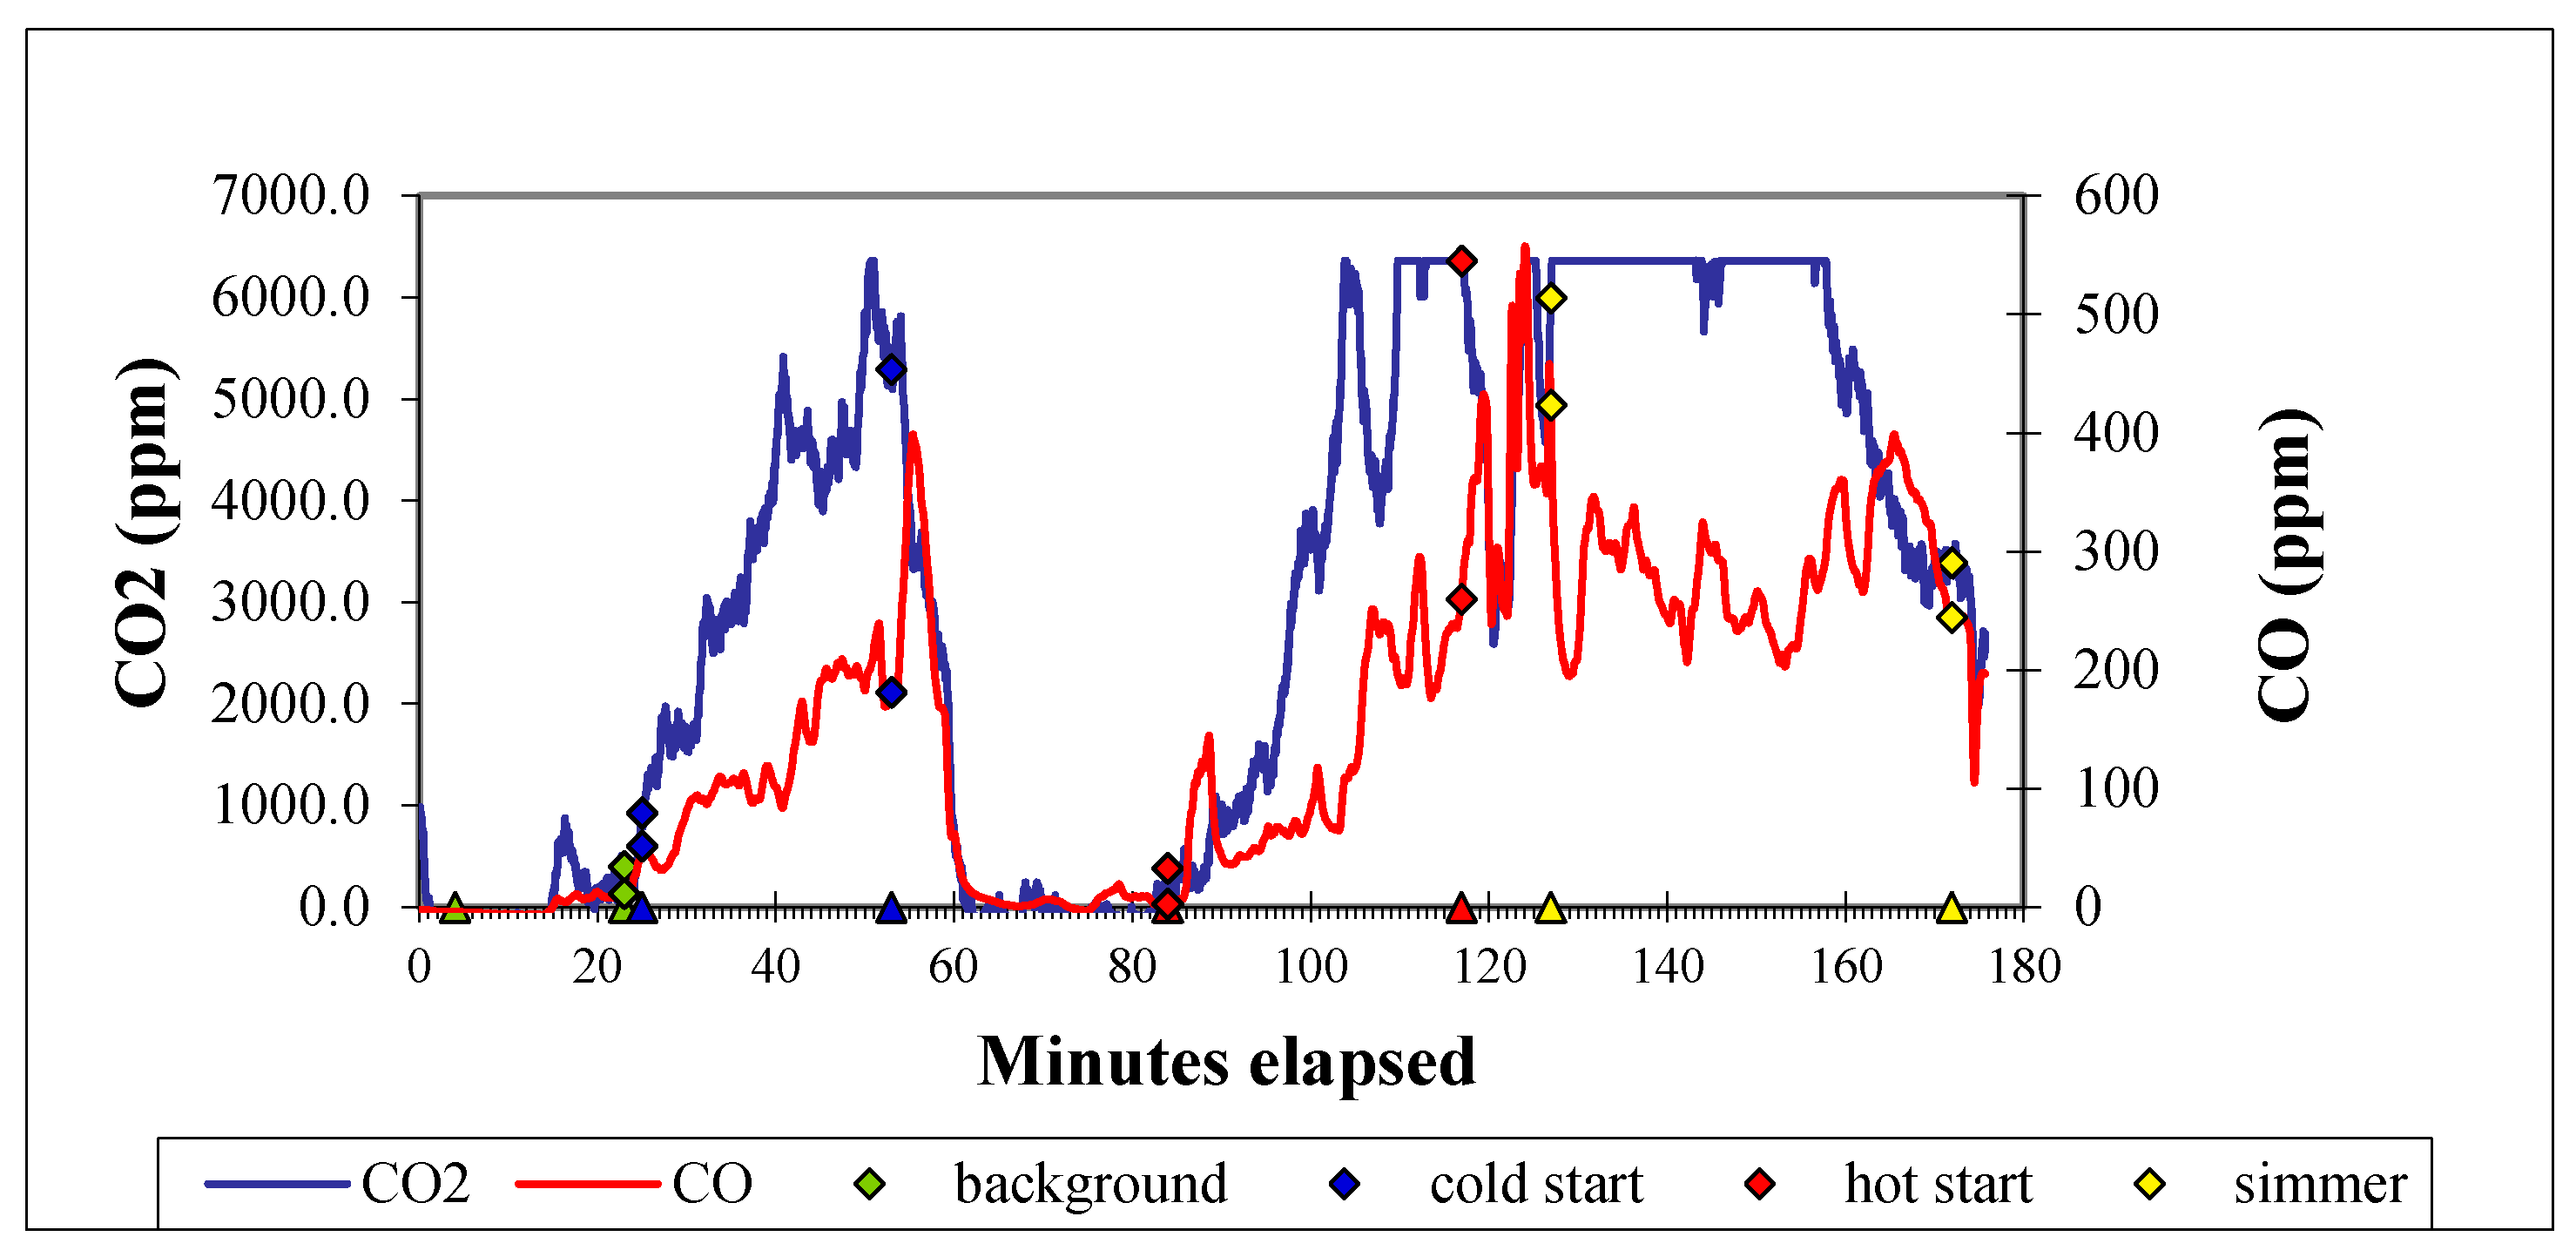
Figure 4 shows an example of CO2 and CO concentration trends during a cookstove test of this study. From the results, the trends of CO2 and CO when water was brought to a boil and simmered for 45 min seemed to be related. As the wood-burning cookstove heats up, both CO and CO2 increase during the cold start, high power phase. However, CO2 remains fairly constant while CO increases during the hot start, high power phase. Overall, the results show a positive relationship, although in the case of the wood-burning cookstove and coalpot charcoal stove, CO2 and CO levels were higher than the Gyapa charcoal cookstove. For most of these cookstoves the temperature is not sufficiently high to ignite the CO-air mixture in the exhaust gases. CO is created by incomplete combustion of the fuel. It is a poisonous, odorless gas which should be minimized to meet the ambitious health targets for household fuel combustion (≤0.42 g/min, Tier 4) [19].
The CO and CO2 measurements were taken in the sample line with a suction pump that extracts emissions from the stoves to the sensors. Although the trendlines indicate very high emission levels for CO during the test, personal exposure to CO emissions is relatively low. This is because the laboratory test is conducted under controlled conditions. The stove is placed directly under the hood, which collects the emissions and air from the laboratory. To find the CO concentrations that are likely to exist in the breathing zone of typical stove users, Pennise et al. [29] conducted a study in Ghana to measure the average 24 h kitchen CO concentrations by the primary method, the HOBO CO Logger, indicated 40% reduction from a mean = 12.3 ppm, SD = 9.9 ppm, for traditional clay wood stoves or open fire compared to a mean = 7.4 ppm, SD = 6.1 ppm, after adoption of the Gyapa cookstove. According to the WHO, 24 h air quality guidelines (AQG) for CO should be 6.11 ppm (7 mg/m3) at a temperature of 25 °C (77 °F) and a pressure of 1 atmosphere (760 mm Hg) [30]. From the evidence, the average kitchen concentration level of CO (mean = 7.4 ppm, SD = 6.1 ppm) for Gyapa cookstove is slightly above the WHO, 24-h AQG (6.11 ppm). Despite the significant improvement associated with the Gyapa cookstove, further design and operation enhancements are needed to conform to the WHO air quality standard for CO that is considered not harmful to human health.

3.2.3. Particulate Matter (PM2.5)

The emission test results (Table 3 above) showed that the indoor particulate matter (PM2.5) emissions of 169.8 mg/min (Tier 0) for the wood-burning cookstove was higher than the indoor PM2.5 emissions of 5.3 mg/min (Tier 3) for the coalpot charcoal stove and indoor emissions PM2.5 of 9.95 mg/min (Tier 2) for the Gyapa charcoal cookstove. The data indicated that the indoor PM2.5 emission for the Gyapa charcoal cookstove was higher than the PM2.5 emission for the coalpot charcoal stove. A reason for that had already been given above (under general emissions).

3.2.4. Emission Factors

Emission indicators that are also included in this study are emission factors (EFs). EF is a metric that quantifies the magnitude of emissions normalized by fuel or energy consumed [31]. Mass EF indicates the emission of a pollutant per unit of dry fuel that is consumed (g pollutant/kg fuel); while energy EF indicated pollutant emissions per unit fuel energy during combustion on a net calorific basis (mg/MJ or kg/TJ) of emission [32,33]. EFs for PM2.5, CO2, and CO are presented in Table 4. EFs for CO2 are presented in kg/TJ to enable a comparison to 2006 IPCC Guidelines [33]. Similar to total emissions, EFs for PM2.5, CO2, and CO for the wood-burning cookstove were higher than the EFs for coalpot charcoal stove and Gyapa charcoal cookstoves. From the data the CO2 EFs for charcoal burned in the coalpot stove (117,440 kg/TJ) and the Gyapa charcoal cookstove (71,660 kg/KJ) falls within the lower and upper values presented in the 2006 IPCC Guidelines values for charcoal (95,000–132,000 kg/TJ) [33]. The CO2 EFs for the wood-burning cookstove (119,550 kg/TJ) also falls within the 2006 IPCC Guidelines value of (95,000–132,000 kg/TJ) for wood/wood waste fuel combustion [31]. According to Gómez et al. [33] and Naussbaumer et al. [34] emissions of each greenhouse gas from stationary sources are calculated by multiplying fuel consumption by the corresponding emission factor (EF).
The PM2.5 emission factor for charcoal fuel burned in the coalpot charcoal cookstove of 0.47 g/kg is consistent with the ePM2.5 emission factor for charcoal (0.20 ± 0.1 g/kg) reported by Amaral et al. [35]. The PM2.5 emission factor for woodfuel burned in the wood-burning cookstove (7.74 g/kg) compares favorably with the PM2.5 EF for burning of biomass with aircraft sampling of tropical forest (4.50 ± 2.54 g/kg) and crop residue (6.19 ± 2.36 g/kg) reported in Amaral et al. [35]. Overall, the EFs in mg/kJ for the wood-burning cookstove were 2–4 times higher than the EFs for the Gyapa charcoal cookstove. The implication is that burning wood in the wood-burning cookstove emitted more pollutants into the atmosphere than the burning of charcoal in the Gyapa charcoal cookstove. The significance is that such knowledge is helpful for developing mechanisms to help achieve the goal of reducing pollutant emissions in locally-fabricated cookstoves.

3.3. Pot Temperature and Relative Humidity

In Figure 5 the relative humidity (RH) of the environment of the laboratory was 31–54%. On average the cold start temperature was 26 ± 1 °C, the hot start was 97 °C, and simmering was 95 °C. The study results showed little variation in temperature, as well as RH, of the laboratory environment. The results of the RH and temperature indicated that the laboratory environment was within a suitable range. However the influence of temperature over RH can be part of further research to be explored in the future. In general, when temperature is high and RH is low, evaporation of water is rapid. However, when the temperature is low and RH is high, evaporation of water is slow. RH below 20% is considered extremely low. Indoor RH should be kept above 30–40% to reduce the likelihood of the occupant’s nasal passages drying out [36]. Humans can be comfortable within a wide range of humidities depending on the temperature—from 30% to 70%, but ideally 50–60% [37].

3.4. Standard Guidelines for the Indicators (Tier Designation)

The IWA Tier designation provides standard guidelines for the performance indicators. Advancing from Tier 0 toward Tier 4 signifies improvement. Thermal efficiency and emission factors and rates are key measures that many cookstove programs are adopting. In general, the lower the emissions, the higher the efficiency of cookstoves [38]. The tiers of performance provide a map towards incremental improvement from traditional open fire cookstoves (Tier 0) to aspirational goals for meeting ambitious health and/or environmental targets (Tier 4) [19]. According to GACC [39], cookstoves that meet Tier 2 for efficiency or higher will be counted as efficient; cookstoves that meet Tier 3 for indoor emissions or higher will be counted as clean, as it relates to potential health impacts; and cookstoves that meet Tier 3 for overall emissions, or higher, will be counted as clean, as it relates to the potential for environmental impacts.
The tier designations for thermal efficiency and emissions from the study are presented in Table 5. With an efficiency of 30.00 ± 4.63% (25–35%) (Tier 2–3) the Gyapa charcoal cookstove is counted as efficient. With indoor emission PM2.5 of 5.3 mg/min (Tier 3) the coalpot charcoal stove is counted as clean. However, care should be taken to interpret the indoor PM2.5 emission of 9.95 mg/min (Tier 2) for the Gyapa charcoal cookstove. Two reasons can be considered for careful interpretation. First, the Gyapa charcoal cookstove indoor PM2.5 emission value of 9.95 mg/min is closer to ≤8 mg/min = Tier 3 than ≤17 mg/min = Tier 2. Secondly, ceramic-lined cookstoves have the tendency to cool the fire initially and cause the fire to smoke a bit. However, there is an opportunity for design improvements which could help the Gyapa reach clean cookstove status. Woodstoves are noted for emitting PM2.5 and, hence, indoor emission PM2.5 of 169.8 mg/min (Tier 0) for the wood-burning cookstove is counted as unclean.

3.5. Specific Emissions

Table 6 shows the specific emission values (average) obtained during the high power (cold and hot start) and low power (simmer) phases of the study. For 1 L of water boiled during the high power and low power phases the wood-burning cookstove emitted more CO, CO2, and PM2.5 in g/L than the CO, CO2, and PM2.5 in g/L from the coalpot charcoal stove and Gyapa charcoal cookstove. The coalpot charcoal stove emitted about 1/3 of the CO2 in g/L of water boiled compared to the wood-burning cookstove. In regard to CO2 emitted in g/L, the Gyapa charcoal cookstove emitted about 1/2 of CO2 in g/L of water boiled compared to the coalpot charcoal stove and about 1/5 of the CO2 in g/L of water boiled compared to the wood-burning cookstove From the study results, it is noteworthy to indicate that the trend of the study data on specific emissions in g/L of water boiled is consistent with the study results obtained by MacCarthy et al. [40]. Drawing on the study of MacCarty et al. [40] the equivalent masses of emissions per 1 L of water boiled are presented before factoring by the total global warming impact (TGWI). This helps in organizing the results in a more consistent fashion.

3.6. Total Global Warming Impact

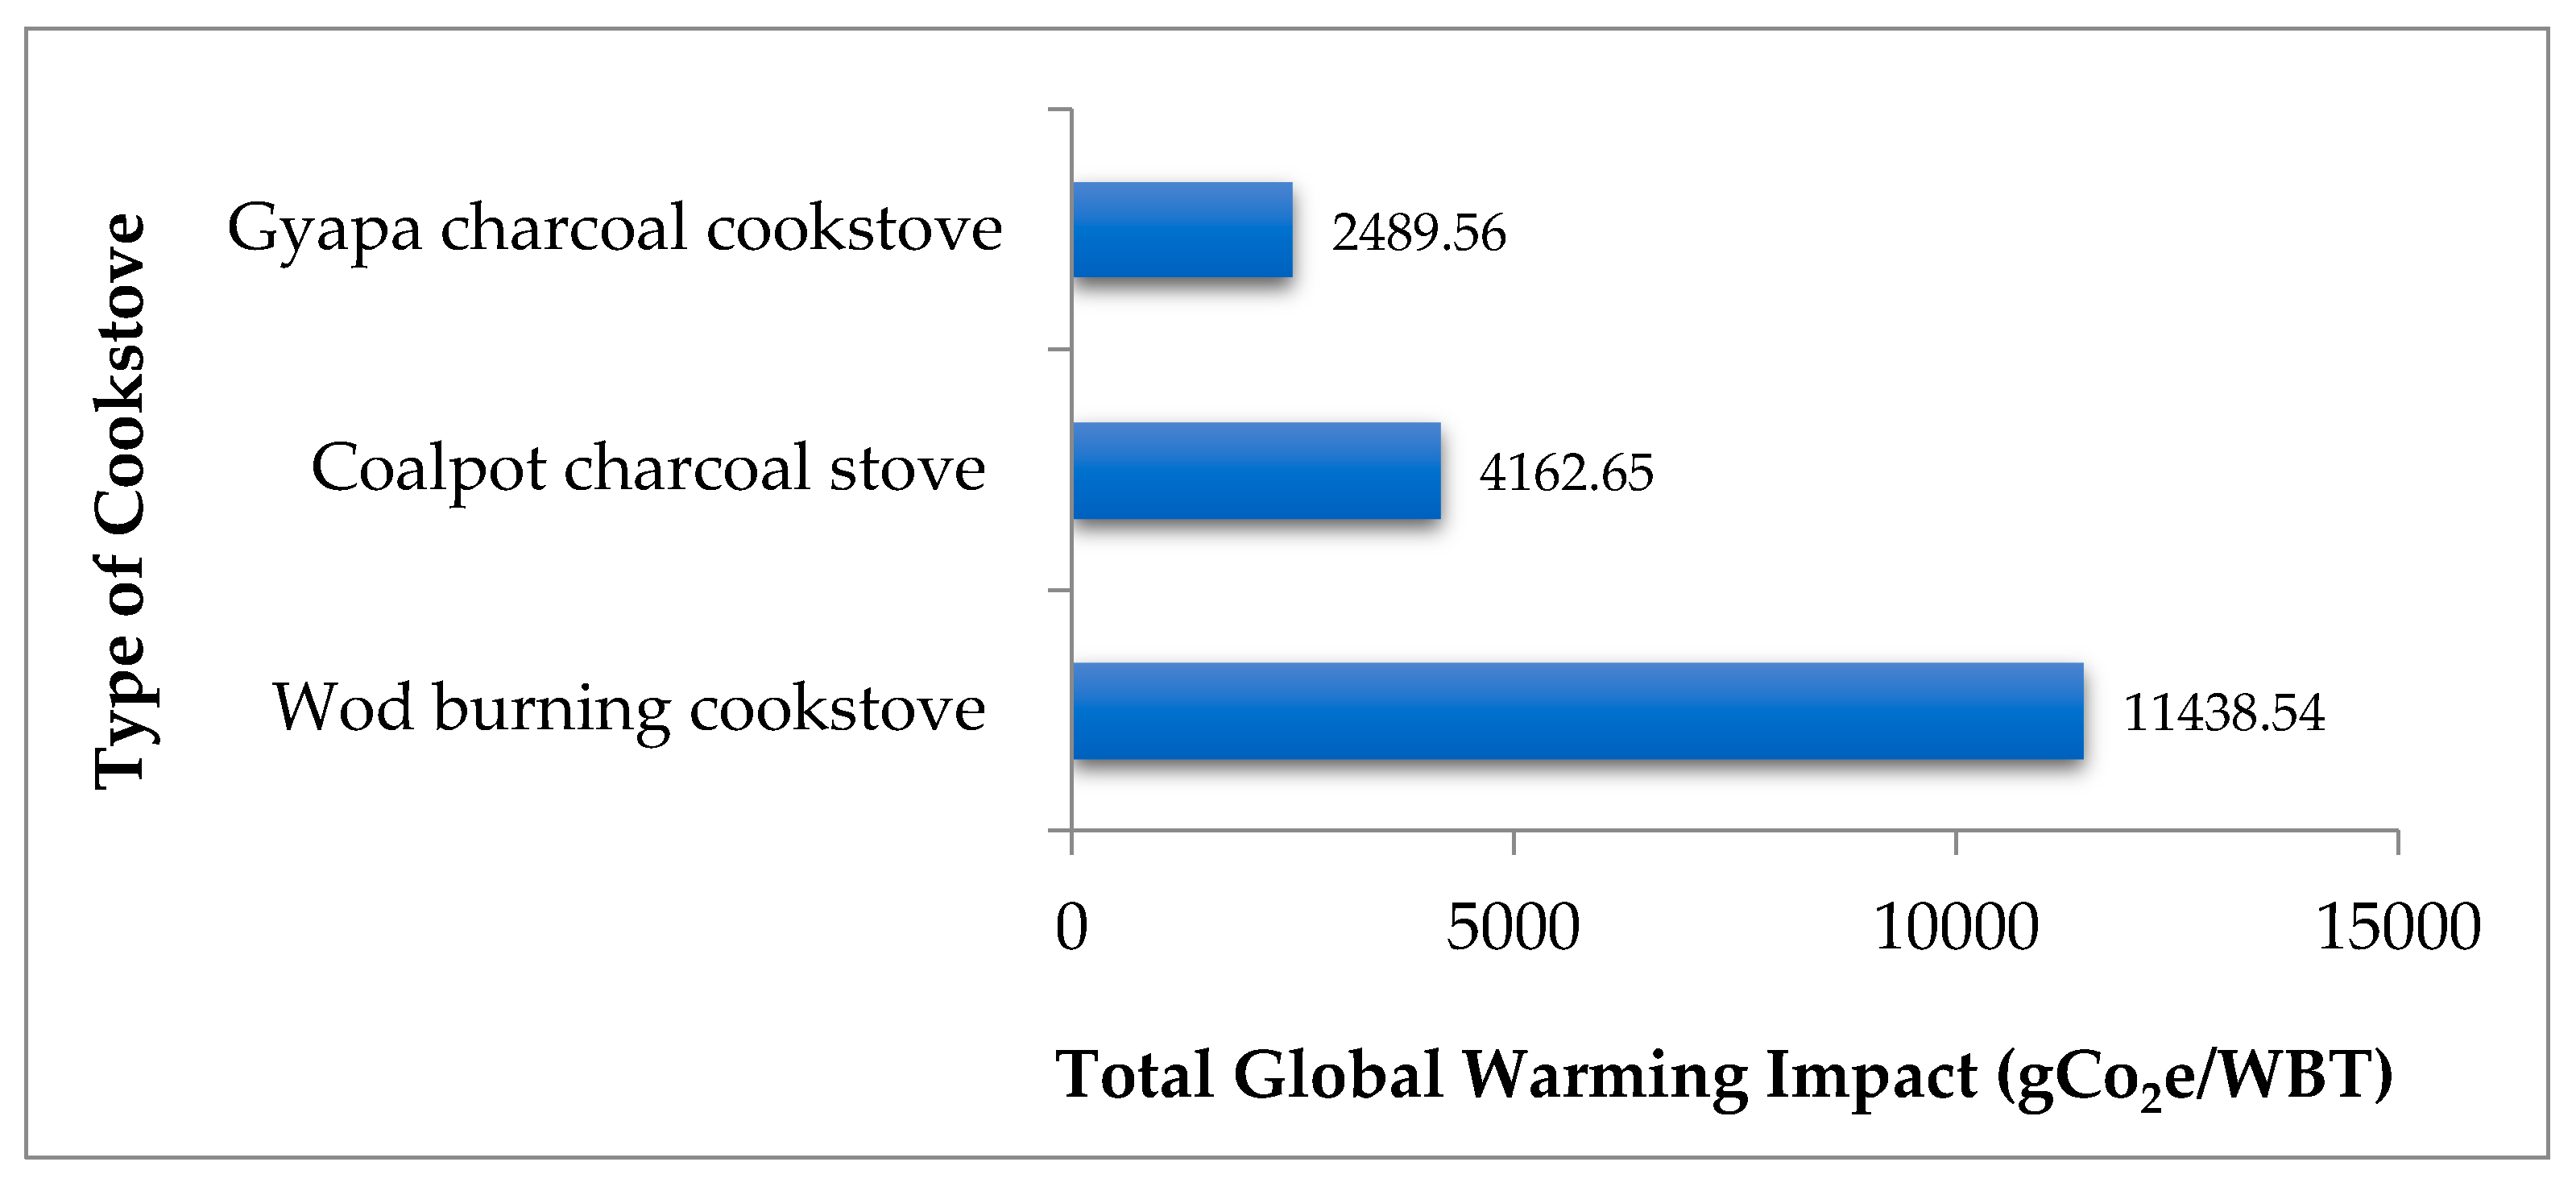
Total global warming impact (TGWI) values calculated from the WBT results are presented in Figure 6. It is important to note that the assessment of the TGWI is based only on emissions from the use of the finished fuel, but not on the full life-cycle emissions relating to production of the charcoal, transportation, distribution, and land use changes, such as cultivating new land for feedstocks. From the study results, the traditional wood-burning cookstove with a TGWI = 11,438.54 gCO2e per complete WBT contributed 4–5 times more to global warming, while the coalpot charcoal cookstove wihth a TGWI = 4162.65 gCO2e per complete WBT contributed 1.5 times more to global warming than the Gyapa charcoal cookstove with a TGWI = 2489.56 gCO2e per complete WBT.
The study findings imply that some attention in the form of capacity building in stove design and making should be given to traditional stove makers so as to reduce their relatively high adverse environmental and global warming impacts. It is imperative that Ghana and other developing countries take climate response as a new opportunity and a development orientation to drive low-carbon industries and create new markets and jobs as indicated by Du [41]. Currently, developed countries are pushing low-carbon energy development in order to lay the foundation for a new approach to development [41]. Efforts to promote in-country continuous research and improvement in cookstove design and manufacture is an opportunity for developing countries to help address global warming and to also advance industry and job creation.

3.7. Potential Annual Savings in Tonnes CO2 Equivalent

According to MacCarty et al. [38], though the laboratory study should not be used to specifically predict real-world performance, it is interesting to project the potential savings in tonnes of CO2 equivalent per stove per year. Given the total global warming impact (TGWI) values obtained in the test, estimates can be made of how much the emission from each stove is likely to contribute in one year. Table 7 provides a summary of the TGWI values and the annual TGWI projections for emissions in tonnes CO2e of the three biomass cookstoves. On the basis of the WBT, annual global warming impact potential for emissions are estimated at 4 tonnes CO2e for the wood-burning cookstove, 2 tonnes CO2e for the coalpot charcoal stove, and 1 tonne CO2e for the Gyapa charcoal cookstove. For Gyapa charcoal cookstoves the global technical potential for GHG emissions is estimated at 1–3 tonnes per year [12]. This study is, therefore, consistent with SEI [12].
The results of the study showed that by using the Gyapa charcoal cookstove instead of the wood-burning cookstove, overall global warming impact can be potentially reduced by approximately 75%, and about 50% potential reduction using Gyapa charcoal cookstove instead of the coalpot charcoal stove. In a similar laboratory study, three types of improved combustion stoves that use charcoal were shown to potentially reduce warming by 40–50%, and even 50–95% for improved stoves with rocket-type combustion or fan assistance [40]. Since the three biomass cookstoves that were used in the study are predominantly used in Ghana and other African countries, such in-country data are relevant to Ghana and may be useful to other sub-Saharan African regions with similar conditions where there may be the need for time series estimates and quantification of reduction in pollutant emissions for cookstove carbon financing. Carbon financing has a major role to play in the development of a global market for clean cookstoves and fuels as it can change the funding dynamic for cookstove projects from traditionally donor-focused dynamics to one that attracts investment from the private sector [42].

4. Conclusions

This study sought to examine three widely-used biomass cookstoves in Ghana with emphasis on the following predominant issues: thermal performance, emissions performance, and global warming impact. From the study results, the wood-burning cookstove emitted more CO, CO2, and PM2.5 than the coalpot charcoal stove and Gyapa charcoal cookstove. The results showed that burning charcoal makes relatively less CO and PM2.5 compared to the burning of wood. Although the Gyapa charcoal cookstove showed better thermal performance, better CO and CO2, its indoor PM2.5 emissions, particularly at the cold start, was more than that of the coalpot charcoal stove. Despite the significant improvement associated with the Gyapa cookstove, further design and operation enhancements are needed to conform to the WHO air quality standards that are considered non-harmful to human health.
To complete the water boiling test, the values of the total global warming impact and annual global warming impact potential showed that by using the Gyapa charcoal cookstove instead of the wood-burning cookstove, overall global warming impact could be potentially reduced by about 75%, and about 50% using the Gyapa charcoal cookstove instead of the coalpot charcoal stove. It is important to note that water boiling test is an approximation of the cooking process that is conducted in controlled conditions. Therefore, in order to confirm the desired impacts cookstoves should be measured under real conditions of use. We conclude that there is the need to create incentives for end-users to switch from poor performing cookstoves to improved ones, such as the Gyapa charcoal cookstove for increased thermal efficiency, low emissions, and reduced global warming impact.

Acknowledgments

Special thanks and appreciation go to Building Stronger Universities (BSU II) project of the Kwame Nkrumah University of Science and Technology (KNUST), Kumasi, Ghana for providing financial support for the conduct of the research and payment of article processing charge (APC). Laboratory equipment used for testing and measurements was financed by UNDP Ghana and supported by the USAID/MIT D-Lab International Development Innovation Network (IDIN) program. The authors are also grateful to the staff of the Cookstove Testing and Expertise Laboratory (C-Lab) of the Technology Consultancy Centre, KNUST for the experimental setup, testing, and data collection which made it possible for us to analyze and interpret the data for the writing of the paper.

Author Contributions

George Y. Obeng, Ebenezer Mensah, George Ashiagbor and Owusu Boahen developed the idea of the paper. George Y. Obeng, Ebenezer Mensah, George Ashiagbor, and Owusu Boahen gathered initial information and carried out surveys. George Y. Obeng and Ebenezer Mensah worked on the content and structure. George Y. Obeng reviewed the literature. George Y. Obeng, Ebenezer Mensah, and Owusu Boahen worked on the initial draft of the paper. George Y. Obeng and Daniel J. Sweeney reviewed the second draft and fine-tuned the content of the paper for submission.

Conflicts of Interest

The authors declare no conflict of interest.

References

  1. World Health Organisation (WHO). The Global Health Risks; WHO: Geneva, Switzerland, 2009. [Google Scholar]
  2. Lim, S.S.; Vos, T.; Flaxman, A.D.; Danaei, G.; Shibuya, K.; Adair-Rohani, H.; Amann, M.; Anderson, H.R.; Andrews, K.G.; Aryee, M.; et al. A comparative risk assessment of burden of disease and injury attributable to 67 risk factors and risk factor clusters in 21 regions, 1990–2010: A systematic analysis for the global burden of disease study 2010. Lancet 2012, 380, 2224–2260. [Google Scholar] [CrossRef]
  3. World Health Organisation (WHO). Burden of Disease from Household Air Pollution for 2012; Public Health, Social and Environmental Determinants of Health Department, WHO: Geneva, Switzerland, 2014. [Google Scholar]
  4. Ghana Statistical Service (GSS). Main report. In Ghana Living Standards Survey Round 6 (GLSS 6); GSS: Accra, Ghana, 2014. [Google Scholar]
  5. Global Alliance for Clean Cookstove (GACC). Available online: http://cleancookstoves.org/country-profiles/focus-countries/1-ghana.html (accessed on 3 December 2016).
  6. World Health Organisation (WHO). Household Air Pollution and Health. Media Centre Fact sheet N°292. Available online: http://www.who.int/mediacentre/factsheets/fs292/en/ (accessed on 3 February 2016).
  7. Jerneck, A.; Olsson, L. A smoke-free kitchen: initiating community based co-production for cleaner cooking and cuts in carbon emissions. J. Clean. Prod. 2013, 60, 208–215. [Google Scholar] [CrossRef]
  8. Global Alliance for Clean Cookstove (GACC). Impact Areas: Environment; GACC: Washington, DC, USA, 2016. [Google Scholar]
  9. Global Alliance for Clean Cookstove (GACC). Clean Cookstoves and Climate Change; GACC: Washington, DC, USA, 2016. [Google Scholar]
  10. Ekouevi, K.; Freeman, K.K.; Soni, R. Understanding the Differences between Cookstoves, LiveWire, a Knowledge Note Series for the Energy and Extractive Global Practice; World Bank: Washington, DC, USA, 2014. [Google Scholar]
  11. World Bank. The environment department (climate change). In Household Cookstoves, Environment, Health, and Climate Change: A New Look at an Old Problem; World Bank: Washington, DC, USA, 2011. [Google Scholar]
  12. Stockholm Energy Institute (SEI). Assessing the Climate Impacts of Cookstove Projects: Issues in Emissions Accounting, Policy Brief; SEI: Stockholm, Sweden, 2013. [Google Scholar]
  13. Ramanathan, V.; Carmichael, G. Global and regional climate changes due to black carbon. Nat. Geosci. 2008, 1, 221–227. [Google Scholar] [CrossRef]
  14. Gustafsson, O.; Krusa, M.; Zencak, Z.; Sheesley, R.J.; Granat, L.; Engstrom, E.; Praveen, P.S.; Rao, P.S.; Leck, C.; Rodhe, H. Brown clouds over South Asia: Biomass or fossil fuel combustion? Science 2009, 323, 495–498. [Google Scholar] [CrossRef] [PubMed]
  15. Bruce, N.; Pope, D.; Rehfuess, E.; Balakrishnan, K.; Adair-Rohani, H.; Dora, C. WHO indoor air quality guidelines on household fuel combustion: Strategy implications of new evidence on interventions and exposure risk functions. Atmos. Environ. 2015, 106, 451–457. [Google Scholar] [CrossRef]
  16. Bond, T.C.; Doherty, S.J.; Fahey, D.W.; Forster, P.M.; Berntsen, T.; Deangelo, B.J.; Flanner, M.G.; Ghan, S.; Karcher, B.; Koch, D.; et al. Bounding the role of black carbon in the climate system: A scientific assessment. J. Geophys. Res. Atmos. 2013, 118, 5380–5552. [Google Scholar] [CrossRef]
  17. Intergovernmental Panel on Climate Change (IPCC). Changes in atmospheric constituents and in radiative forcing. In Climate Change 2007: The Physical Science Basis. Contribution of Working Group I to the Fourth Assessment Report of the Intergovernmental Panel on Climate Change; Solomon, S., Qin, D., Manning, M., Chen, Z., Marquis, M., Averyt, K.B., Tignor, M., Miller, H.L., Eds.; Cambridge University Press: Cambridge, UK; New York, NY, USA, 2007. [Google Scholar]
  18. Global Alliance for Clean Cookstove (GACC). The water boiling test version 4.2.3. In Cookstove Emissions and Efficiency in a Controlled Laboratory Setting; GACC: Washington, DC, USA, 2014. [Google Scholar]
  19. Berkley Air Monitoring Group. Stove Performance Inventory Report; Prepared for the Global Alliance for Clean Cookstoves; United Nations Foundation: Washington, DC, USA, 2012. [Google Scholar]
  20. Volunteers in Technical Assistance (VITA). Water Boiling Test Version 4.1.2 VITA Water Boiling Test (WBT 4.1.2). 2009. Available online: http://www.pciaonline.org/files/WBT4.1.2_0_0.pdf (accessed on 23 June 2016).
  21. Kelley, M.; Donnelly, R.A. The Humongous Book of Statistics Problems; Penguin Group (USA) Inc.: New York, NY, USA, 2009. [Google Scholar]
  22. Peck, R.; Olsen, C.; Devore, J. Introduction to Statistics and Data Analysis; Brook/Cole Cengage Learning: Boston, MA, USA, 2012. [Google Scholar]
  23. Jetter, J.J.; Kariher, P. Solid-fuel household cook stoves: Characterization of performance and emissions. Biomass Bioenergy 2009, 33, 294–305. [Google Scholar] [CrossRef]
  24. Energica, Ghana. Pre-Feasibility Study for an Improved Cook Stoves Project in Northern Ghana Report Submitted to: CARE Denmark; Danish Energy Agency: Accra, Ghana, 2009. [Google Scholar]
  25. Boafo-Mensah, G.; Ampomah-Benefo, K.; Bentumah Animpong, M.A.; Oduro, W.O.; Kotey, E.N.; Akufo-Kumi, K.; Laryea, G.N. Thermal efficiency of charcoal fired cookstoves in Ghana. Glob. Adv. Res. J. Eng. Technol. Innov. 2013, 2, 102–110. [Google Scholar]
  26. Adkins, E.; Tyler, E.; Wang, J.; Siriri, D.; Modi, V. Field testing and survey evaluation of household biomass cookstoves in rural sub-Saharan Africa. Energy Sustain. Dev. 2010, 14, 172–185. [Google Scholar] [CrossRef]
  27. Kshirsagar, M.P.; Kalamkar, V.R. A comprehensive review on biomass cookstoves and a systematic approach for modern cookstove design. Renew. Sustain. Energy Rev. 2014, 30, 580–603. [Google Scholar] [CrossRef]
  28. Global Alliance for Clean Cookstove (GACC). Cookstoves and Fuels; GACC: Washington, DC, USA, 2013. [Google Scholar]
  29. Pennise, D.; Brant, S.; Agbeve, S.M.; Quaye, W.; Mengesha, F.; Tadele, W.; Wofchuck, T. Indoor air quality impacts of an improved wood stove in Ghana and an ethanol stove in Ethiopia. Energy Sustain. Dev. 2009, 13, 71–76. [Google Scholar] [CrossRef]
  30. World Health Organisation (WHO). Guidelines for Indoor Air Quality: Household Fuel Combustion; WHO: Geneva, Switzerland, 2014. [Google Scholar]
  31. Partnership for Clean Indoor Air (PCIA). Test Results of Cook Stove Performanc; Aprovecho Research Center, Shell Foundation, and United States Environmental Protection Agency: Washington, DC, USA, 2011. [Google Scholar]
  32. Wardoyo, A.Y.P.; Morawska, L.; Ristovski, Z.D.; Jamriska, M.; Carr, S.; Johnson, G. Size distribution of particles emitted from grass fires in the Northern Territory, Australia. Atmos. Environ. 2007, 41, 8609–8619. [Google Scholar] [CrossRef]
  33. Gómez, D.R.; Watterson, J.D.; Americano, B.B.; Ha, C.; Marland, G.; Matsika, E.; Namayanga, L.E.; Osman-Elasha, B.; Kalenga Saka, J.D.; Treanton, K.; et al. Chapter 2: Stationary Combustion, Volume 2, Energy. 2006 IPCC Guidelines for National Greenhouse Gas Inventories. 2006. Available online: http://www.ipccnggip.iges.or.jp/public/2006gl/pdf/2_Volume2/V2_2_Ch2_Stationary_Combustion.pdf (accessed on 15 November 2016).
  34. Particulate Emissions from Biomass Combustion in IEA Countries. Available online: http://vbt.ebi.kit.edu/index.pl/themen/mahe_wirbel/literatur/Wood-Single-Aspects/Emissions/Partikulate-Emissions-from-Biomass-Combustion-in-IEA-Countries_Nussbaumer_IEA_2008.pdf (accessed on 3 December 2016).
  35. Amaral, S.S.; Andrade de Carvalho, J.; Maria Angélica Martins Costa, M.A.M.; Pinheiro, C. Particulate matter emission factors for biomass combustion. Atmosphere 2016, 7, 1–25. [Google Scholar]
  36. Arundel, V.A.; Sterling, E.M.; Biggin, J.H.; Sterling, D.T. Indirect health effects of relative humidity in indoor environments. Environ. Health Perspect. 1986, 65, 351–361. [Google Scholar] [CrossRef] [PubMed]
  37. HEVAC Humidity Group. Humidity and its Impact on Human Comfort and Wellbeing in Occupied Buildings. Available online: http://www.humiditysolutions.co.uk/wp-content/uploads/2016/06/HUMIDITY-AND-THE-IMPACT-ON-HUMAN-COMFORT-250416.pdf (accessed on 3 December 2016).
  38. Smith, K.R.; Uma, R.; Kishore, V.V.N.; Zhang, J.; Joshi, V.; Khalil, M.A.K. Greenhouse implications of household stoves: An analysis for India. Annu. Rev. Energy Environ. 2000, 25, 741–763. [Google Scholar] [CrossRef]
  39. Global Alliance for Clean Cookstove (GACC). How does the Alliance Define “Clean” and “Efficient”? Tracking Progress towards 100M by 2020; GACC: Washington, DC, USA, 2016. [Google Scholar]
  40. MacCarty, N.; Ogle, D.; Still, D. A laboratory comparison of the global warming impact of five major types of biomass cooking stoves. Energy Sustain. Dev. 2008, 12, 56–65. [Google Scholar] [CrossRef]
  41. Du, X. Responding to global changes as a community of common destiny. Engineering 2016, 2, 52–54. [Google Scholar] [CrossRef]
  42. Global Alliance for Clean Cookstove (GACC). The Opportunity; GACC: Washington, DC, USA, 2013. [Google Scholar]
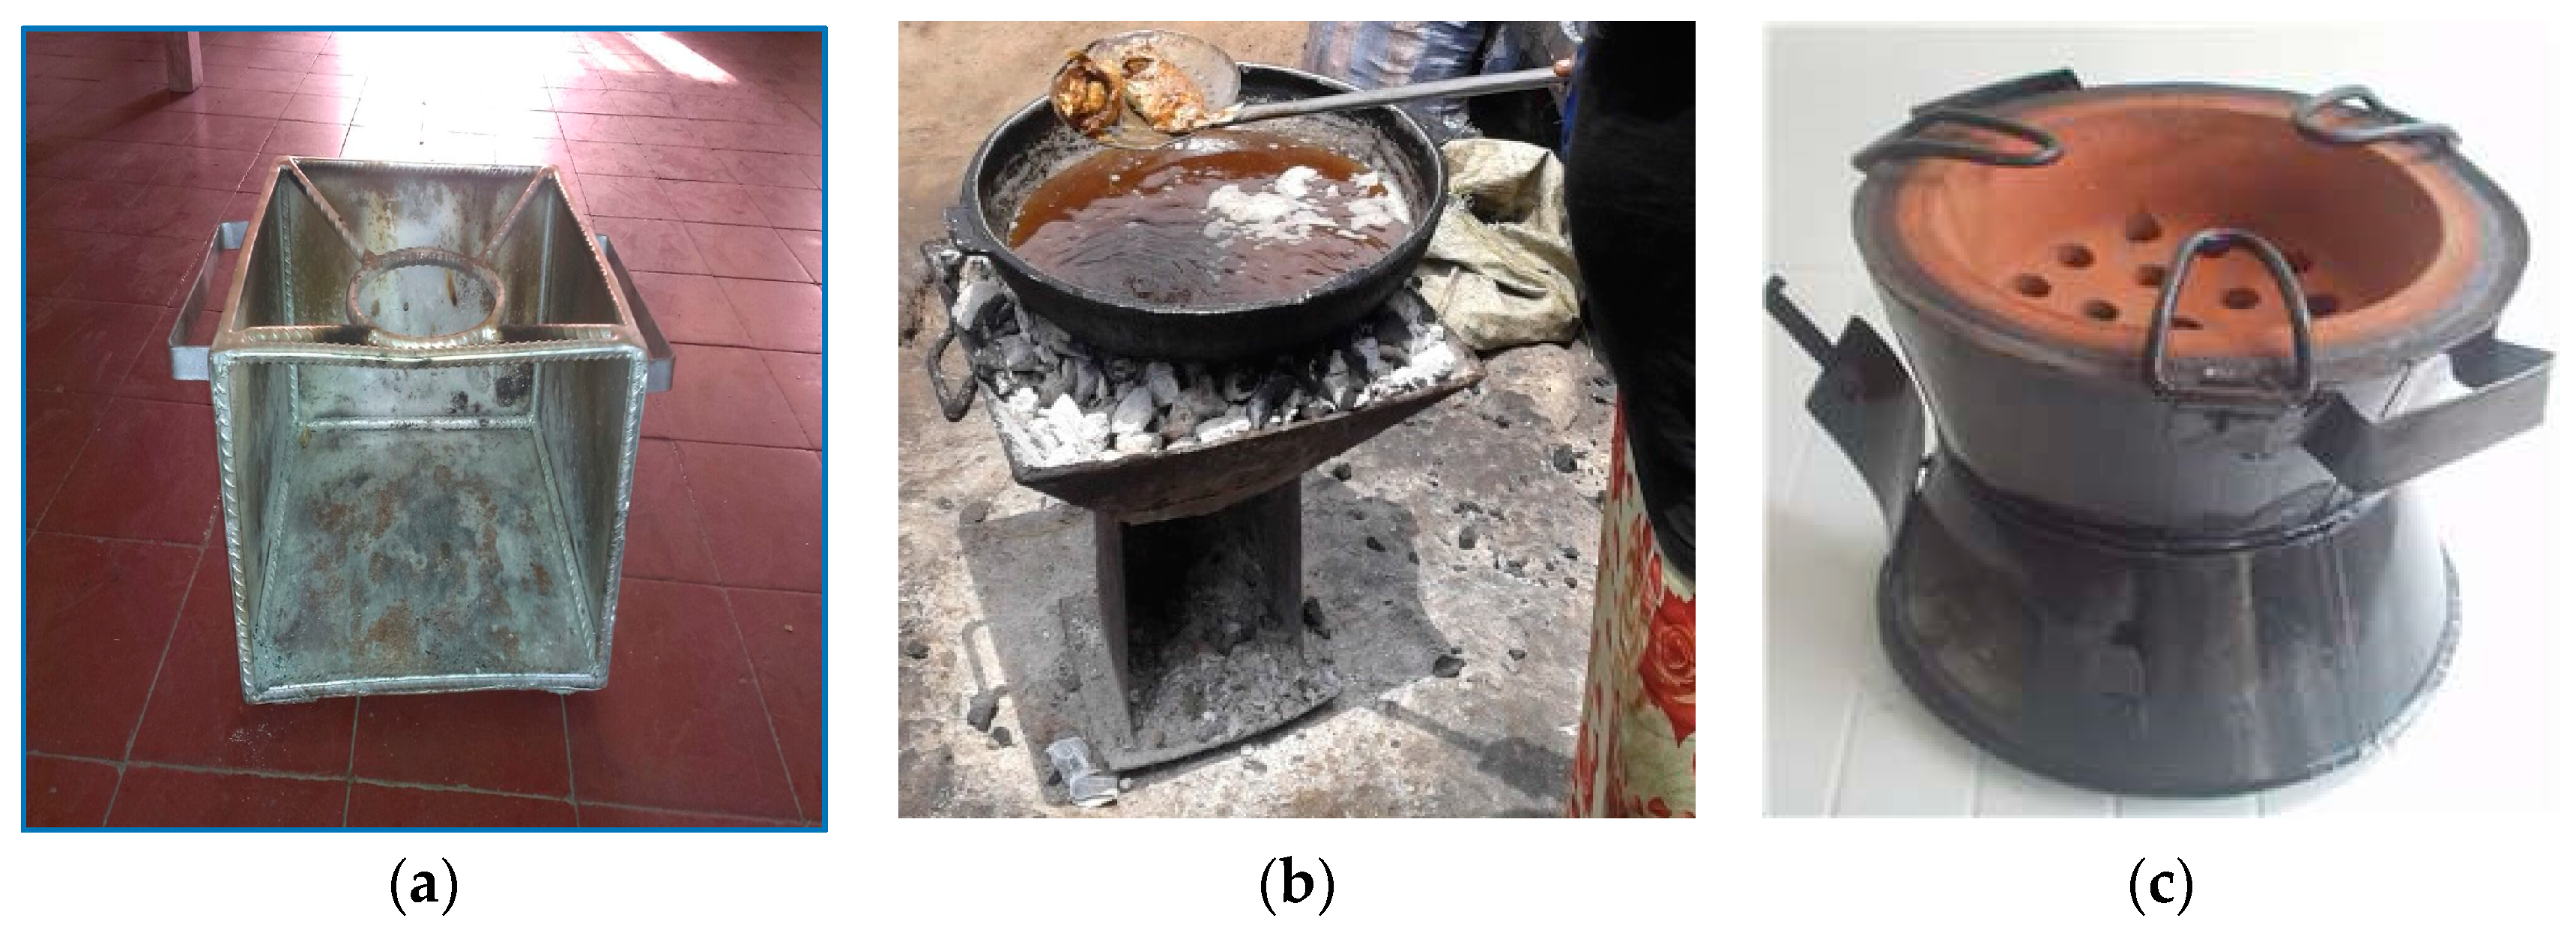
Figure 1. Pictures of (a) wood-burning cookstove; (b) coalpot charcoal cookstove; and (c) Gyapa charcoal cookstove.
Energies 10 00641 g001
Figure 2. (a) Testing facility, including (b) test hood (LEMS), (c) improved cookstove library, (d) large-capacity scale, (e) Delmhorst J-2000 moisture meter, and (f) precision balance.
Energies 10 00641 g002
Figure 3. Temperature-time graph during the three phases of the water boiling test. Source: Nordica MacCarty in GACC [18].
Energies 10 00641 g003
Figure 4. Examples of CO2 and CO emission trends during testing.
Energies 10 00641 g004
Figure 5. Typical PM, temperature, and relative humidity during testing.
Energies 10 00641 g005
Figure 6. Type of cookstoves and total global warming impact.
Energies 10 00641 g006
Table 1. Fuel Properties.
PropertyWoodCharcoal
UnitsValueValue
Fuel species Acacia farnesianaAzadirachta indica (Neem)
Average dimensions of fuel (W × H × L)cm × cm × cm2 × 3 × 402 × 3 × 6
Wood moisture content (MC)% (wet)7.08.0
Gross calorific valueMJ/kg (dry)19.229.4
Net calorific valueMJ/kg (dry)17.928.2
Effective calorific valueMJ/kg (wet)16.525.7
Table 2. Performance test results.
Performance MetricsWood-Burning CookstoveCoalpot Charcoal StoveGyapa Charcoal Cookstove
MeanSDMeanSDMeanSD
High power thermal efficiency (%)12.202.0323.300.2930.001.85
Low power specific fuel consumption rate (MJ/min/L)0.130.070.1060.010.1070.01
Time to boil 5 L of water (min)31.703.5325.502.8023.103.37
Fuel to cook 5 L of water (g)2872.33901178.12301036212
Energy consumption rate (kJ/min)123726984415266975S
Firepower (Watt)8589.73377.136066934.074802.7909.88
No. of replicates333
SD = Standard deviation; Mean = arithmetic mean (average value).
Table 3. Emissions performance results.
Emission MeasuresWood-Burning CookstoveCoalpot Charcoal CookstoveGyapa Charcoal Cookstove
CO to Cook 5 L of Water (g)330.3137.4108.6
PM2.5 to Cook 5 L of Water (mg)22,210.4556.55258.9
CO2 to Cook 5 L of Water (g)10,811.03901.72082
Indoor Emissions, CO (g/min)2.951.642.32
Indoor Emissions, PM2.5 (mg/min)169.85.39.95
Total Global Warming Impact (g CO2e)11,438.544162.652489.56
Table 4. Emission factors.
Emission FactorsWood-Burning CookstoveCoalpot Charcoal StoveGyapa Charcoal Cookstove
PM2.5 emissions factor (mg/kJ)0.430.020.18
CO2 emission factor (kg/TJ)119,550117,44071,660
CO emissions factor (mg/kJ)6.434.143.74
PM2.5 emissions factor (g/kg)7.740.475.06
CO2 emission factor (g/kg)3766.903306.442009.6
CO emissions factor (g/kg)115.09116.44104.42
Table 5. Thermal efficiency, indoor emission, and tier designation.
Thermal Efficiency—Tier DesignationsRemarks
Wood-burning cookstove (Tier 0)Coalpot charcoal cookstove (Tier 1–2)Gyapa charcoal cookstove (Tier 2–3)With Tier 2–3 the Gyapa charcoal cookstove is counted as efficient.
Indoor Emissions (PM2.5)—Tier Designations
Wood-burning cookstove (Tier 0)Coalpot charcoal cookstove (Tier 3)Gyapa charcoal cookstove (Tier 2)With Tier 3 the coalpot charcoal cookstove is counted as clean.
IWA Tier Designation (Standard Guideline)
unitsTier 0Tier 1Tier 2Tier 3Tier 4
High power thermal efficiency%<15≥15≥25≥35≥45
Low power specific consumptionMJ/min/L>0.05≤0.05≤0.039≤0.028≤0.017
Indoor emissions COg/min>0.97≤0.97≤0.62≤0.49≤0.42
Indoor emissions PMmg/min>40≤40≤17≤8≤2
Note: From Tier 0 to Tier 4 signifies improvement.
Table 6. Specific emissions or mass of emissions produced to boil 1 L and then simmer for 45 min.
Specific Emissions (g/L)Wood-Burning CookstoveCoalpot Charcoal StoveGyapa Charcoal Cookstove
Cold Start
CO g/L21.6316.4314.40
CO2 g/L672.87258.47139.67
PM2.5 mg/L2562.9732.1364.40
Hot Start
CO g/L16.5316.3716.13
CO2 g/L560.97287.10139.50
PM2.5 mg/L2324.4339.1040.94
Simmer
CO g/L72.1717.8014.03
CO2 g/L1980.67502.73309.50
PM2.5 mg/L5059.3768.5372.03
Table 7. Total global warming impact and annual projections in tons of CO2e.
Stove TypeTGWI to Complete 1 WBT (Approx. 1 Meal) (gCO2e)TGWI to Complete 7 WBT (Approx. 7 Meals/Week) (gCO2e)TGWI to Complete 52 Weeks @ 7 WBT/Week (Approx 364 Meals/Week) (gCO2e)Annual TGWI Projection (Tonnes CO2e)
Wood-burning cookstove11,438.5480,069.784,163,6294
Coalpot charcoal stove4162.6529,138.551,515,2052
Gyapa charcoal cookstove2489.5617,426.92906,199.81
Potential Savings of the Gyapa Cookstove over Wood-burning and Coalpot Charcoal Stoves
Potential saving over wood-burning cookstove 3 (75%)
Potential saving over coalpot charcoal stove 1 (50%)