
Battery Pack Grouping and Capacity Improvement for Electric Vehicles Based on a Genetic Algorithm


Abstract
:1. Introduction
2. Vehicle Modeling and Analysis
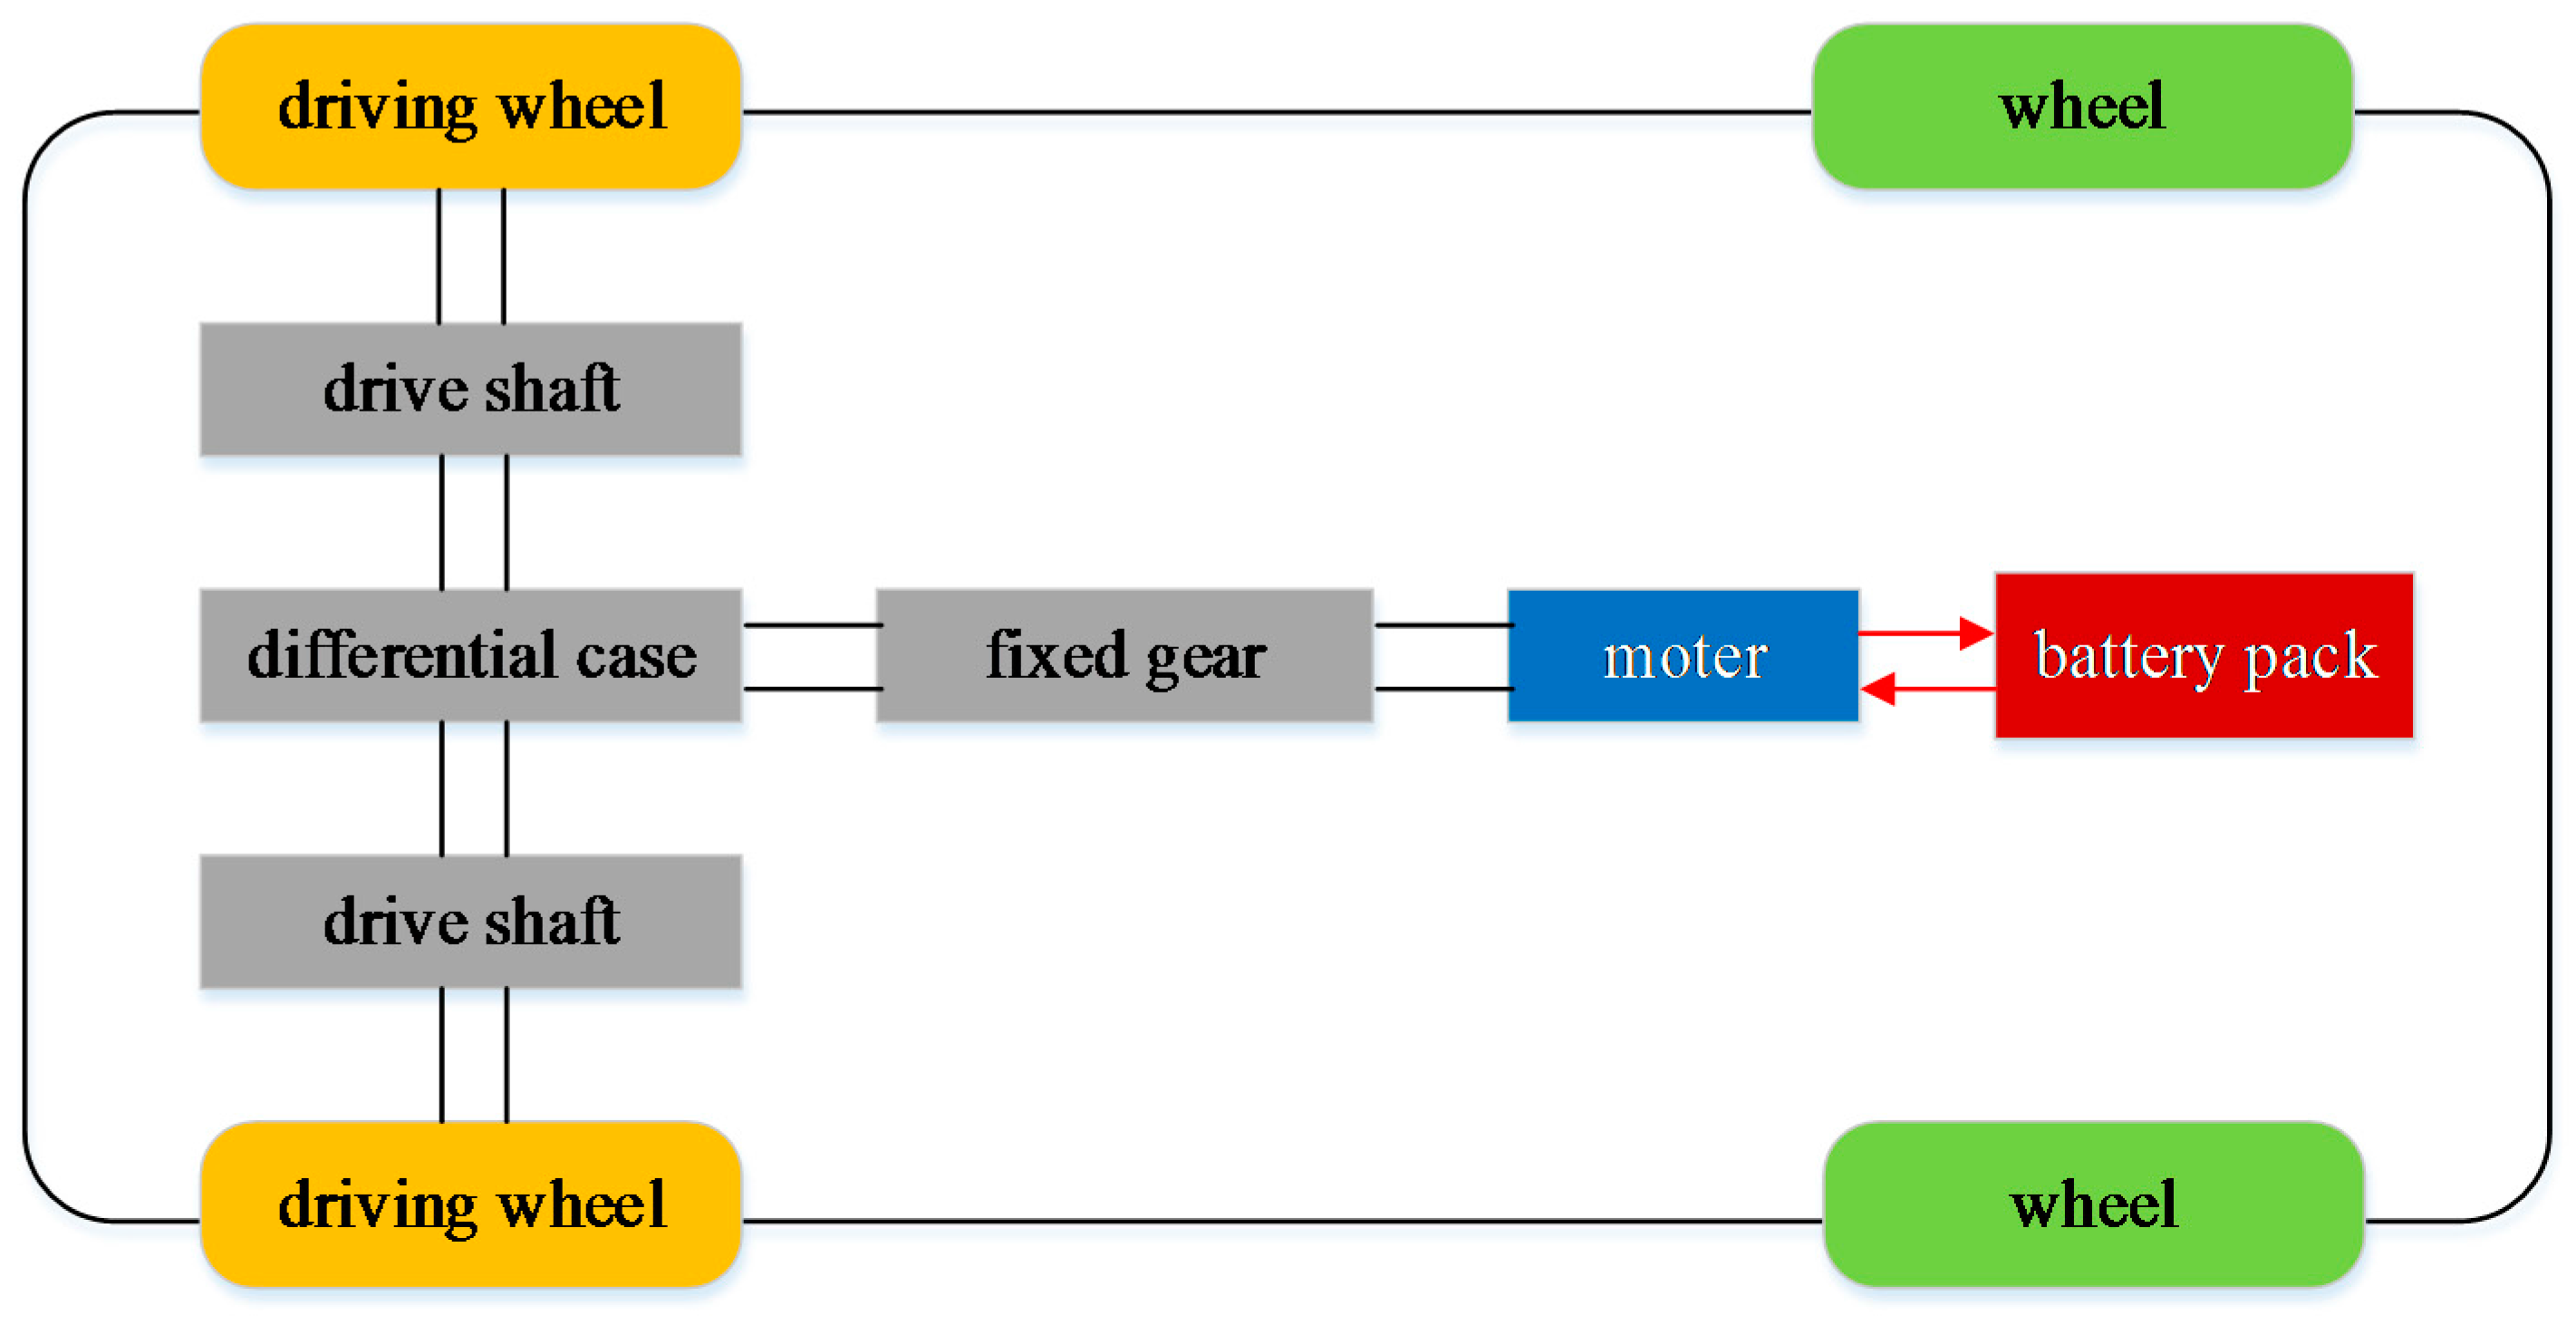
2.1. Vehicle Model
2.1.1. Regenerative Braking Model
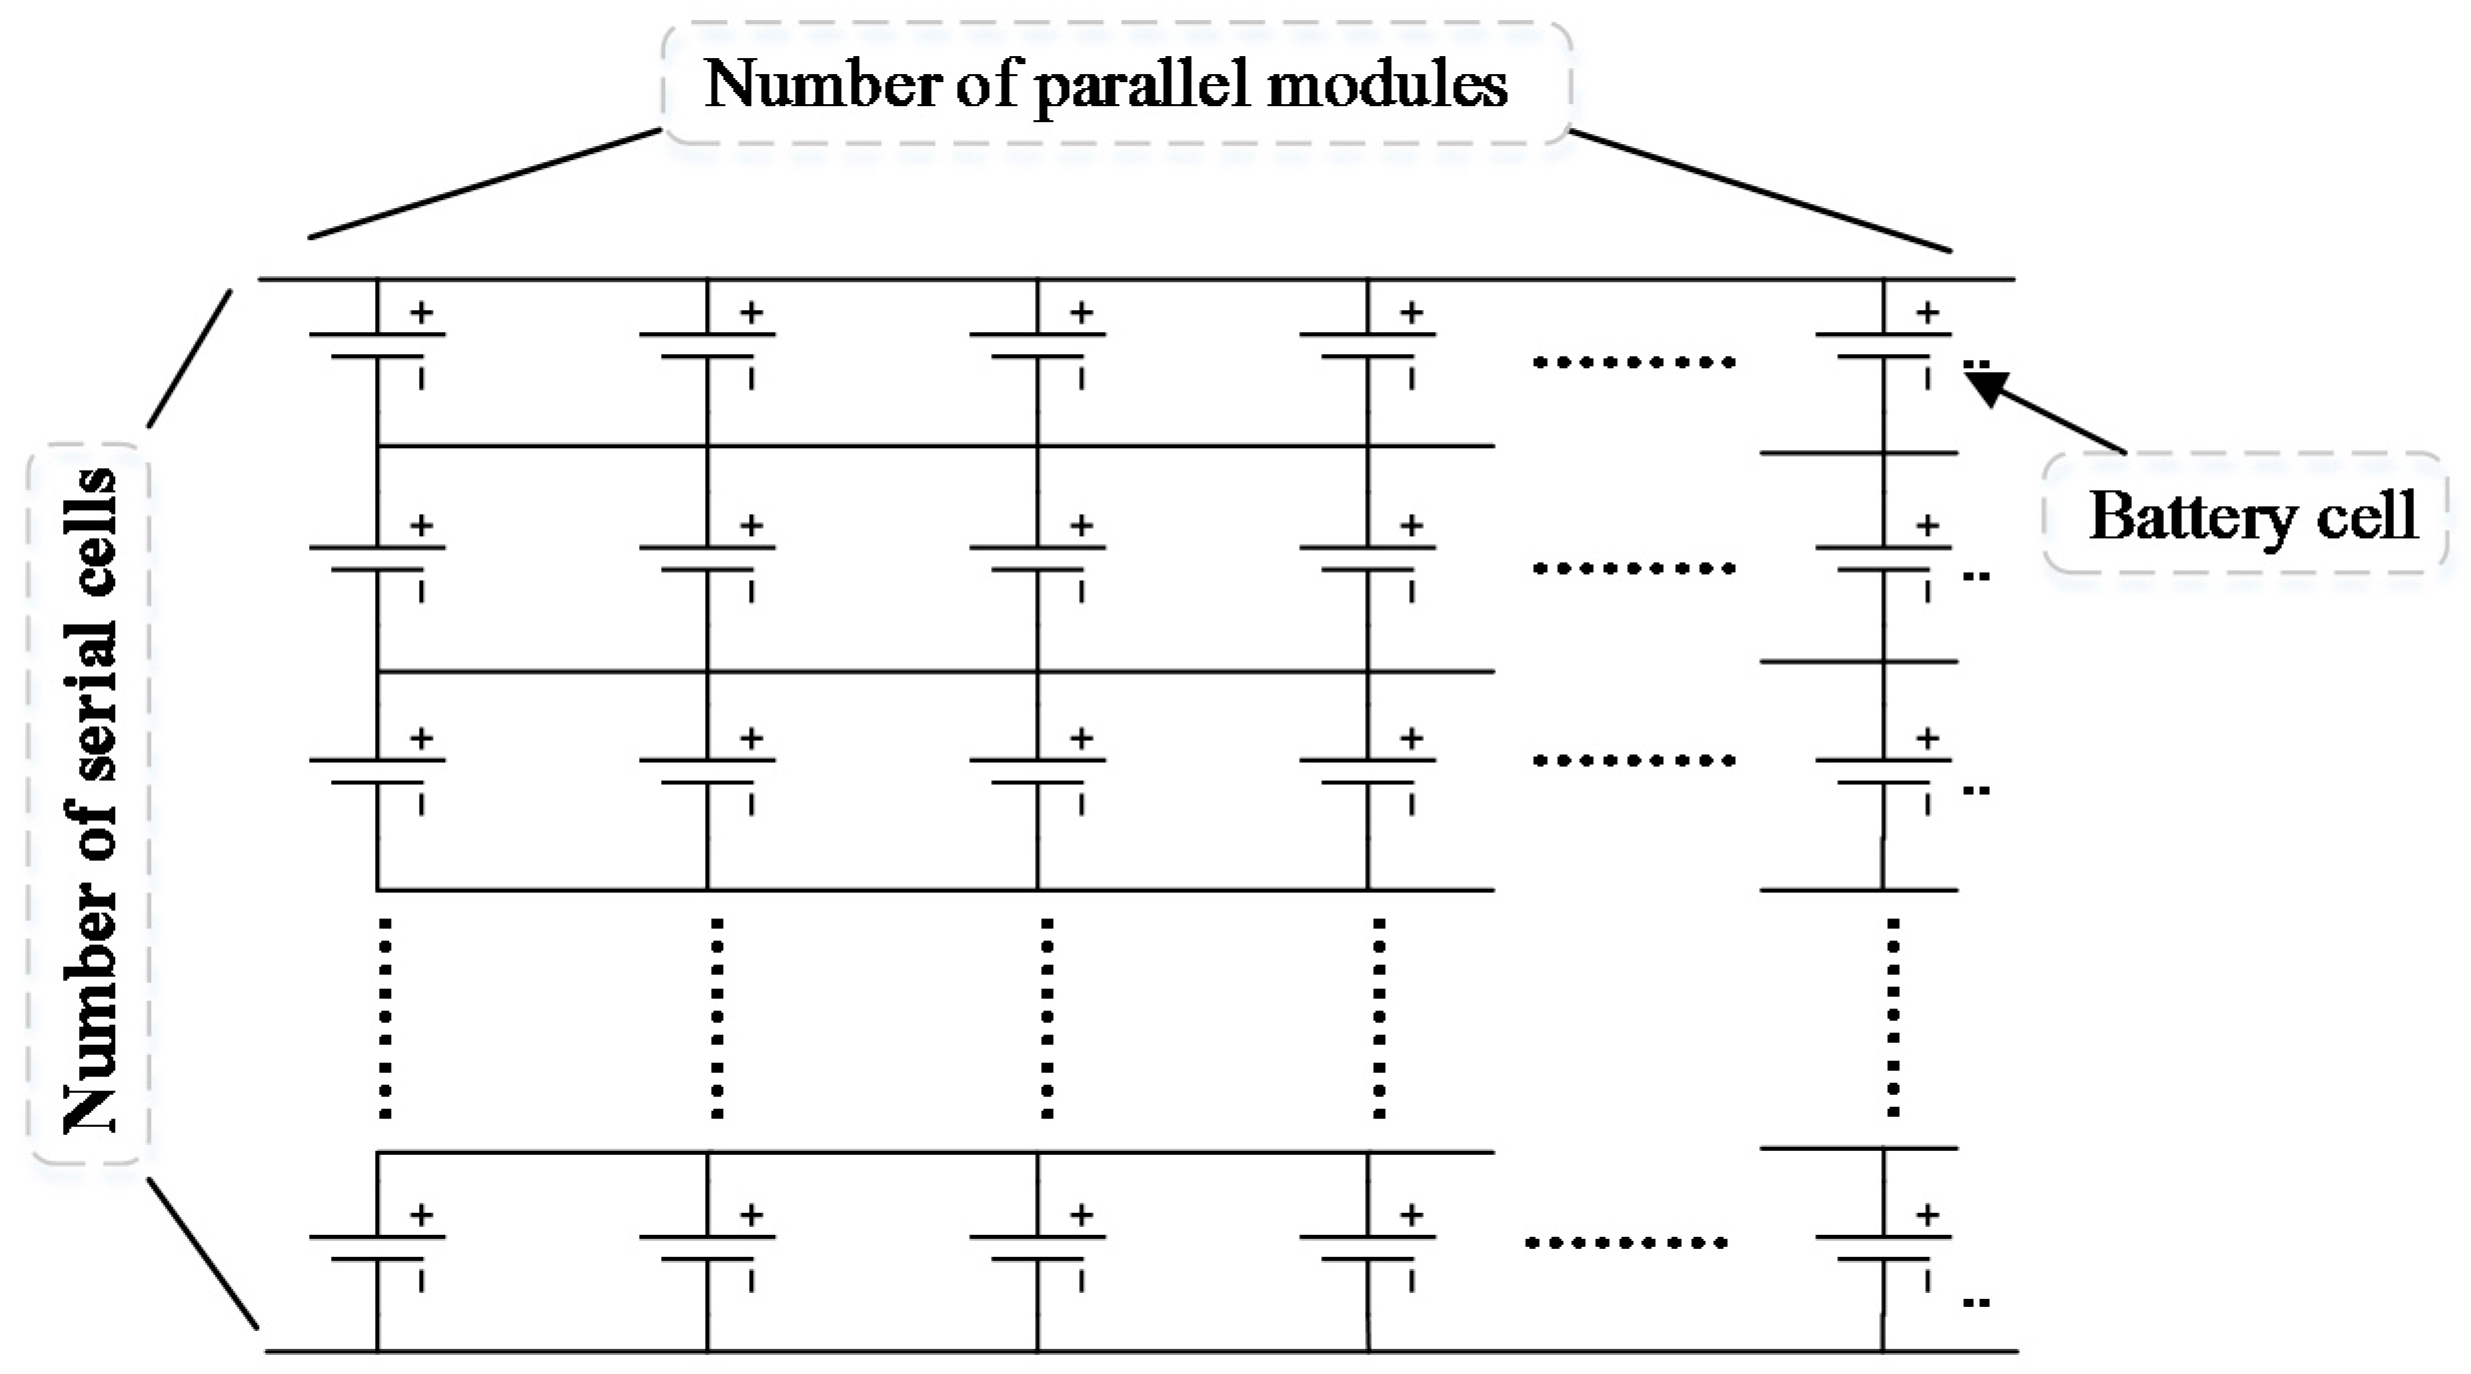
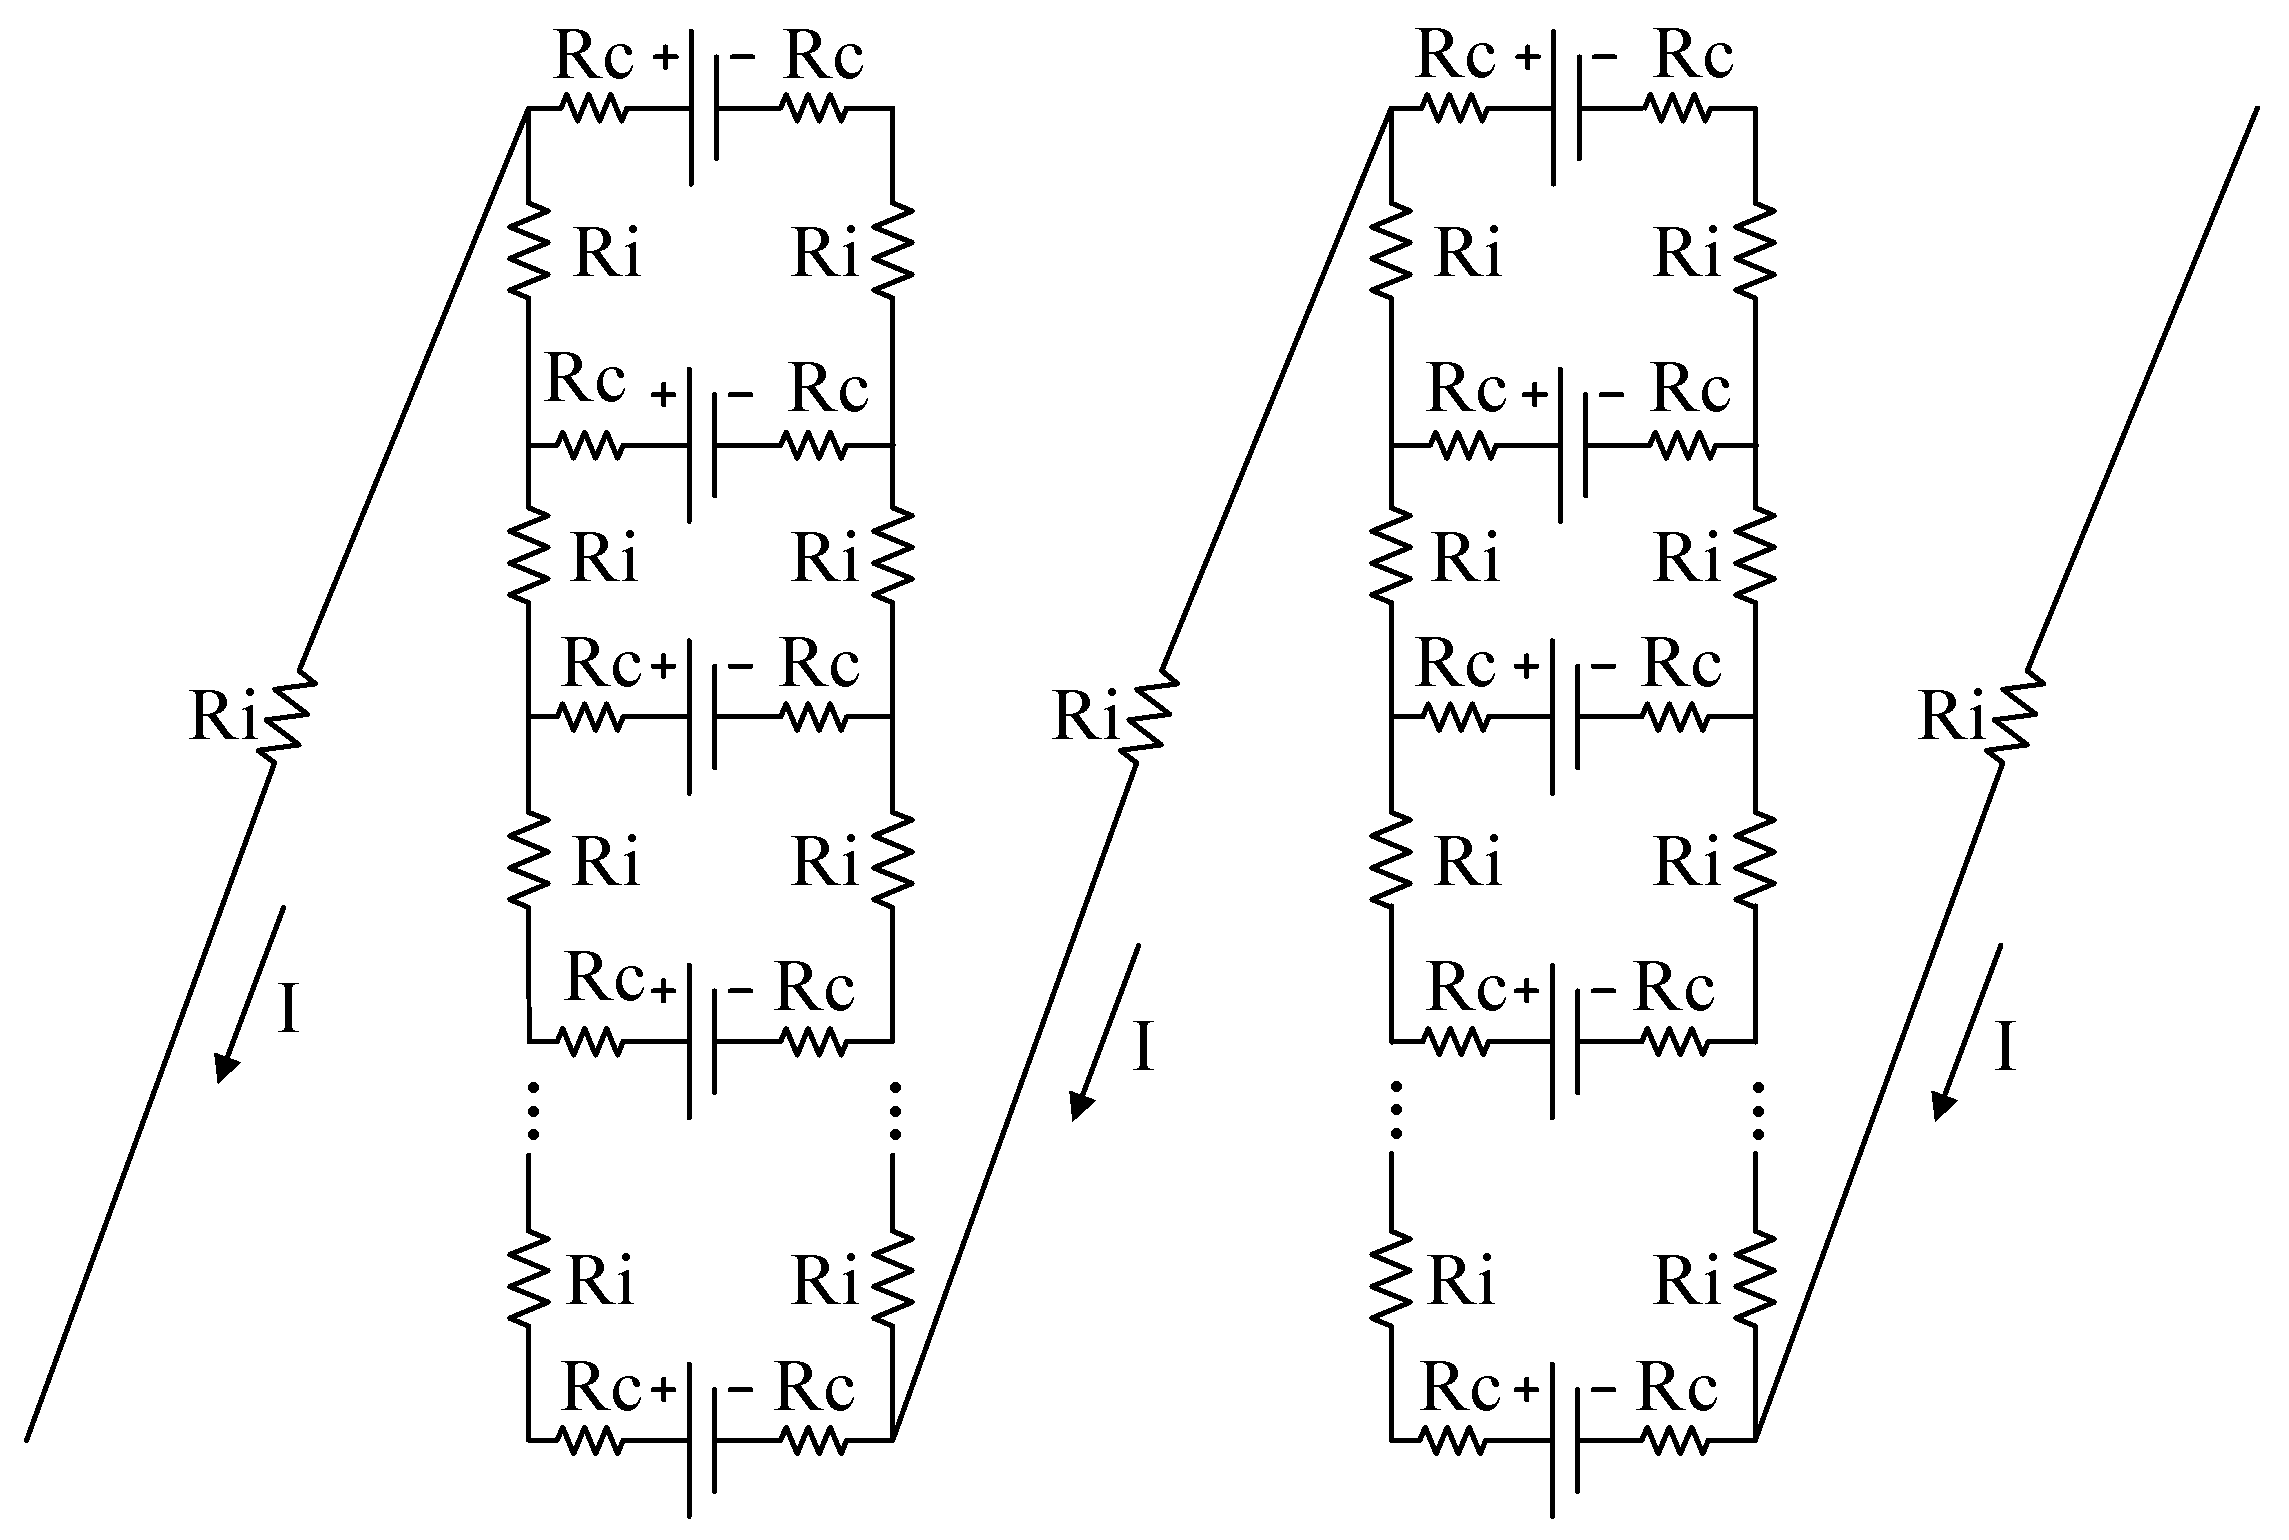
2.1.2. Battery Model
2.2. Vehicle Cost Model
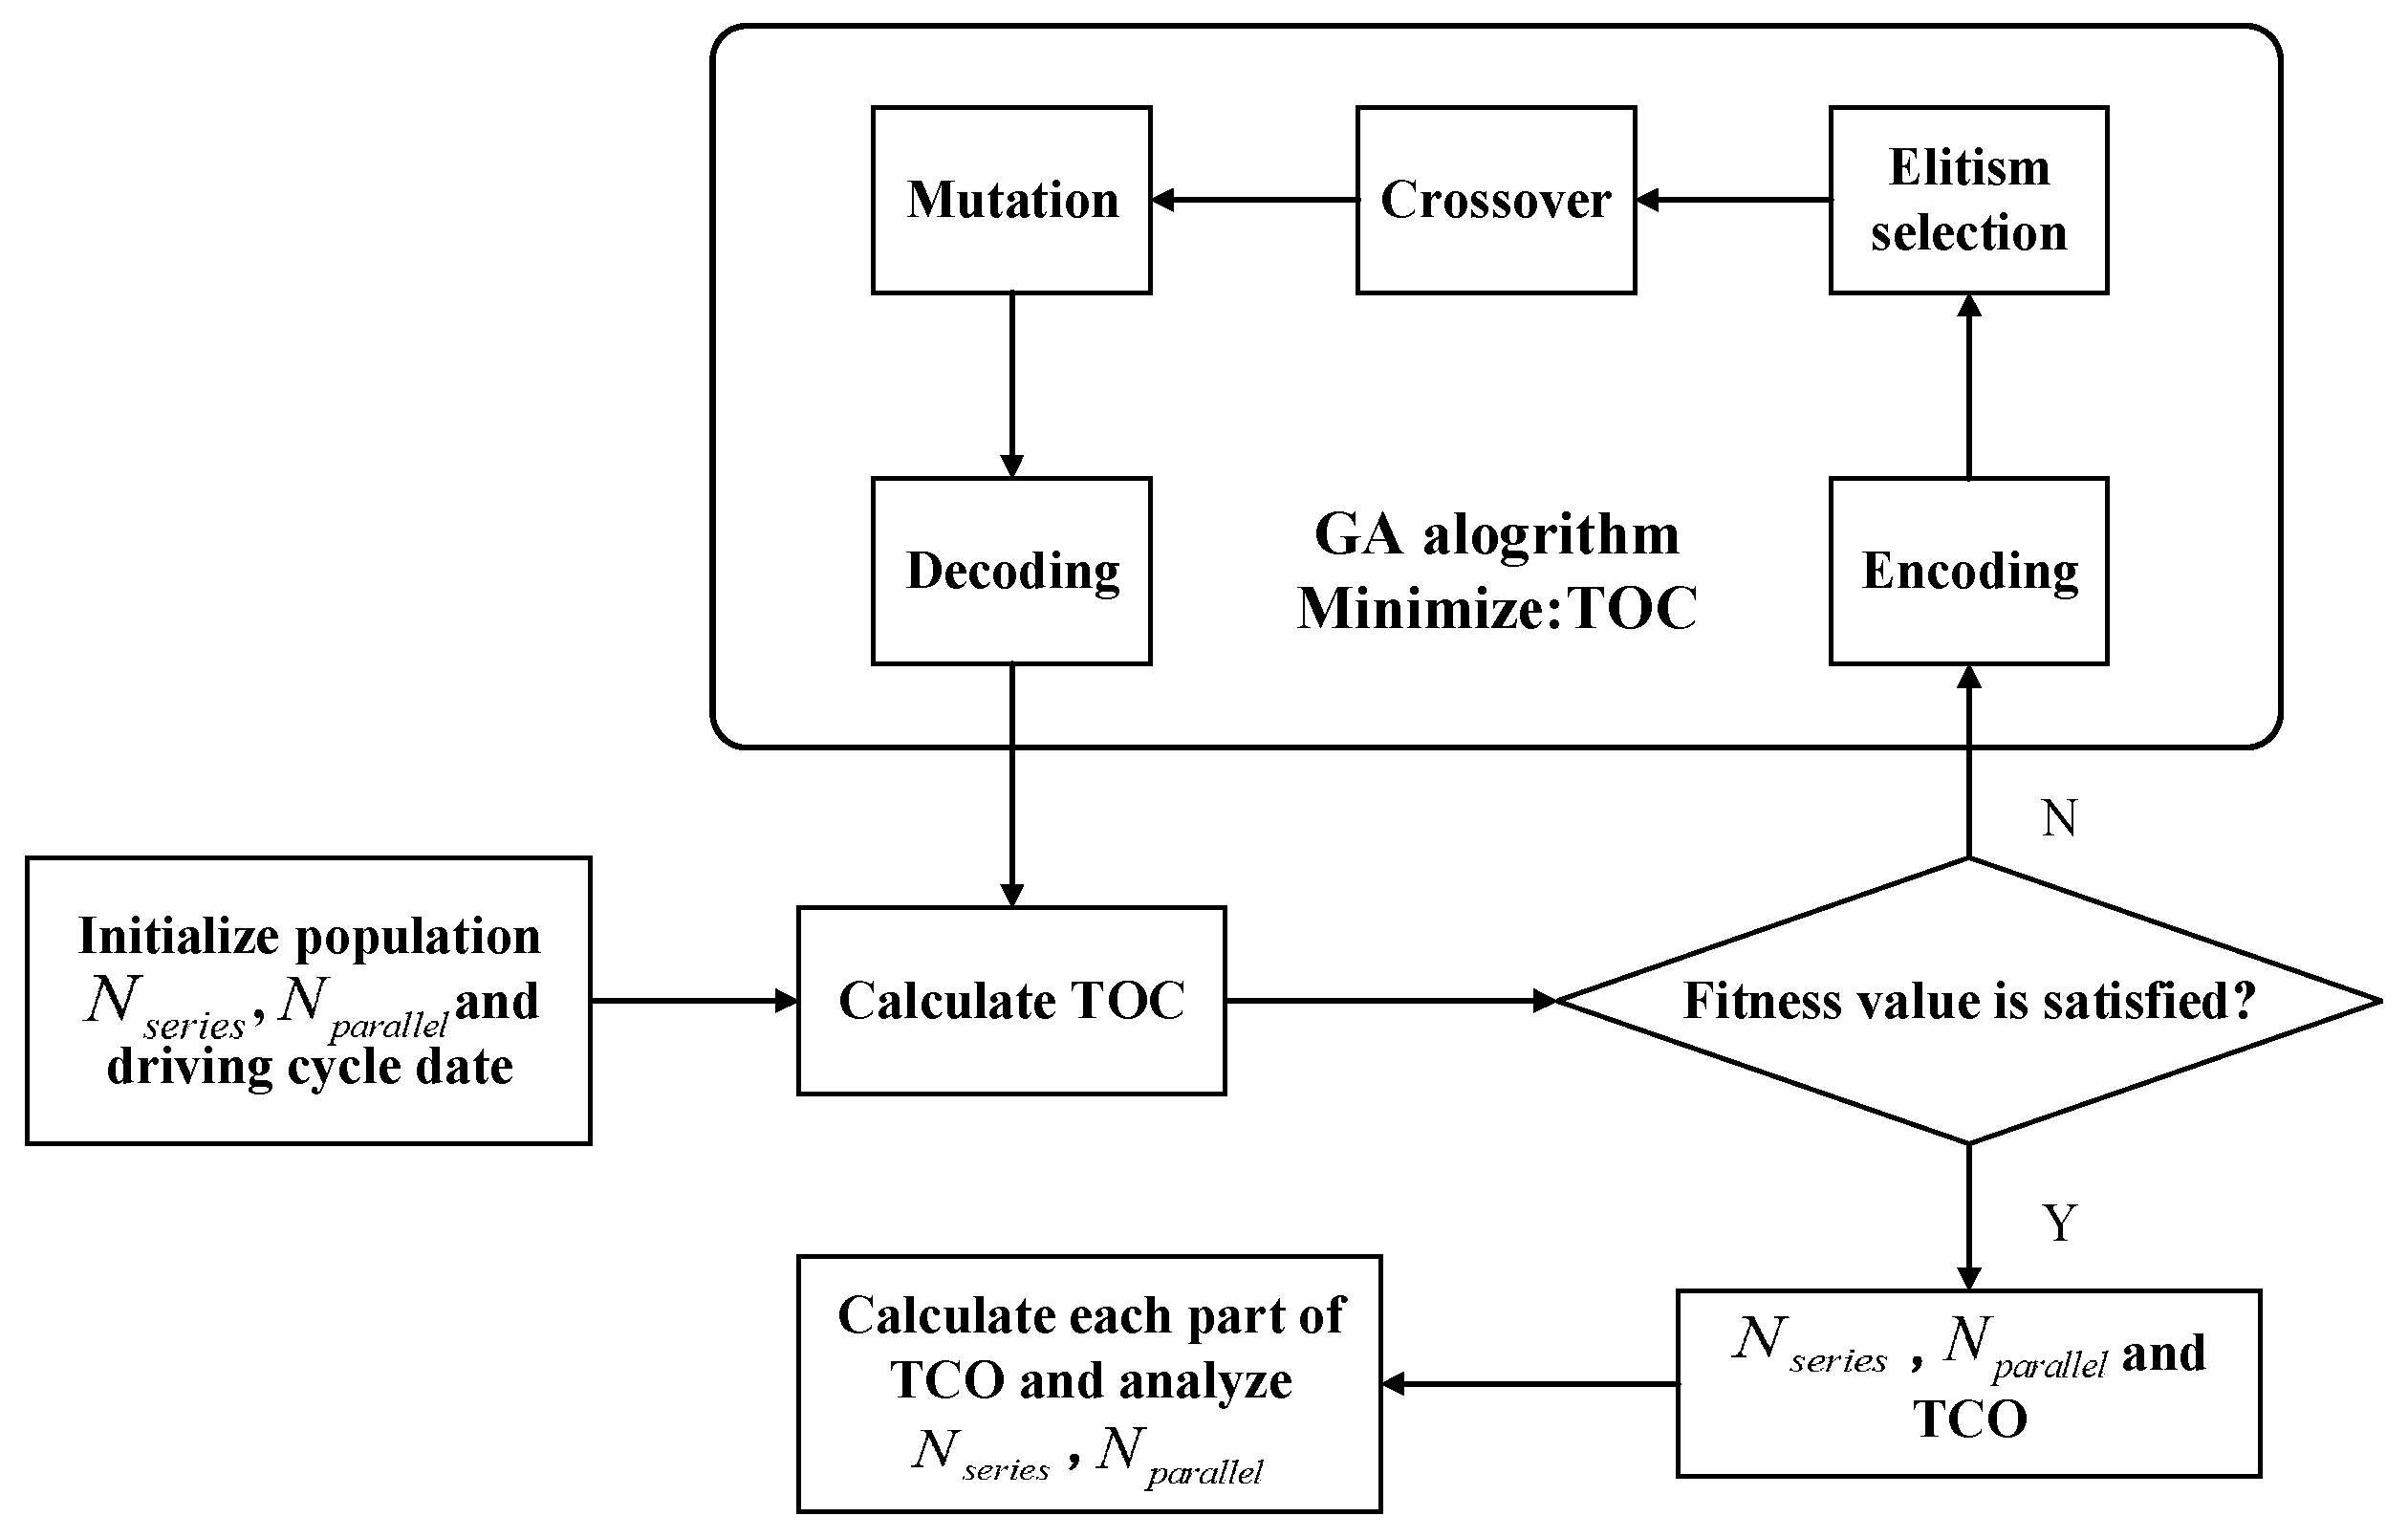
3. Optimization Framework
4. Results and Discussion
5. Conclusions
Acknowledgments
Author Contributions
Conflicts of Interest
References
- Cuma, M.U.; Koroglu, T. A comprehensive review on estimation strategies used in hybrid and battery electric vehicles. Renew. Sustain. Energy Rev. 2015, 42, 517–531. [Google Scholar] [CrossRef]
- Budde, B.; Alkemade, F.; Hekkert, M. On the relation between communication and innovation activities: A comparison of hybrid electric and fuel cell vehicles. Environ. Innov. Soc. Trans. 2015, 14, 45–59. [Google Scholar] [CrossRef]
- Abada, S.; Marlair, G.; Lecocq, A.; Petit, M.; Sauvant-Moynot, V.; Huet, F. Safety focused modeling of lithium-ion batteries: A review. J. Power Sources 2016, 306, 178–192. [Google Scholar] [CrossRef]
- Fotouhi, A.; Auger, D.J.; Propp, K.; Longo, S.; Wild, M. A review on electric vehicle battery modelling: From Lithium-ion toward Lithium–Sulphur. Renew. Sustain. Energy Rev. 2016, 56, 1008–1021. [Google Scholar] [CrossRef]
- Sakti, A.; Michalek, J.J.; Fuchs, E.R.H.; Whitacre, J.F. A techno-economic analysis and optimization of Li-ion batteries for light-duty passenger vehicle electrification. J. Power Sources 2015, 273, 966–980. [Google Scholar] [CrossRef]
- Wang, L.; Cheng, Y.; Zhao, X. A LiFePO4 battery pack capacity estimation approach considering in-parallel cell safety in electric vehicles. Appl. Energy 2015, 142, 293–302. [Google Scholar] [CrossRef]
- Hu, X.; Moura, S.J.; Murgovski, N.; Egardt, B.; Cao, D. Integrated optimization of battery sizing, charging, and power management in plug-in hybrid electric vehicles. IEEE Trans. Control Syst. Technol. 2016, 24, 1036–1043. [Google Scholar] [CrossRef]
- Mathew, M.; Kong, Q.H.; McGrory, J.; Fowler, M. Simulation of lithium ion battery replacement in a battery pack for application in electric vehicles. J. Power Sources 2017, 349, 94–104. [Google Scholar] [CrossRef]
- Bouchhima, N.; Schnierle, M.; Schulte, S.; Birke, K.P. Optimal energy management strategy for self-reconfigurable batteries. Energy 2017, 122, 560–569. [Google Scholar] [CrossRef]
- Redelbach, M.; Özdemir, E.D.; Friedrich, H.E. Optimizing battery sizes of plug-in hybrid and extended range electric vehicles for different user types. Energy Policy 2014, 73, 158–168. [Google Scholar] [CrossRef]
- Martel, F.; Dubé, Y.; Kelouwani, S.; Jaguemont, J.; Agbossou, K. Long-term assessment of economic plug-in hybrid electric vehicle battery lifetime degradation management through near optimal fuel cell load sharing. J. Power Sources 2016, 318, 270–282. [Google Scholar] [CrossRef]
- Martel, F.; Kelouwani, S.; Dubé, Y.; Agbossou, K. Optimal economy-based battery degradation management dynamics for fuel-cell plug-in hybrid electric vehicles. J. Power Sources 2015, 274, 367–381. [Google Scholar] [CrossRef]
- Hu, Z.; Li, J.; Xu, L.; Song, Z.; Fang, C.; Ouyang, M.; Dou, G.; Kou, G. Multi-objective energy management optimization and parameter sizing for proton exchange membrane hybrid fuel cell vehicles. Energy Convers. Manag. 2016, 129, 108–121. [Google Scholar] [CrossRef]
- Hu, X.; Murgovski, N.; Johannesson, L.; Egardt, B. Energy efficiency analysis of a series plug-in hybrid electric bus with different energy management strategies and battery sizes. Appl. Energy 2013, 111, 1001–1009. [Google Scholar] [CrossRef]
- Hu, X.; Martinez, C.M.; Yang, Y. Charging, power management, and battery degradation mitigation in plug-in hybrid electric vehicles: A unified cost-optimal approach. Mech. Syst. Signal Process. 2017, 87, 4–16. [Google Scholar] [CrossRef]
- Zhao, X.; Doering, O.C.; Tyner, W.E. The economic competitiveness and emissions of battery electric vehicles in China. Appl. Energy 2015, 156, 666–675. [Google Scholar] [CrossRef]
- Özdemir, E.D.; Hartmann, N. Impact of electric range and fossil fuel price level on the economics of plug-in hybrid vehicles and greenhouse gas abatement costs. Energy Policy 2012, 46, 185–192. [Google Scholar] [CrossRef]
- Ye, Y.; Shi, Y.; Saw, L.H.; Tay, A.A.O. Performance assessment and optimization of a heat pipe thermal management system for fast charging lithium ion battery packs. Int. J. Heat Mass Transf. 2016, 92, 893–903. [Google Scholar] [CrossRef]
- Plett, G.L. Extended Kalman filtering for battery management systems of LiPB-based HEV battery packs. J. Power Sources 2004, 134, 262–276. [Google Scholar] [CrossRef]
- Yang, N.; Zhang, X.; Shang, B.; Li, G. Unbalanced discharging and aging due to temperature differences among the cells in a lithium-ion battery pack with parallel combination. J. Power Sources 2016, 306, 733–741. [Google Scholar] [CrossRef]
- Guo, P.; Wang, X.; Han, Y. The enhanced genetic algorithms for the optimization design. In Proceedings of the 2010 3rd International Conference on Biomedical Engineering and Informatics, Yantai, China, 16–18 October 2010; pp. 2990–2994. [Google Scholar]
- Heris, J.E.A.; Oskoei, M.A. Modified genetic algorithm for solving n-queens problem. In Proceedings of the 2014 Iranian Conference on Intelligent Systems (ICIS), Bam, Iran, 4–6 February 2014; pp. 1–5. [Google Scholar]
- Chen, Z.; Mi, C.C.; Fu, Y.; Xu, J.; Gong, X. Online battery state of health estimation based on genetic algorithm for electric and hybrid vehicle applications. J. Power Sources 2013, 240, 184–192. [Google Scholar] [CrossRef]
- Kumar, A. Efficient hierarchical hybrids parallel genetic algorithm for shortest path routing. In Proceedings of the 2014 5th International Conference—Confluence The Next Generation Information Technology Summit (Confluence), Noida, India, 25–26 September 2014; pp. 257–261. [Google Scholar]
- Chen, Y.; Wang, J. Design and evaluation on electric differentials for overactuated electric ground vehicles with four independent in-wheel motors. IEEE Trans. Veh. Technol. 2012, 61, 1534–1542. [Google Scholar] [CrossRef]
- Zou, Z.; Cao, J.; Cao, B.; Chen, W. Evaluation strategy of regenerative braking energy for supercapacitor vehicle. ISA Trans. 2015, 55, 234–240. [Google Scholar] [CrossRef] [PubMed]
- The Energy Saving and New Energy Automotive Industry Development Plan (2012–2020); Chinese State Council: Beijing, China, 2012.
- A123 Systems AHR32113 Data Sheet; A123 Systems: Livonia, MI, USA, 2011.
- A. Systems. High Power Lithium Ion Cell; A. Systems: Charlottesville, VA, USA, 2011. [Google Scholar]
- Shiau, C.-S.N.; Samaras, C.; Hauffe, R.; Michalek, J.J. Impact of battery weight and charging patterns on the economic and environmental benefits of plug-in hybrid vehicles. Energy Policy 2009, 37, 2653–2663. [Google Scholar] [CrossRef]
- Maia, R.; Silva, M.; Araújo, R.; Nunes, U. Electrical vehicle modeling: A fuzzy logic model for regenerative braking. Expert Syst. Appl. 2015, 42, 8504–8519. [Google Scholar] [CrossRef]
- Zhang, J.Z.; Li, Y.T.; Lv, C.; Yuan, Y. New regenerative braking control strategy for rear-driven electrified minivans. Energy Convers. Manag. 2014, 82, 135–145. [Google Scholar]
- Bruen, T.; Marco, J. Modelling and experimental evaluation of parallel connected lithium ion cells for an electric vehicle battery system. J. Power Sources 2016, 310, 91–101. [Google Scholar] [CrossRef]
- Offer, G.J.; Yufit, V.; Howey, D.A.; Wu, B.; Brandon, N.P. Module design and fault diagnosis in electric vehicle batteries. J. Power Sources 2012, 206, 383–392. [Google Scholar] [CrossRef]
- Lehner, S.; Sauer, D.U.; Baumhöfer, T. Disparity in initial and lifetime parameters of lithium-ion cells. IET Electr. Syst. Transp. 2016, 6, 34–40. [Google Scholar] [CrossRef]
- Li, J.; Gee, A.M.; Zhang, M.; Yuan, W. Analysis of battery lifetime extension in a SMES-battery hybrid energy storage system using a novel battery lifetime model. Energy 2015, 86, 175–185. [Google Scholar] [CrossRef]
- Ouyang, M.; Feng, X.; Han, X.; Lu, L.; Li, Z.; He, X. A dynamic capacity degradation model and its applications considering varying load for a large format Li-ion battery. Appl. Energy 2016, 165, 48–59. [Google Scholar] [CrossRef]
- Shiau, C.-S.N.; Kaushal, N.; Hendrickson, C.T.; Peterson, S.B.; Whitacre, J.F.; Michalek, J.J. Optimal plug-in hybrid electric vehicle design and allocation for minimum life cycle cost, petroleum consumption, and greenhouse gas emissions. J. Mech. Des. 2010, 132, 183–195. [Google Scholar] [CrossRef]
- Peterson, S.B.; Michalek, J.J. Cost-effectiveness of plug-in hybrid electric vehicle battery capacity and charging infrastructure investment for reducing US gasoline consumption. Energy Policy 2013, 52, 429–438. [Google Scholar] [CrossRef]
- Groot, J.; Swierczynski, M.; Stan, A.I.; Kær, S.K. On the complex ageing characteristics of high-power LiFePO4/graphite battery cells cycled with high charge and discharge currents. J. Power Sources 2015, 286, 475–487. [Google Scholar] [CrossRef]
- Wang, B.; Xu, M.; Yang, L. Study on the economic and environmental benefits of different EV powertrain topologies. Energy Convers. Manag. 2014, 86, 916–926. [Google Scholar] [CrossRef]
- Rothenberger, M.J.; Docimo, D.J.; Ghanaatpishe, M.; Fathy, H.K. Genetic optimization and experimental validation of a test cycle that maximizes parameter identifiability for a Li-ion equivalent-circuit battery model. J. Energy Storage 2015, 4, 156–166. [Google Scholar] [CrossRef]
- Chen, Z.; Mi, C.C.; Xiong, R.; Xu, J.; You, C. Energy management of a power-split plug-in hybrid electric vehicle based on genetic algorithm and quadratic programming. J. Power Sources 2014, 248, 416–426. [Google Scholar] [CrossRef]
- Beijing Demonstration Application of New Energy: Detailed Rules of Cars Manufacturing Enterprise and Record Management; Beijing Economic and Information Commission: Beijing, China, 2015. (In Chinese)
- DLR & Infas. Mobilität in Deutschland; Bundesministeriums Für Verkehr Bau Und Stadtentwicklung—BMVBS: Bonn/Berlin, Germany, 2008. [Google Scholar]
- Agudelo, A.F.; García-Contreras, R.; Agudelo, J.R.; Armas, O. Potential for exhaust gas energy recovery in a diesel passenger car under European driving cycle. Appl. Energy 2016, 174, 201–212. [Google Scholar] [CrossRef]
- Standardization Administration of the People’s Republic of China. Chinese Pure Electric Passenger Cars-Specifications; Standardization Administration of the People’s Republic of China: Beijing, China, 2012. (In Chinese)
- Pagerit, S.; Roudier, T.; Sharer, P.; Rousseau, A. Complex system engineering simulation through co-simulation. In Proceedings of the SAE 2014 World Congress & Exhibition, Tokyo, Japan, 8–10 April 2014. [Google Scholar]


| Motor Type | PMSM |
| Maximum Power | 80 kW |
| Maximum Braking Torque | 280 N m |
| Power Density | 2.5 kW/kg |
| Energy Density | 140 Wh/kg |
| Mass | 32 kg |
| Cell Dimensions (mm) | Cell Weight (g) | Cell Capacity (Ah) | Voltage (V) | Operating Temperature (°C) |
|---|---|---|---|---|
| 32 × 113 | 205 | 4.4 | 3.3 | −30–55 |
| Parameters | Symbol | Value | Parameters | Symbol | Value |
|---|---|---|---|---|---|
| Frontal area | 2.372 m3 | Wheel radius | 0.301 m | ||
| Aerodynamic drag coefficient | 0.311 | Converter efficiency | 0.97 | ||
| Coefficient of rotating mass | 1.02 | Motor efficiency | 0.96 | ||
| Air density | 1.1985 kg/m3 | Pack charge efficiency | 0.95 | ||
| Rolling resistance coefficient | 0.015 | Final drive efficiency | 0.95 |
| Vehicle Performance Index | Value |
|---|---|
| Acceleration time 0–50 km/h | ≤10 s |
| Acceleration time 50–80 km/h | ≤15 s |
| Gradeability during 60 km/h | ≥4% |
| Gradeability during 30 km/h | ≥12% |
| Maximum gradeability | ≥20% |
| Maximum speed | ≥80 km/h |
| All-electric range | ≥80 km |
| Variable | Optimal Solution |
|---|---|
| Parallel number | 40 |
| Serial number | 113 |
| Total vehicle mass | 2140.25 kg |
| Battery cost | €1687.93 per year |
| Electricity cost | €166.76 per year |
| Based vehicle cost | €697.68 per year |
| Lifetime | 10.09 years |
| Average discharge efficiency | 90.39% |
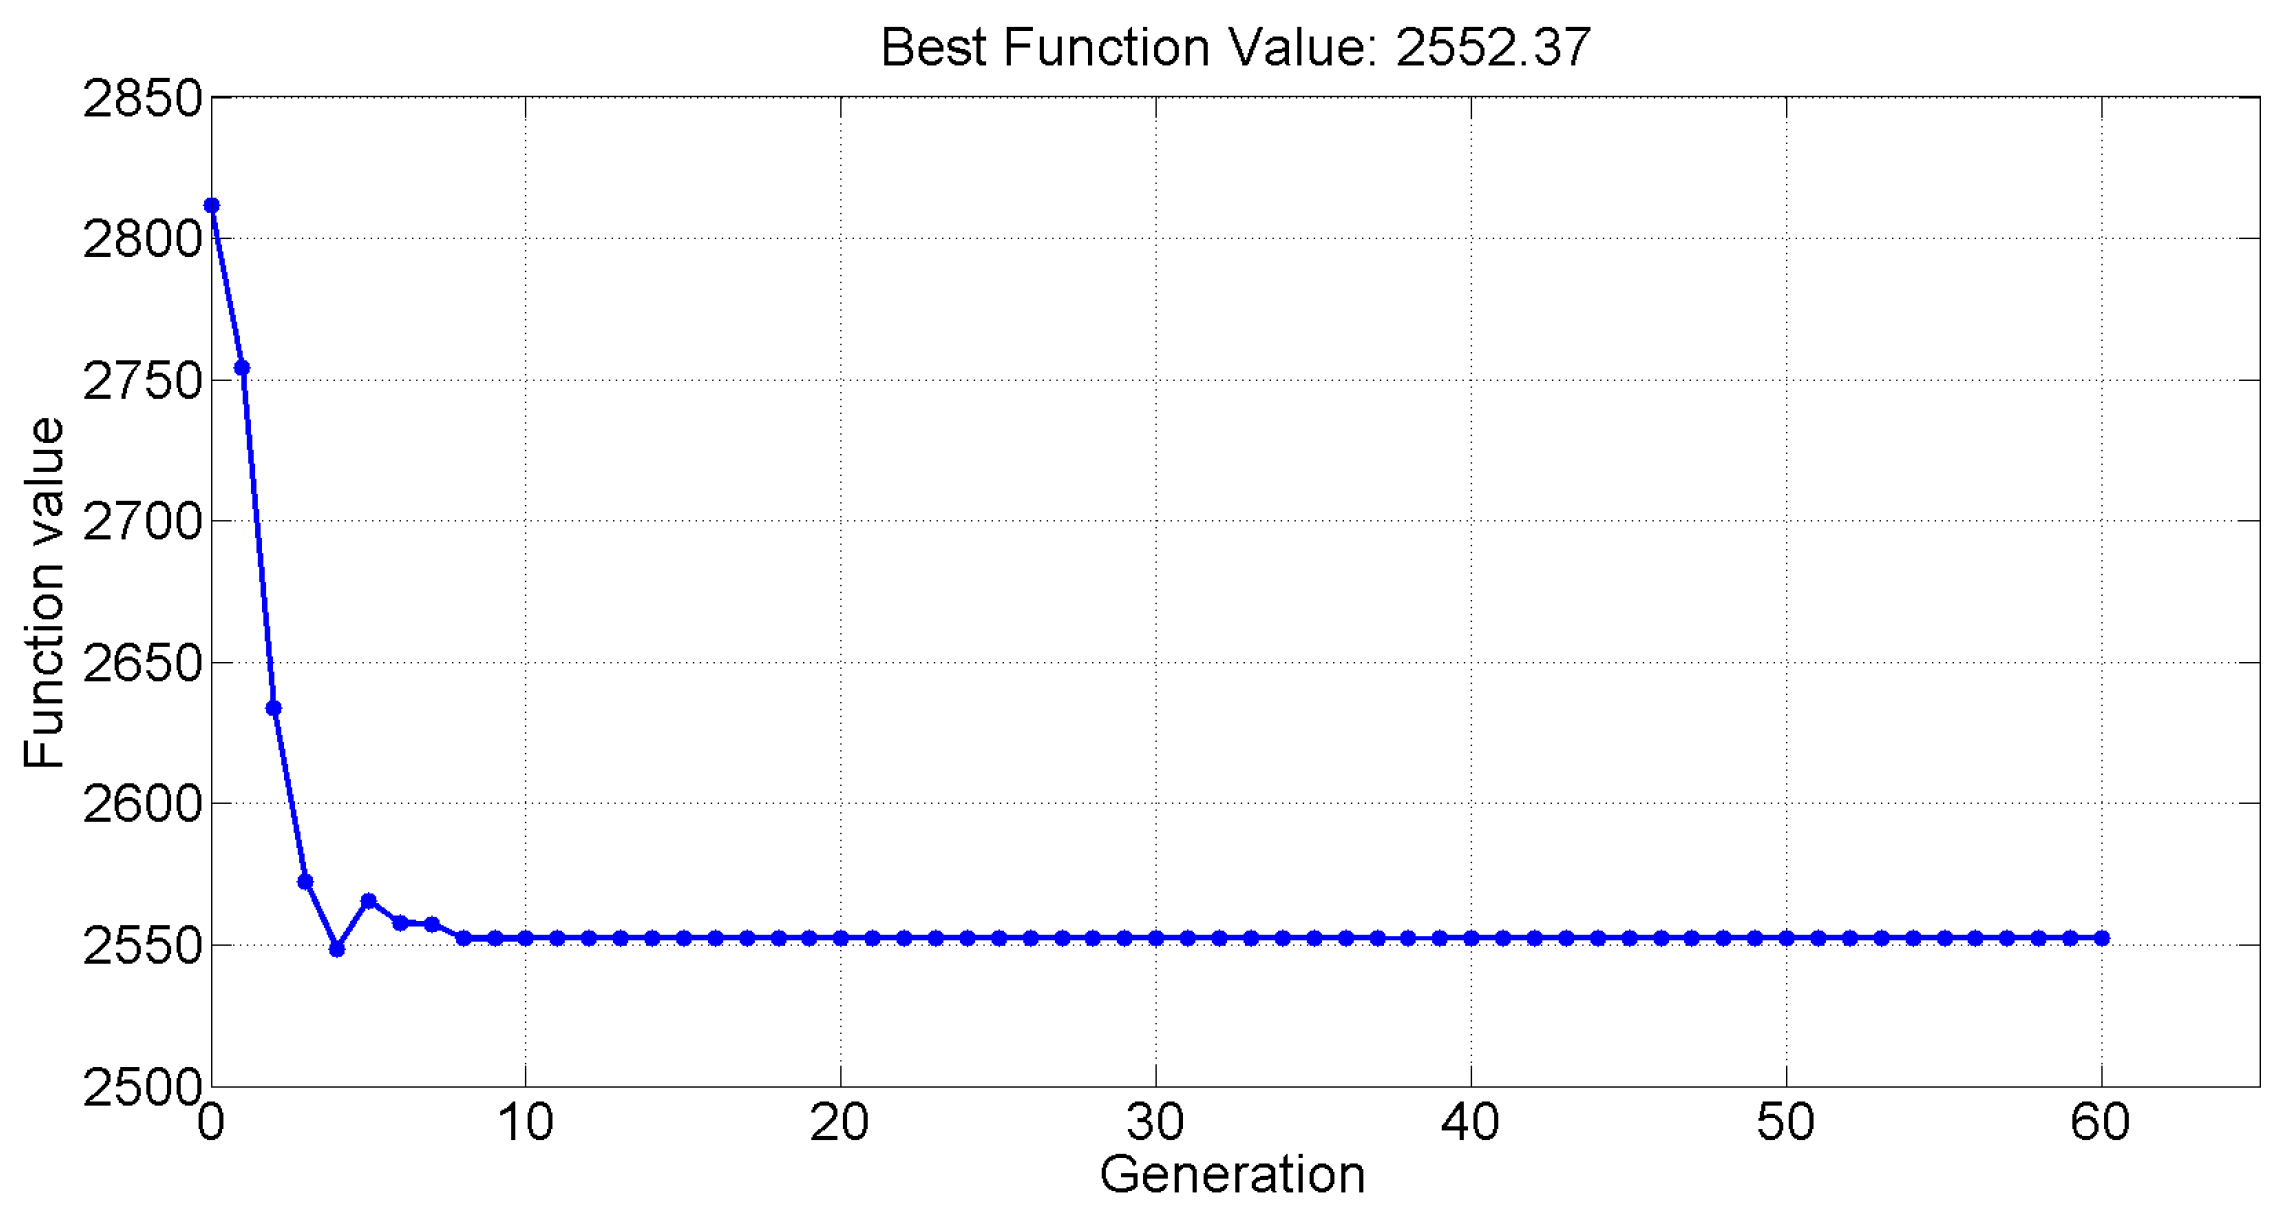
| TCO | €2552.37 per year |
| Variable | Optimal Solution |
|---|---|
| Parallel number | 41 |
| Serial number | 117 |
| Total vehicle mass | 2211.23 kg |
| Battery cost | €2142.86 per year |
| Electricity cost | €239.92 per year |
| Based vehicle cost | €834.58 per year |
| Lifetime | 8.73 years |
| Average discharge efficiency | 90.14% |
| TCO | €3217.36 per year |
© 2017 by the authors. Licensee MDPI, Basel, Switzerland. This article is an open access article distributed under the terms and conditions of the Creative Commons Attribution (CC BY) license (http://creativecommons.org/licenses/by/4.0/).
Share and Cite
Chen, Z.; Guo, N.; Li, X.; Shen, J.; Xiao, R.; Li, S. Battery Pack Grouping and Capacity Improvement for Electric Vehicles Based on a Genetic Algorithm. Energies 2017, 10, 439. https://doi.org/10.3390/en10040439
Chen Z, Guo N, Li X, Shen J, Xiao R, Li S. Battery Pack Grouping and Capacity Improvement for Electric Vehicles Based on a Genetic Algorithm. Energies. 2017; 10(4):439. https://doi.org/10.3390/en10040439
Chicago/Turabian StyleChen, Zheng, Ningyuan Guo, Xiaoyu Li, Jiangwei Shen, Renxin Xiao, and Siqi Li. 2017. "Battery Pack Grouping and Capacity Improvement for Electric Vehicles Based on a Genetic Algorithm" Energies 10, no. 4: 439. https://doi.org/10.3390/en10040439
APA StyleChen, Z., Guo, N., Li, X., Shen, J., Xiao, R., & Li, S. (2017). Battery Pack Grouping and Capacity Improvement for Electric Vehicles Based on a Genetic Algorithm. Energies, 10(4), 439. https://doi.org/10.3390/en10040439