Article

Experimental Results on a Wireless Wattmeter Device for the Integration in Home Energy Management Systems

by
Eduardo M. G. Rodrigues
1,
Radu Godina
1,
Miadreza Shafie-khah
1 and
João P. S. Catalão
1,2,3,*
1
C-MAST, University of Beira Interior, R. Fonte do Lameiro, 6201-001 Covilhã, Portugal
2
INESC TEC and Faculty of Engineering of the University of Porto, R. Dr. Roberto Frias, 4200-465 Porto, Portugal
3
INESC-ID, Instituto Superior Técnico, University of Lisbon, Av. Rovisco Pais, 1, 1049-001 Lisbon, Portugal
*
Author to whom correspondence should be addressed.
Energies 2017, 10(3), 398; https://doi.org/10.3390/en10030398
Submission received: 4 December 2016 / Revised: 23 February 2017 / Accepted: 13 March 2017 / Published: 20 March 2017
(This article belongs to the Special Issue Innovative Methods for Smart Grids Planning and Management)

Abstract

:
This paper presents a home area network (HAN)-based domestic load energy consumption monitoring prototype device as part of an advanced metering system (AMS). This device can be placed on individual loads or configured to measure several loads as a whole. The wireless communication infrastructure is supported on IEEE 805.12.04 radios that run a ZigBee stack. Data acquisition concerning load energy transit is processed in real time and the main electrical parameters are then transmitted through a RF link to a wireless terminal unit, which works as a data logger and as a human-machine interface. Voltage and current sensing are implemented using Hall effect principle-based transducers, while C code is developed on two 16/32-bit microcontroller units (MCUs). The main features and design options are then thoroughly discussed. The main contribution of this paper is that the proposed metering system measures the reactive energy component through the Hilbert transform for low cost measuring device systems.

1. Introduction

Growing concern about energy consumption is promoting the better usage of energy resources at different levels of human activities. It is a fact that the domestic sector has an increasing impact on world’s energy consumption [1,2]. As an example, in the European Community space heating energy needs account for about 70% of a typical home electricity bill, followed by water heating, which accounts for 10%. Despite continuous improvement efforts made by domestic equipment manufacturers, appliances such as refrigerators, space heating/cooling systems, water heaters, clothes washers, dryers, lighting and dishwashers continues to burden household energy bill [3]. On the other hand, appliances based on non-linear loads are continually increasing with the mass production of electronically operated devices, so their impact on electricity energy consumption is tending to grow over the time [4].
Recent studies argue that is possible to accomplish energy savings of 30% when energy efficiency measures are implemented [5]. Different strategies are being planned toward transformation of the classical electric network into smart grids [6], and tariff schemes based on demand response programs that call for a paradigm shift in terms of domestic energy consumption habits [7], or by technological interventions at the level of alternative control techniques for reducing electric energy consumption in the normal usage of domestic appliances [8].
Power measurement is a very old and often discussed topic [9]. Professionals from the industry have identified and defined the many elementary methods frequently utilized in power meters [10]. Such types of methods have been employed for decades in the current power meters. Normally, the international standards specify the allowed variations of frequency and voltage in common AC mains [11]. In case of the measurements for the power quality, harmonics capable until 40th order can be measured [12]. In case of contemporary power meters, the voltage of the mains is measured directly and the phase current is frequently measured with a hall-effect current sensor or a low-resistance current sensor.
The application of ZigBee sensors to smart metering has been researched in the last few years. An implementation and assessment of a ZigBee sensor network for smart grid advanced metering infrastructure is described in [13]. A prototype for a meter reading system that uses a common meter, ZigBee modules, and a mesh network is presented in [14]. In [15] the lower physical distance delivery protocol based on the ZigBee specification in the smart grid in order to optimize the transmission of the monitoring and command packets was studied. The goal of the project described in [16] was to create a communication infrastructure with exchange data related to energy usage, energy consumption and energy tariffs in the home area networks. In [17] the performance of ZigBee has been assessed concerning the network throughput, energy consumption, end-to-end delay, and packet delivery ratio in different smart grid settings, including an indoor power control room. In [18] is described the foundation and implementation of a microcontroller and ZigBee-based load controller system controlled by a home energy management system. The performance potential of wireless digital network equipment employing the ZigBee protocol for smart metering applications was researched in [19].
Whatever the approach followed, home advanced metering systems will be part of this revolution providing an advanced monitoring capability, easy interaction with the home user and flexible management options that facilitate domestic load scheduling according to daily needs in order to achieve energy savings with a positive cost-benefit ratio [20,21].
At the core of any home energy management system, the metering infrastructure relies upon a network of power meters [22]. In this context, a 2.4 GHz ZigBee-based distributed home energy metering system is presented. The proposed metering system measures the reactive energy component through the Hilbert transform for low cost measuring device systems. The novelty lays in the extraction of the reactive energy measurement in residential buildings, which is not commonly addressed in the literature. Its main functionalities as well as the technical details behind the power meter design are discussed. Development and testing of the energy metering solution is based on pre-built boards provided with MCUs. The RF link is ensured by pre-manufactured boards equipped with a wireless transceiver. On the other hand, a custom analog front was designed taking into account specific requirements for voltage and current measurements, namely signal acquisition and filtering. The power meter prototype is projected for acquiring, processing and computing the main electrical quantities used for quantifying an electrical load connected to an AC low voltage systems, such as the root mean square (RMS) voltage or current, active and apparent power, along with the load power factor. The main contribution of this paper is the metering system measurement of the reactive energy component through the Hilbert transform.
This paper is organized as follows: Section 2 describes an energy metering system integrated on a home communication architecture. Section 3 is dedicated to the distributed metering system and describes wireless Watt-meter prototype technical details. Experimental characterization of the power meter devices is provided on Section 4. Lastly, concluding remarks are given in Section 5.

2. House Energy Metering

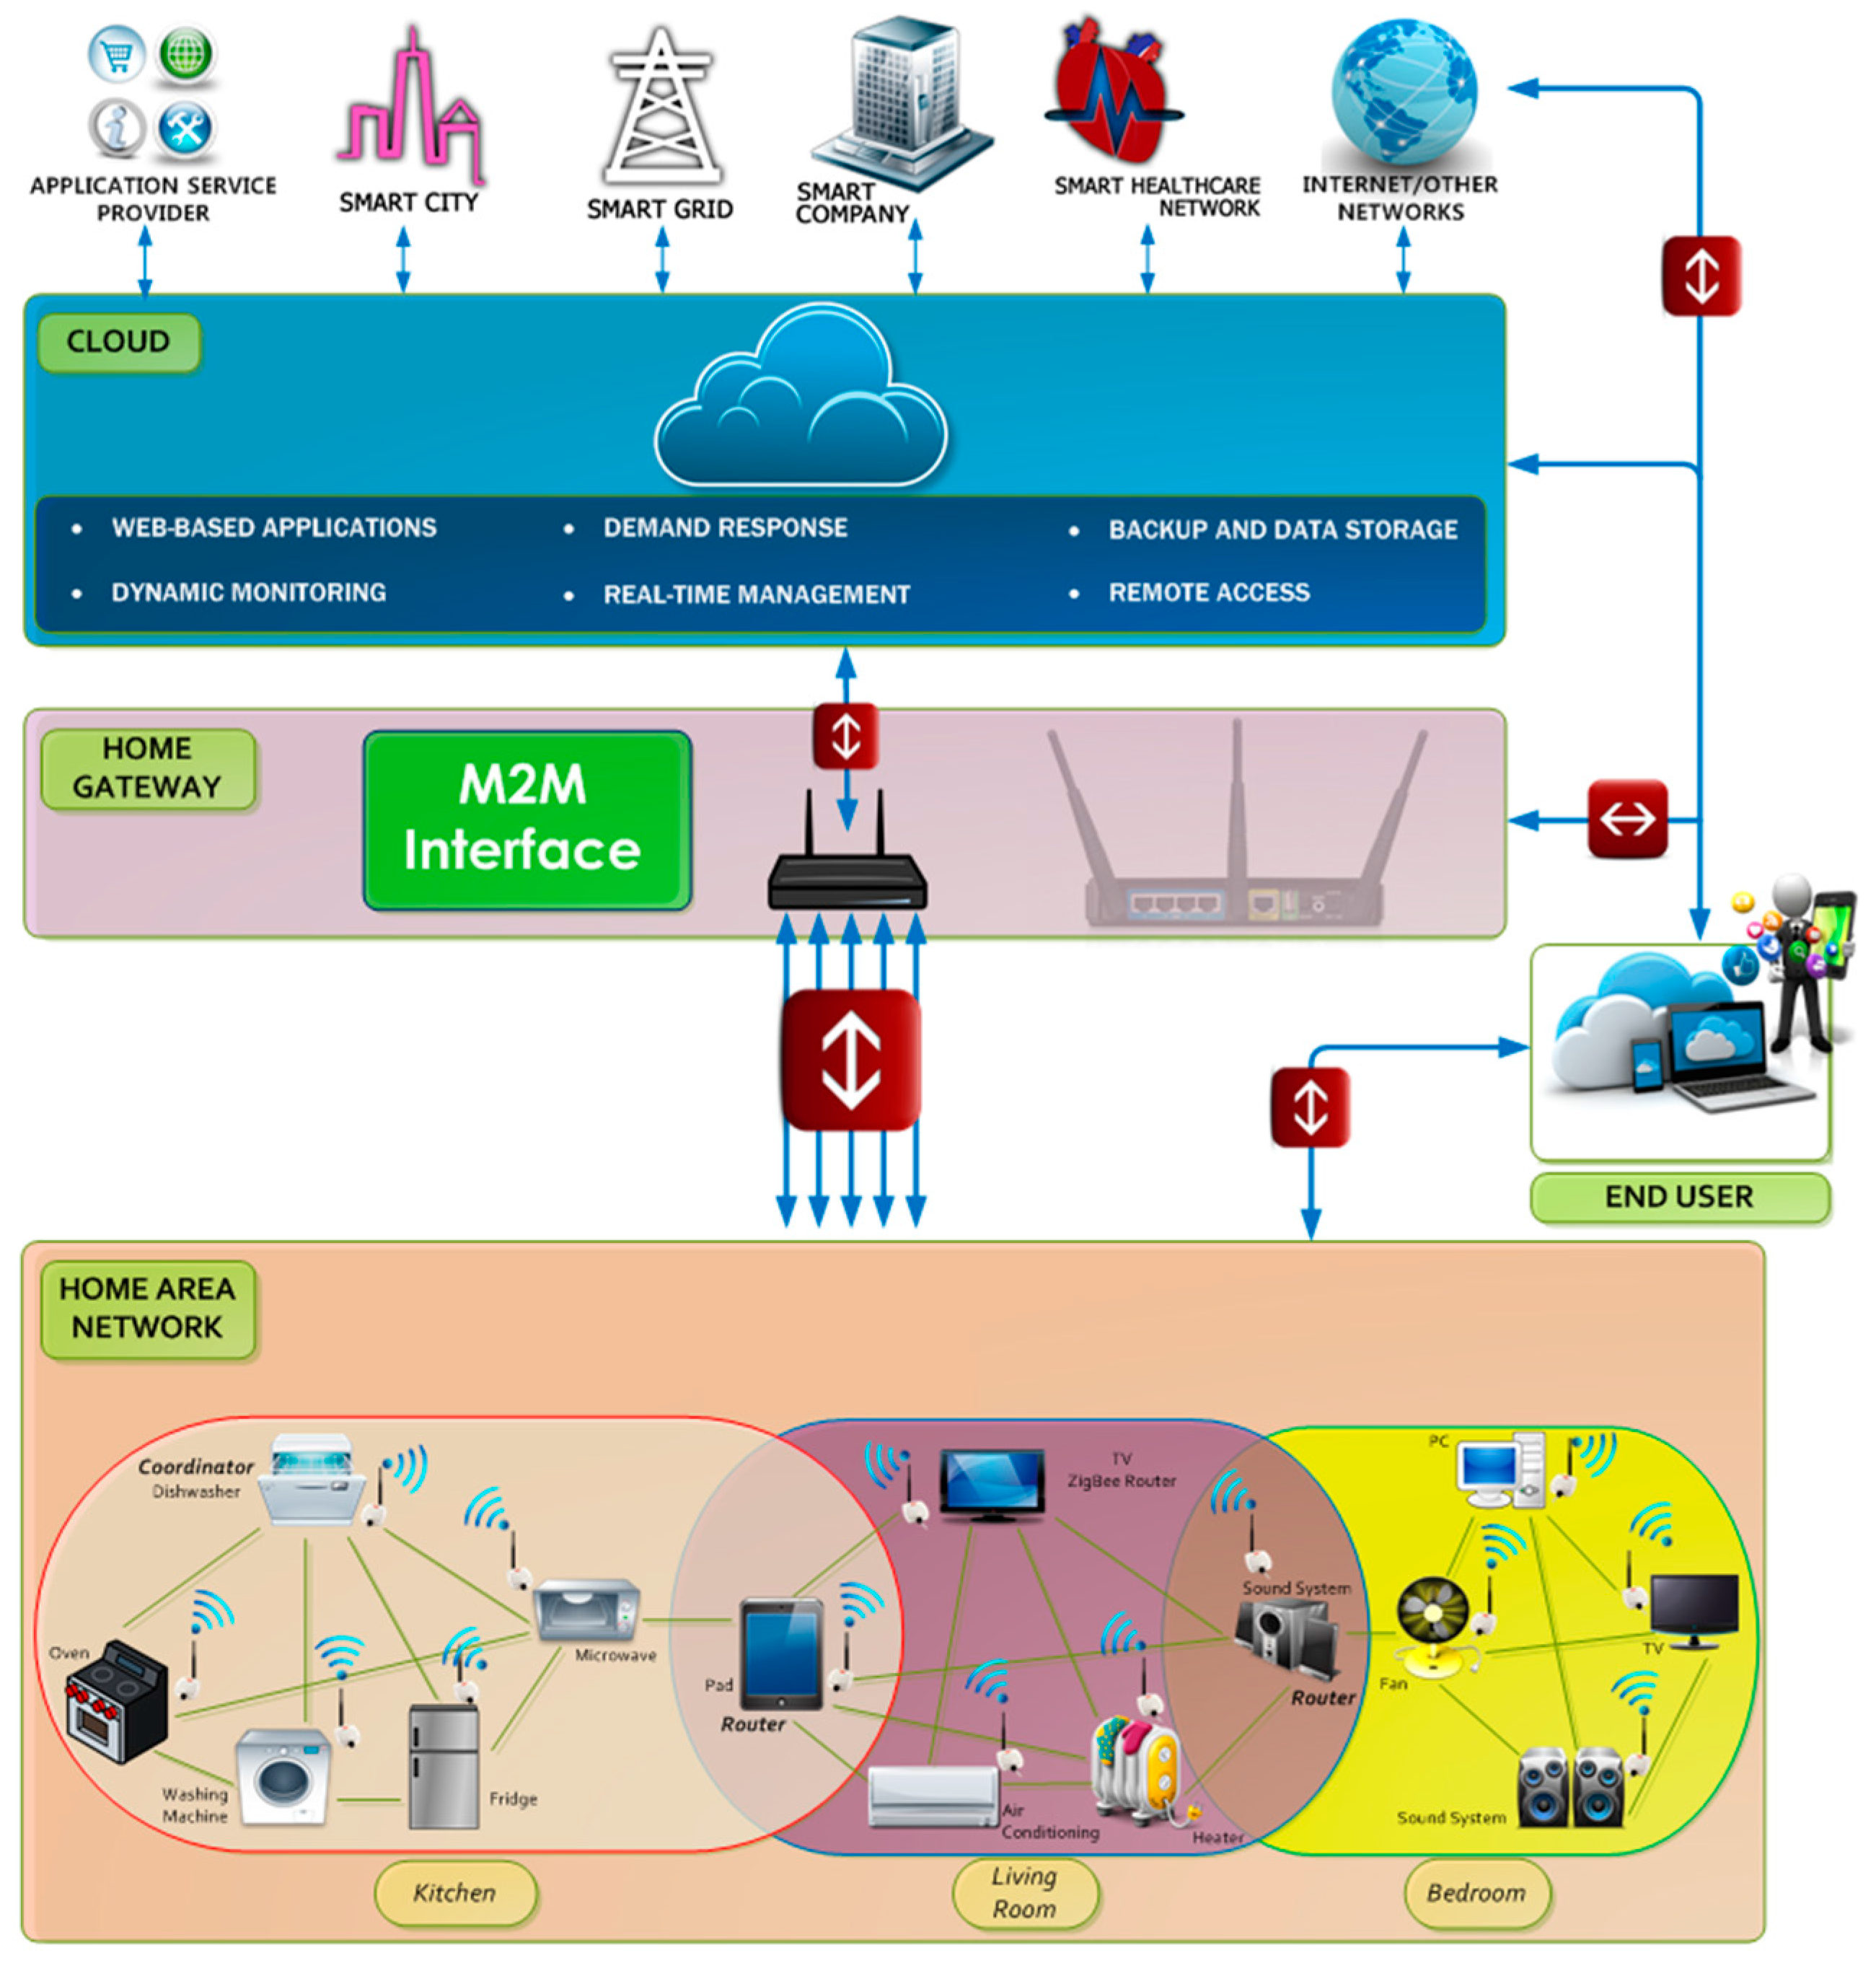
2.1. Home Communication Architecture and Cloud Integration Based Services

An AMS for home application depends on specialized meters created for the purpose of regular recording of gas and electricity consumption—smart meters. In turn, the clients will also access monitors called In-Home Displays, which consequently allow them to understand how much power is being consumed at any time and how much it is costing them [23]. The obtained data could inspire consumers to utilize less energy, thus reducing their bills and supporting the environment. They will also be able to identify when it is more economical to run appliances [24].
The increasing deployment of smart meters to people’s homes results in abundant quantities of data that need to be processed by power utilities [25]. Cloud computing platforms can bring great scalability and availability concerning network computational resources, bandwidth, and storage. Notwithstanding, with the installation at a large scale of distributed power meter devices for individualized energy consumption control purposes, an unparalleled increase of data generation arriving from smart meters is expected, which could in turn give rise to severe problems with the quality of service provided by the communication infrastructure between the utility and consumers [26]. Cloud computing could ease smart grid agents’ concerns and home owners’ apprehension by contributing additional dependable services. This signifies greater scalability and availability of resources concerning network bandwidth, computational resources, and storage.
The benefits of introducing the two-way communications of the AMS/Home Area Network (HAN)-based power meters with a cloud-based system relate to the information on the house’s expected electricity usage behaviour being concentrated and made accessible to a utility, load serving entity or an aggregator, so that those entities being able to perform their optimization processes by guaranteeing precise information to their customers [27]. Moreover, end-users could use a smartphone to remotely access data concerning their electricity consumption or to set the parameters to the HAN connected domestic appliances in real-time. In addition, from the homeowner’s standpoint, the usual domestic computing resources may not be satisfactory to store long-term data. In conclusion, there is always a risk of it being misplace or corrupted by a defective device [28].
Figure 1 presents an overview of a global energy management paradigm through the cloud computing link. As can be observed, the cloud computing infrastructure executes a crucial interface by acting as a virtual decoupler between the smart grid universe and home users, while at same time offering high interoperability concerning communication capabilities.

2.2. ZigBee

ZigBee is a wireless protocol aimed at low power applications that require a low data rate. ZigBee is built on top of the IEEE 802.15.4. That is, the ZigBee norm specifies the higher network layers while the physical and medium control access layers are based on the aforementioned IEEE standard. It can be operated in the 2.4 GHz, 915 MHz or 868 MHz bands (license-free ISM band). Data rates of 250 kbits can be achieved in the 2.4 GHz band for each of the 16 channels available in this band. Each channel has a fixed bandwidth of 2 MHz with a channel separation of 5 MHz. The protocol offers high flexibility in terms of network arrangement. The network can be set between the start topology, peer-to-peer communication or mesh networking [4,29,30].

3. House Energy Metering
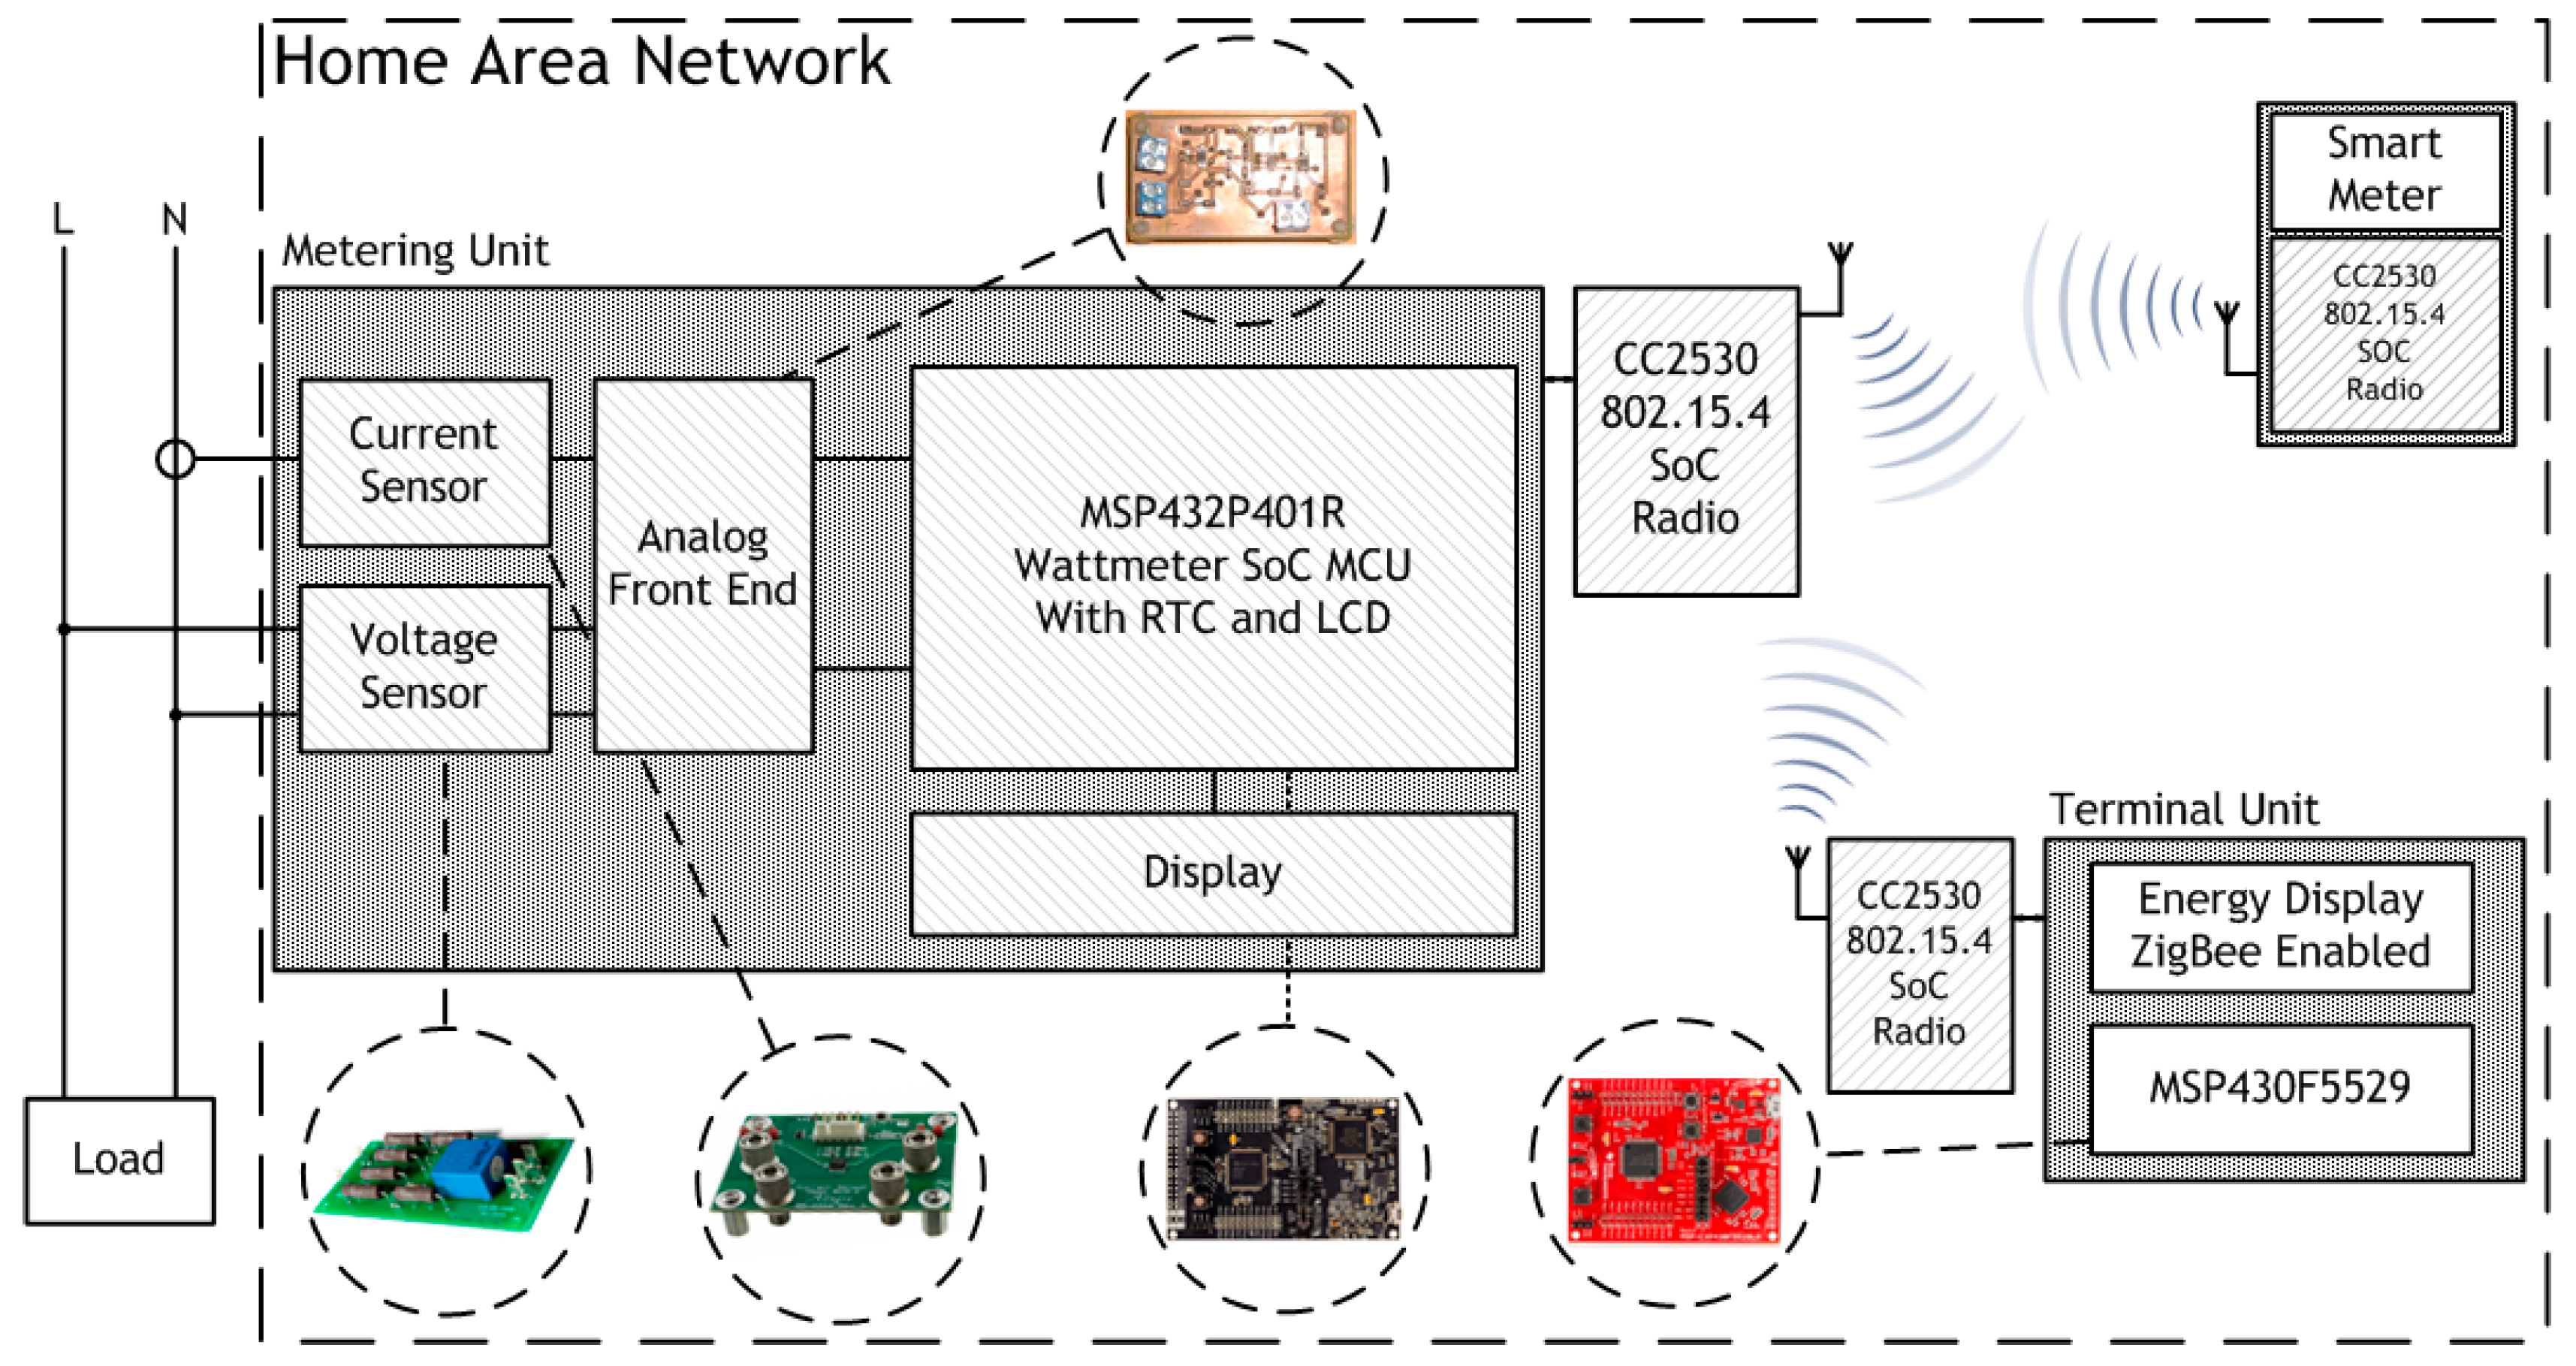
3.1. Block Diagram

Figure 2 presents the block diagram of a home energy management system based on the wireless watt-meter prototype. The minimum configuration consists of a metering unit built on the MSP432 MCU that performs the power and energy calculations. Aggregated with this unit, a display enables visualization of the real-time energy consumption with regard to the appliance being monitored. Plugged into the MCU is a CC2530 transceiver that sends the energy/power data to a remote unit in charge of gathering the energy consumption profiles from each of the items of domestic equipment being monitored by the power meter. The wireless networking technology is ensured by the ZigBee protocol. In this research work the concept development and experimental tests have been conducted with the metering unit and terminal unit prototypes.

3.1.1. MSP432P401R and MSP430F5529

The MSP432P401R belongs to a new generation of MCUs with advanced mixed-signal features targeting low power applications, while providing significant performance processing capabilities for moderate signal processing tasks thanks to the ARM 32-bit Cortex M4 RISC engine [31]. Its operating time base can be configured with external or internal clock sources enabling a system clock rate up to 48 MHz. It is analog-digital conversion (ADC) capabilities allow data digitization at a maximum conversion rate of 1 Msps with a configurable resolution from 8 to 14-bit. In addition, the ADC module allows data to be digitized with only a positive input range (unipolar mode) or by accepting also negative analog signals (bipolar mode). As for the MSP430F5529 model, it features a 16-bit RISC architecture equipped with a rich set of internal peripherals such as four 16-bit timer units, several serial bus interfaces (I2C, SPI and UART modules) and an eight channel DMA unit. In terms of ADC specifications, it is less flexible and powerful than the ADC available in the MSP432P401R MCU. The conversion module is implemented with a 12-bit successive approximation register (SAR) ADC that can accept only positive input values. The maximum sampling frequency is 200 ksps under single channel mode. When multiple signals are acquired the maximum sampling frequency is shared between the ADC channels. For the metering unit, the MSP432P401R MCU was chosen, while the terminal unit was built based on the MSP430F5529.

3.1.2. CC2530 Radio

CC2530 is what is known as a system on a chip (SOC). The transceiver functionality and MCU device are merged into a single chip. The radio side contains an IEEE 802.15.4-compliant RF transceiver and MCU function is supported on an 8051-derived microcontroller featuring 256 kB of flash memory, 8 kB RAM memory, having also two USARTs, 12-Bit ADC, and 21 general-purpose GPIOs. Its architecture meets well the needs of wireless applications with moderate data processing demands that can be performed by the internal MCU, while at the same time providing a compact solution enabling robust and flexible operation for networking configuration, operation and maintenance due to mesh networking capabilities offered by the ZigBee protocol. ZigBee-based wireless applications are gaining increasing acceptance for smart grid applications and for improving HAN-based AMS functionality [32]. The MCU supports the ZigBee, ZigBee PRO, and ZigBeeRF4CE standards.

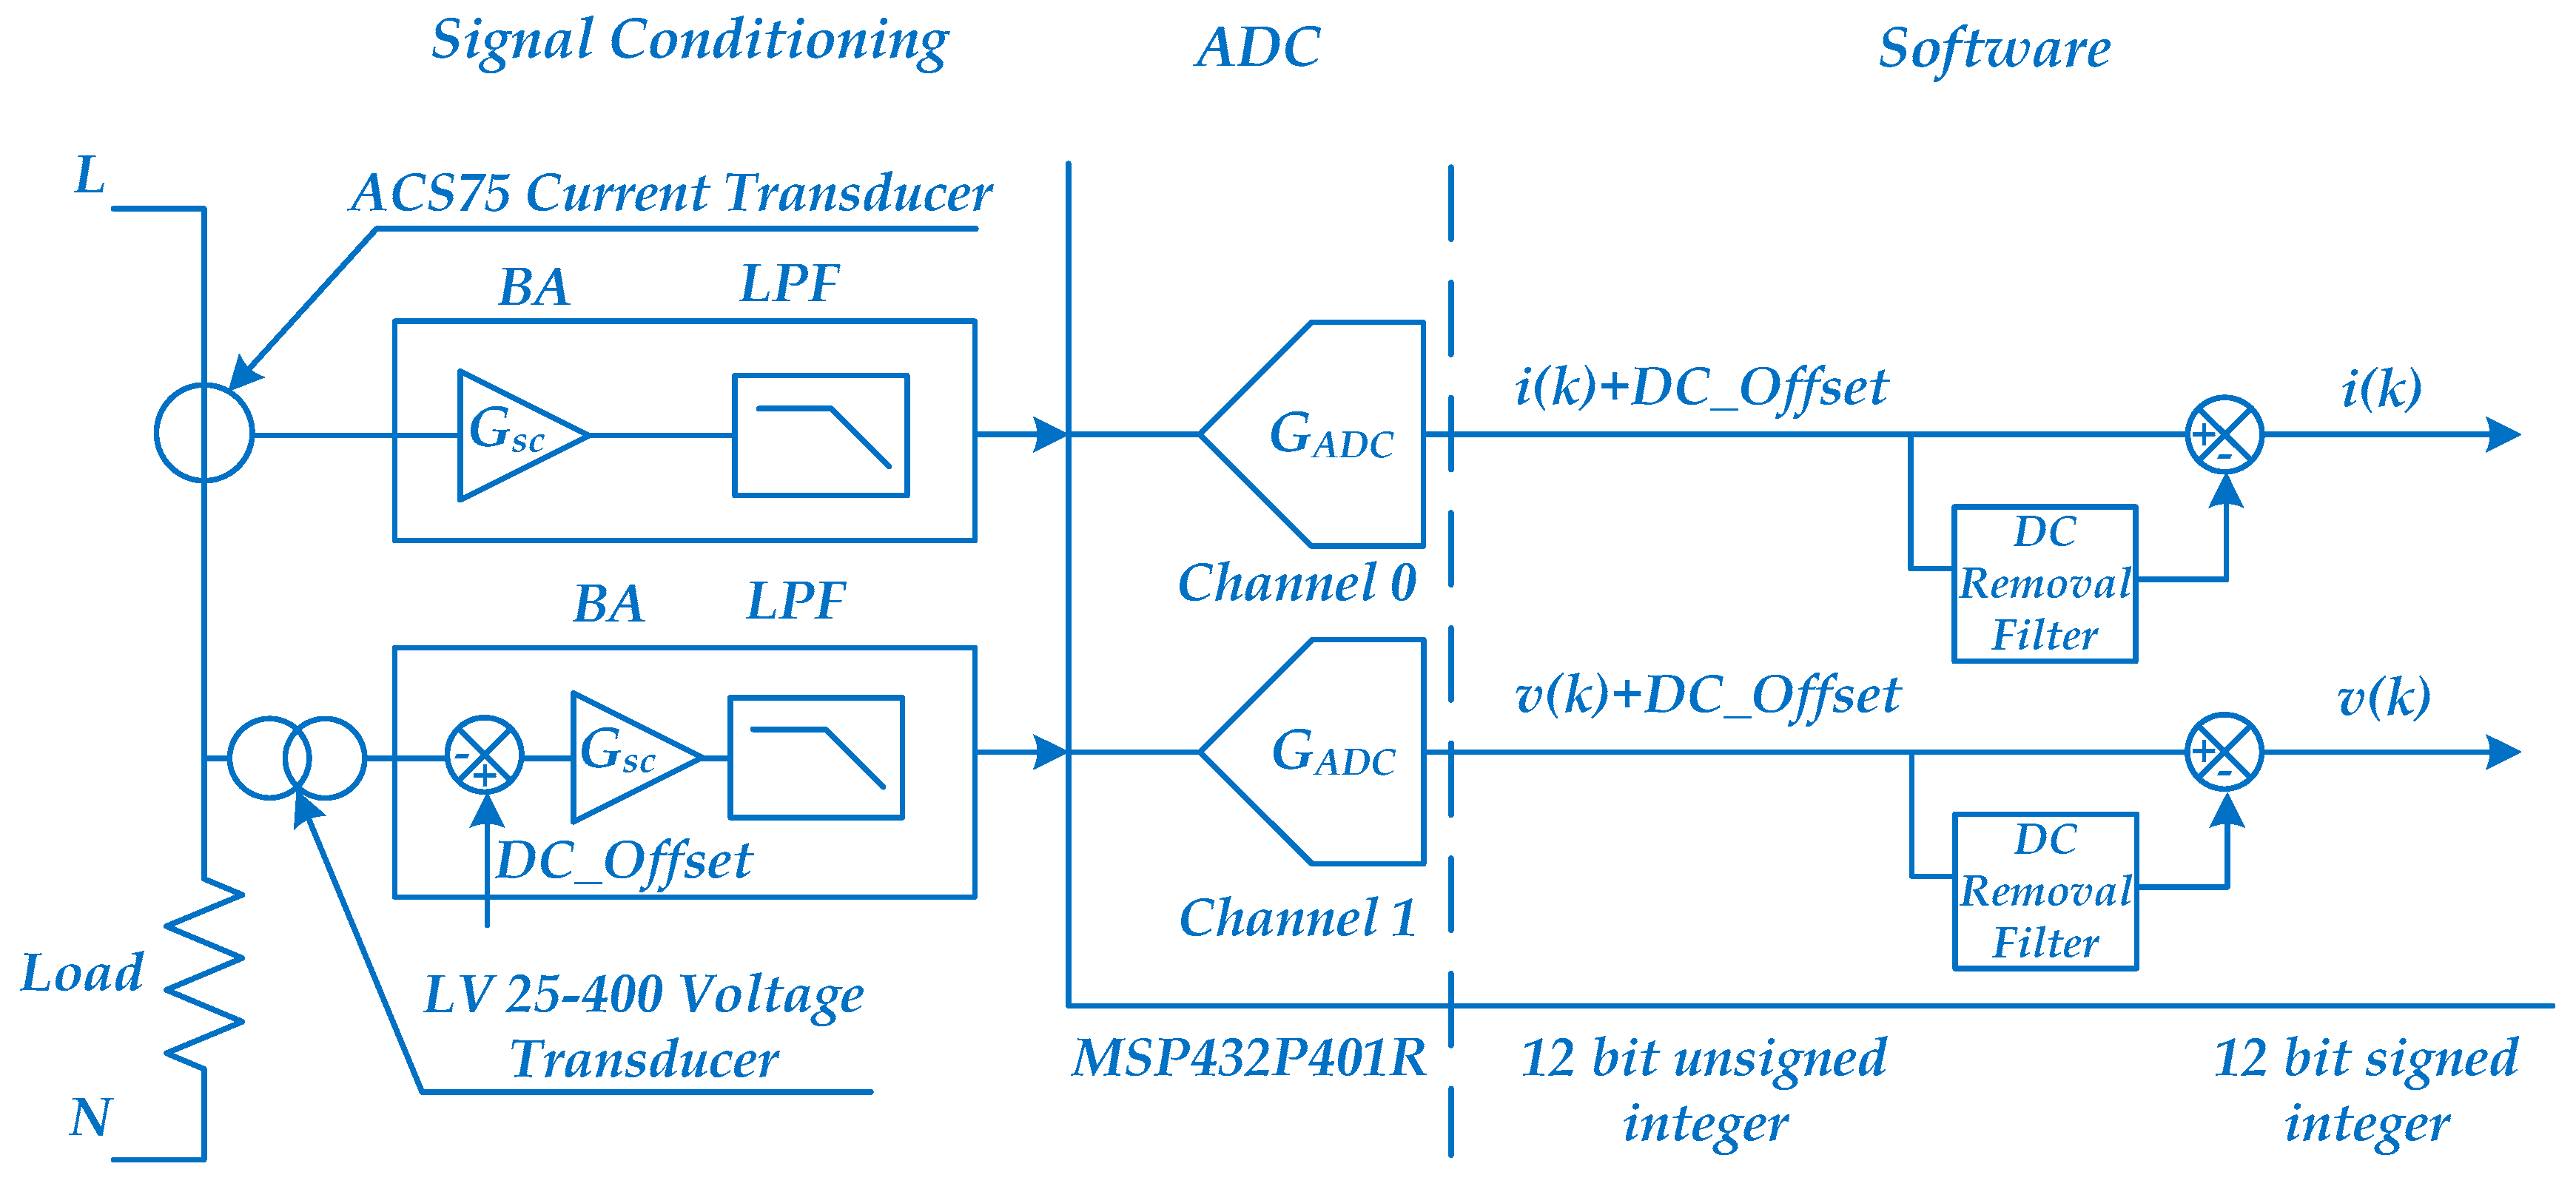
3.1.3. ACS712 Current Sensor

A Hall effect principle operated current sensor is used. Basically, it outputs a voltage that is created as function of the directions of both the current and the magnetic field. The main specifications for the current sensor are the radiometric linear output capability, output sensitivity 100 mV/1 A (+/−20 A), adjustable bandwidth up to 80 kHz and low noise analog signal (maximum 92 mVpp for bandwidth of 80 kHz).

3.1.4. LV 25–400 Voltage Sensor

The mains supply voltage is measured through a LV 25–400 voltage transducer manufactured by LEM (Geneva, Switzerland). Likewise, it follows the same Hall effect physical principle translating the voltage reading into a low current value with galvanic isolation between the electric power circuit and the electronic acquisition board. This means a typical analog interface system can be designed to bridge between the voltage reading and the MCU. Its main application ranges from AC variable speed drives to welding equipment power supplies that demand current monitoring for control and protection purposes.

3.2. Metering System Design

Figure 3 shows the signal path for voltage and current channels. Due to the internal ADC resources limitation available in the MCU, both channels cannot be digitized at the same time. The lack of simultaneity in the signal acquisition implies some error due to the voltage and current sampling time difference. However, sampling the channels as close as possible the error introduced can be negligible if the time difference does not surpass 25 μs [33].

3.2.1. Channel Reading Resolution

The analog signals have to be conditioned before being digitized in order to match their amplitude level with the ADC dynamic range. This function is performed by an individual analog signal chain providing the required conditioning link for each of the two channels. Furthermore, the analog block is also designed with the purpose of preventing the effects of aliasing on sampled data. Amplitude variations in voltage supply are not translated to the output since the sensor gain and offsets are proportional to the supply voltage, Vcc, due to the radiometric feature output.
This means the sensitive range is proportional to the supply voltage and for null current measurement the output is Vcc/2. The current sensor is supplied with 2.5 V corresponding to the MSP432P401R ADC internal voltage reference. This option simplifies the instrumentation chain design.
The transfer function for the current measurement is:
V I S = K C T I L o a d + V O C
where V I S is the output voltage, K C T is the traducer gain, I L o a d is the sensed current and V O C is the offset voltage related to the transducer zero current.
Thus, the voltage at ADC input is given by:
V I S _ A D C = K C S ( K C S I L o a d + V O C )
where K C S is the signal conditioning circuit gain.
The resolution of the sampled data is:
N c o d e   G A D C V I S _ A D C = 2 M 2.5 V N _ A D C
where V N _ A D C is the ADC code, M is the ADC resolution and G A D C is the ADC gain. A similar approach can be made for the voltage measurement channel.
In measuring electrical quantities the choice of the ADC plays a crucial role on the accuracy of the power meter. By norm, commercial power metering solutions incorporate 24-bit ADCs. This high level of resolution is mandatory to fulfill international standards such as EN 50470-1:2006 or EN 50470-3:2006 [34]. Most MCU manufactures are now offering internal ADC with up to 24-bit (sigma delta converter). However, their effective bit resolution is lower than advertised, since the internal MCU noise prevents this level of resolution being achieved for the highest sampling rate. To avoid high costs due to implementation of a discrete 24-bit ADC chip, the power meter proposed takes advantage of the MCU’s internal ADC. However, by taking this approach the resolution available is considerably lower. In fact, the MSP432P401R comes with a 14-bit ADC. The voltage channel is dimensioned for 300 V as the nominal RMS reading, which translates into a maximum voltage peak-to-peak measurement of:
U p k - t o - p k = 300 × 2 × 2 = 848   V
Given that the noise-free resolution is 12-bit for MSP432P401R ADC in unipolar operation, the accuracy of the conversion corresponds to 0.02% of the full-scale ADC range. Therefore, the lowest value of the voltage at which the power meter is able to read is:
U L S B : p e a k   t o   p e a k = 848   V × 0.0002 = 0.17   V
U L S B   R M S = 300   V × 0.0002 = 0.06   V

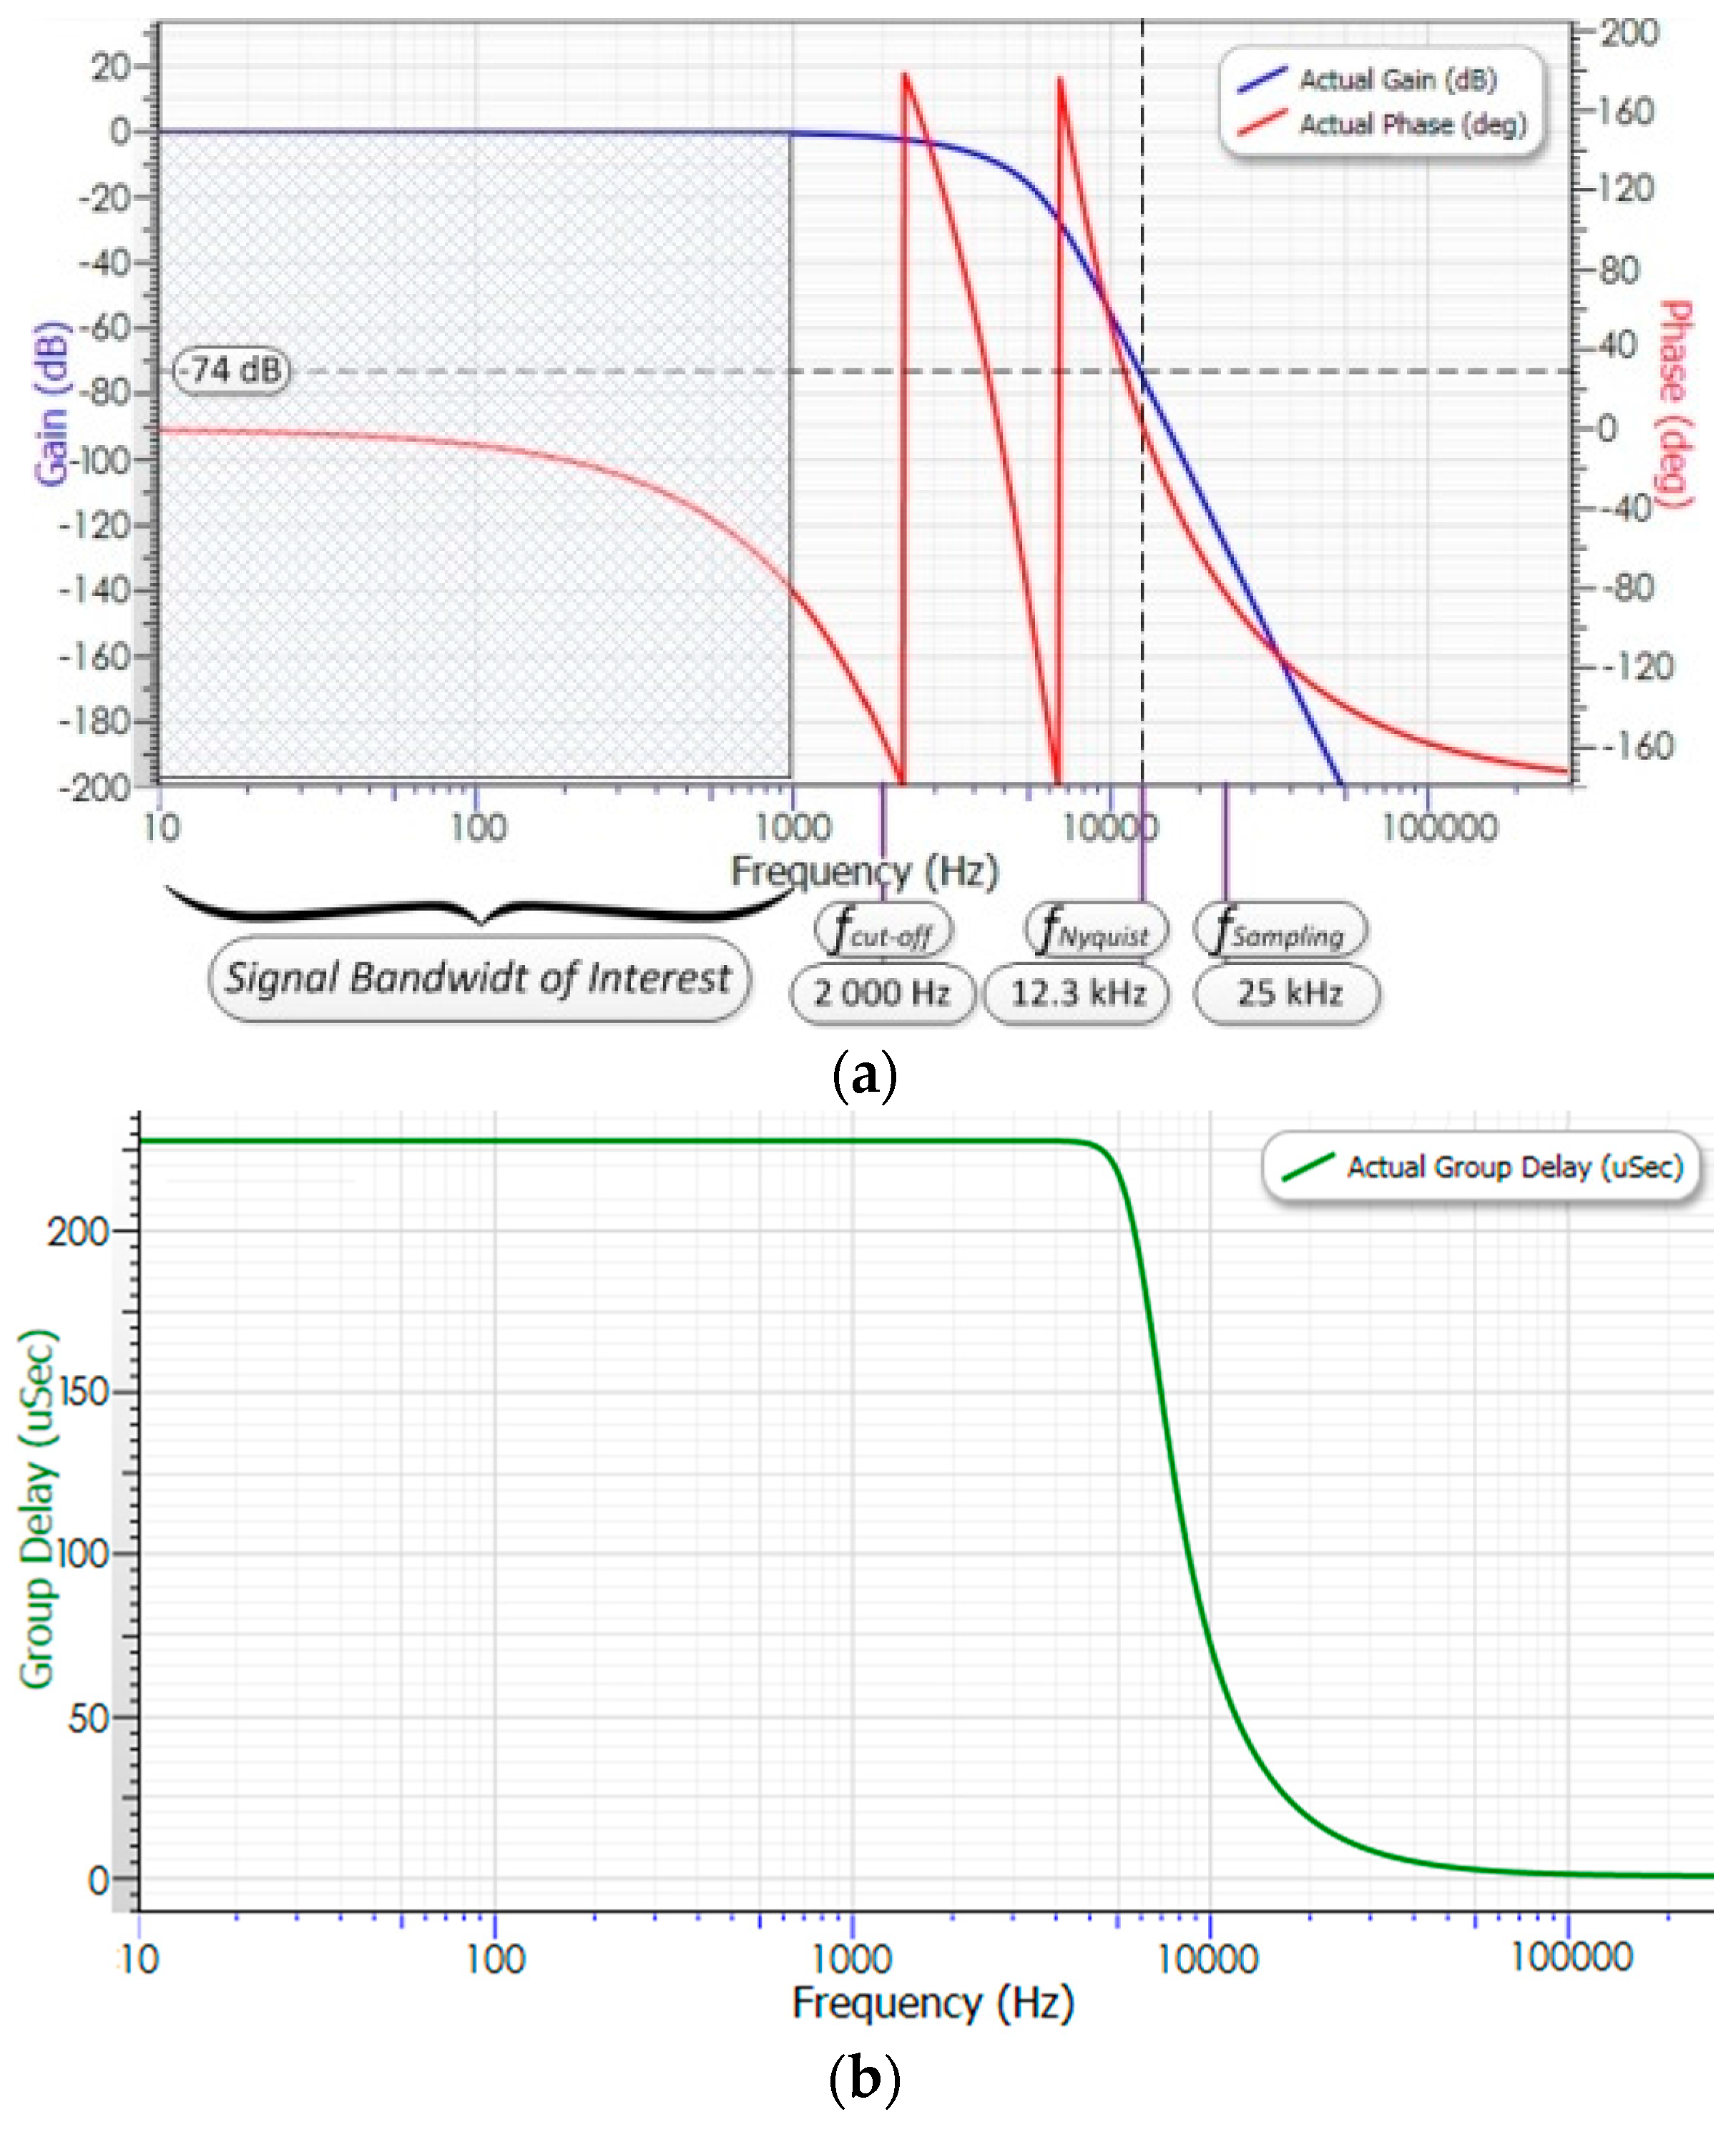
3.2.2. Antialiasing Filter Requirements

According to Nyquist’s theorem, any digitized signal must be acquired with a minimum signal sampling f s of twice the bandwidth signal. Failure to comply with this rule implies that the analog signal cannot be fully reconstructed from the input signal. Moreover, it introduces low frequency terms on the digitized signal that comes from the high frequency components above the sampling frequency. This phenomenon is known as aliasing. Also, the filter displays the function of removing high frequency noise. In fact, all electronic front end (AFE) systems generates broadband noise which affects the effective dynamic range for data acquisition.
For the power metering device in development, it was defined to set the signal’s useful acquisition bandwidth up to 1000 Hz. That is to say, the voltage and current signals are acquired taking into account their harmonic content. Given that the power grid frequency is 50 Hz, then the acquisition bandwidth specification enables harmonic measurements up to the 20th order. To accomplish this, a low pass filter is required to limit both electric signals in terms of bandwidth. The choice of a Bessel analog filter presents one particular advantage over the other filter topologies—the filter’s group delay is approximately constant across the entire pass-band, this being a critical design specification to minimize the effect of distortion on digitized signals. To guarantee a negligible attenuation at 1000 Hz, which makes up the useful bandwidth of acquisition, the filter cut-off frequency is set as 2000 Hz.
To take full advantage of the analog-digital converter (ADC’s) dynamic range, which is characterized by its signal-to-noise ratio (SNR) [14], several design criteria must be considered to match the AFE with the ADC performance. The MSP432 14-bit ADC provides an effective resolution slightly higher than 12-bit at unipolar operation [31], which means the ADC SNR is 74 dB. To achieve the maximum dynamic range from AFE circuit, the RMS noise levels and aliasing effects at the ADC input have to be minimized below the ADC noise floor. For this a high order Bessel filter was designed in order to reduce the sampling frequency requirement overloading the MCU code execution. As a result, a 10th order Bessel filter matches the attenuation requirement at approximately 12.3 kHz. Then, the Nyquist Frequency ( f s / 2 ) can be associated with this frequency and the sampling rate is approximately doubled to comply with Shannon’s theorem. The Bessel filter frequency response is shown in Figure 4. The implementation of the conditioning circuit combined with the anti-aliasing filter is depicted in Figure 5.

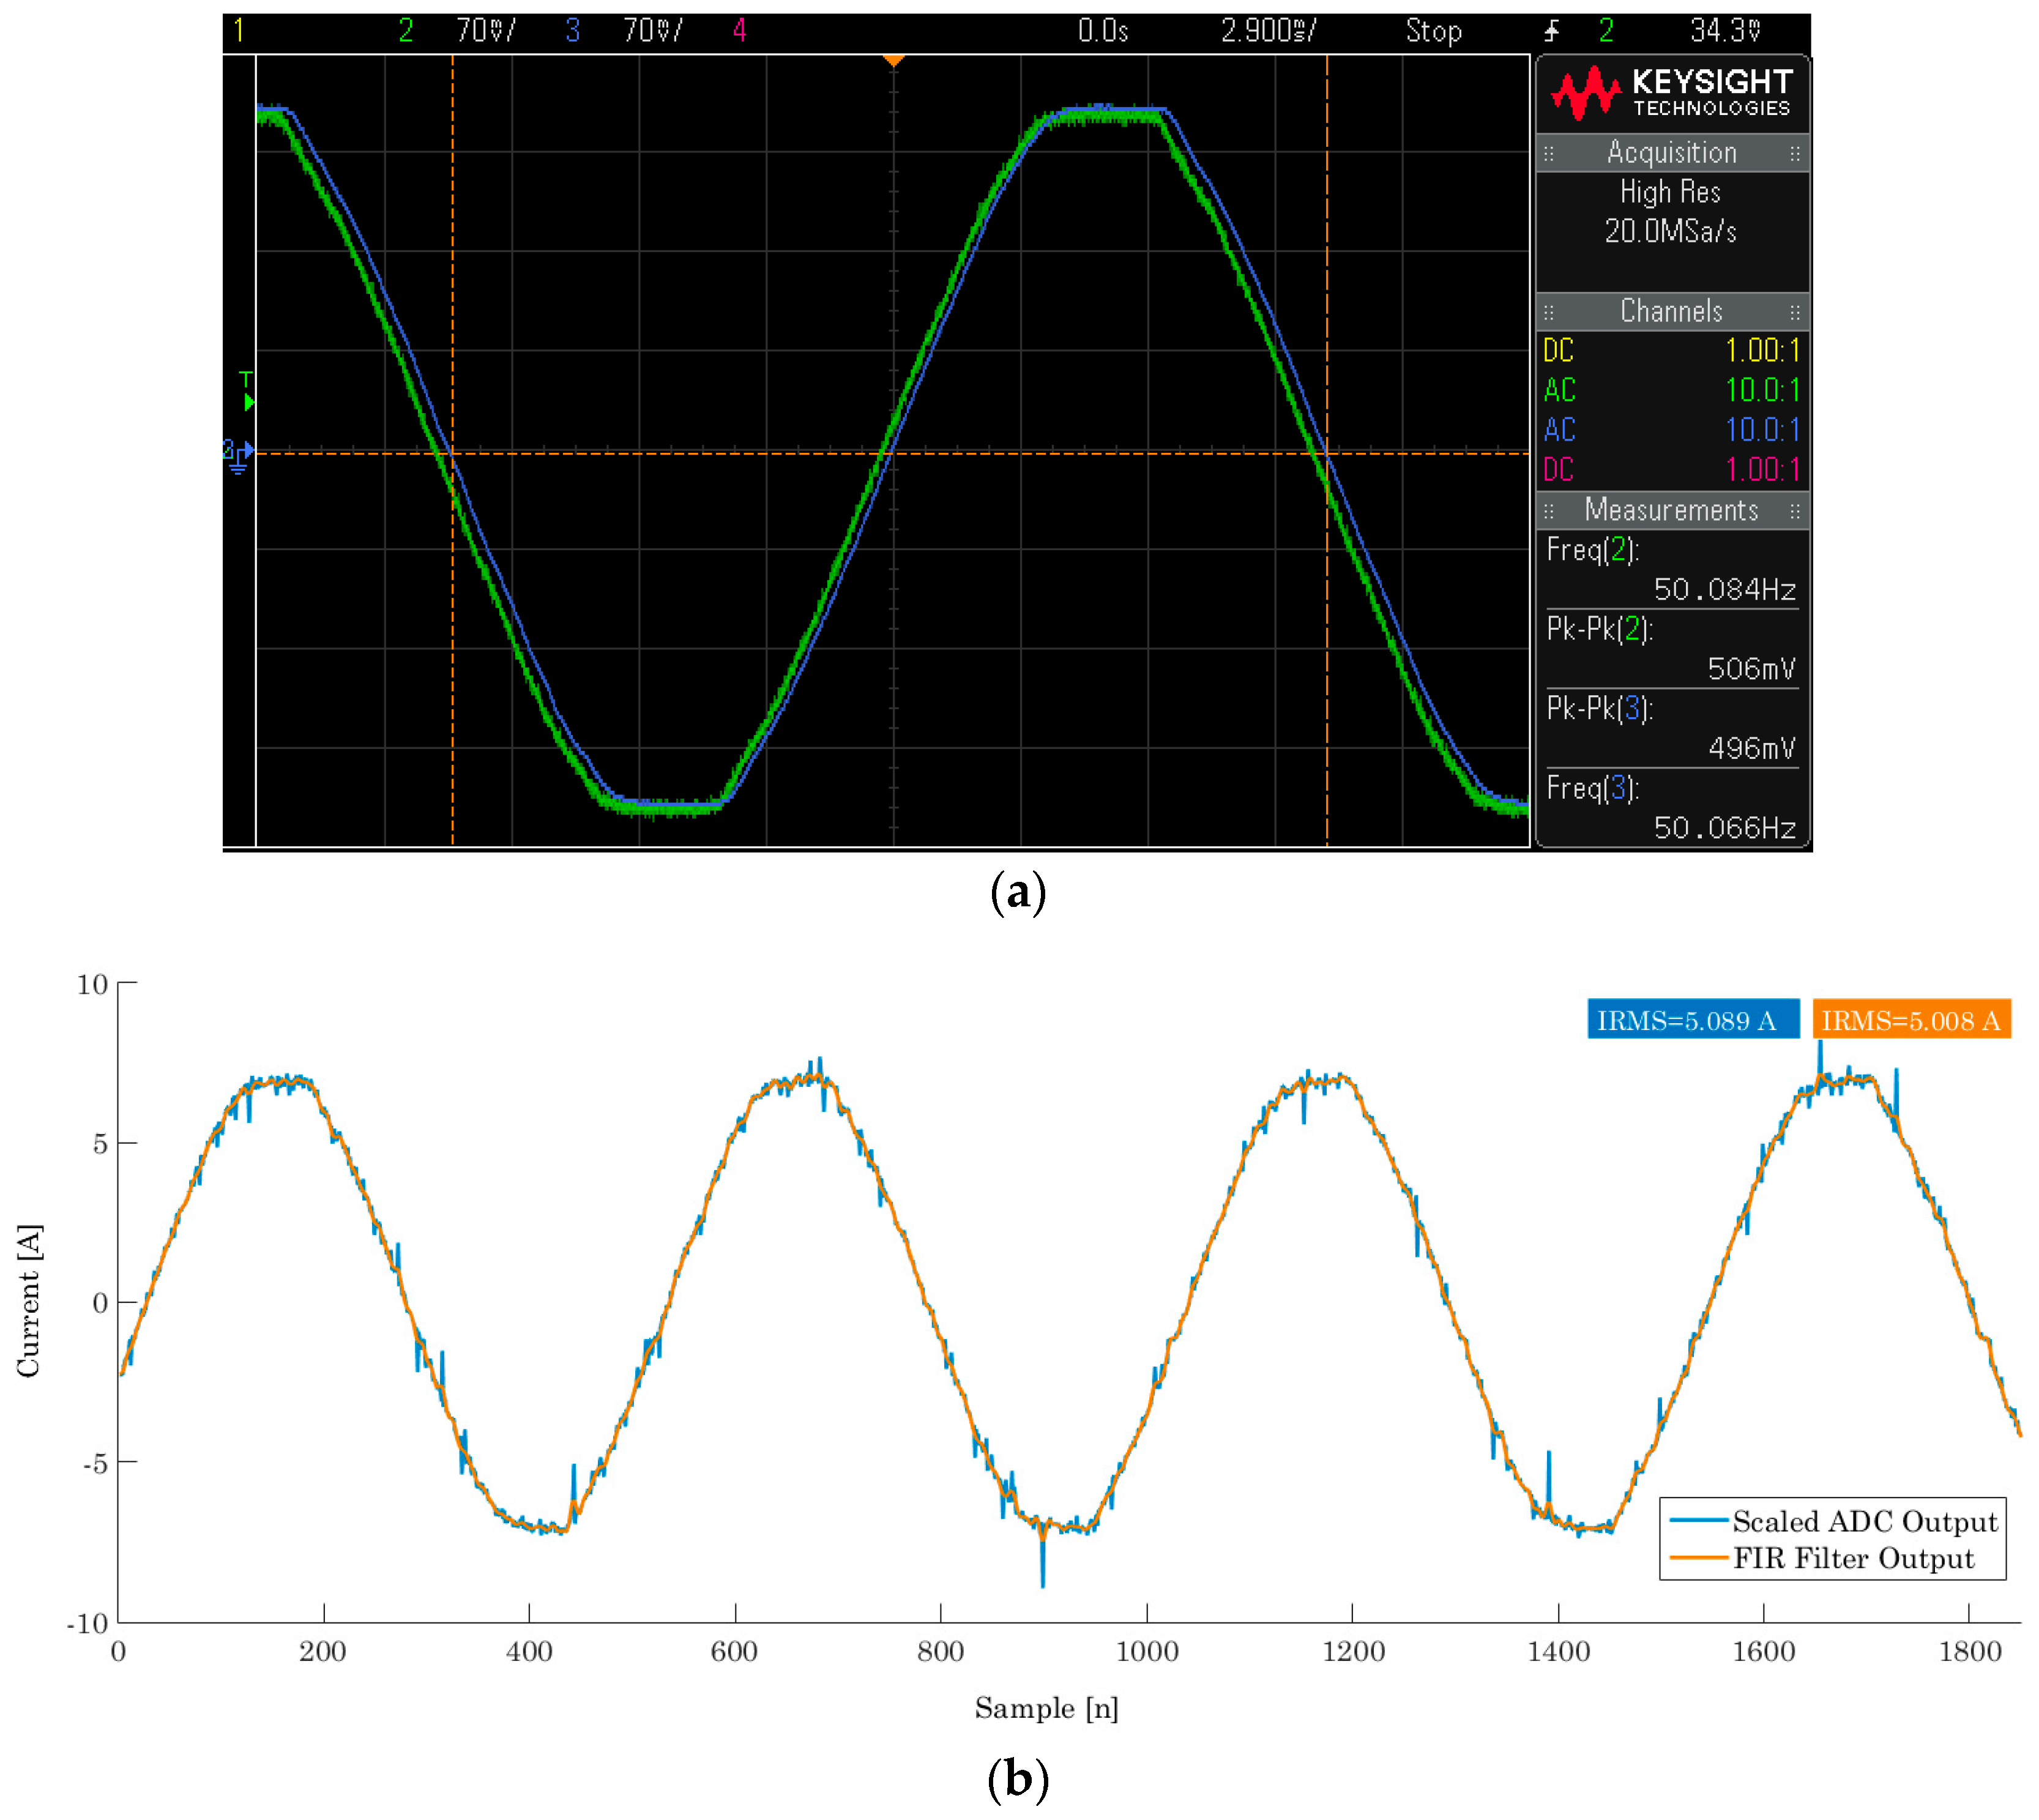
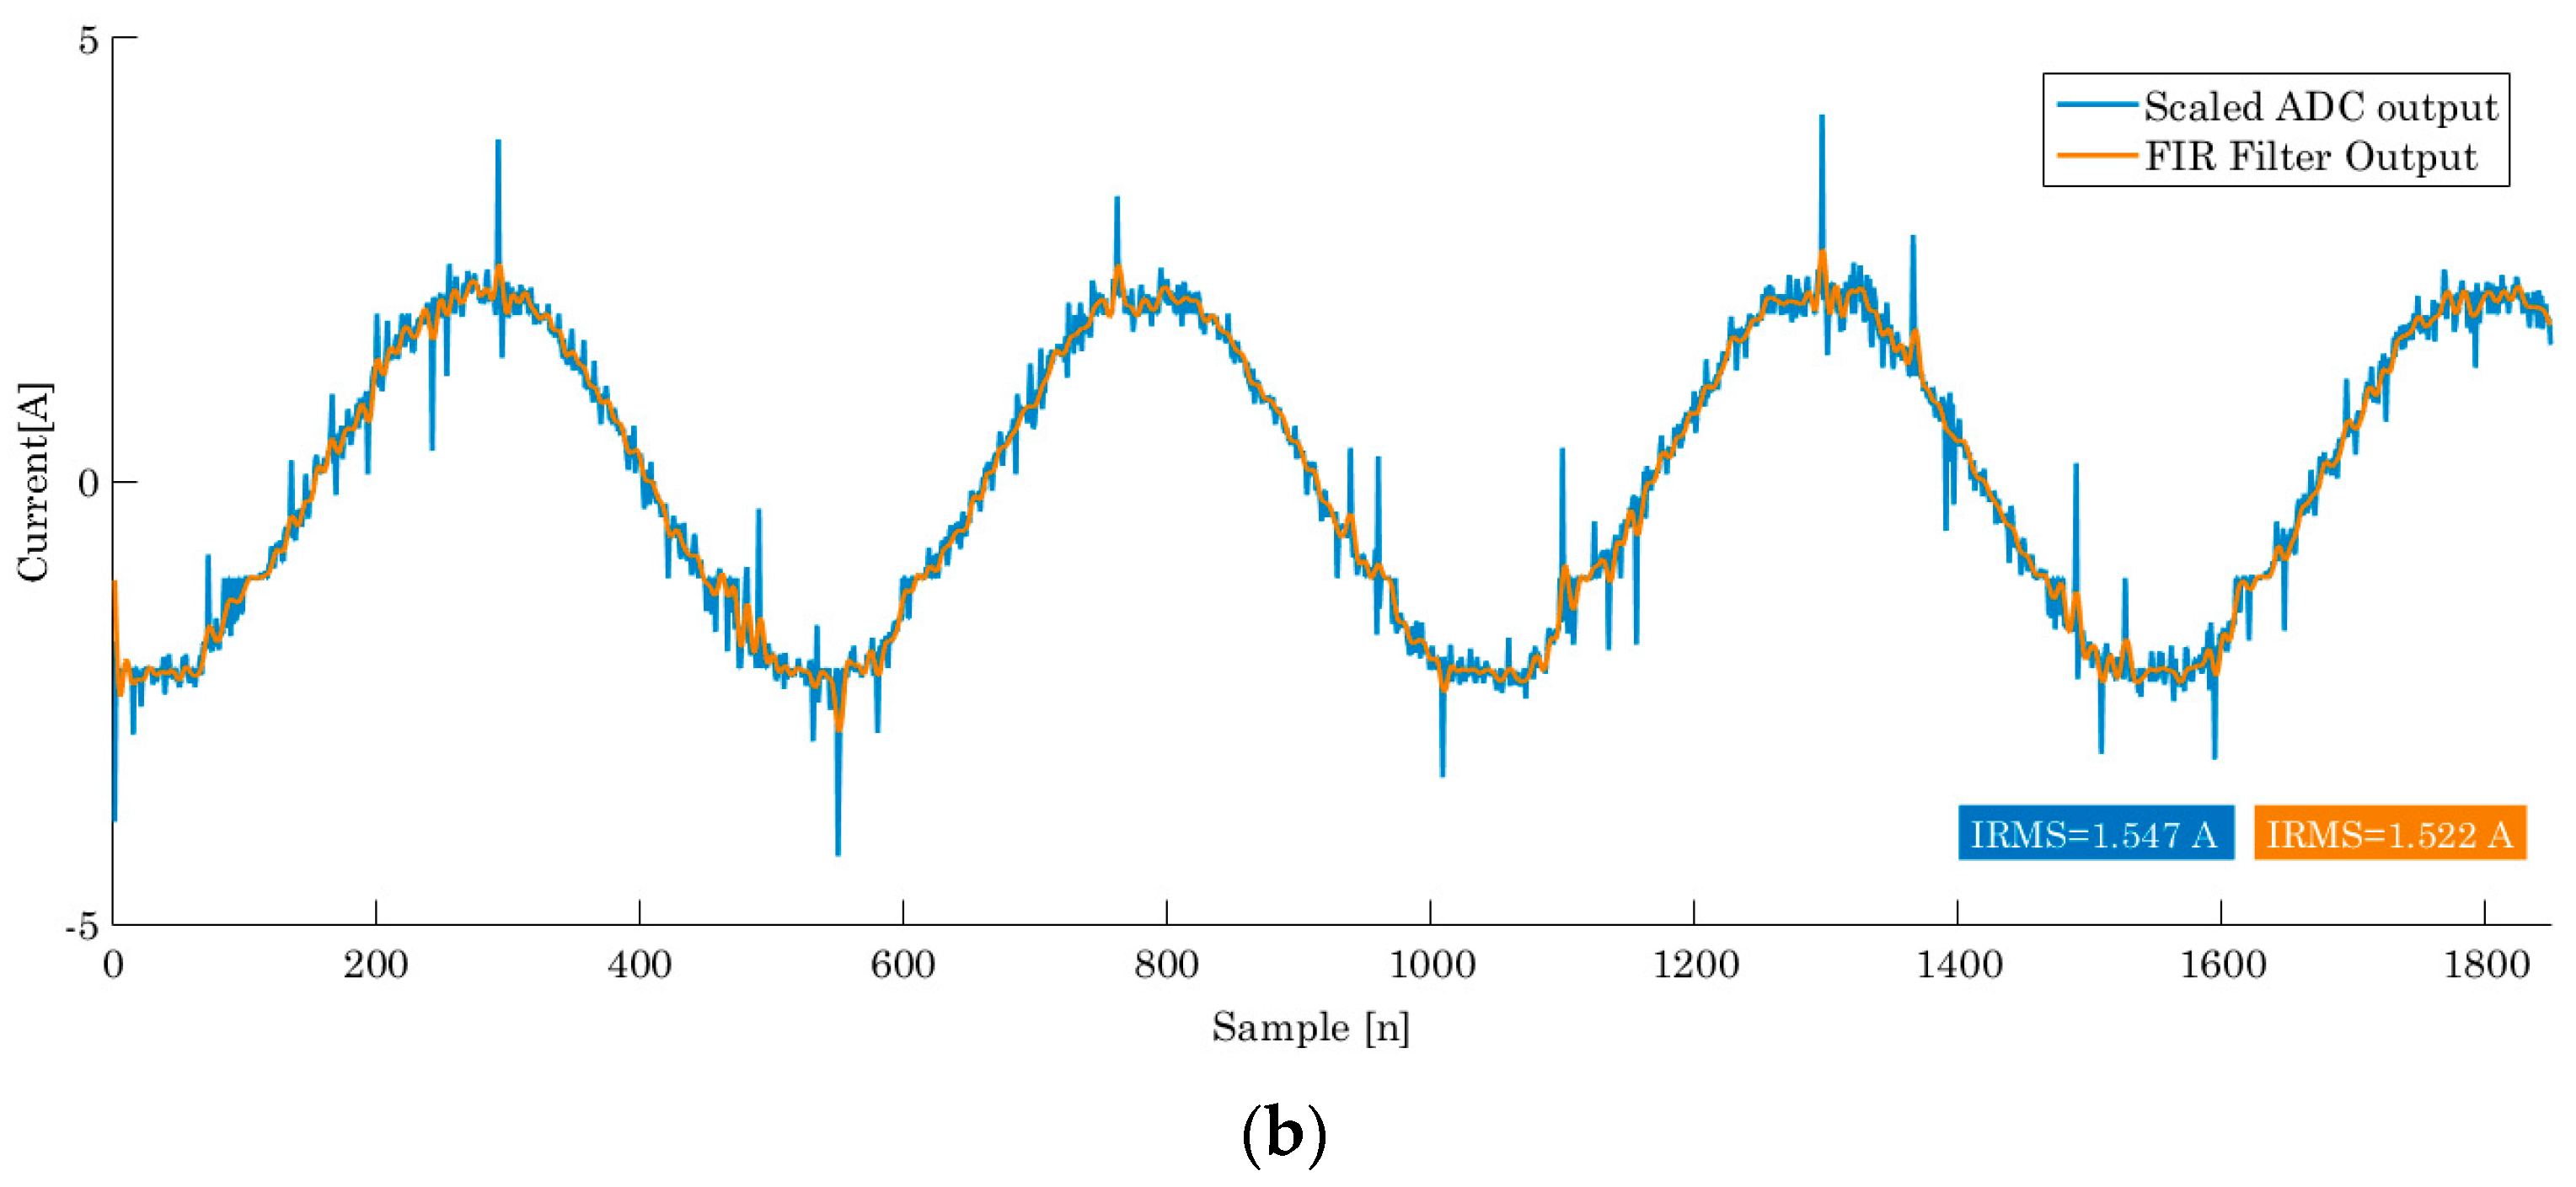
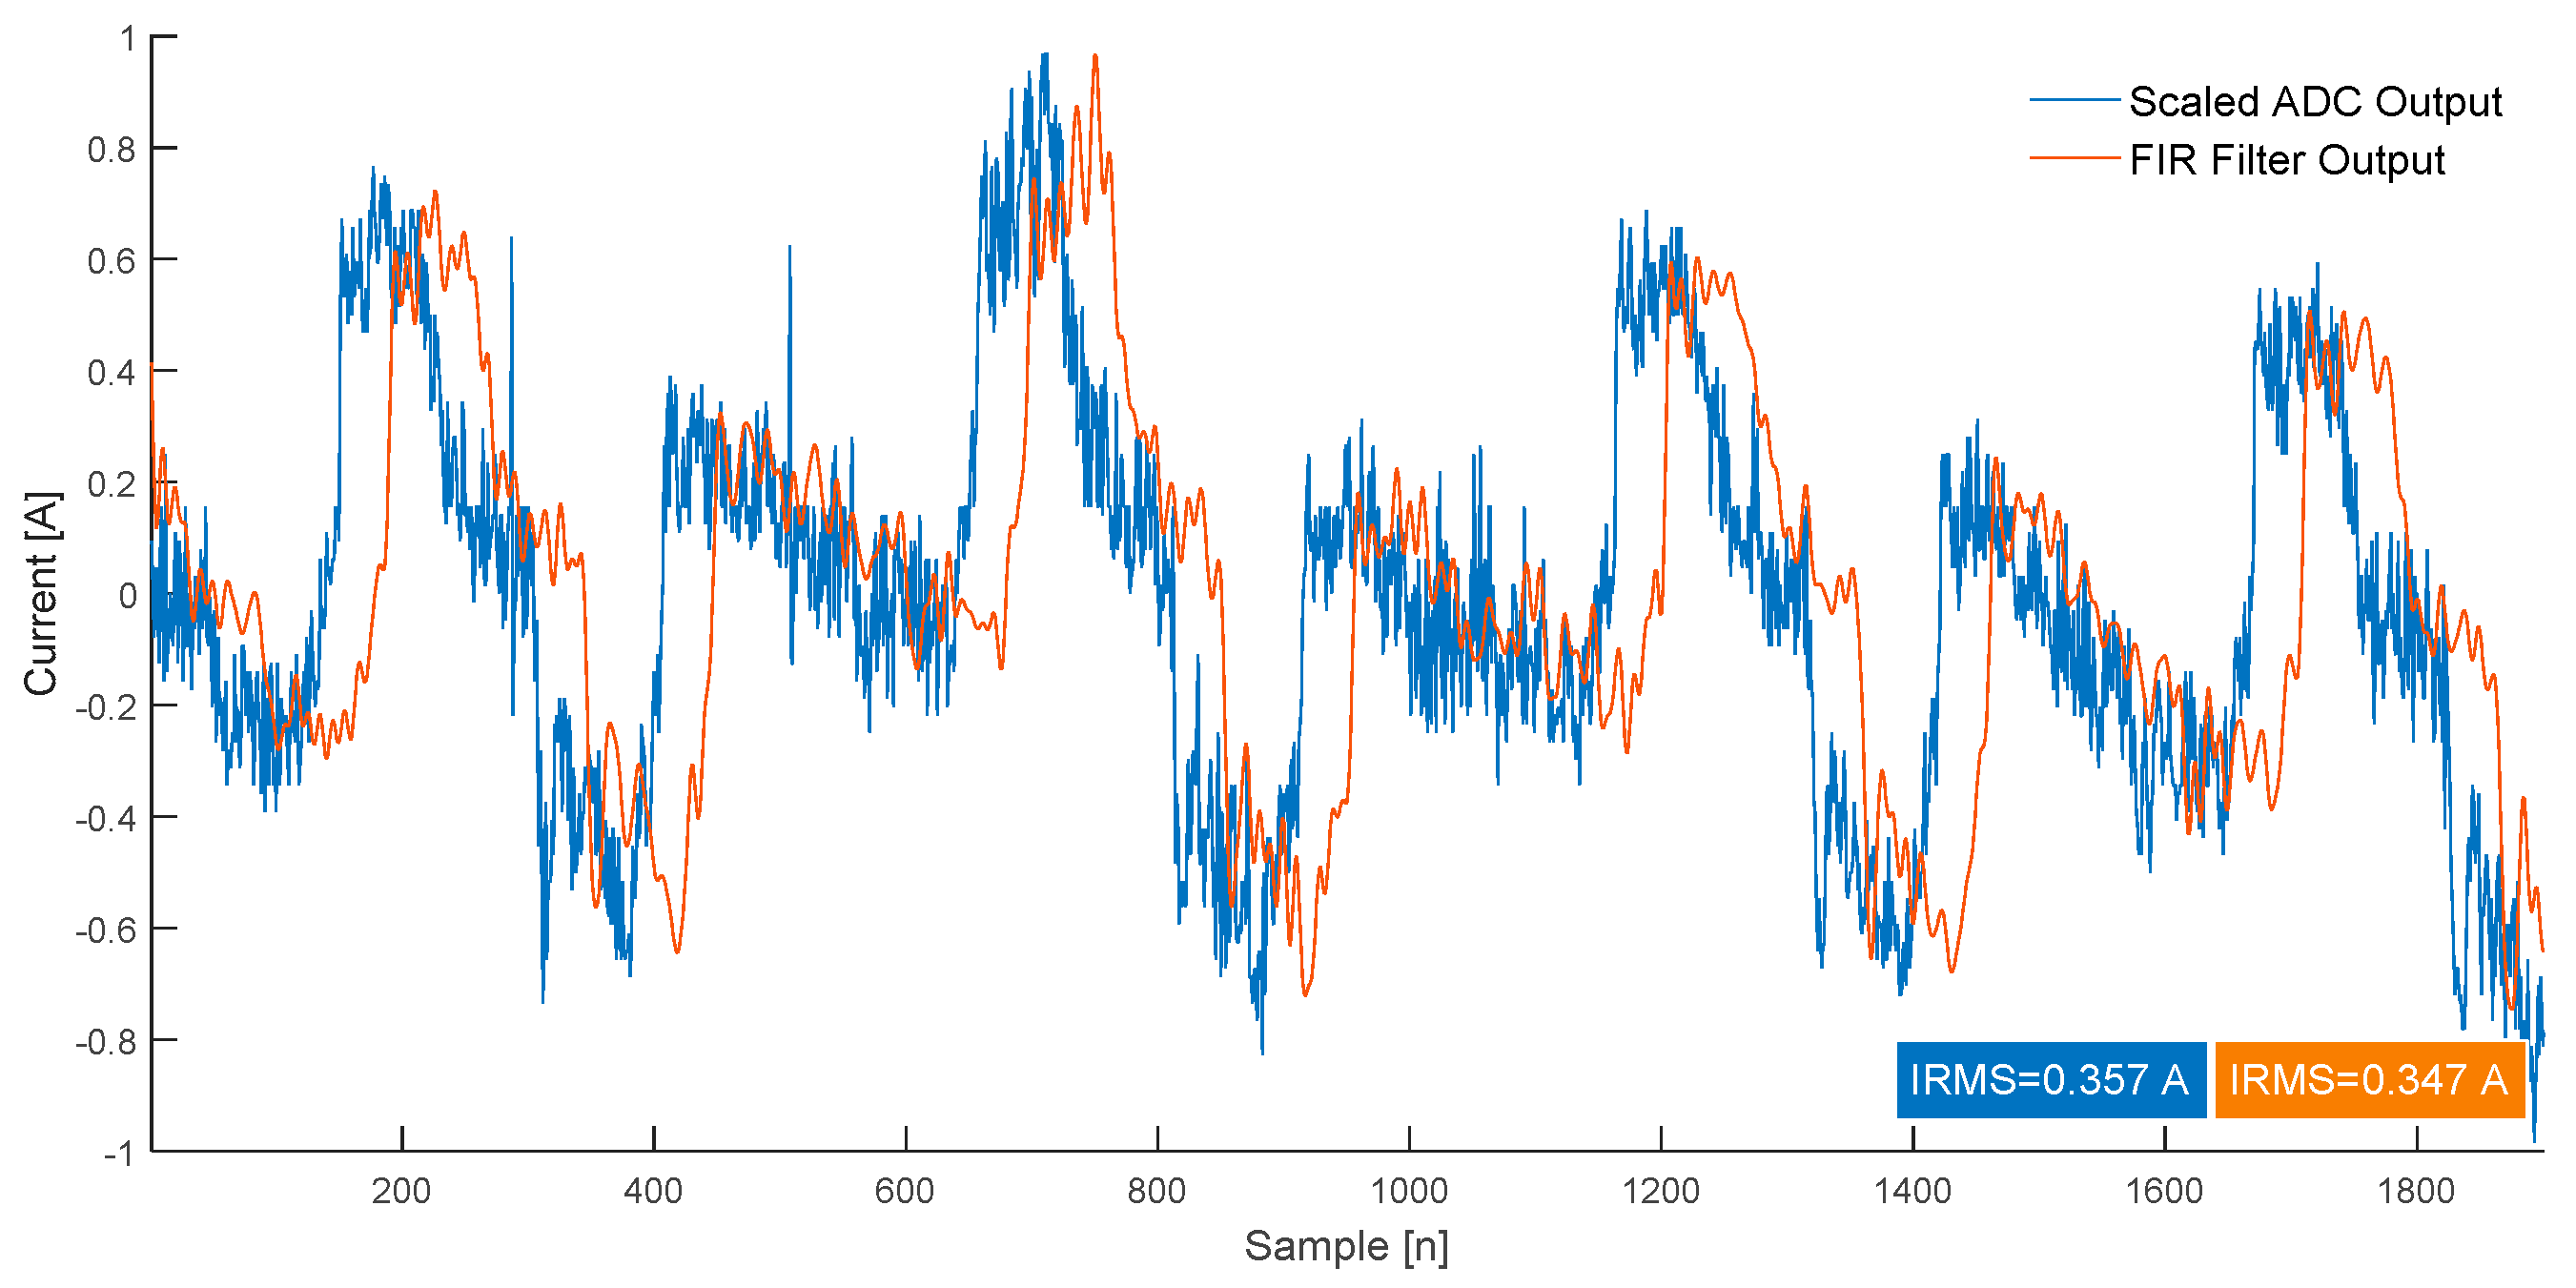
3.2.3. Post-Acquisition Digital Filter for DC Offset Removal

Voltage and current waveforms are digitized using the MSP432’s ADC unipolar single-ended inputs because the instrumentation chains translates the electrical magnitude signals into a positive scale of values. Consequently, the unsigned digitized signals from the voltage and current measurements must be converted into signed integer format in order to proceed to the characterization of the electrical quantities associated with the load energy transit. One common strategy is to fill a data buffer with a specific number of samples and then estimate the offset term by calculating the average of the samples. If the analog chain output provides a stable DC bias point, then it is simply assumed to be a constant offset term, meaning that each ADC sample is immediately subtracted to this fixed term. Both approaches have their pros and cons. A data buffer offers an effective way of removing DC content. However, its implementation demands considerable memory resources whose availability is scarce in low-end MCUs.
On the other hand, despite being the simplest option, the second choice has a limited applicability since the AFE DC offset output signal may vary in an unpredictable way, thus jeopardizing the result. Moreover, the noise generated inside the signal chain may also have an impact on DC bias point stability over time.
An alternative possibility requires a high pass digital filter for the job. The filter performs the offset removal in real time enabling immediate use of the electrical quantity calculation algorithms. Generally, an infinite impulse response (IIR) filter provides a lower design for same filtering techniques and it can be the best choice if sharp response low-pass magnitude output is required.
To maintain low signal processing resources requirements, a first order IIR filter is implemented with the following discrete transfer function:
H ( z ) = 0.996 0.996 z 1 1 0.996 z 1
Then, the difference equation for code execution is:
y [ n ] = 0.996 × y [ n 1 ] + 0.996 × x [ n ] 0.996 × x [ n 1 ]
The filter transient response was settled within 1% of its final value around 1000 samples. The input samples and coefficients are both 32-bit arithmetic fixed points and signed to suppress the effects of binary word length on filter’s outcome performance.

3.2.4. RMS

Mathematical definition for the RMS of an analog signal x(t) is:
V R M S _ a n a l o g = 1 T 0 T x 2 ( t ) d t
where T is the acquisition time window.
On the other hand, digital RMS calculation is as follows:
V R M S _ d i s c r t e = k = 1 M V k 2 M
where V k is the voltage sample at instant k and M is the time window.
Digital RMS estimation is described by two operations. One is to square the samples as they are acquired. The other involves the use of an averaging filter to extract the dc component of V k 2 with a low pass filter. The discrete transfer function is presented below:
H ( z ) = 2 p 1 ( 1 + 2 p ) Z 1
where p factor is used to determine the cut-off frequency of the IIR filter which is calculated as:
F c = 2 p 2 π f s
where f s is the sampling frequency.
Selecting a cut-off frequency of circa 1.9 Hz with a sampling rate of 25 ksps the Equation (12) output a p value of 11.

3.2.5. Active Power Measurement

The instantaneous current i[n] and voltage u[n] samples are multiplied which result in what is called the instantaneous power p[n]. Next, it goes through a low pass filter in order to extract the DC component which represents the average active power consumed by the load. A 10 Hz cut-off frequency single pole IIR filter is chosen.
Its discrete function is given by:
H ( z ) = 0.030 0.03 z 1 1 0.939 z 1
Then, the difference equation form is:
y [ n ] = 0.939 × y [ n 1 ] + 0.03 × x [ n ] 0.03 × x [ n 1 ]
Residual ripple at twice the power grid frequency is present in the filter’s digital output due to the instantaneous power signal. Further processing to calculate the energy consumed will remove it because the ripple is sinusoidal in nature.

3.2.6. Reactive Power Measurement

For steady power grid frequency and linear time-invariant loads, the voltage and current signals are pure tones. That is, there are no harmonics or mixing products, which means it is only necessary to shift one of the waveforms by 90 degrees in relation to the other waveform. Normally, grid voltage signal has low harmonic content but the current signal does not. Furthermore, the delay needs to be accurate to ensure good results. Reactive power instantaneous value for nth harmonic is described as:
Q n = 2 V m I m sin θ × sin ( θ φ + π 2 )
Then, the total reactive power is:
Q = 1 2   n = 1 N V n I n sin φ n
One way is to get the FFT of each signal and applying the results periodically to compute Q according to the Equation (16). This estimation technique is powerful and has the purpose to identify the signal frequency composition. The same cannot be said of the estimation of the amplitude of the components since the FFT method is prone to errors.
The Hilbert transform of a waveform is given by:
H [ x ( t ) ] = 1 π x ( s ) t s d t
The transformer operator allows each signal frequency component to be shifted at π/2 while the respective magnitude is preserved. In other words, when applied to a function, it introduces a phase delay of π/2 on positive frequency components and a phase advance of π/2 on negative frequency components. Its implementation is normally done through a linear filter. The transfer function is given by:
H ( e j w ) = { j , 0 < w < π j , π < w < 0
Since the ideal Hilbert transform shows an infinite impulse response, its applicability is not viable. Hence, to limit the impulse response length a practical Hilbert transform implementation must be approximated through a linear-phase FIR filter [35]. To that end, the FIR filter design needs to define a finite size window that corresponds to a filter of order N. The FIR filter specification based on the window approach means that the window weight coefficients discards the Hilbert coefficients that are outside the window. A window function that can be approximated as an ideal window can be achieved by combining a Kaiser window with hyperbolic-sine function. The Kaiser window is expressed by the equation:
w k ( n ) = { I o [ β 1 ( 2 n M ) 2 ] I o ( β ) , | n | M 2 0 , | n | > M 2
where β = w a M 2 and I o is the zerot-order modified Bessel function of the first kind.
Normally, the value of the parameter β is selected according to the desired filter characteristics. The window length is determined by N = 2M + 1 where M is the constant group delay. Typically, FIR filters are designed as casual filters. Therefore, the Hilbert FIR filter phase is equal to Hilbert phase response plus a linear phase term with a slope equal to M. For practical calculations the desired magnitude and phase characteristics of FIR Hilbert filter were obtained by setting the Kaiser window with a filter length N = 21 and β = 4.

3.2.7. Active Energy

The active power time series is integrated over the time in order to provide the energy consumption profile. The integral operation in the digital domain is carried out by using a first order IIR digital integrator based on Backward Euler method according to:
W h [ k ] = W h [ k 1 ] + U [ k ] × I [ k ] × Δ t 3600
where Δ t = 1 / f s is the sampling time and instant k is related to the current sample while instant k − 1 refers to the previous sampling instant.

3.2.8. Reactive Energy

The reactive energy is performed in analog domain as an infinite integral of the instantaneous shifted phase voltage delayed by 90° and phase current signal given by:
V A R h = 1 3600 0 u ( t 90 ° ) i ( t ) d t
Applying Backward Euler rule to approximate the integral term in discrete domain and using the Hilbert transformer, it follows that:
V A R h [ k ] = V A R h [ k 1 ] + u 90 [ k ] × i [ k ] × Δ t 3600
where Δ t = 1 / f s is the sampling time, U 90 [ k ] .

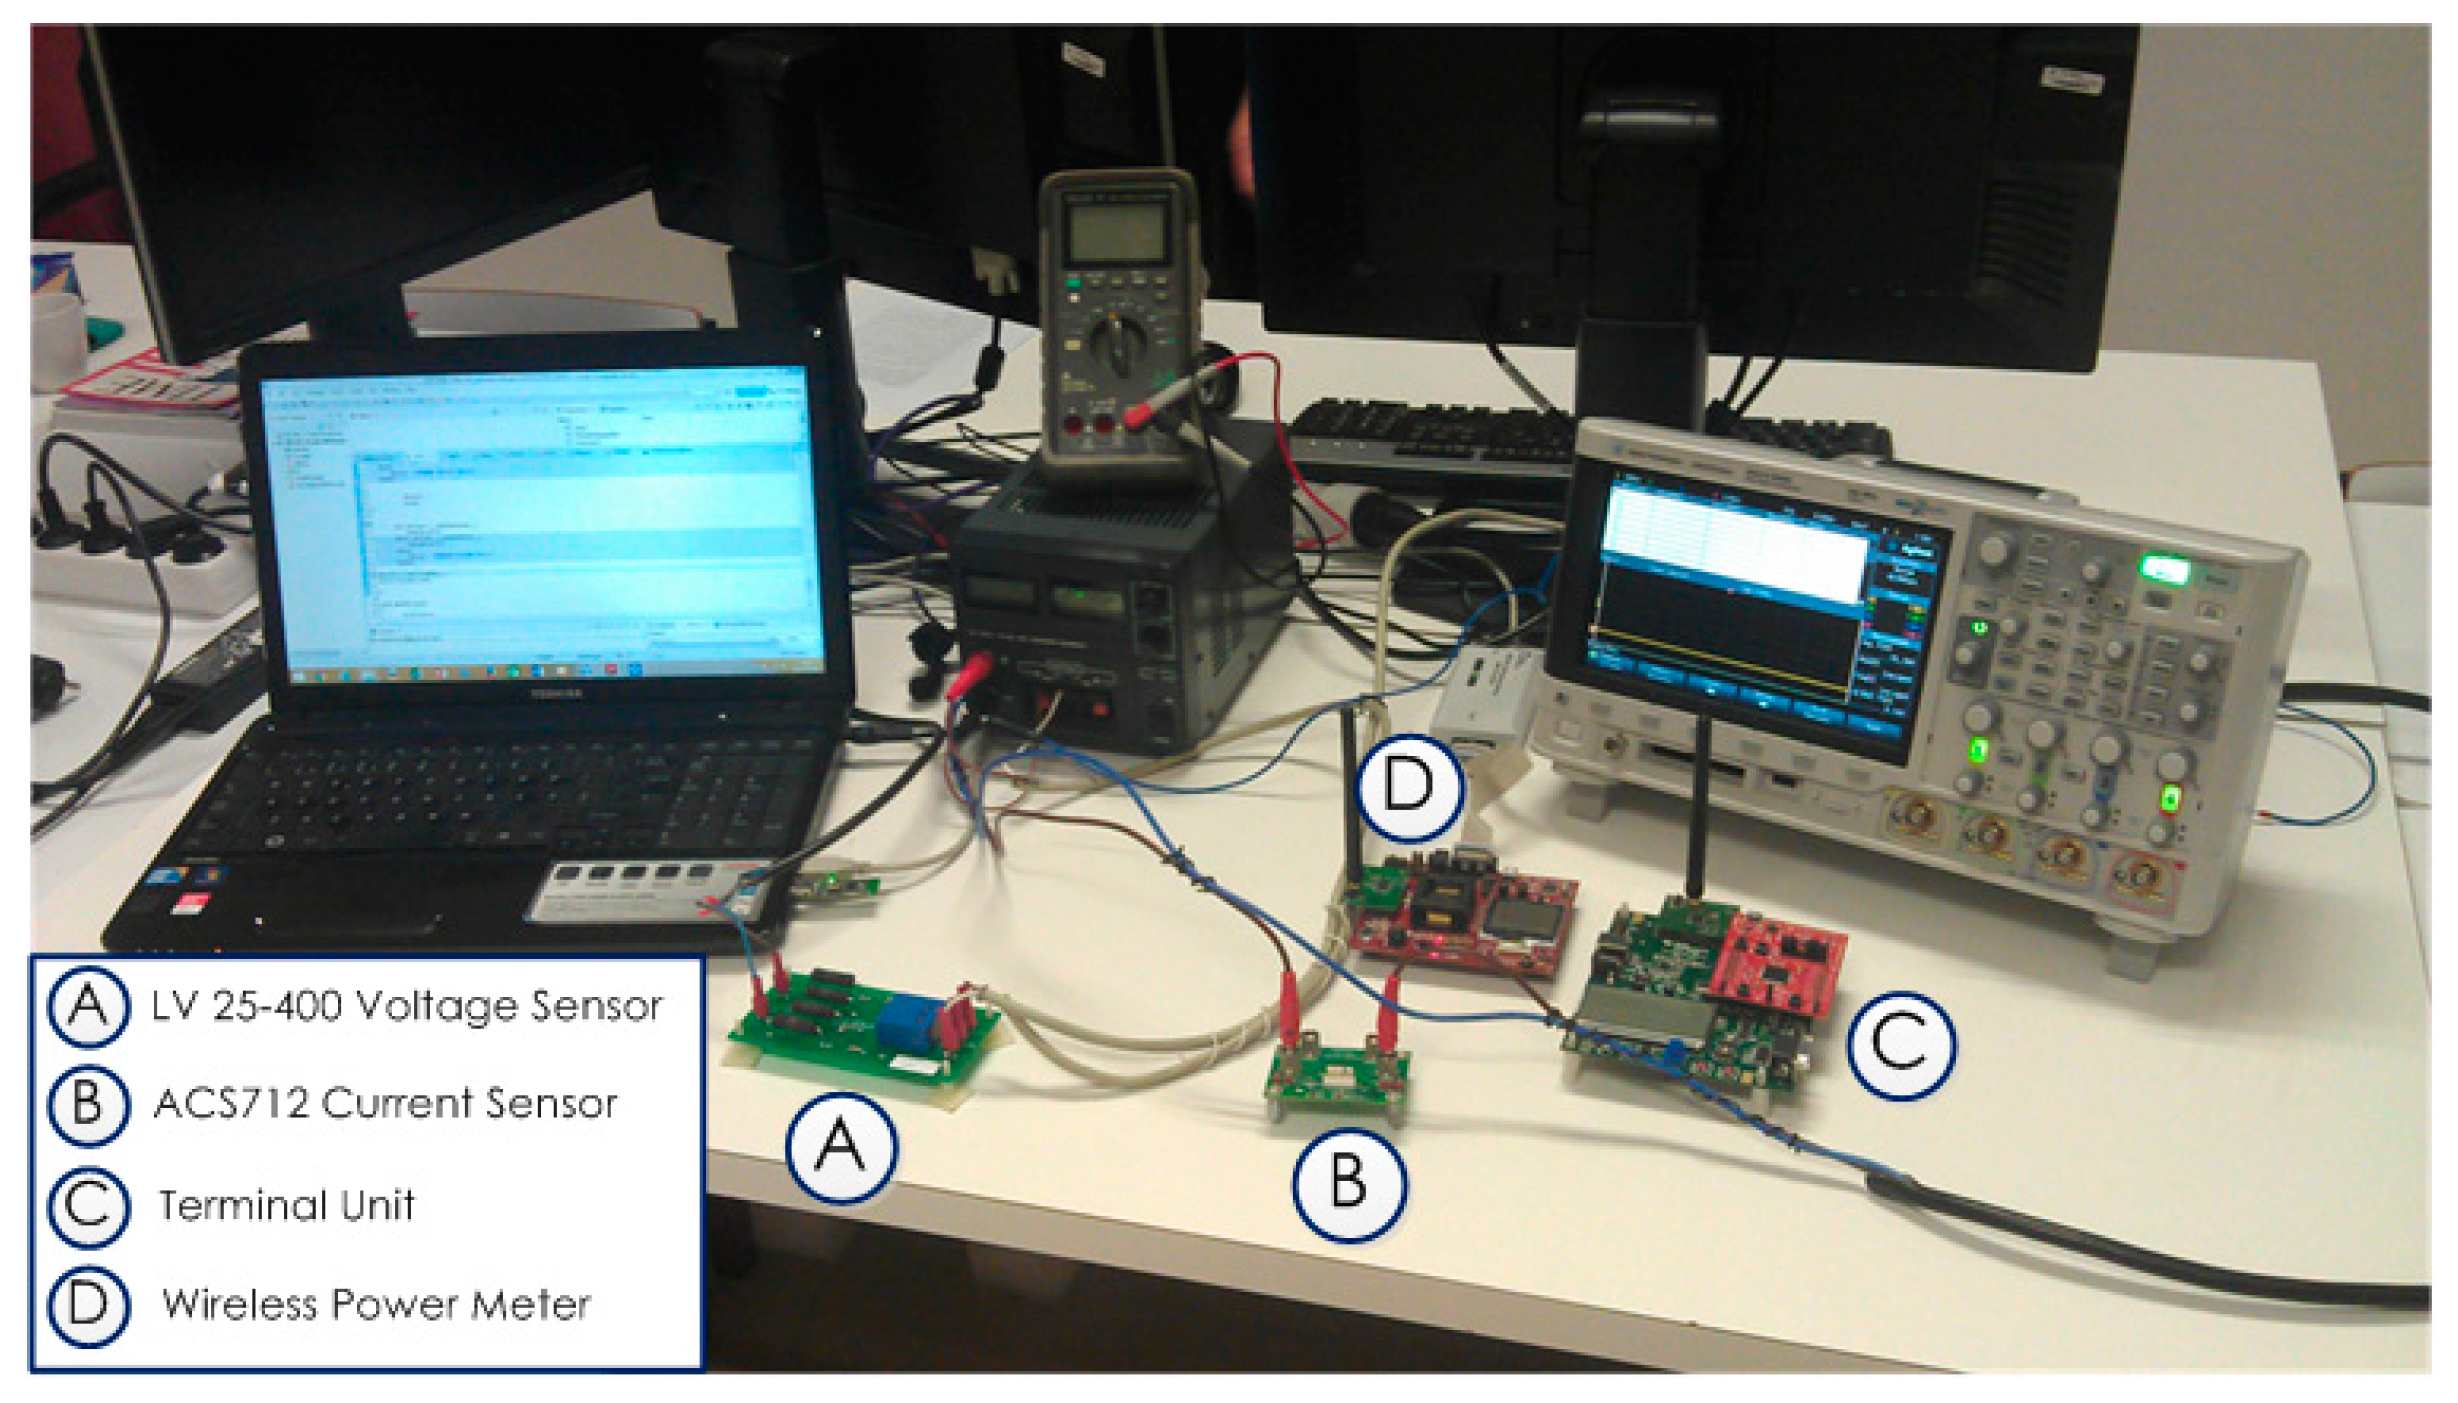
4. Experimental Results
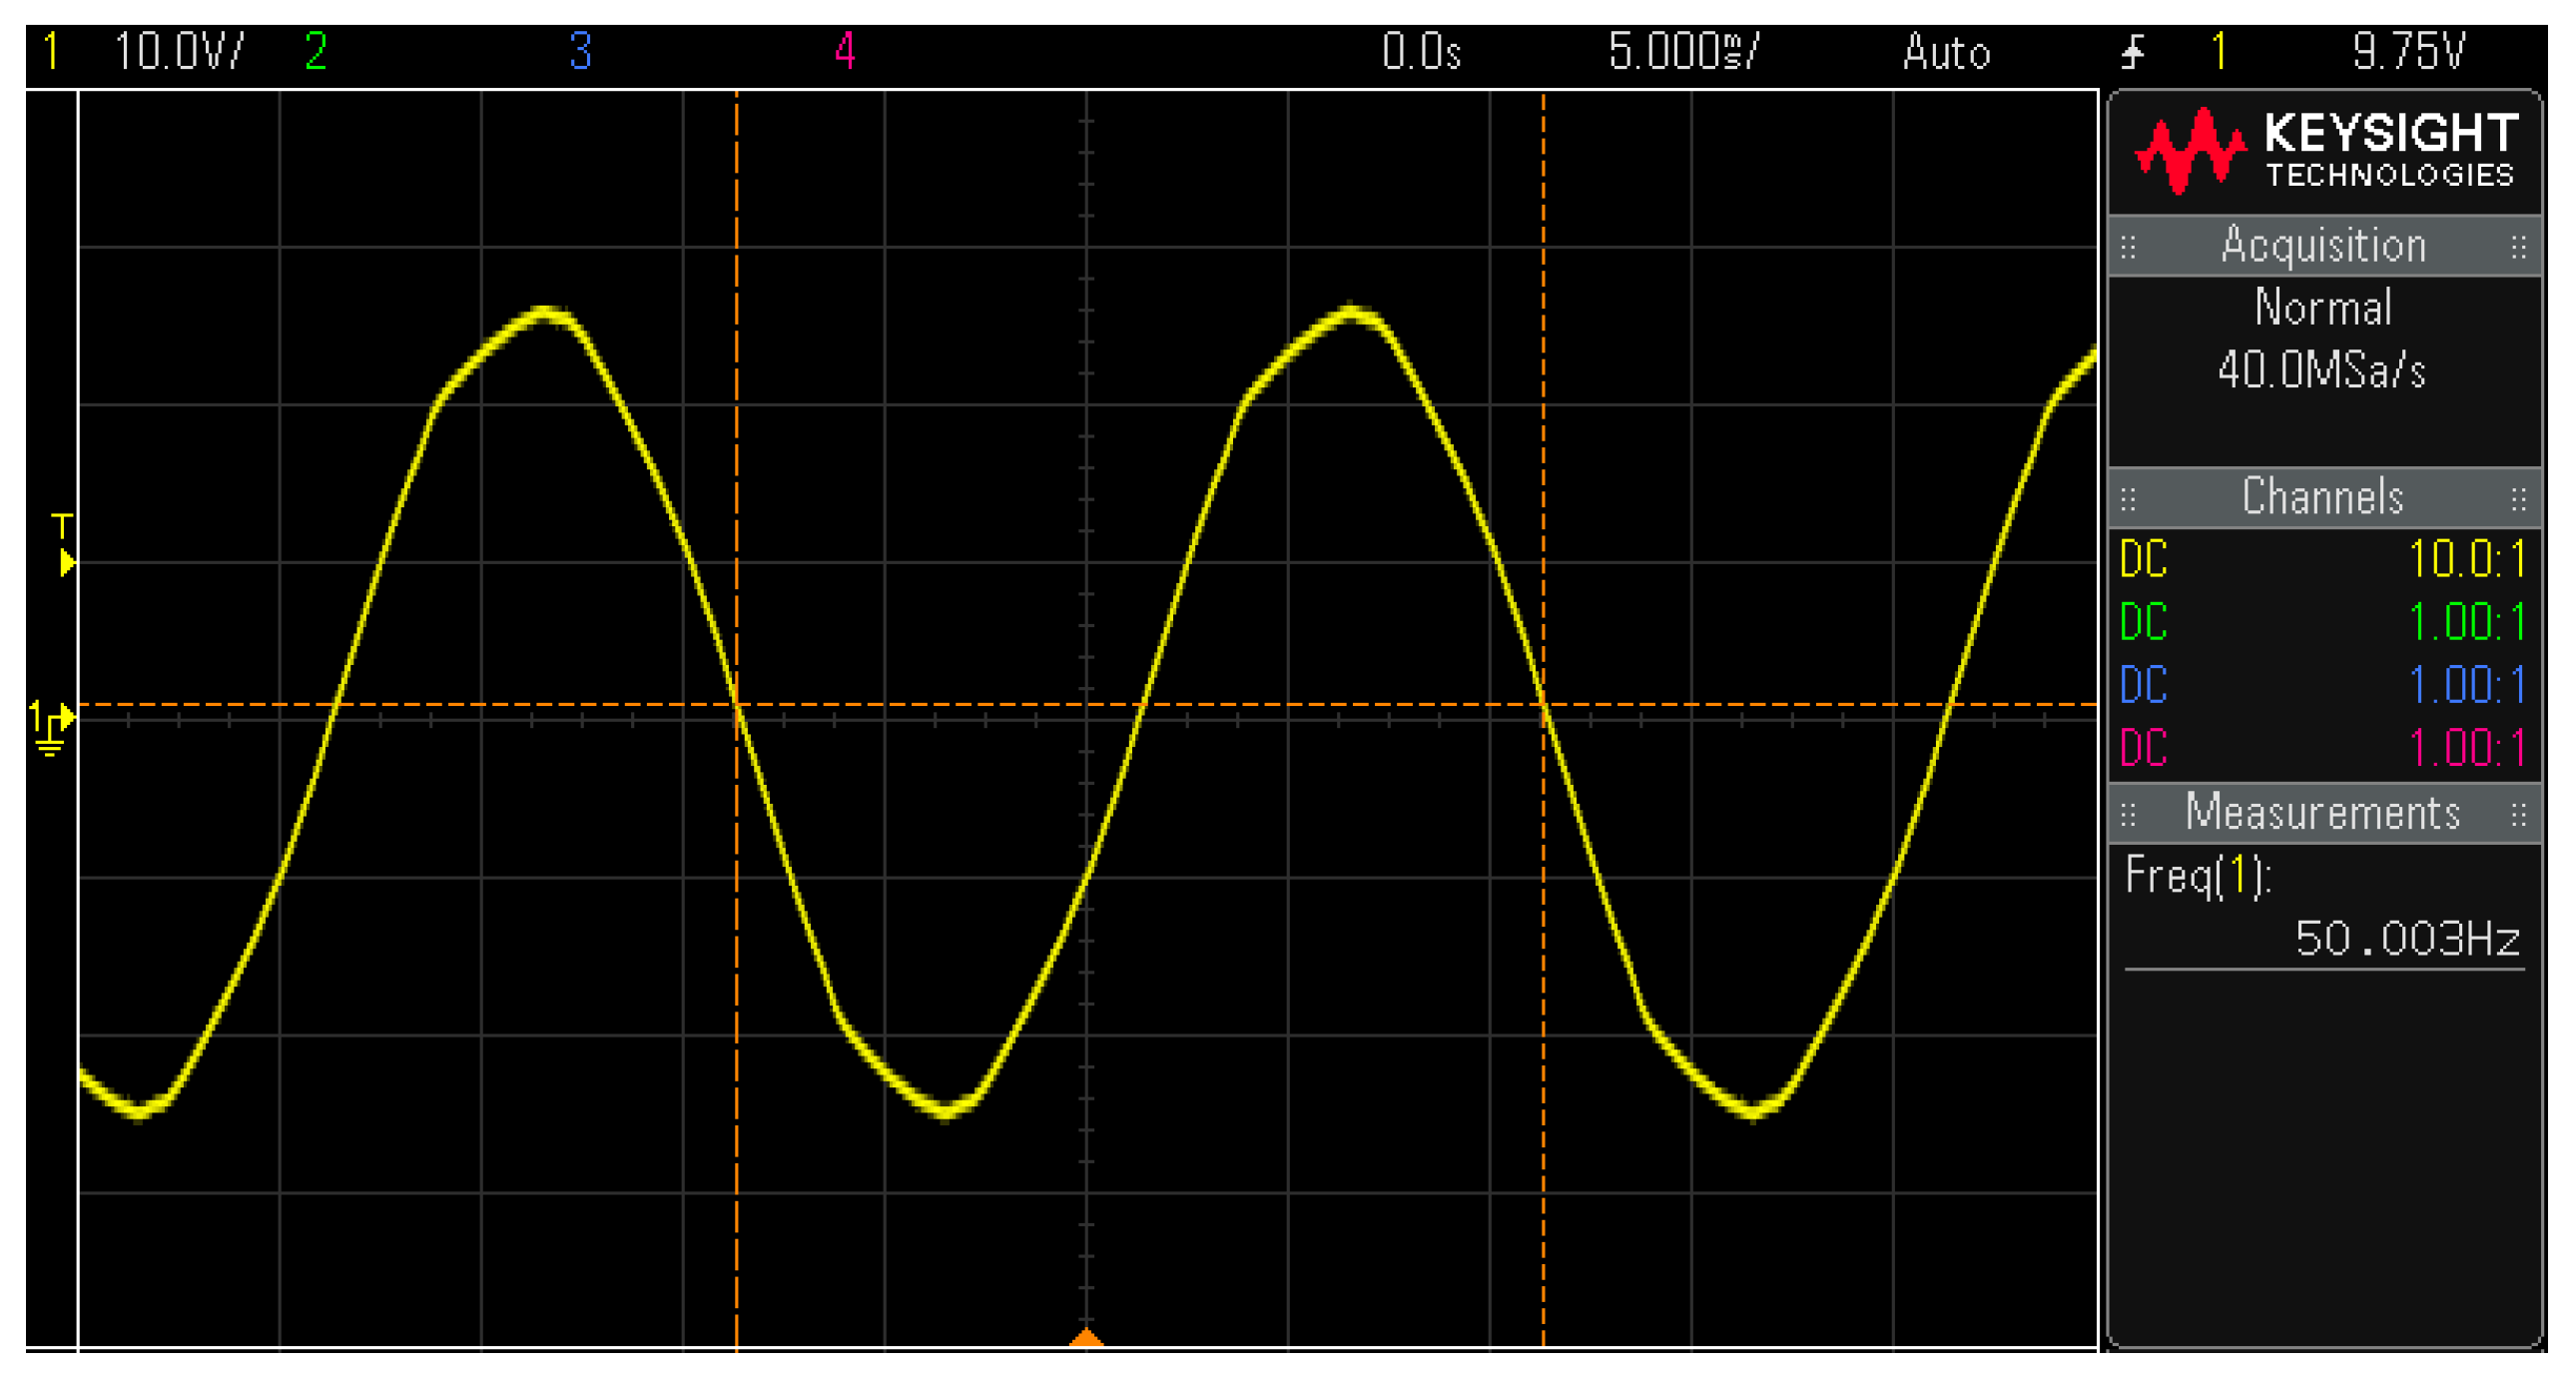
Tests were carried out to characterize the power meter capabilities. The testing procedures consist on evaluating the readings facing two type of loads in order to check the measurement performance, whether the load is linear or not-linear.
With regards to the linear load, an electric heater commonly found in households is chosen. For non-linear testing an AC-DC adaptor connected to a network computer is used. A general view of the experimental test bench is shown in Figure 6.

4.1. Linear Load

The electric heater has a rated power of 1200 W regulated as a function of the three power setting levels available. When the maximum power is not required the user can select either the 400 W or 800 W mode. The tests focused on comparing the current waveform acquired by the power meter developed with the wave trace observed on an oscilloscope. For current measurement, digital sample set acquisitions and post processing are synchronized with the bench instruments.
The idea is to get comparable electric quantity calculations on the same time windows using an accurate current meter. For that purpose, a 34461A 6.5 digit precision multimeter (Keysight, Santa Rosa, CA, USA) was employed to determine current RMS values at minimum, medium and full power. These measures made it possible to assess the prototype RMS estimation capabilities. In addition, several oscilloscope graphs were taken concerning the voltage and current readings.
Figure 7 shows the main voltage waveform. The sensor is powered by the MCU board, meaning that the energy consumption is negligible. Hence, there is no impact in the acquired waveform. The distortion apparently seen on the waveform is not caused by the load, yet it is visible. In fact, the mains grid into which the electric heater is plugged has a non-zero output impedance, depending on the equipment connected to the power grid, such as light ballasts, motors and so on.
In Figure 8, Figure 9 and Figure 10, current waveforms in respect of the three levels of power consumption are illustrated at different levels of signal processing chain. In the first part of each figure the impact of analog filtering can be observed. The second part of the figure is related to the readings in digital format after being acquired by the ADC. In Figure 8a the measured current (green trace) looks noisy. In fact, more than 20 mV was measured as peak-to-peak noise. This level of noise limits the sensor’s sensitivity. That is, for a sensitivity ratio of 100 mV/1 A, lower readings than 20 mA are virtually impossible to track and distinguish. The anti-aliasing filter (blue trace) proves to be effective by cutting most of wideband noise outside the filter bandwidth that comes from the output sensor.
As the electric heater is switched from the lowest to the highest power settings, the pre-filtered noise content has less influence on measurement resolution. In sum, when acquiring low amplitude currents the anti-aliasing filter has the important function of improving the signal-to-noise ratio of the readings. In turn, the sampled current data have considerable spikes on the samples (Figure 8b,c and Figure 10c, blue trace).
The severity of the spikes is more significant for electrical quantity calculations such as RMS measurement. In these figures the RMS estimations are illustrated and compared when the discrete data is passed through a digital filter of 80 tap. The band cut-off frequency (2100 Hz) chosen is slightly higher than the anti-alias filter bandwidth.

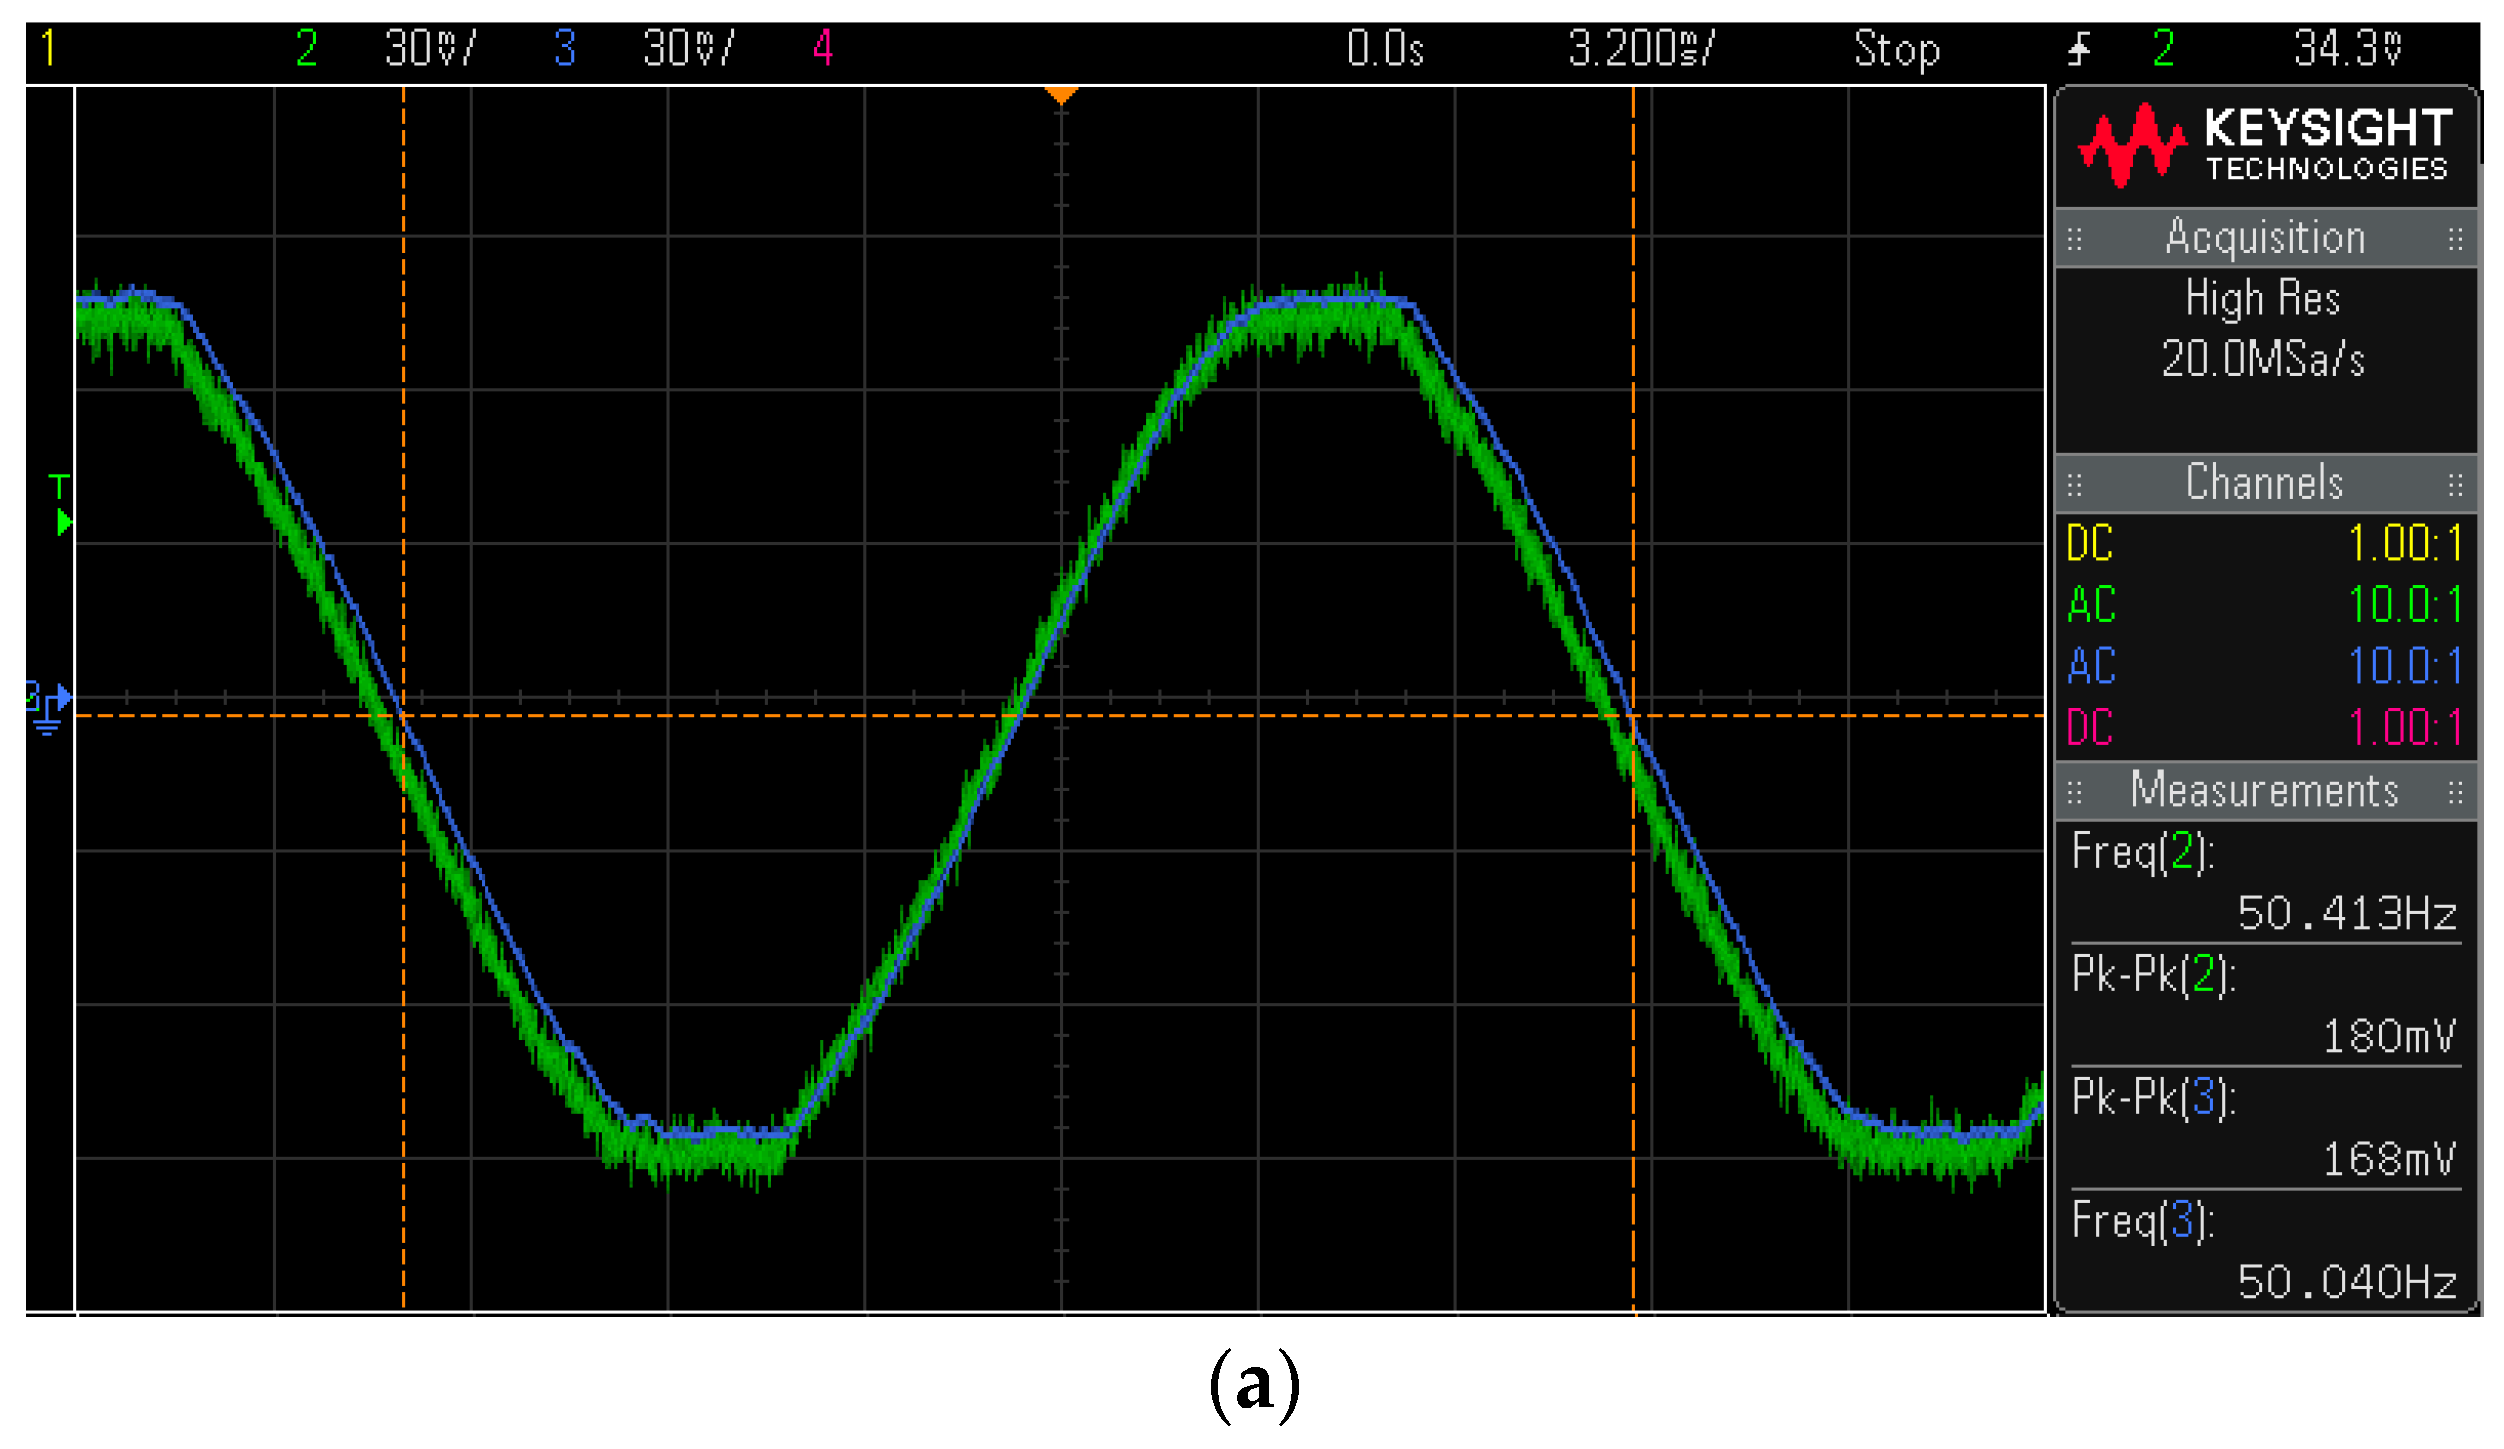
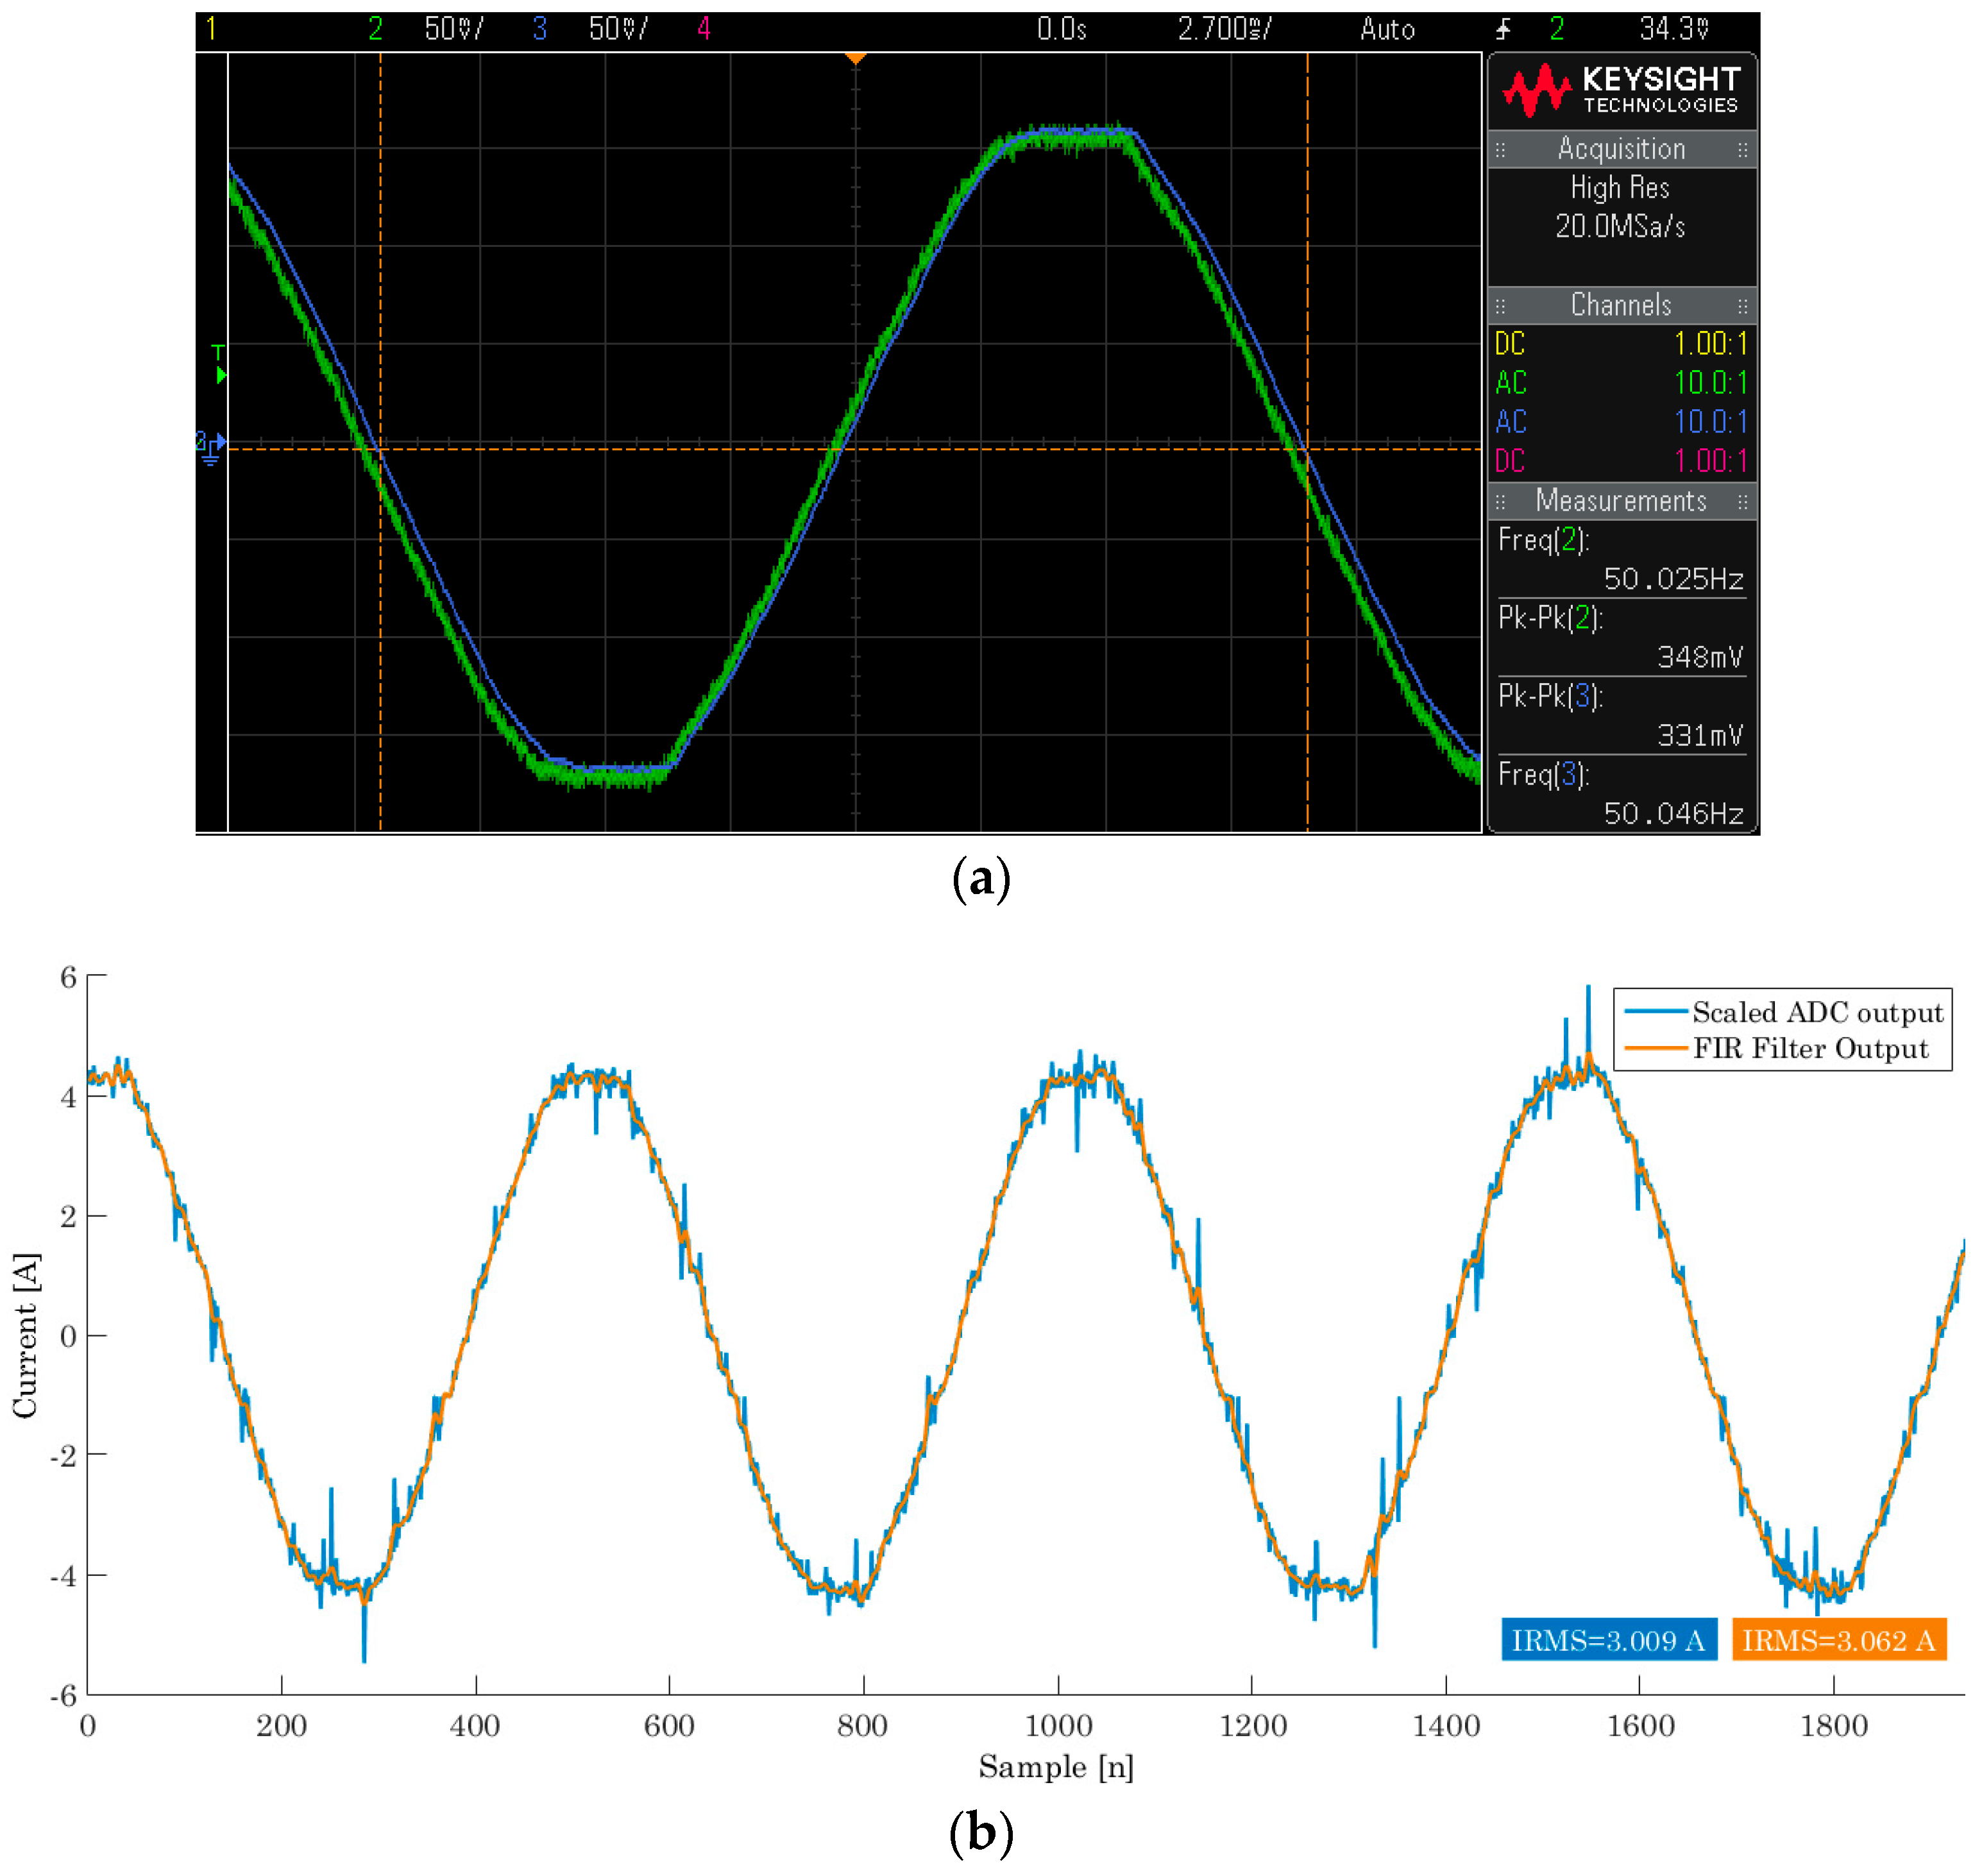
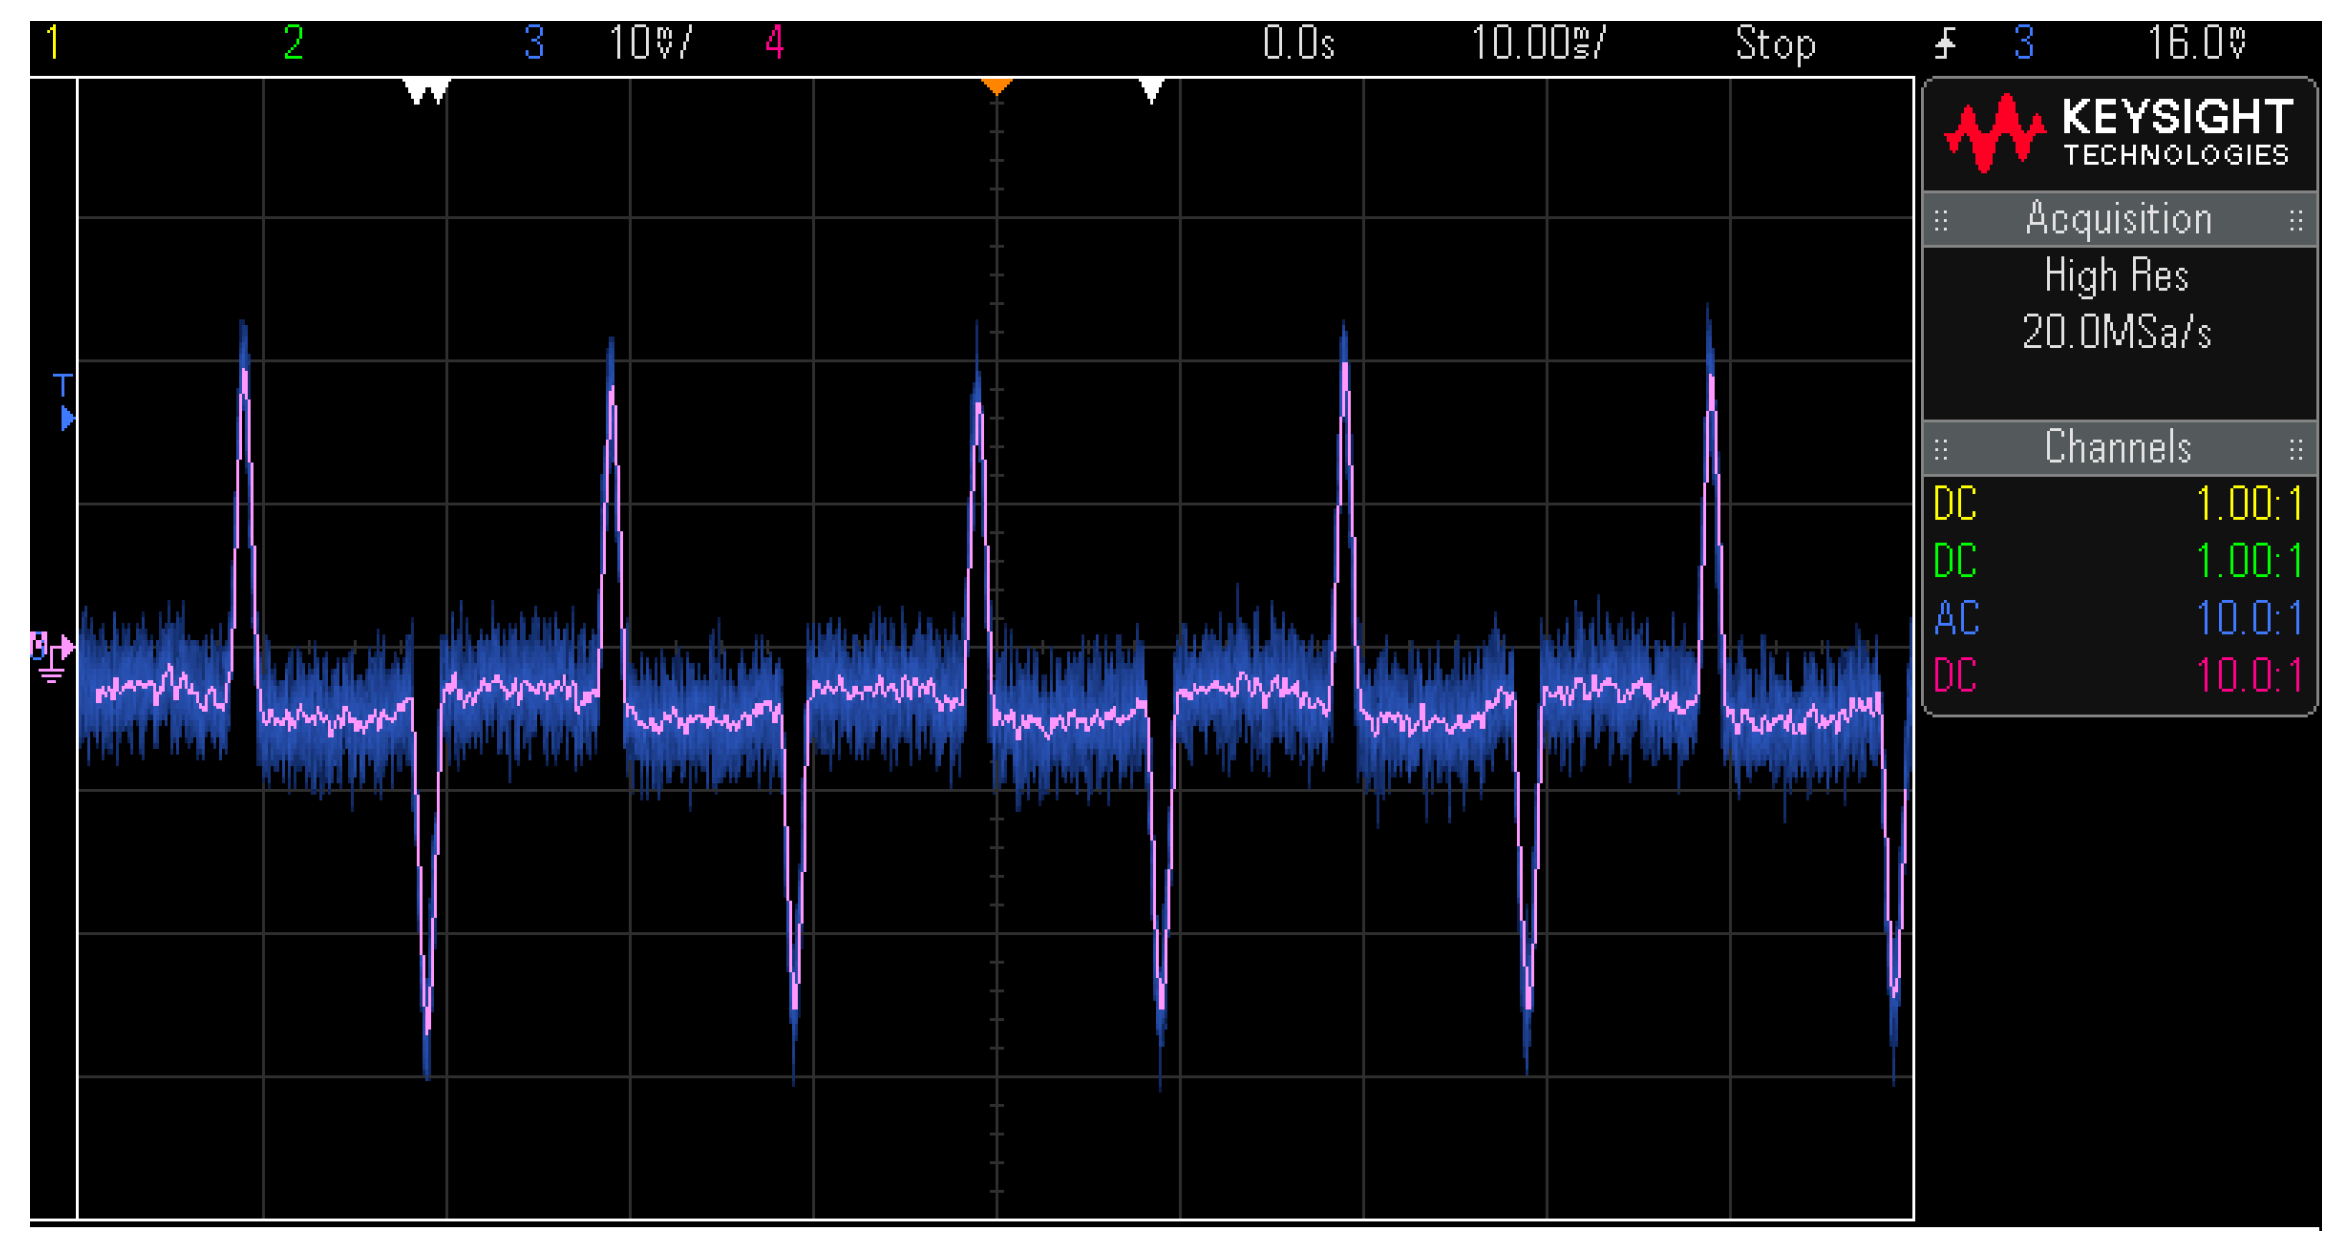
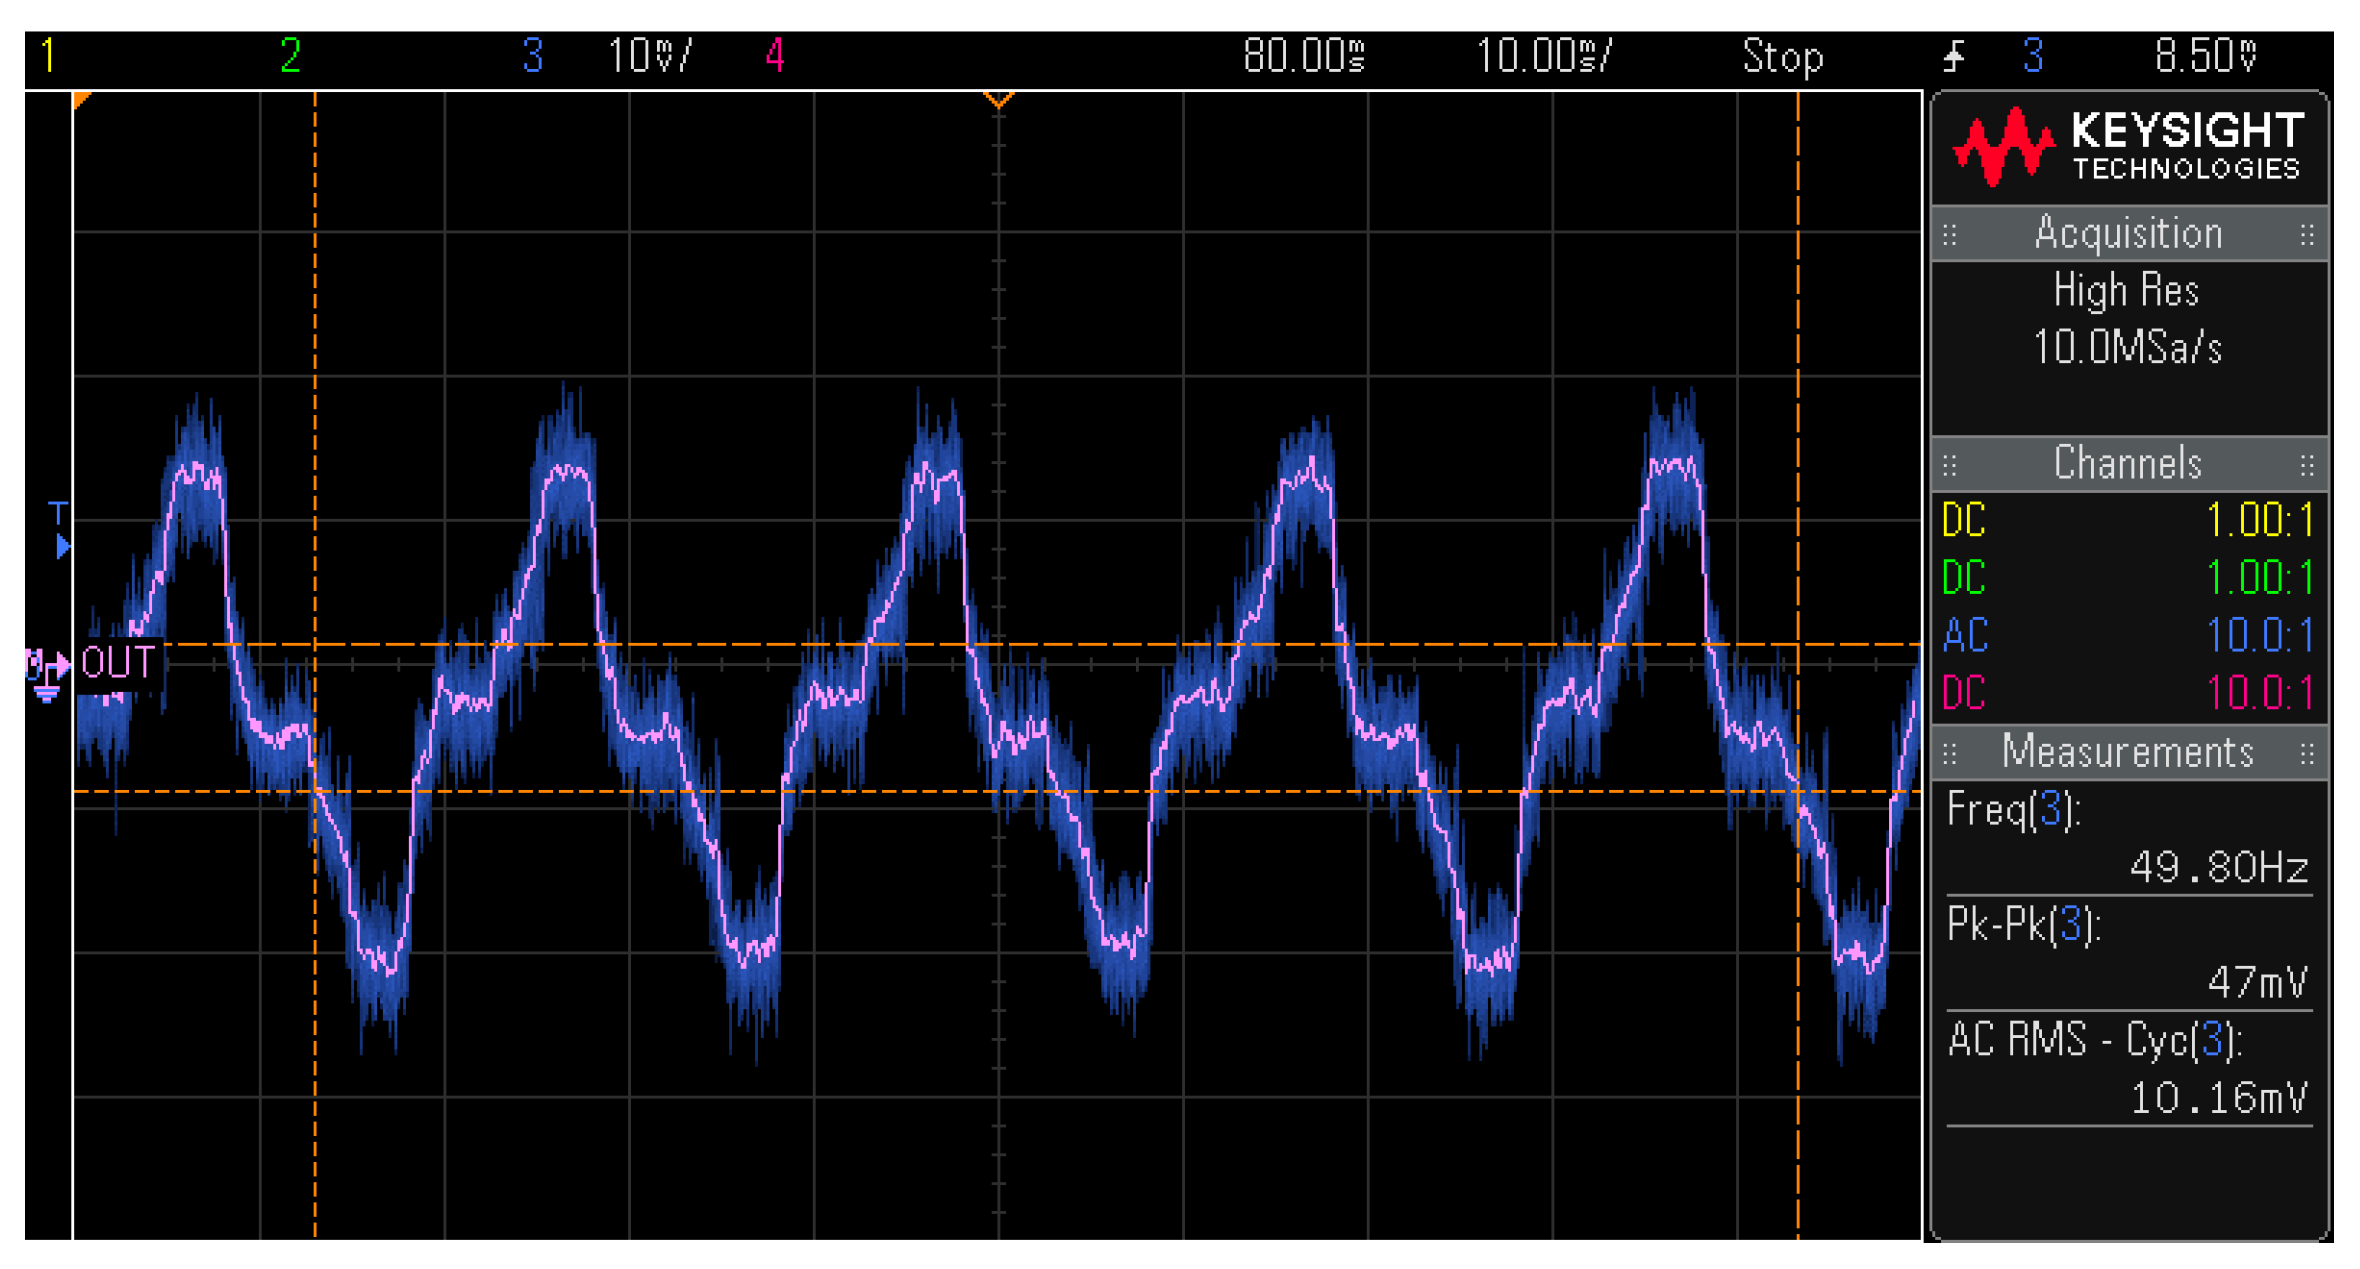
4.2. Non-Linear Load

The DC power for a laptop is commonly derived from a single-phase full-wave diode bridge rectifier connected to the AC line, followed by a DC-to-DC power conversion stage called the switch-mode power supply. This AC-DC converter technology has gained wide acceptance, providing a smooth DC output with small and lightweight components. In addition, power supplies of this type tolerate large variations on input voltage.
Figure 11 and Figure 12 illustrate the current waveform readings before and after analog filtering. In Figure 11 the laptop is not running any specific program application. It can be seen that the input current comes in very short pulses as the capacitor is charged on a tiny half-cycle fraction. When executing a windows based application like a video file player, the current waveform is less sharp, as can be verified in Figure 12. In sum, in light load conditions the input current tends to be more distorted, revealing a higher current peak. Moreover, the AFE circuit extracts significant noise superimposed on the current signal.
For such low load current measurements, the AFE has a dramatic effect, since we are talking about an AC–DC adaptor maximum input current of 1.5 A, which corresponds to 7.5% of the dynamic range specified on the power meter.
Next, a second AC-DC connected to another laptop was analyzed, revealing a different input current pattern (Figure 13). For this case, the peak current measured falls below 1 A, exposing the level of noise aggregated to the sampled current at 25 ksps. Even after being processed by the FIR filter, the level of noise remains considerably high. Increasing the complexity of the digital filtering may not be a good choice because the MCU will spend more time on performing digital filtering. Therefore, a simple moving average filter can solve most of the noise issues at this measurement level.

5. Conclusions

In this paper the development of a power measurement unit for use in the domestic context as part of a home energy system was proposed. The utilization of Hilbert transforms was explored in this paper, as a new contribution to earlier studies, since it is not that commonly applied in metering systems in the residential sector. It is well known that Hilbert transforms are designed and implemented through a FIR filter. This signifies that implementation is quite heavy in terms of MCU execution time. Therefore, it is perfectly affordable for a current MCU system to run this algorithm in order to measure the reactive measurement component. While this power element is not directly billed to the final client, it does have an impact on the bill since it contributes to the growth of the contracted apparent power. Power-related readings are acquired and processed in real time and sent to a remote terminal unit that runs as a data logger and provides human–machine interface functionality. The communication is established through an RF link based on the ZigBee protocol. The system proposed has some advanced measurement capabilities. It can track the energy profile of conventional loads as well as non-linear loads such as those found on electronics- operated appliances. The power meter’s high bandwidth acquisition allows reactive power and energy reactive readings with high harmonic distortion. In this sense, the voltage and current channels are prepared to measure electrical quantities with harmonic content up to 1 kHz. As a tool for monitoring energy consumption, the present performance can give a useful insight to the home user.

Acknowledgments

This work was supported by FEDER funds through COMPETE 2020 and by Portuguese funds through FCT, under Projects SAICT-PAC/0004/2015—POCI-01-0145-FEDER-016434, POCI-01-0145-FEDER-006961, UID/EEA/50014/2013, UID/CEC/50021/2013, and UID/EMS/00151/2013. Also, the research leading to these results has received funding from the EU Seventh Framework Programme FP7/2007–2013 under grant agreement No. 309048. Moreover, the authors would like to acknowledge Tiago Mendes for his participation in the development of the prototype.

Author Contributions

Eduardo M. G. Rodrigues developed the overall concept, performed the modeling study and experimental results, Radu Godina performed the literature review and handled the writing and editing of the manuscript, Miadreza Shafie-khah and João P. S. Catalão supervised, revised and corrected the manuscript, coordinating also all the research work of C-MAST/UBI within the scope of the ESGRIDS (PAC Energy) Project SAICT-PAC/0004/2015—POCI-01-0145-FEDER-016434.

Conflicts of Interest

The authors declare no conflict of interest.

References

  1. Liu, Q.; Cooper, G.; Linge, N.; Takruri, H.; Sowden, R. DEHEMS: Creating a digital environment for large-scale energy management at homes. IEEE Trans. Consum. Electron. 2013, 59, 62–69. [Google Scholar] [CrossRef]
  2. Park, S.; Kim, H.; Moon, H.; Heo, J.; Yoon, S. Concurrent simulation platform for energy-aware smart metering systems. IEEE Trans. Consum. Electron. 2010, 56, 1918–1926. [Google Scholar] [CrossRef]
  3. Bozchalui, M.C.; Hashmi, S.A.; Hassen, H.; Canizares, C.A.K. Bhattacharya Optimal Operation of Residential Energy Hubs in Smart Grids. IEEE Trans. Smart Grid 2012, 3, 1755–1766. [Google Scholar] [CrossRef]
  4. Han, J.; Choi, C.; Park, W.; Lee, I.; Kim, S. Smart home energy management system including renewable energy based on ZigBee and PLC. IEEE Trans. Consum. Electron. 2014, 60, 198–202. [Google Scholar] [CrossRef]
  5. Broin, E.Ó.; Nässén, J.; Johnsson, F. The influence of price and non-price effects on demand for heating in the EU residential sector. Energy 2015, 81, 146–158. [Google Scholar] [CrossRef]
  6. Koutitas, G. Control of Flexible Smart Devices in the Smart Grid. IEEE Trans. Smart Grid 2012, 3, 1333–1343. [Google Scholar] [CrossRef]
  7. Logenthiran, T.; Srinivasan, D.; Shun, T.Z. Demand Side Management in Smart Grid Using Heuristic Optimization. IEEE Trans. Smart Grid 2012, 3, 1244–1252. [Google Scholar] [CrossRef]
  8. Oliveira, D.; Rodrigues, E.M.G.; Mendes, T.D.P.; Catalão, J.P.S.; Pouresmaeil, E. Model predictive control technique for energy optimization in residential appliances. In Proceedings of the IEEE International Conference on Smart Energy Grid Engineering (SEGE’15), Oshawa, ON, Canada, 17–19 August 2015.
  9. Symonds, A. Electrical Power Equipment and Measurements: With Heavy Current Electrical Applications; McGraw-Hill Book Company: New York, NY, USA, 1980. [Google Scholar]
  10. Munday, M.; Hart, D.G. Methods for electric power measurements. In Proceedings of the IEEE Power Engineering Society Summer Meeting, Chicago, IL, USA, 21–25 July 2002.
  11. British Standard BS EN 50160:2007, Voltage Characteristics of Electricity Supplied by Public Distribution Networks; British Standards Institution: London, UK, 2007.
  12. IEC 61000, IEC 61000 Standard on Electromagnetic Compatibility (EMC); International Electrotechnical Commission (IEC): Geneva, Switzerland, 2002.
  13. Jeon, Y.-H. Performance Evaluation of Zigbee Sensor Network for Smart Grid AMI. In Multimedia and Ubiquitous Engineering (MUE 2013); Springer: Dordrecht, The Netherlands, 2013; Volume 240, pp. 505–510. [Google Scholar]
  14. Regassa, B.; Medina, A.V.; Gómez, I.M.; Rivera, O.; Gómez, J.A. Upgrading of Traditional Electric Meter into Wireless Electric Meter Using ZigBee Technology. Lect. Notes Inst. Comput. Sci. Soc. Inform. Telecommun. Eng. 2012, 82, 84–94. [Google Scholar]
  15. Mu, J. A minimum physical distance delivery protocol based on ZigBee in smart grid. EURASIP J. Wirel. Commun. Netw. 2014, 2014, 108. [Google Scholar] [CrossRef]
  16. Ranalli, A.; Borean, C. Energy@home Leveraging ZigBee to Enable Smart Grid in Residential Environment. In Proceedings of the First International Workshop Smart Grid Security (SmartGridSec 2012), Berlin, Germany, 3 December 2012; Revised Selected Papers. Springer: Berlin/Heidelberg, Germany, 2013; pp. 132–149. [Google Scholar]
  17. Bilgin, B.E.; Gungor, V.C. Performance evaluations of ZigBee in different smart grid environments. Comput. Netw. 2012, 56, 2196–2205. [Google Scholar] [CrossRef]
  18. Saha, A.; Kuzlu, M.; Pipattanasomporn, M.; Rahman, S. Enabling Residential Demand Response Applications with a ZigBee-Based Load Controller System. Intell. Ind. Syst. 2016, 2, 303–318. [Google Scholar] [CrossRef]
  19. Alharbi, Y.; Powell, D.; Langley, R.J.; Rigelsford, J.M. ZigBee wireless quality trials for smart meters. In Proceedings of the 2011 Loughborough Antennas & Propagation Conference, Loughborough, UK, 14–15 November 2011.
  20. Park, W.K.; Choi, C.S.; Lee, I.W.; Jang, J. Energy efficient multi-function home gateway in always-on home environment. IEEE Trans. Consum. Electron. 2010, 56, 106–111. [Google Scholar] [CrossRef]
  21. Rodrigues, E.M.G.; Caramelo, T.; Mendes, T.D.P.; Godina, R.; Catalão, J.P.S. Experimental Wireless Wattmeter for Home Energy Management Systems. In Technological Innovation for Cloud-Based Engineering Systems; Springer: Lisbon, Portugal, 2015; pp. 327–336. [Google Scholar]
  22. Belley, C.; Gaboury, S.; Bouchard, B.; Bouzouane, A. An efficient and inexpensive method for activity recognition within a smart home based on load signatures of appliances. Pervasive Mob. Comput. 2014, 12, 58–78. [Google Scholar] [CrossRef]
  23. Namboodiri, V.; Aravinthan, V.; Mohapatra, S.N.; Karimi, B.; Jewell, W. Toward a Secure Wireless-Based Home Area Network for Metering in Smart Grids. IEEE Syst. J. 2014, 8, 509–520. [Google Scholar] [CrossRef]
  24. Rahman, M.A.; Al-Shaer, E.; Bera, P. A Noninvasive Threat Analyzer for Advanced Metering Infrastructure in Smart Grid. IEEE Trans. Smart Grid 2013, 4, 273–287. [Google Scholar] [CrossRef]
  25. Zipperer, A.; Aloise-Young, P.A.; Suryanarayanan, S.; Roche, R.; Earle, L.; Christensen, D.; Bauleo, P.; Zimmerle, D. Electric Energy Management in the Smart Home: Perspectives on Enabling Technologies and Consumer Behavior. Proc. IEEE 2013, 101, 2397–2408. [Google Scholar] [CrossRef]
  26. Green, R.C.; Wang, L.; Alam, M. Applications and Trends of High Performance Computing for Electric Power Systems: Focusing on Smart Grid. IEEE Trans. Smart Grid 2013, 4, 922–931. [Google Scholar] [CrossRef]
  27. Mendes, T.D.P.; Godina, R.; Rodrigues, E.M.G.; Matias, J.C.O.; Catalão, J.P.S. Smart Home Communication Technologies and Applications: Wireless Protocol Assessment for Home Area Network Resources. Energies 2015, 8, 7279–7311. [Google Scholar] [CrossRef]
  28. Fang, X.; Misra, S.; Xue, G.; Yang, D. Managing smart grid information in the cloud: Opportunities, model, and applications. IEEE Netw. 2012, 26, 32–38. [Google Scholar] [CrossRef]
  29. Texas Instruments Incorporated. ZigBee® Wireless Networking Overview; Texas Instruments Incorporated: Tucson, AZ, USA, 2013. [Google Scholar]
  30. Nugroho, F.E.; Sahroni, A. ZigBee and wifi network interface on Wireless Sensor Networks. In Proceedings of the 2014 Makassar International Conference on Electrical Engineering and Informatics (MICEEI), Makassar, Indonesia, 26–30 November 2014.
  31. Texas Instruments Incorporated. MSP432P4xx Family—Technical Reference Manual; Texas Instruments Incorporated: Dallas, TX, USA, 2015. [Google Scholar]
  32. Kulkarni, P.; Lewis, T.; Dave, S. Energy Monitoring in Residential Environments. IEEE Technol. Soc. Mag. 2014, 33, 71–80. [Google Scholar] [CrossRef]
  33. White, R.V. Pratical issues in monitoring and reporting input and output power. In Proceedings of the 2010 IEEE 12th Workshop on Control and Modeling for Power Electronics (COMPEL), Boulder, CO, USA, 28–30 June 2010.
  34. Holoubek, L. Tauglich für das Smart Grid Elektrizitätszähler auf Basis eines Cortex-M4F-Mikrocontrollers. Elektron. Ind. 2012, 30–32. [Google Scholar]
  35. Pavlovic, V.D.; Djordjevic-Kozarov, J.R. Ultra-selective spike multiplierless linear-phase two-dimensional FIR filter function with full Hilbert transform effect. IET Circ. Devices Syst. 2014, 8, 532–542. [Google Scholar] [CrossRef]
Figure 1. AMS/HAN-based home energy management system.
Energies 10 00398 g001
Figure 2. Wireless power meter and terminal unit block diagram.
Energies 10 00398 g002
Figure 3. Voltage and current channel signal paths.
Energies 10 00398 g003
Figure 4. 10th order Bessel filter frequency response: (a) signal bandwidth; (b) Group delay.
Energies 10 00398 g004
Figure 5. Analog front end board.
Energies 10 00398 g005
Figure 6. Experimental test bench.
Energies 10 00398 g006
Figure 7. Main voltage waveform.
Energies 10 00398 g007
Figure 8. Electric heater at minimum power: (a) Current reading before and after analog filtering; (b) ADC current reading and post processing 80 tap linear-phase FIR filter.
Energies 10 00398 g008aEnergies 10 00398 g008b
Figure 9. Electric heater at medium power: (a) Current reading before and after analog filtering; (b) ADC current reading and post processing 80 tap linear-phase FIR filter.
Energies 10 00398 g009
Figure 10. Electric heater at full power: (a) Current reading before and after analog filtering; (b) ADC current reading and post processing 80 tap linear-phase FIR filter.
Energies 10 00398 g010
Figure 11. Light load input current.
Energies 10 00398 g011
Figure 12. Full load input current.
Energies 10 00398 g012
Figure 13. AC-DC adapter input current: ADC current reading and post processing 80 tap linear-phase FIR filter.
Energies 10 00398 g013

