Article

Online Reliable Peak Charge/Discharge Power Estimation of Series-Connected Lithium-Ion Battery Packs

1
National Fuel Cell Vehicle & Powertrain System Research & Engineering Center, No. 4800, Caoan Road, Shanghai 201804, China
2
School of Automotive Studies, Tongji University, No. 4800, Caoan Road, Shanghai 201804, China
*
Author to whom correspondence should be addressed.
Energies 2017, 10(3), 390; https://doi.org/10.3390/en10030390
Submission received: 22 January 2017 / Revised: 27 February 2017 / Accepted: 7 March 2017 / Published: 19 March 2017
(This article belongs to the Special Issue Advanced Energy Storage Technologies and Their Applications (AESA))

Abstract

:
The accurate peak power estimation of a battery pack is essential to the power-train control of electric vehicles (EVs). It helps to evaluate the maximum charge and discharge capability of the battery system, and thus to optimally control the power-train system to meet the requirement of acceleration, gradient climbing and regenerative braking while achieving a high energy efficiency. A novel online peak power estimation method for series-connected lithium-ion battery packs is proposed, which considers the influence of cell difference on the peak power of the battery packs. A new parameter identification algorithm based on adaptive ratio vectors is designed to online identify the parameters of each individual cell in a series-connected battery pack. The ratio vectors reflecting cell difference are deduced strictly based on the analysis of battery characteristics. Based on the online parameter identification, the peak power estimation considering cell difference is further developed. Some validation experiments in different battery aging conditions and with different current profiles have been implemented to verify the proposed method. The results indicate that the ratio vector-based identification algorithm can achieve the same accuracy as the repetitive RLS (recursive least squares) based identification while evidently reducing the computation cost, and the proposed peak power estimation method is more effective and reliable for series-connected battery packs due to the consideration of cell difference.

1. Introduction

With the global issues of energy shortage and environmental degradation, the lithium-ion battery, because of its high energy and power density and long service lifetime, has become one of the most readily available and low-cost energy storage components in electric vehicles (EVs). However, the lithium-ion battery cells are sensitive to over- and under-voltage, over- and under-temperature, and some extreme working conditions may even lead to safety issues. Thus, to guarantee the safety of the vehicle and to enhance the performance of the batteries, a battery system is generally equipped with a battery management system (BMS). The most important task of a BMS is to provide an accurate and real-time estimation of the internal states of the battery, such as state of Charge (SOC), state of health (SOH) and peak power etc. [1].
The estimation of the peak power in the vehicular application is generally used to evaluate the maximum charge and discharge capability of the battery system, and thus help to optimally control the power-train system to meet the requirement of acceleration, gradient climbing and regenerative braking while achieving a high energy efficiency [2].
The peak power can be determined by three methods. The first one is the hybrid pulse power characterization (HPPC) proposed by Partnership for New Generation Vehicles (PNGVs) [3]; the second method considers the SOC limit of the battery, i.e., the peak power is calculated based on the limitation of the permitted maximum and minimum SOC [4]; and the third method is the voltage-limited method [4,5,6,7,8,9,10,11,12]. No matter what method is used, in a real BMS, the peak power estimation can be implemented with two types of techniques: techniques based on a characteristic map and on dynamic battery models [13].
Within the techniques based on the characteristic maps [14,15], the static interdependence existing among the peak power, battery states (e.g., SOC and SOH), working conditions (e.g., voltage and temperature) and pulse duration is applied. The dependencies are stored in the non-volatile memory of the BMS in the form of look-up tables. When the battery system is working, the BMS determines the peak power of the battery according to the present battery states, working conditions and the requirement of the duration of power delivery. Normally, the characteristic map can be obtained in advance by various test procedures, for example, the HPPC test procedure [3]. The main advantages of this technique are its simplicity and straight forward implementation. However, this technique suffers from the drawbacks that only static battery characteristics are considered, massive experiments should be implemented to obtain the characteristic map, and a significant amount of non-volatile memory is required which increases the cost of the BMS.
Another technique is the model-based estimation [4,5,6,7,8,9,10,11,12]. So far, there have been many researches of model-based power estimation, and the main difference among the existing researches lies in the type of models they used. If the model can track the battery dynamics well, then the peak power can also be estimated accurately. One more important aspect that should be taken into consideration is that the model should be adaptive to different aging states and temperatures. Thus, model adaption techniques are often applied [5,7,8], in which the model parameters are identified online to improve estimation accuracy. Generally, the model-based power estimation is more promising, and the above mentioned researches have been validated and proven to be effective for the power estimation of a single battery cell.
One common drawback of the above mentioned techniques is that the characteristic difference among the cells of a battery pack has not been considered. As we know, in EV applications, due to the requirement of voltage and power, the battery system is generally composed of tens to hundreds of cells connected in series. Because of the restrictions of production technology and tolerances, material defects and contaminations, small differences among cells may exist. Furthermore, in real applications, the working conditions, e.g., temperature distributions, are also different among cells. This non-homogeneity among cells leads to the peak power of the battery system being limited by the weakest cell. Although this is a big challenge of battery management, to the best of our knowledge, there are few researches on this problem so far.
An ideal solution of this problem is to estimate the peak power for each individual cell online, i.e., to design an estimator which works well for estimating cell peak power, and to replicate that estimator N times to estimate the peak power for all the N series-connected cells in the battery systems. With the accurate power estimation of all the cells, we can determine the peak power for the battery system by considering the limitation of the weakest cell. This method provides the best estimation of the peak power for the battery system, however, it incurs a high computation cost, thus is not suitable to implement online within a low-cost microcontroller-based BMS. In reference [5], Waag et al. proposed a power estimation technique with consideration of the difference between the characteristics of individual cells in a battery pack. The method has been validated with a software-in-the-loop test. The adaption is implemented through a simplified relationship between cell voltage and pack averaged voltage. The method is enlightening, however, it assumes the dynamic of each cell to be equal, which may not necessarily hold true in real battery systems; moreover, the difference of polarization effect of each individual cell is not strictly considered.
In this paper, as the main scientific contribution, a peak power estimation technique which comprehensively considers the cell difference in a pack is proposed. A novel model parameter identification algorithm considering cell difference is firstly put forward. A mean battery cell model is fabricated to describe the average characteristics of the battery pack. The average parameter of the battery pack is estimated with the mean battery model, then several ratio vectors describing the characteristic difference between the battery pack and each battery cell are used to yield the parameter estimation for each cell. The ratio vectors are deduced strictly based on a comprehensive analysis of the pack’s and cells’ characteristics. Based on the parameter identification, the peak power estimation of the battery pack is further developed. Since the parameters for each cell are obtained, the limitation, imposed by the weakest cell, on peak power is also taken into consideration in power estimation. Some validation experiments are implemented in which the power estimations with 1 s, 10 s and 30 s durations are obtained. The results indicate that with the online parameter identification considering cell difference, the proposed power estimation method is adaptive to different aging states, working currents and cell inconsistency.

2. Power Estimation for One Single Battery Cell

Peak power means, based on the present conditions, the maximum power that can be maintained continuously for a specific time period, e.g., 1 s or 10 s, without violating the preset operational limits on the cells. From this definition, the peak power is limited by the safe operation area of the battery, which is normally defined by temperature, voltage, current and SOC etc. Since the forecast period of power prediction is less than tens of seconds, the influence of temperature and SOC changes can be neglected because they do not change rapidly. Thus, in this paper, the limitations by voltage and current are mainly considered in power estimation.

2.1. Lumped Parameter Battery Model

Normally, in the model-based peak power estimation, the lumped-parameter battery model is needed, and the equivalent circuit model shown in Figure 1 is widely used because of its simplicity and acceptable accuracy. The model can be described in a mathematical way with Equation (1), where UOC represents the open circuit voltage (OCV) which relates with SOC directly. RO is the ohmic resistance, and RTH and CTH are the impedance parameters normally corresponding to charge transfer and double layer capacitor effects. UB and UTH are the terminal voltage and the voltage on CTH respectively, IB is the working current. All parameters (RO, RTH and CTH) change with different temperatures, SOC and SOH of the battery.
{ U B = U o c U T H I B R O U ˙ T H = U T h R T H C T H + I B C T H

2.2. Online Model Parameter Identification

The accuracy of the battery model influences the estimate of the peak power. As we mentioned above, all the parameters in the model vary along with the actual working conditions of the battery. Moreover, the parameters cannot be obtained from direct measurements using sensors. Thus, the accurate identification of the model parameters in various conditions is the key to guarantee the accuracy of the power estimate.
For the online model parameter identification of li-ion batteries, many researches can be found. Basically, the parameter identification techniques are the recursive least squares (RLS) type or adaptive filtering (AF) type of methods [16,17,18,19,20,21,22,23,24,25], e.g., Xiong et al. [23] proposed a data-driven estimation approach which can simultaneously obtain the model parameter and the internal state of the battery. These techniques have been widely proven to be effective in online parameter identification. Because of the recursive computation process, these methods are easy to implement in real time. In such techniques, the parameters of the battery model are identified with only real-time measurements of current and voltage needed. In this paper, we use the RLS-based parameter identification technique.
If we define the dynamic voltage response caused by the cell impedance as:
U d = U B U O C ( S O C )
then, the difference equation of the dynamic voltage shown in Figure 1 can be expressed with:
U d , k + 1 = a U d , k + b I B , k + 1 + c I B , k
{ a = e Δ t τ b = R O c = e Δ t τ R O ( 1 e Δ t τ ) R T H τ = R T H C T H
where Δt is the sampling period of current and voltage, and k is the sampling point.
Define:
{ z k = U d , k h k = [ U d , k 1 , I B , k , I B , k 1 ] θ ^ L S , k = [ a , b , c ]
then the RLS-based model parameter identification can be implemented recursively with the following equation:
{ θ L S , k + 1 = θ L S , k + L k + 1 ( z k + 1 h k + 1 T θ L S , k ) L k + 1 = P k h k + 1 ( 1 + h k + 1 T P k h k + 1 ) P k + 1 = P k L k + 1 h k + 1 T P k
Note that, in this parameter identification method, the battery SOC should be obtained in advance. The SOC estimation has been well studied in a lot of previous researches, for example, Xiong et al. [26] proposed an online battery SOC estimation method. This method was applied based on the hardware-in-loop (HIL) setup, where the novel adaptive H infinity filter was proposed to realize the real-time estimation of the battery SOC. The experiment results indicated the high estimation accuracy and strong robustness of the method to the model uncertainty and measurement noise. Thus, the SOC estimation is not further studied in this paper.
Another factor which should be taken into account is the influence of current and its direction on the parameters. Normally, the parameters of the equivalent circuit model change not only with different temperature, SOC and SOH, but also with the current and current direction. In this paper, however, the focus is the consideration of the influence of cell difference. Thus, the influence of the current and its direction on the parameters has not been well considered. To take the influence of current and its direction on the parameters into account, the identification algorithm can be divided into to two parts; each part deals with the parameter identification in a specific current direction. In this case, the RLS-based parameter identification algorithms introduced in the paper will be divided into two parts in a similar way. We believe that, with this design, the accuracy of the identification will be improved. This will be considered in our future works.

2.3. Power Estimation

Normally, when the battery cells are used in an EV, the battery supplier will provide a current limitation of the batteries. In any case, the current of the battery cell should never exceed this limitation value. Besides this limitation, the peak power of the battery in real applications is also limited by voltage. Thus, in this paper, the limitations by both voltage and current are considered in the power estimation.
(1) Limitation by voltage
With a pulse current lasting for a period of m × Δt, the terminal voltage of the battery will be [6]:
U m , m + k = U o c ( S O C k ) I m + k [ Δ t C d U o c ( S O C ) d ( S O C ) | S O C = S O C k + R O + ( 1 e Δ t τ ) R T H i = 1 m 1 ( e Δ t τ ) m 1 i ] ( e Δ t τ ) m U T H , k
thus, the maximum charge and discharge current considering the voltage limitation are:
{ I m i n , vol , k + m = U o c ( S O C k ) U T H , k ( e Δ t τ ) m U m a x Δ t C d U o c ( S O C ) d ( S O C ) | S O C = S O C k + R O + R T H ( 1 e Δ t τ ) i = 1 m 1 ( e Δ t τ ) m 1 i I m a x , vol , k + m = U o c ( S O C k ) U T H , k ( e Δ t τ ) m U m i n Δ t C d U o c ( S O C ) d ( S O C ) | S O C = S O C k + R O + R T H ( 1 e Δ t τ ) i = 1 m 1 ( e Δ t τ ) m 1 i
where Umax and Umin are the allowed maximum and minimum voltages of the battery, Imin is the maximum charge current and Imax is the maximum discharge current, k is the sampling point, and Δt is the sampling period.
(2) Power estimation
Considering all the limitations by current and voltage, the maximum charge and discharge current of the battery lasting for the period of m × Δt from sampling step k can be determined by:
{ I m i n = max ( I m i n , b a t t , I m i n , v o l , k + m ) I m a x = min ( I m a x , b a t t , I m a x , v o l , k + m )
where Imin,batt and Imax,batt are the permitted maximum charge and discharge currents suggested by the battery suppliers. Then, the peak power estimation of the battery can be obtained by:
{ P m i n = U m , k + m I m i n = { U o c ( S O C k ) I m i n [ Δ t C d U o c ( S O C ) d ( S O C ) | S O C = S O C k + R O + R T H ( 1 e Δ t τ ) i = 1 m 1 ( e Δ t τ ) m 1 i ] ( e Δ t τ ) m U T H , k } I m i n P m a x = U m , k + m I m a x = { U o c ( S O C k ) I m a x [ Δ t C d U o c ( S O C ) d ( S O C ) | S O C = S O C k + R O + R T H ( 1 e Δ t τ ) i = 1 m 1 ( e Δ t τ ) m 1 i ] ( e Δ t τ ) m U T H , k } I m a x
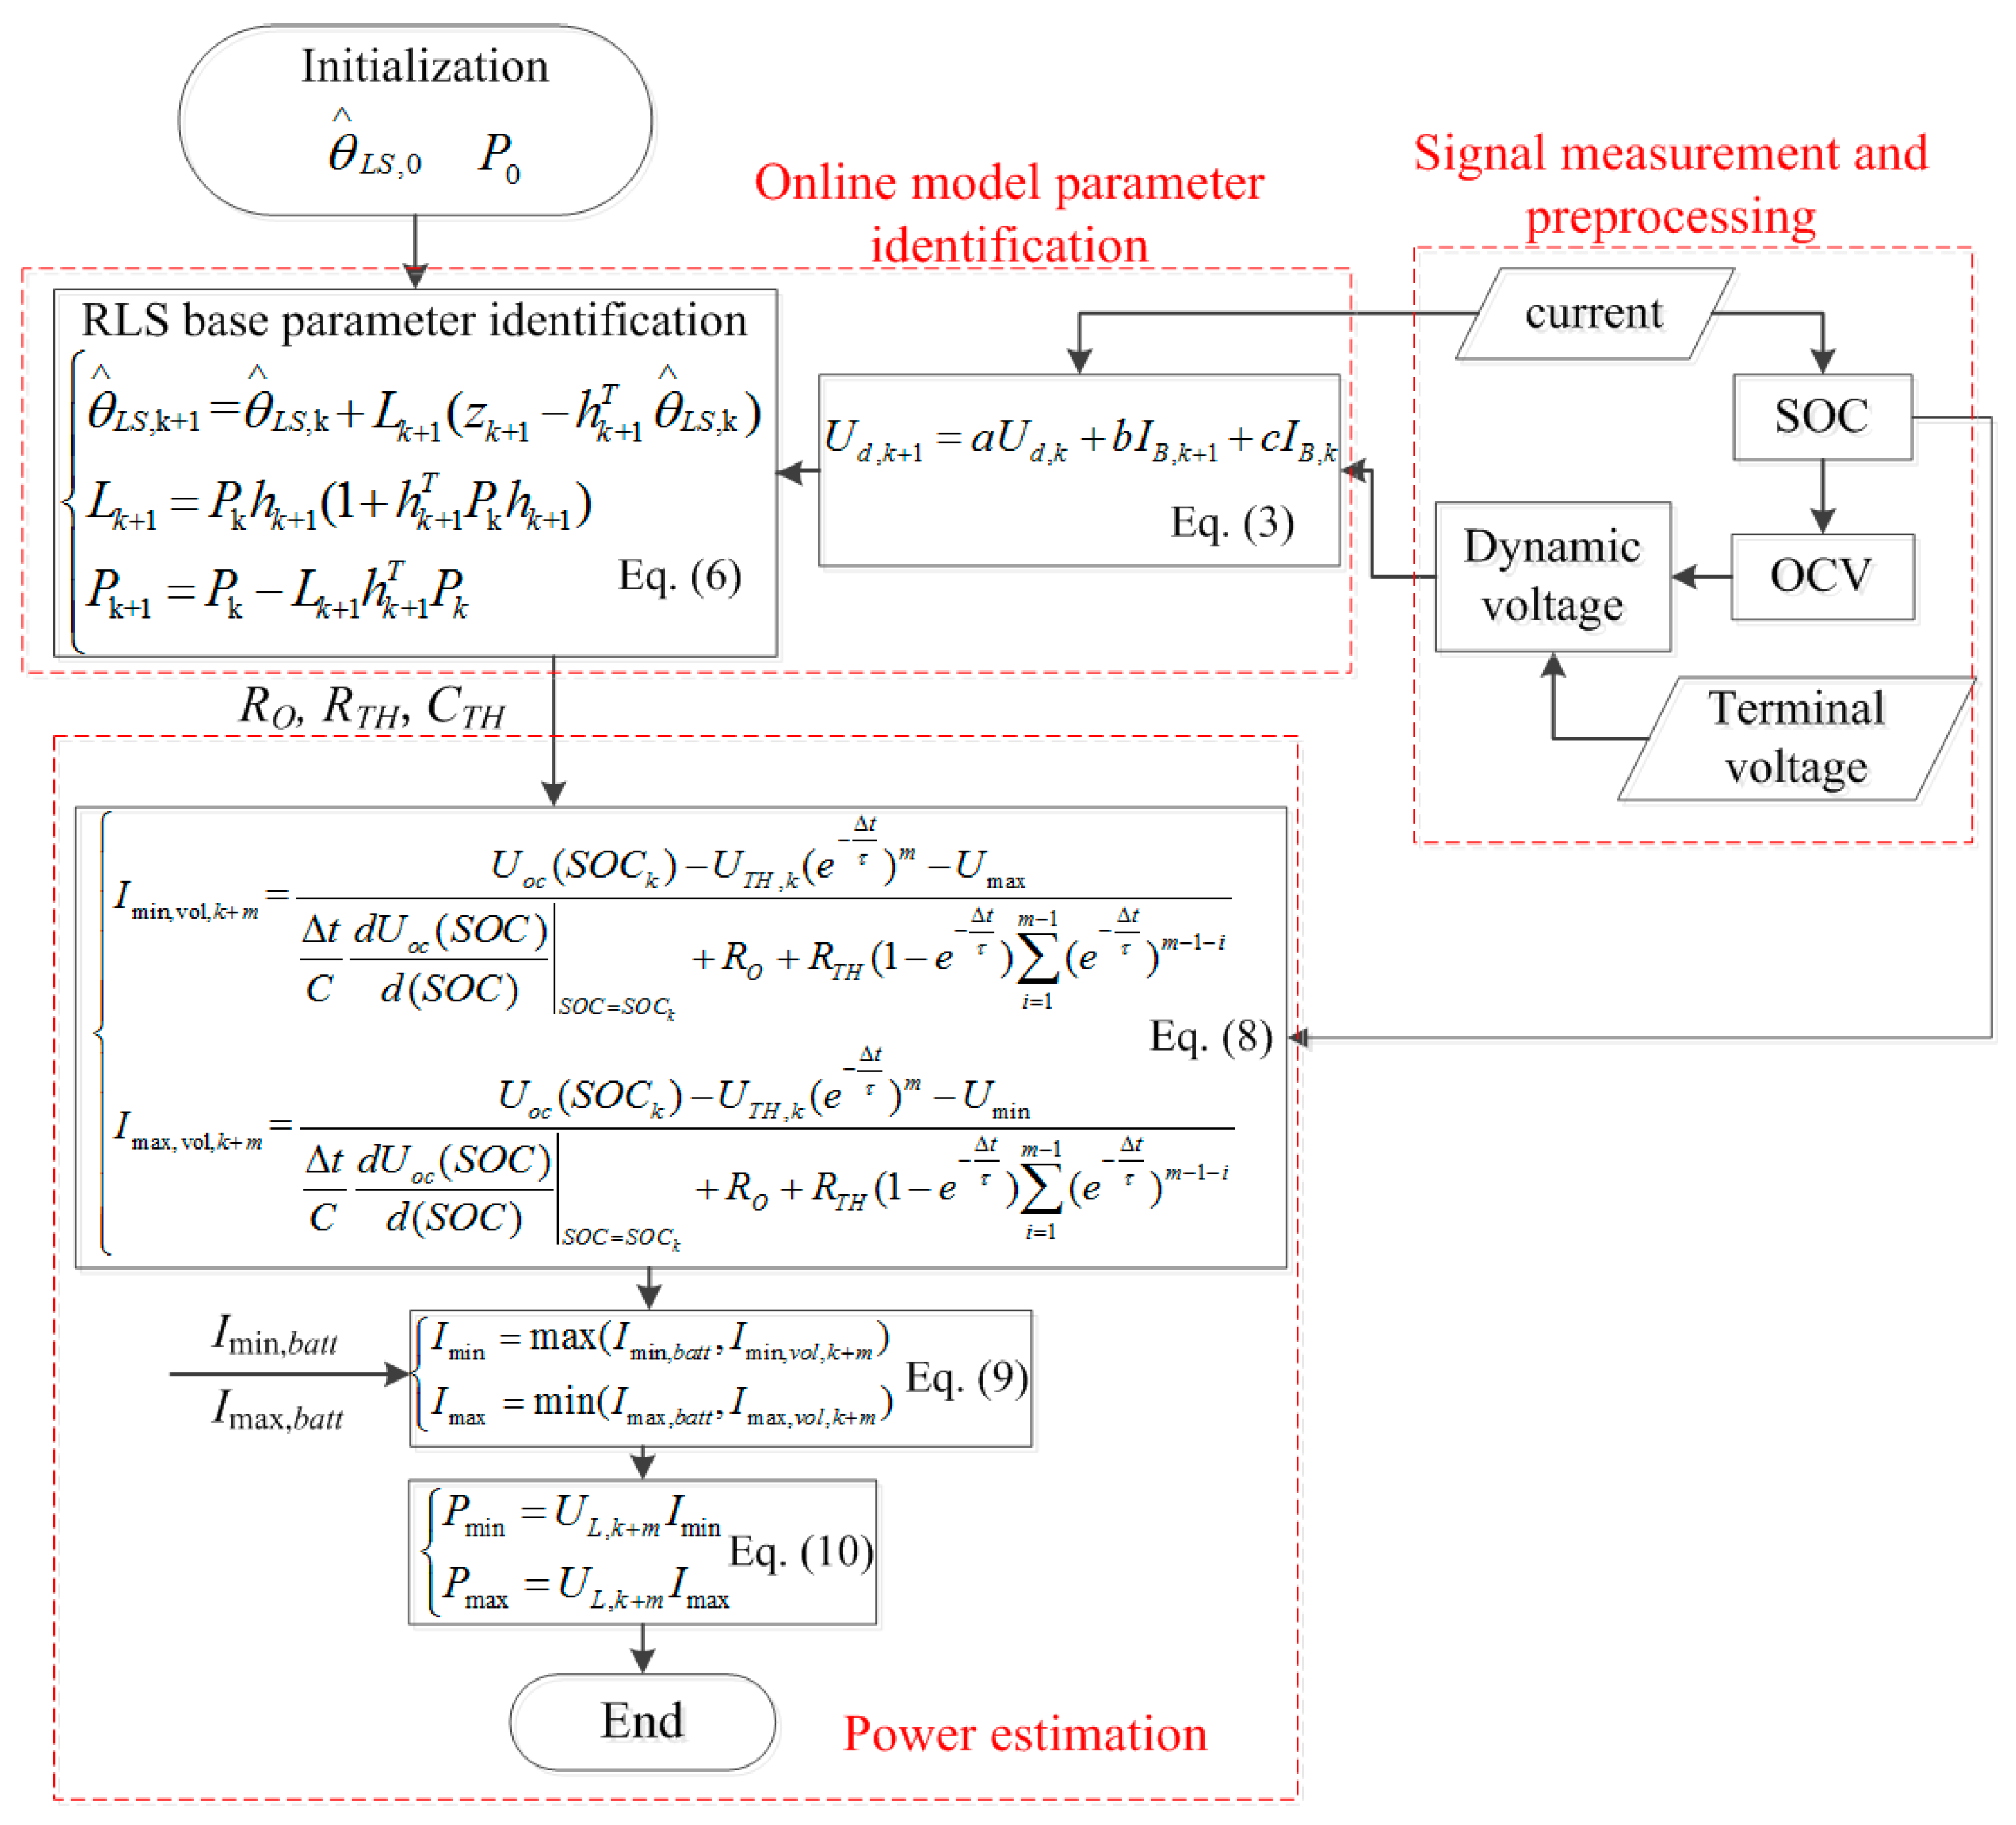
According to the elaborations above, the online adaptive peak power estimation of a single battery cell can be illustrated in Figure 2. The process illustrated in Figure 2 has now been widely used and proven to be effective in the power estimation of a single battery cell.

3. Power Prediction of Series-Connected Battery Packs

For a battery pack consisting of tens to hundreds of cells connected in series, it is the performance of each individual cell which limits the peak power. In a battery pack, the peak power is actually limited by the weakest cell, which is the cell that first reaches the predefined voltage or current limit during charging or discharging. Normally, the weakest cell limiting power delivery is the cell with the largest impedance. The SOC of each cell also influences the power capability; in any case, in a full-featured BMS, the problem caused by SOC imbalance can be alleviated by cell balancing [27] or cell SOC estimation [28]. Thus, in this paper, the influence of SOC imbalance to power capability is neglected, and the main focus of this study is the influence of cell impedance.
To determine the weakest cell, a straight forward method is to online identify the parameters of all individual cells. This method requires a huge computation cost, and is not suitable to be implemented on a low-cost microcontroller-based BMS. In reference [29], Roscher et al. proposed a reliable state estimation of multi-cell Li-ion battery systems, where a dimensionless vector reflecting the ratio of all the cells’ total impedances is used to determine the impedance parameters of all individual cells, and Waag et al. [5] used a similar method to deal with the problem caused by cell difference. The works of Roscher and Waag are enlightening, however, they assume the dynamic of each cell to be equal, which may not necessarily hold true in real battery systems; moreover, the difference of polarization effect of each individual cell is not strictly considered. We propose a peak power estimation technique which comprehensively considers the cell difference in a pack.

3.1. Improved Parameter Identification for Series Connected Battery Systems

(1) Basic idea
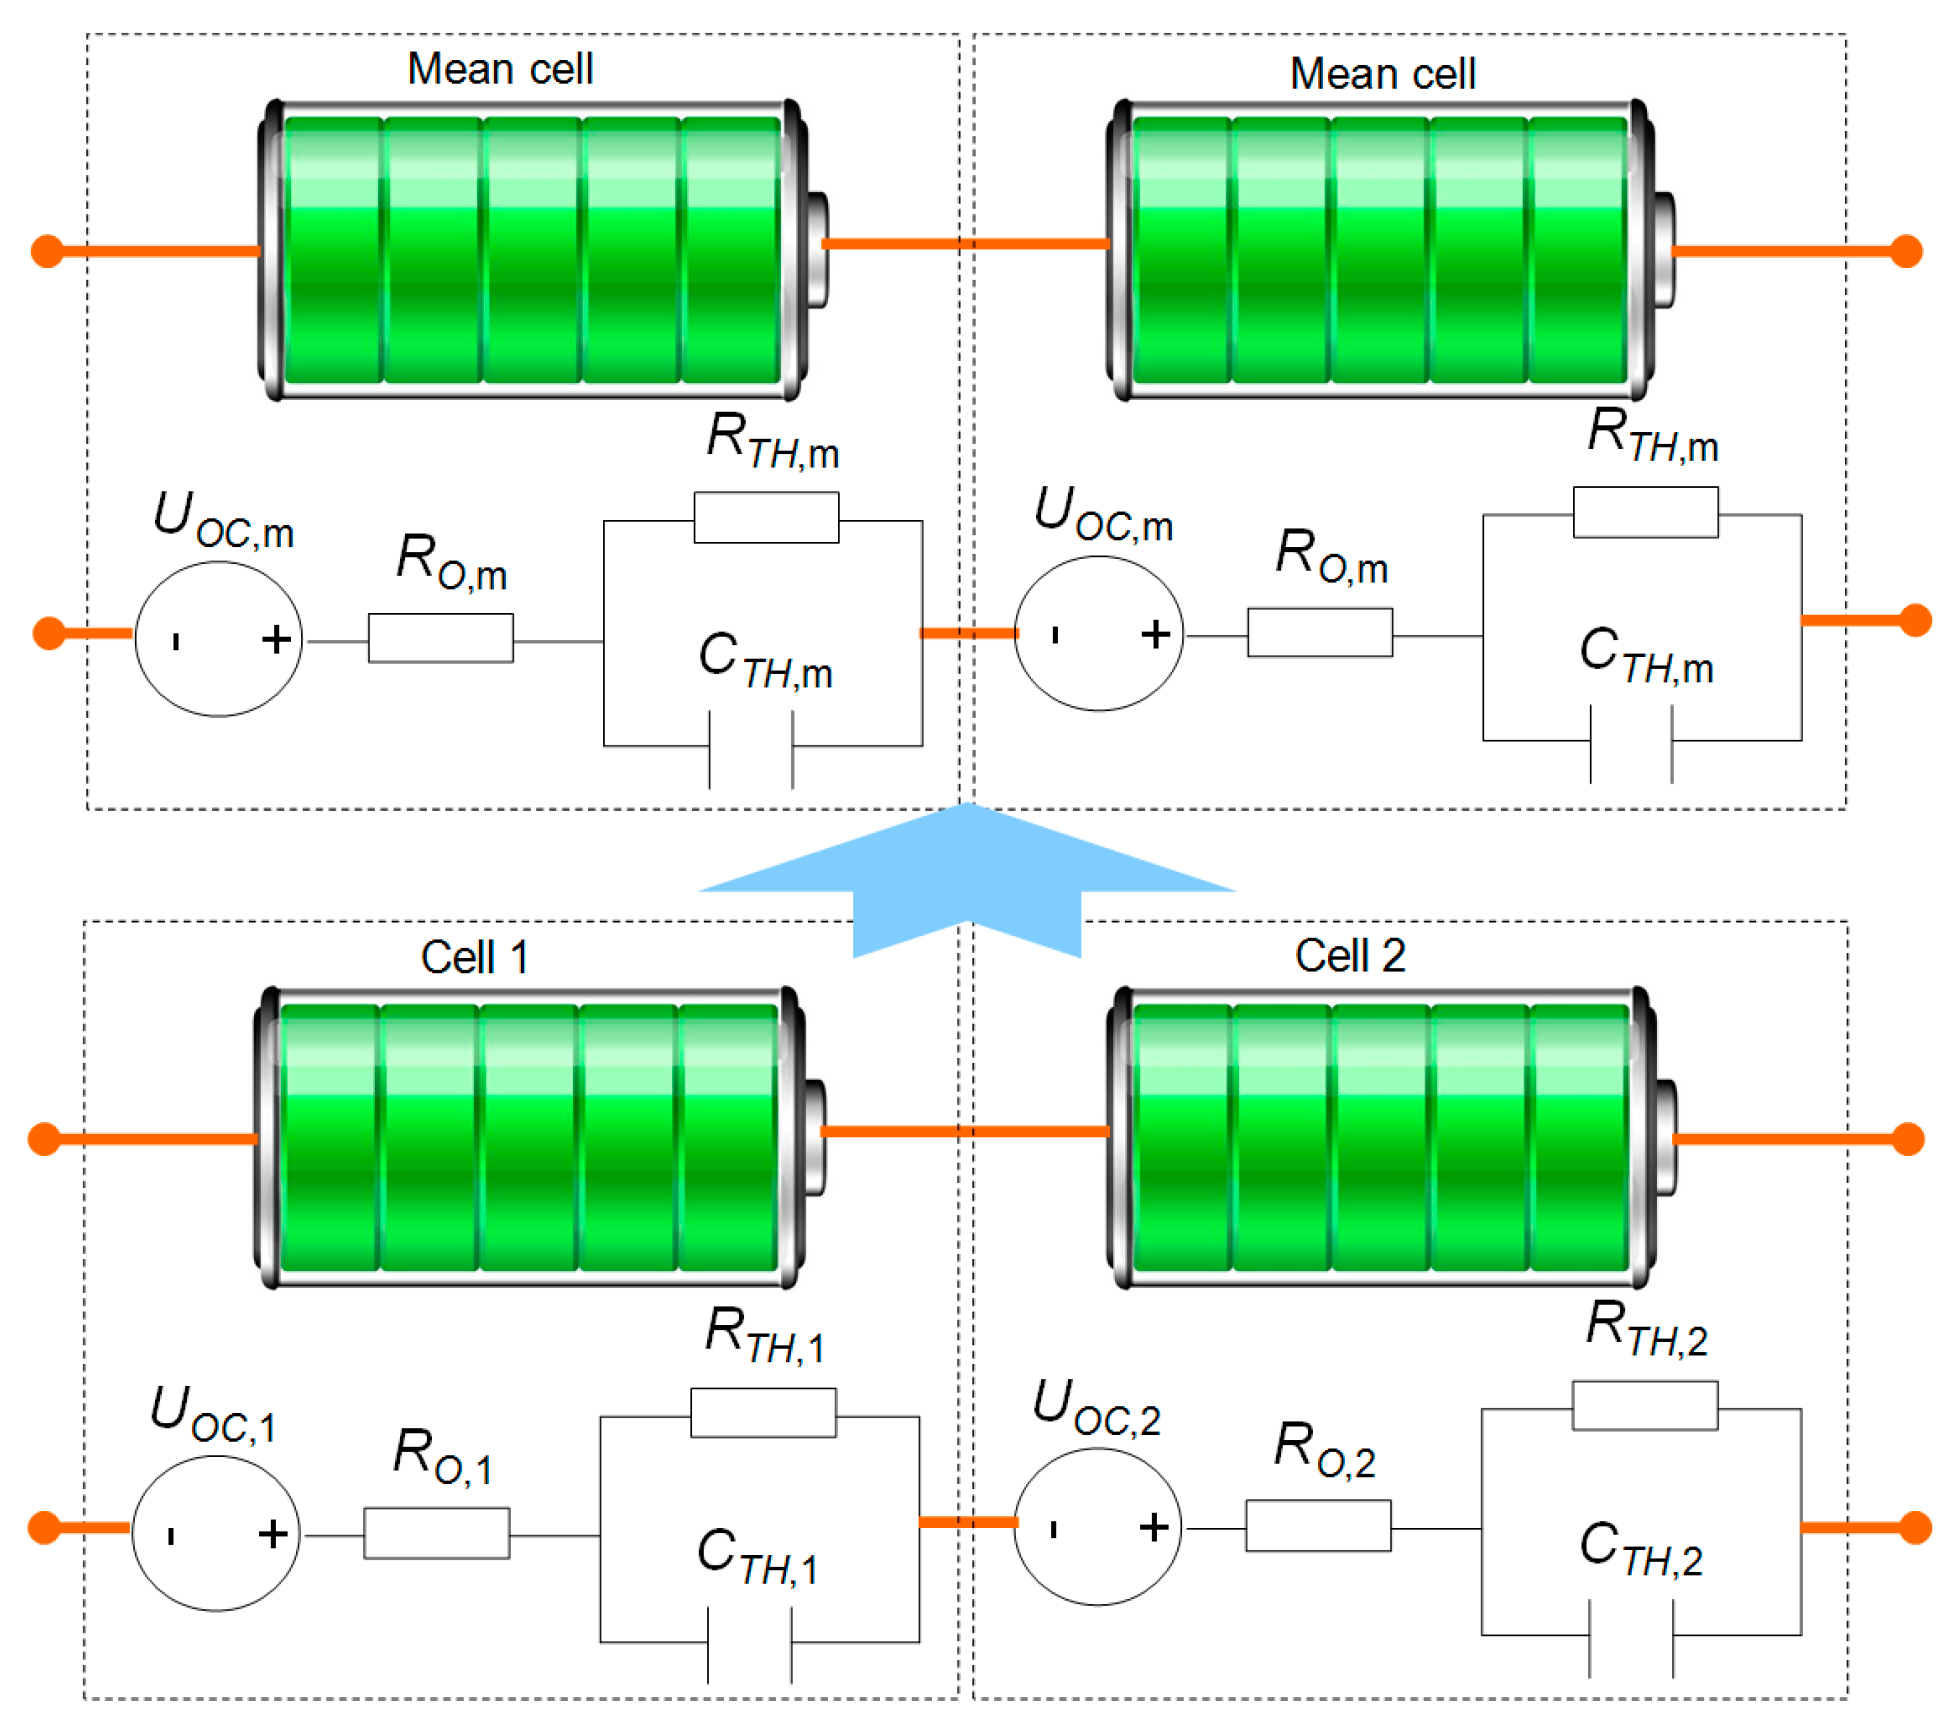
For simplicity, a small battery pack consisting of two series-connected cells is taken as an example to develop the improved parameter identification for series-connected battery systems. The impedance parameters of the two cells are RO1, RHT1, CTH1, and RO2, RTH2, CTH2. A battery cell, called “mean cell”, with the mean characteristics of the two individual cells is constructed; the impedance parameters of the mean cell are ROm, RTHm, CTHm. With the fabricated mean cell, the battery pack can be considered to be composed of two same mean cells, and the system is shown in Figure 3.
We define three ratio vectors, which reflect the differences among the battery characteristics:
{ A = [ R O 1 R O m , R O 2 R O m ] B = [ exp ( Δ t / τ 1 ) exp ( Δ t / τ m ) , exp ( Δ t / τ 2 ) exp ( Δ t / τ m ) ] C = [ R T H 1 R T H m , R T H 2 R T H m ]
For the battery pack, during charge and discharge, the mean parameters can be easily identified online with the RLS-based algorithm as introduced above when we consider that the pack is composed of two same mean battery cells. Then, the parameters of each individual cell can be obtained by combining the ratio vectors and the online identified mean parameters by the following equation. We can see that the determination of the ratio vectors is critical in the proposed method.
{ R O 1 = A [ 1 ] R O m R O 2 = A [ 2 ] R O m exp ( Δ t / τ 1 ) = B [ 1 ] exp ( Δ t / τ m ) exp ( Δ t / τ 2 ) = B [ 2 ] exp ( Δ t / τ m ) R T H 1 = C [ 1 ] R T H m R T H 2 = C [ 2 ] R T H m
(2) Determination of ratio vector A
When the battery pack works under a current I, we have:
R O 1 / R O 2 = U O 1 / U O 2
where UO1 and UO2 are the voltages of RO1 and RO2 under current I (shown in Figure 1). Then, theoretically, vector A can be determined with:
A = [ R O 1 R O m , R O 2 R O m ] = [ U O 1 U O m , U O 2 U O m ]
In real applications, it is difficult to obtain UO1, UO2 and UOm online because they cannot be directly measured, thus it is difficult to get the value of A with Equation (14). However, according to the model shown in Figure 1, we can find that, if the current changes suddenly, RO will cause a sudden voltage change. Based on this analysis, we can determine A with the sudden voltage changes of each individual cell and the mean cell, as shown in Equation (15), where ΔUs1, ΔUs2 and ΔUsm are the sudden voltage changes of the cells respectively.
A = [ R O 1 R O m , R O 2 R O m ] = [ Δ U s 1 Δ U s m , Δ U s 2 Δ U s m ]
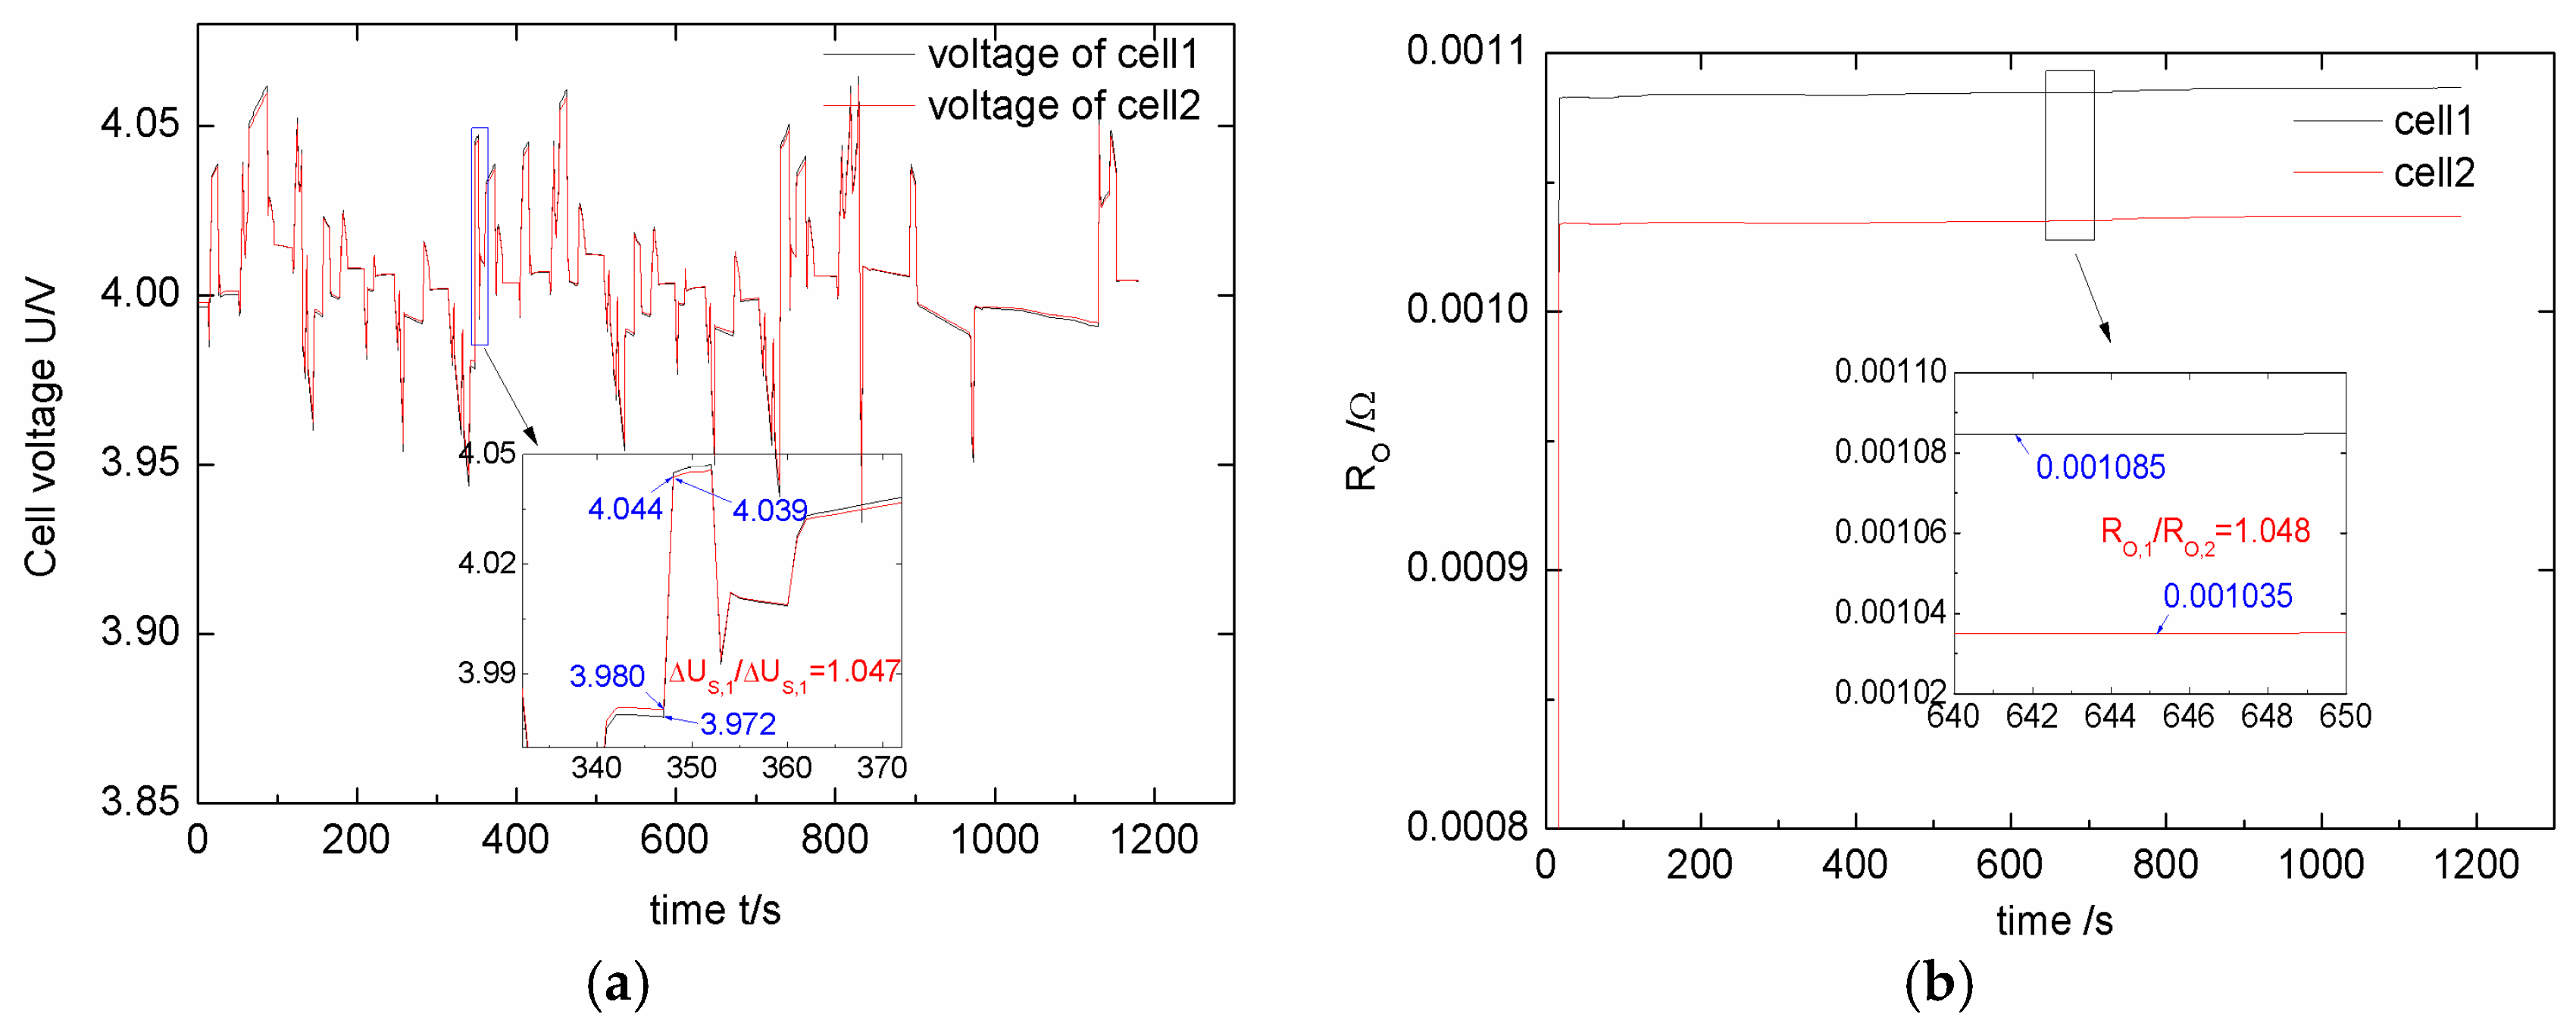
We here illustrate the voltage responses of the two cells under a current cycle, as shown in Figure 4a. The RLS-based identification results of RO for the cells in this case are shown in Figure 4b. We can find, from Figure 4, that the sudden voltage change ratio of the cells is very close to the RO ratio of the cells (in this case, the ratio is close to 1.05), which proves that Equation (15) can be used to determine vector A.
(3) Determination of ratio vector B
The polarization voltages of the cells can be obtained by:
{ U T H 1 , k = exp ( Δ t τ 1 ) U T H 1 , k 1 + ( 1 exp ( Δ t τ 1 ) ) R T H 1 I B , k U T H 2 , k = exp ( Δ t τ 2 ) U T H 2 , k 1 + ( 1 exp ( Δ t τ 2 ) ) R T H 2 I B , k
From Equation (16), we have:
U T H 1 , k U T H 2 , k = exp ( Δ t τ 1 ) U T H 1 , k 1 + ( 1 exp ( Δ t τ 1 ) ) R T H 1 I B , k exp ( Δ t τ 2 ) U T H 2 , k 1 + ( 1 exp ( Δ t τ 2 ) ) R T H 2 I B , k
Normally, the time constant of the RTHCTH network is much larger than the sampling period (generally several or tens of mini seconds), thus:
{ 1 exp ( Δ t τ 1 ) 0 1 exp ( Δ t τ 2 ) 0
By substituting Equation (18) with Equation (17), we have:
U T H 1 , k U T H 2 , k exp ( Δ t τ 1 ) U T H 1 , k 1 exp ( Δ t τ 2 ) U T H 2 , k 1
Thus:
exp ( Δ t τ 1 ) exp ( Δ t τ 2 ) = U T H 1 , k / U T H 1 , k 1 U T H 2 , k / U T H 2 , k 1
If we define:
{ K τ 1 = U T H 1 , k / U T H 1 , k 1 K τ 2 = U T H 2 , k / U T H 2 , k 1 K τ m = U T H m , k / U T H m , k 1
then, from Equation (21), we can define ratio vector B as:
B = [ exp ( Δ t / τ 1 ) exp ( Δ t / τ m ) , exp ( Δ t / τ 2 ) exp ( Δ t / τ m ) ] = [ K τ 1 K τ m , K τ 2 K τ m ]
On the other hand, during charge and discharge, the polarization voltages can also be calculated as:
{ U T H 1 = U d 1 I B R O 1 U T H 2 = U d 2 I B R O 2
in which Ud is the dynamic voltage response caused by the impedance, and can be calculated by Equation (2).
After measuring the terminal voltages of each cell and the pack, the dynamic voltage caused by the impedance can be calculated with Equation (2). Then, with Equation (23) and the identified ohmic resistances of cell 1, cell 2 and the mean cell, the polarization voltages can be obtained. Finally, the ratio vector reflecting the difference of polarization time constants, B can be calculated with Equations (21) and (22).
(4) Determination of ratio vector C
Based on Equation (17), we have:
{ R T H 1 = U T H 1 , k exp ( Δ t τ 1 ) U T H 1 , k 1 ( 1 exp ( Δ t τ 1 ) ) R T H 2 = U T H 2 , k exp ( Δ t τ 2 ) U T H 2 , k 1 ( 1 exp ( Δ t τ 2 ) )
If we define:
{ K R T H 1 = U T H 1 , k exp ( Δ t τ 1 ) U T H 1 , k 1 ( 1 exp ( Δ t τ 1 ) ) K R T H 2 = U T H 2 , k exp ( Δ t τ 2 ) U T H 2 , k 1 ( 1 exp ( Δ t τ 2 ) ) K R T H m = U T H m , k exp ( Δ t τ m ) U T H m , k 1 ( 1 exp ( Δ t τ m ) )
then, the ratio vector C can be determined as:
C = [ R T H 1 R T H m , R T H 2 R T H m ] = [ K R T H 1 K R T H m , K R T H 2 K R T H m ]
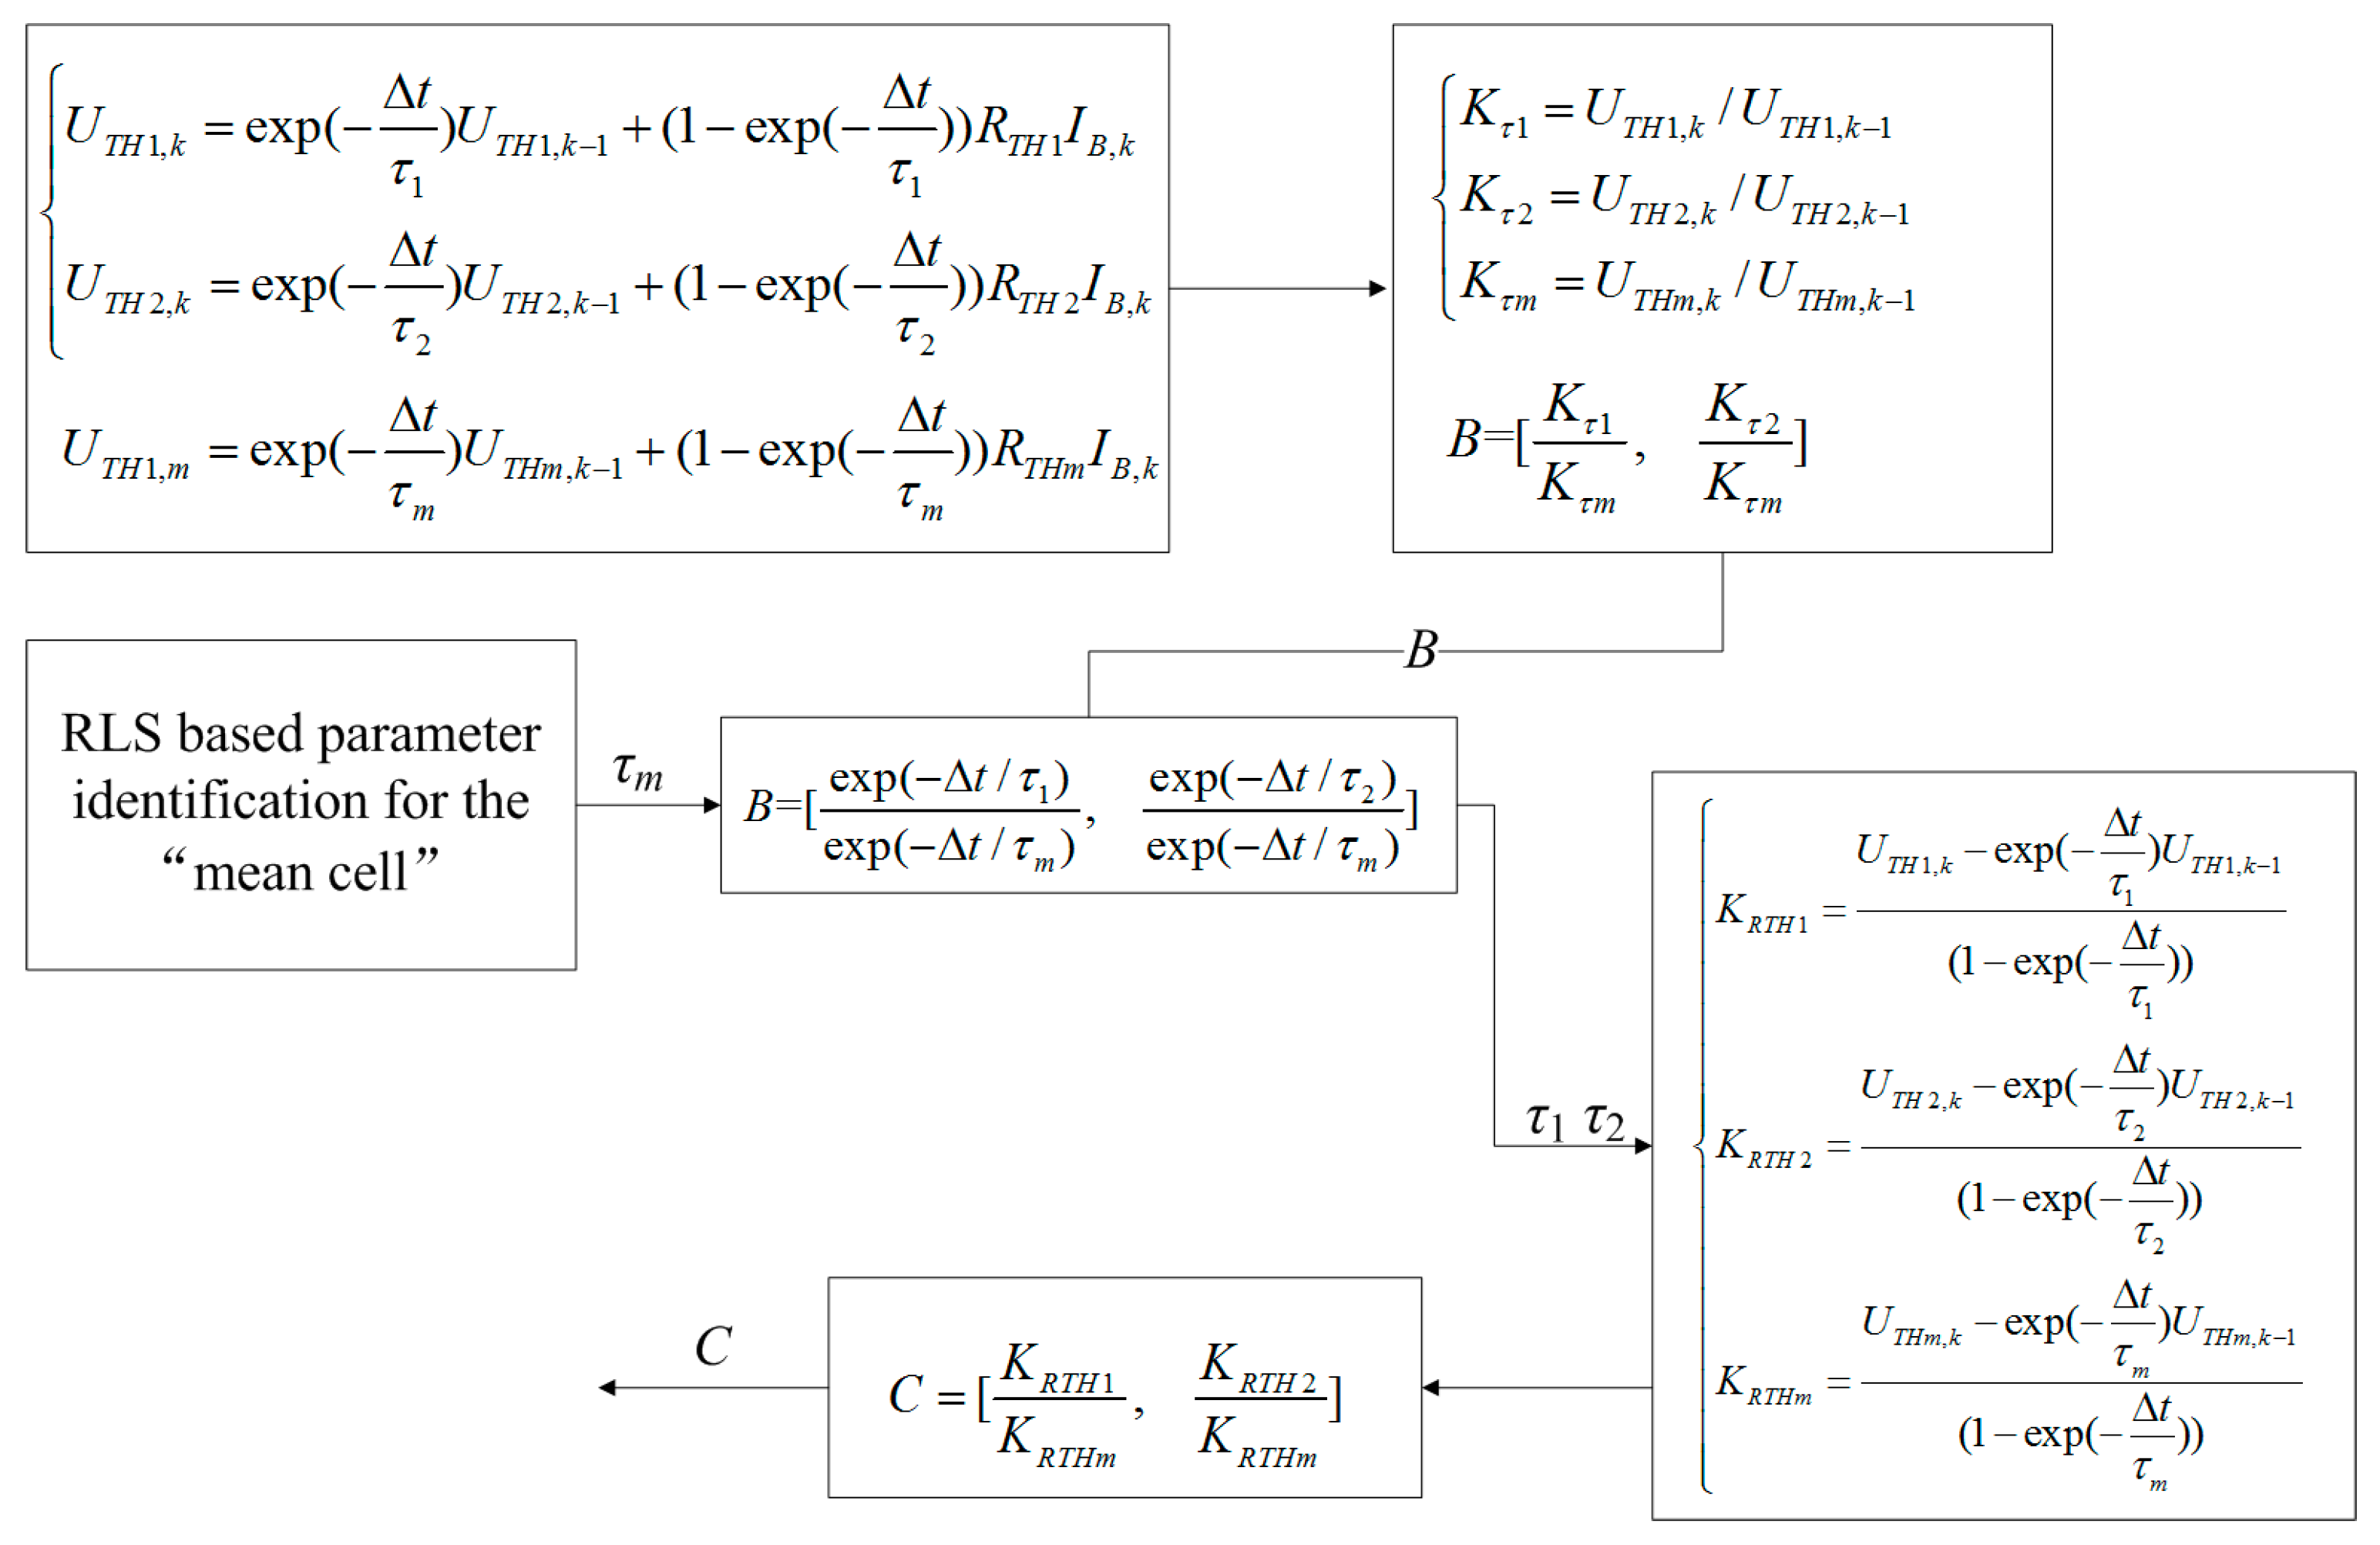
With vector B, and the identified time constant of the mean cell τm, we can get τ1 and τ2 with Equation (22), then with Equations (25) and (26), we can finally determine vector C, as shown in Figure 5.
(5) Online update of the ratio vectors
For a battery system composed of N series-connected battery cells, the ratio vectors reflecting the characteristics differences among the cells are:
{ A = [ Δ U s 1 Δ U s M Δ U s 2 Δ U s M , , Δ U s n Δ U s M ] B = [ K τ 1 K τ M , K τ 2 K τ M , , K τ n K τ M ] C = [ K R T H 1 K R T H M , K R T H 2 K R T H M , , K R T H n K R T H M ]
When using the ratio vectors to determine the parameters for each individual cell, to avoid the possible fluctuations and errors, an AF is further designed. We here take the design of the AF of vector A as an example.
According to Equation (15), at the sampling step k, the sudden voltage change vector of all the individual cells can be estimated with:
Δ U s , k p r e = A k 1 Δ U s M , k
If the ratio vector A carries some errors, then the estimated sudden voltage changes of the individual cells should be different from the true values; then, we can adjust A with the errors as:
A k = A k 1 + g A ( Δ U s , k Δ U s , k p r e )
in which, gA is an adjustment gain for vector A.
Similarly, we design the filters for vectors B and C as shown below:
{ K τ , k p r e = K τ M , k B k 1 B k = B k 1 + g B ( K τ , k K τ , k p r e )
{ K R T H , k p r e = K R T H M , k C k 1 C k = C k 1 + g C ( K R T H , k K R T H , k p r e )
in which, gB and gC are the adjustment gains for vectors B and C respectively.

3.2. Power Estimation Considering Cell Difference

For a battery pack consisting of N series-connected battery cells, the current limitation of each battery cell can be calculated with Equation (8) and the identified cell parameters based on the proposed identification method. The peak power estimation will be:
{ P s y s m i n = N × min i = 1 : N ( U B , i , k + m c h g I i , m i n ) P s y s m a x = N × max i = 1 : N ( U B , i , k + m d i s I i , m a x )
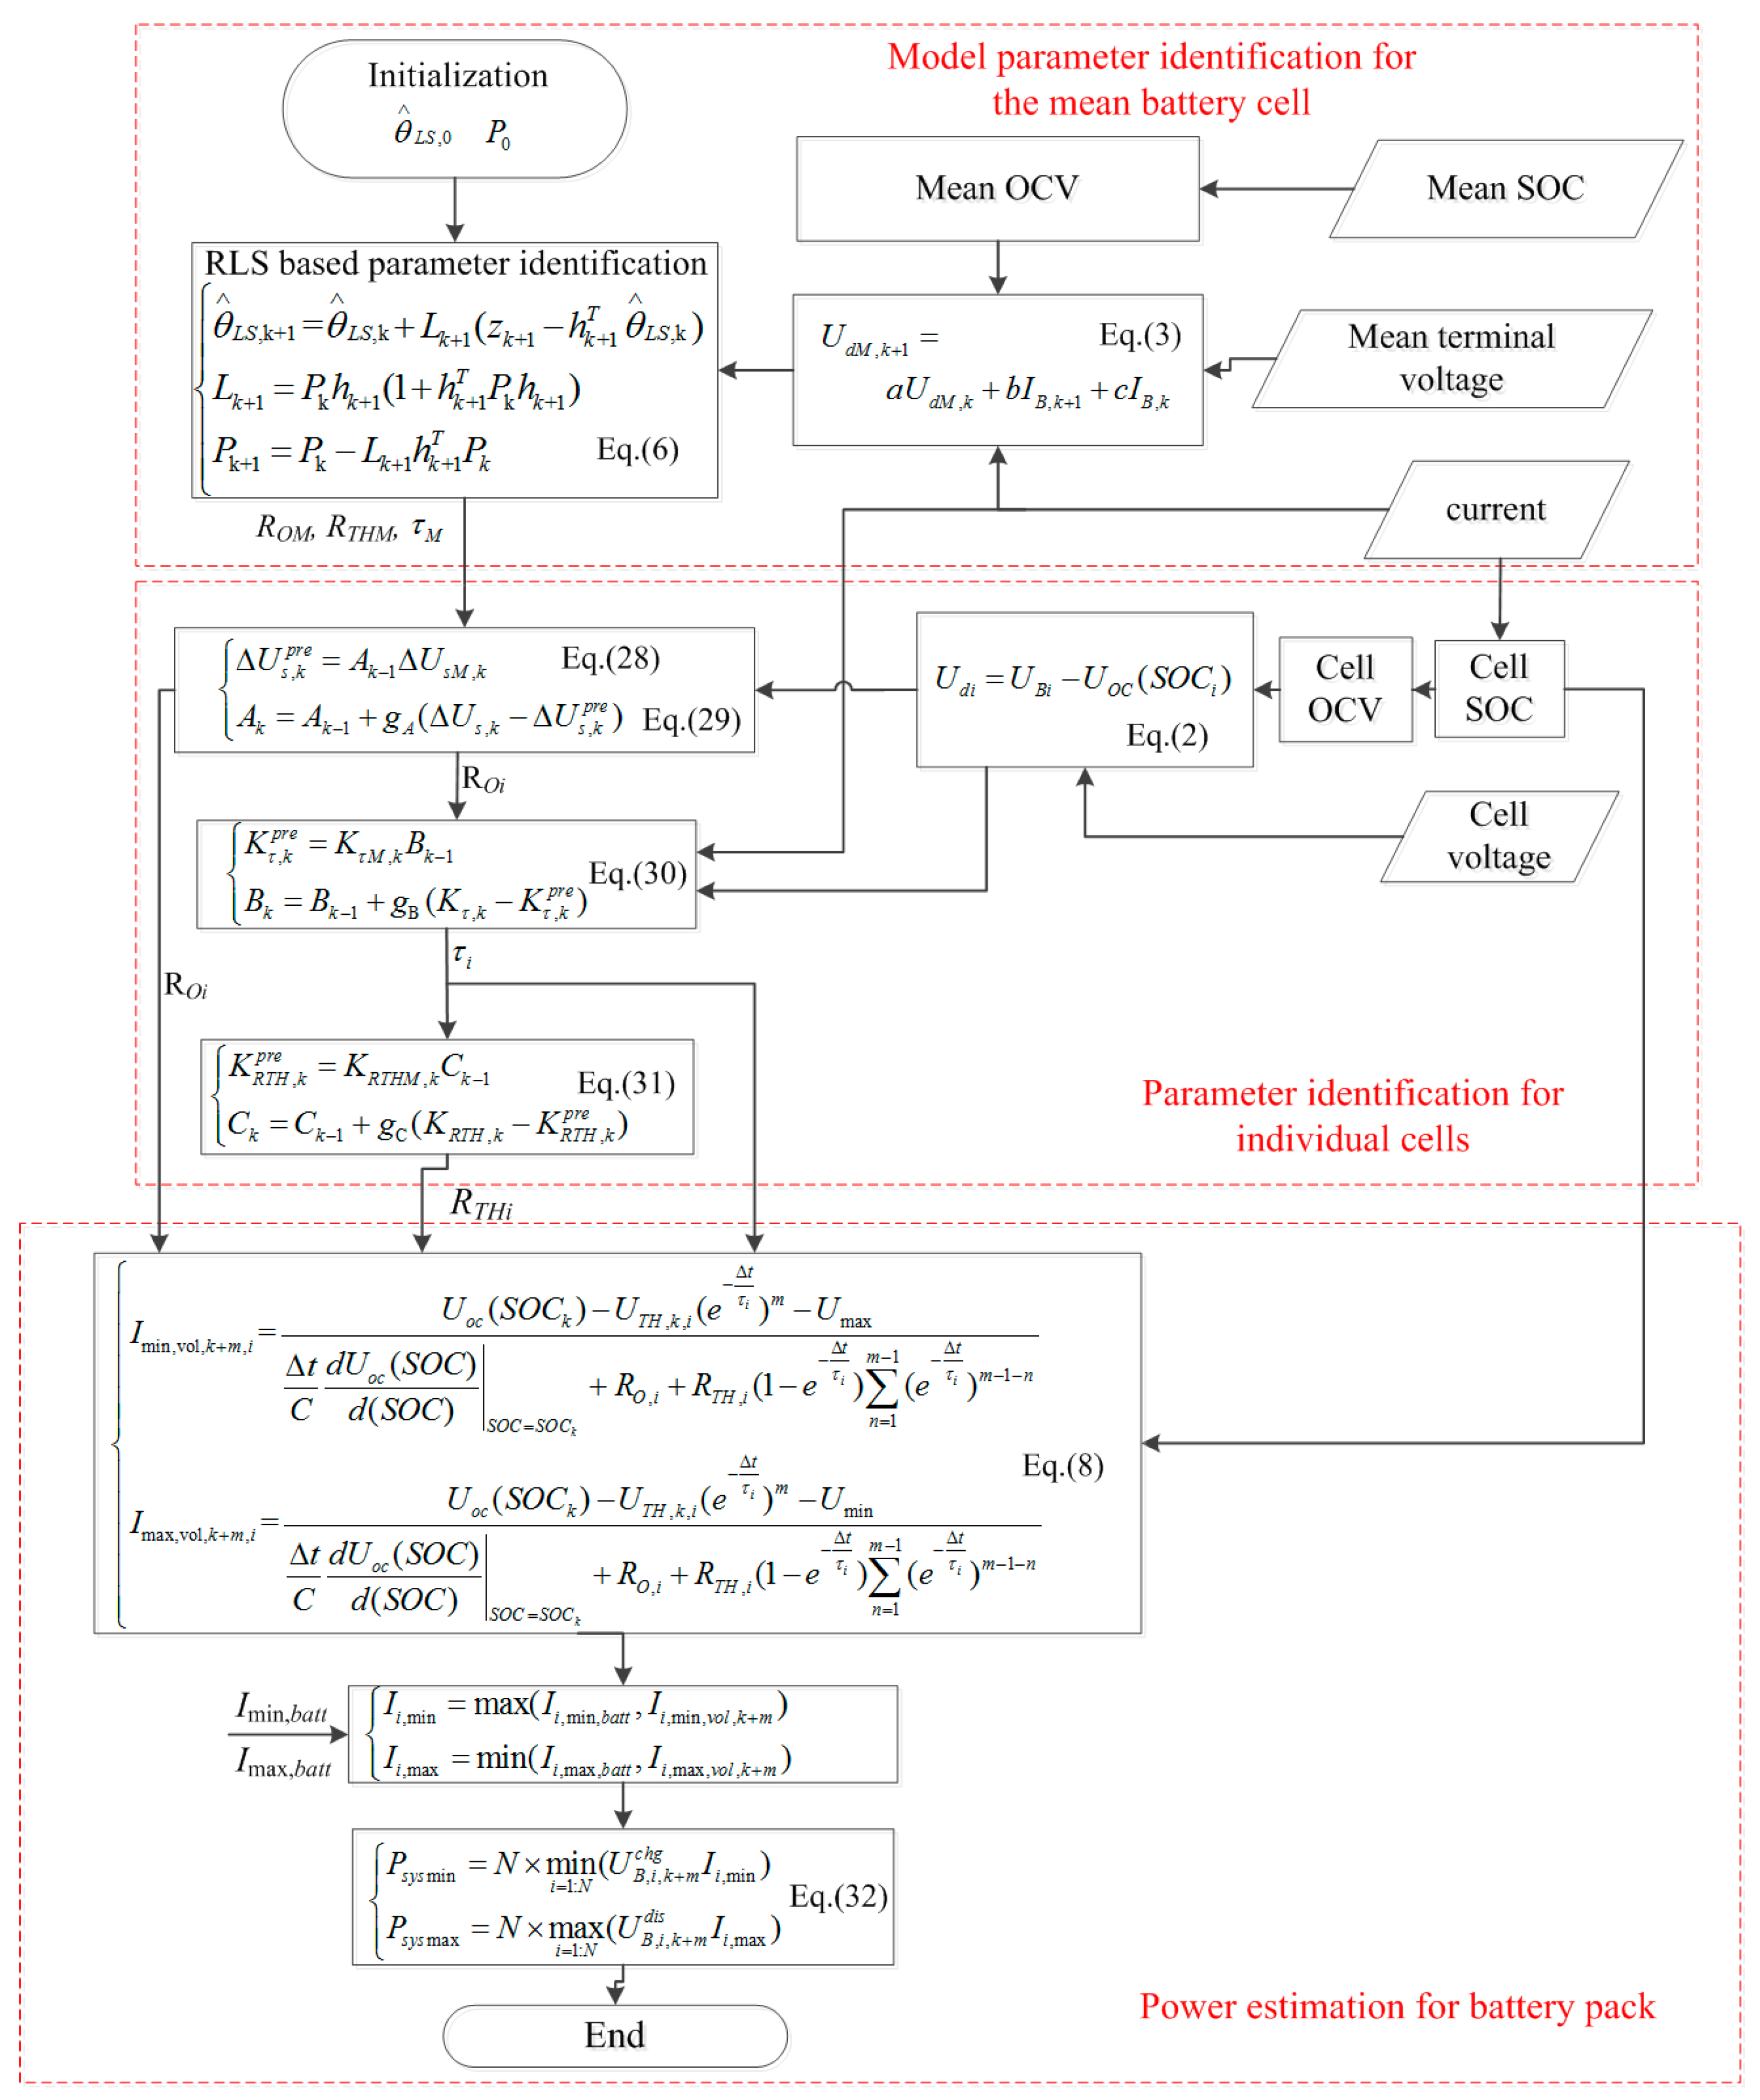
In conclusion, the power estimation of the battery system considering the cell difference is illustrated in Figure 6. The main advantage of this method is that the power estimation takes the cell difference into consideration with an acceptable computation cost.

4. Case Study

4.1. Experimental Setups

A small battery pack composed of 10 series-connected cells is constructed to validate the proposed peak power estimation method. Table 1 lists the basic information and the allowed voltage and current limitations of the battery cell suggested by the supplier at 25 °C.
Several tests with different current profiles are designed to thoroughly investigate the performance of the method. During the tests, the battery pack is put in an environmental chamber, and the temperature is set to 25 °C. The current profiles are obtained from an EV during the J1015, New European Driving Cycle (NEDC) and Federal Test Procedure-75 (FTP-75) cycle tests, and are shown in Figure 7. The tests are then implemented by a battery tester (Arbin BTS 2000, Arbin, College Station, TX, USA) with the obtained current profiles.
To investigate the performance of the proposed method in different cell aging conditions and different current profiles, the battery pack is firstly tested with the NEDC current profile, followed by 50 constant full charge/discharge cycles. Then, the battery pack is tested with the J1015 current profile, followed by another 50 full charge/discharge cycles. At last, the battery pack is tested with the FTP-75 current profile. The overall test procedure is illustrated in Figure 8.
The actual battery current and voltage, and the voltages of the 10 cells during the tests are all simultaneously measured by the BMS. With all the measured currents and voltages, we obtained the parameters of each individual cell by the repetitive implementation of the RLS-based identification, and the identification results are considered as the reference values of the parameters. On the other hand, the cell parameters are also identified by the newly proposed method, and the identification results of the new method are then compared with the reference values obtained from the repetitive RLS-based identification to investigate the performance of the proposed method.
Meanwhile, the power of the battery pack is estimated by the measured signals and the identified parameters. Both the peak power estimations with and without considering cell differences are obtained. The peak power estimation without considering cell differences is based on the parameters of the mean battery cell, and the process is shown in Figure 2, while the power estimation considering cell differences is realized with the method shown in Figure 6. The estimation results with and without considering cell differences are compared to investigate how cell differences affect the peak power of the battery pack. In the identification, the parameters are arbitrarily initialized with zero.

4.2. Results and Discussions

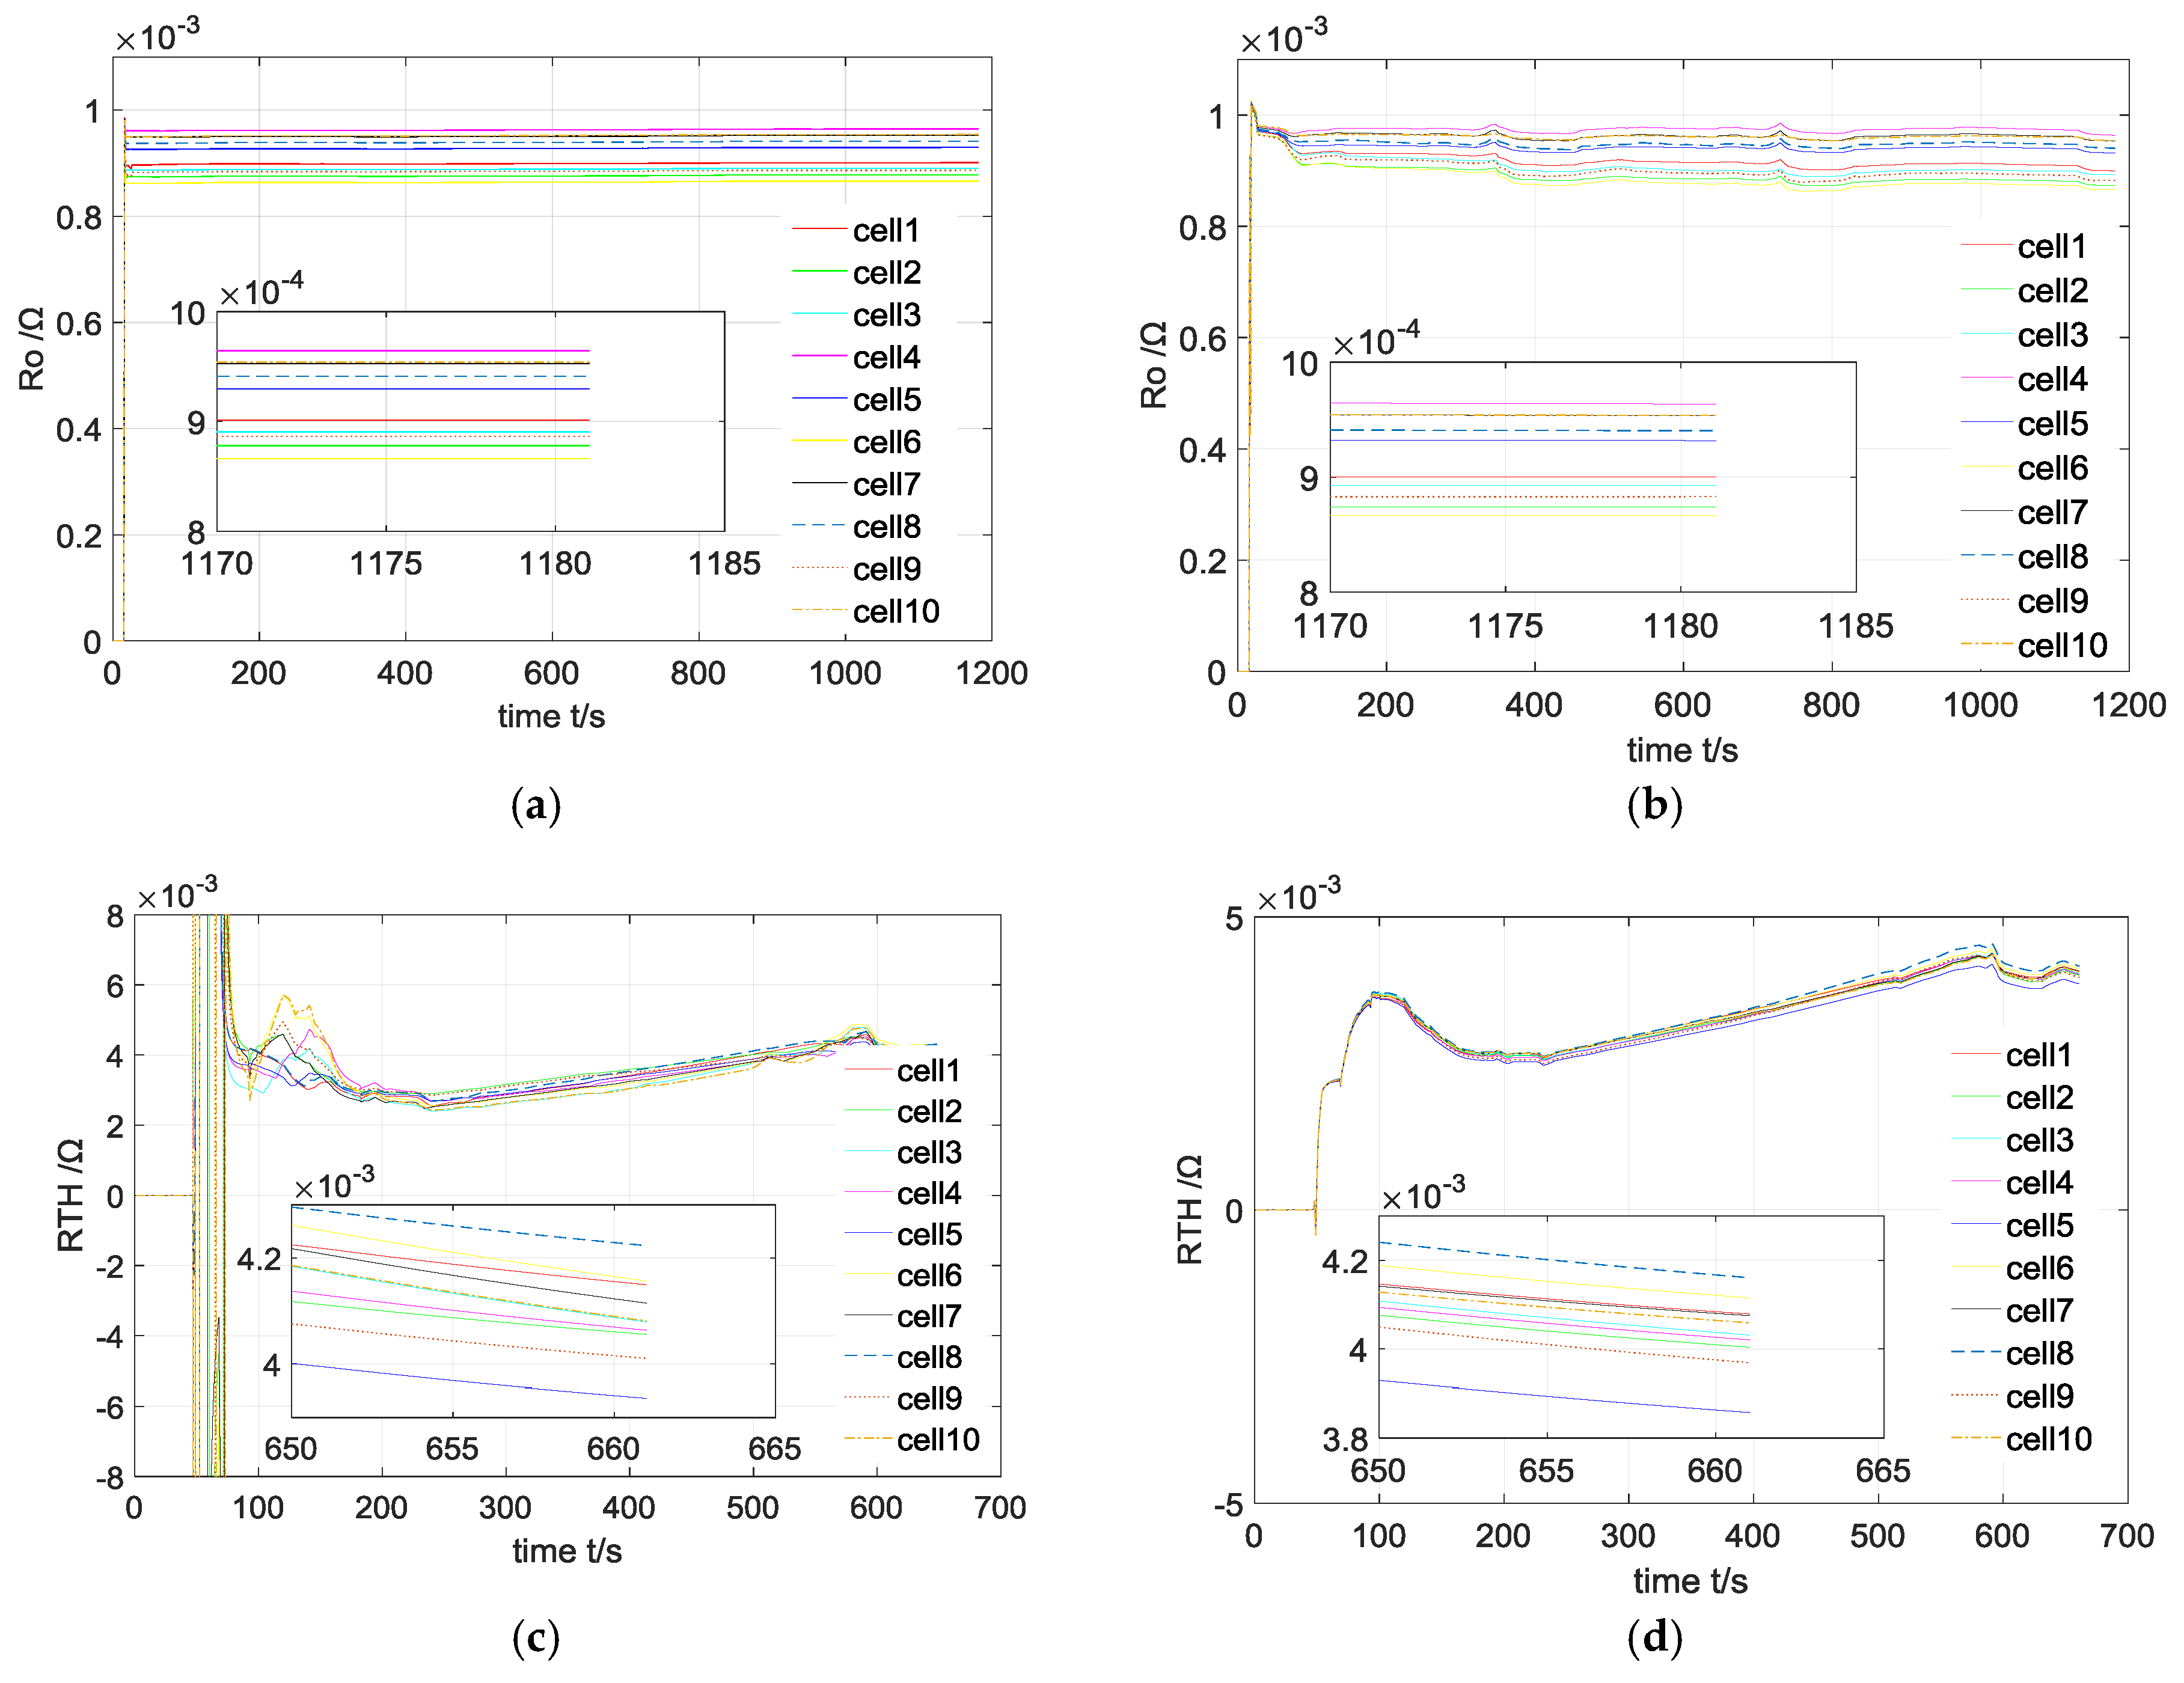
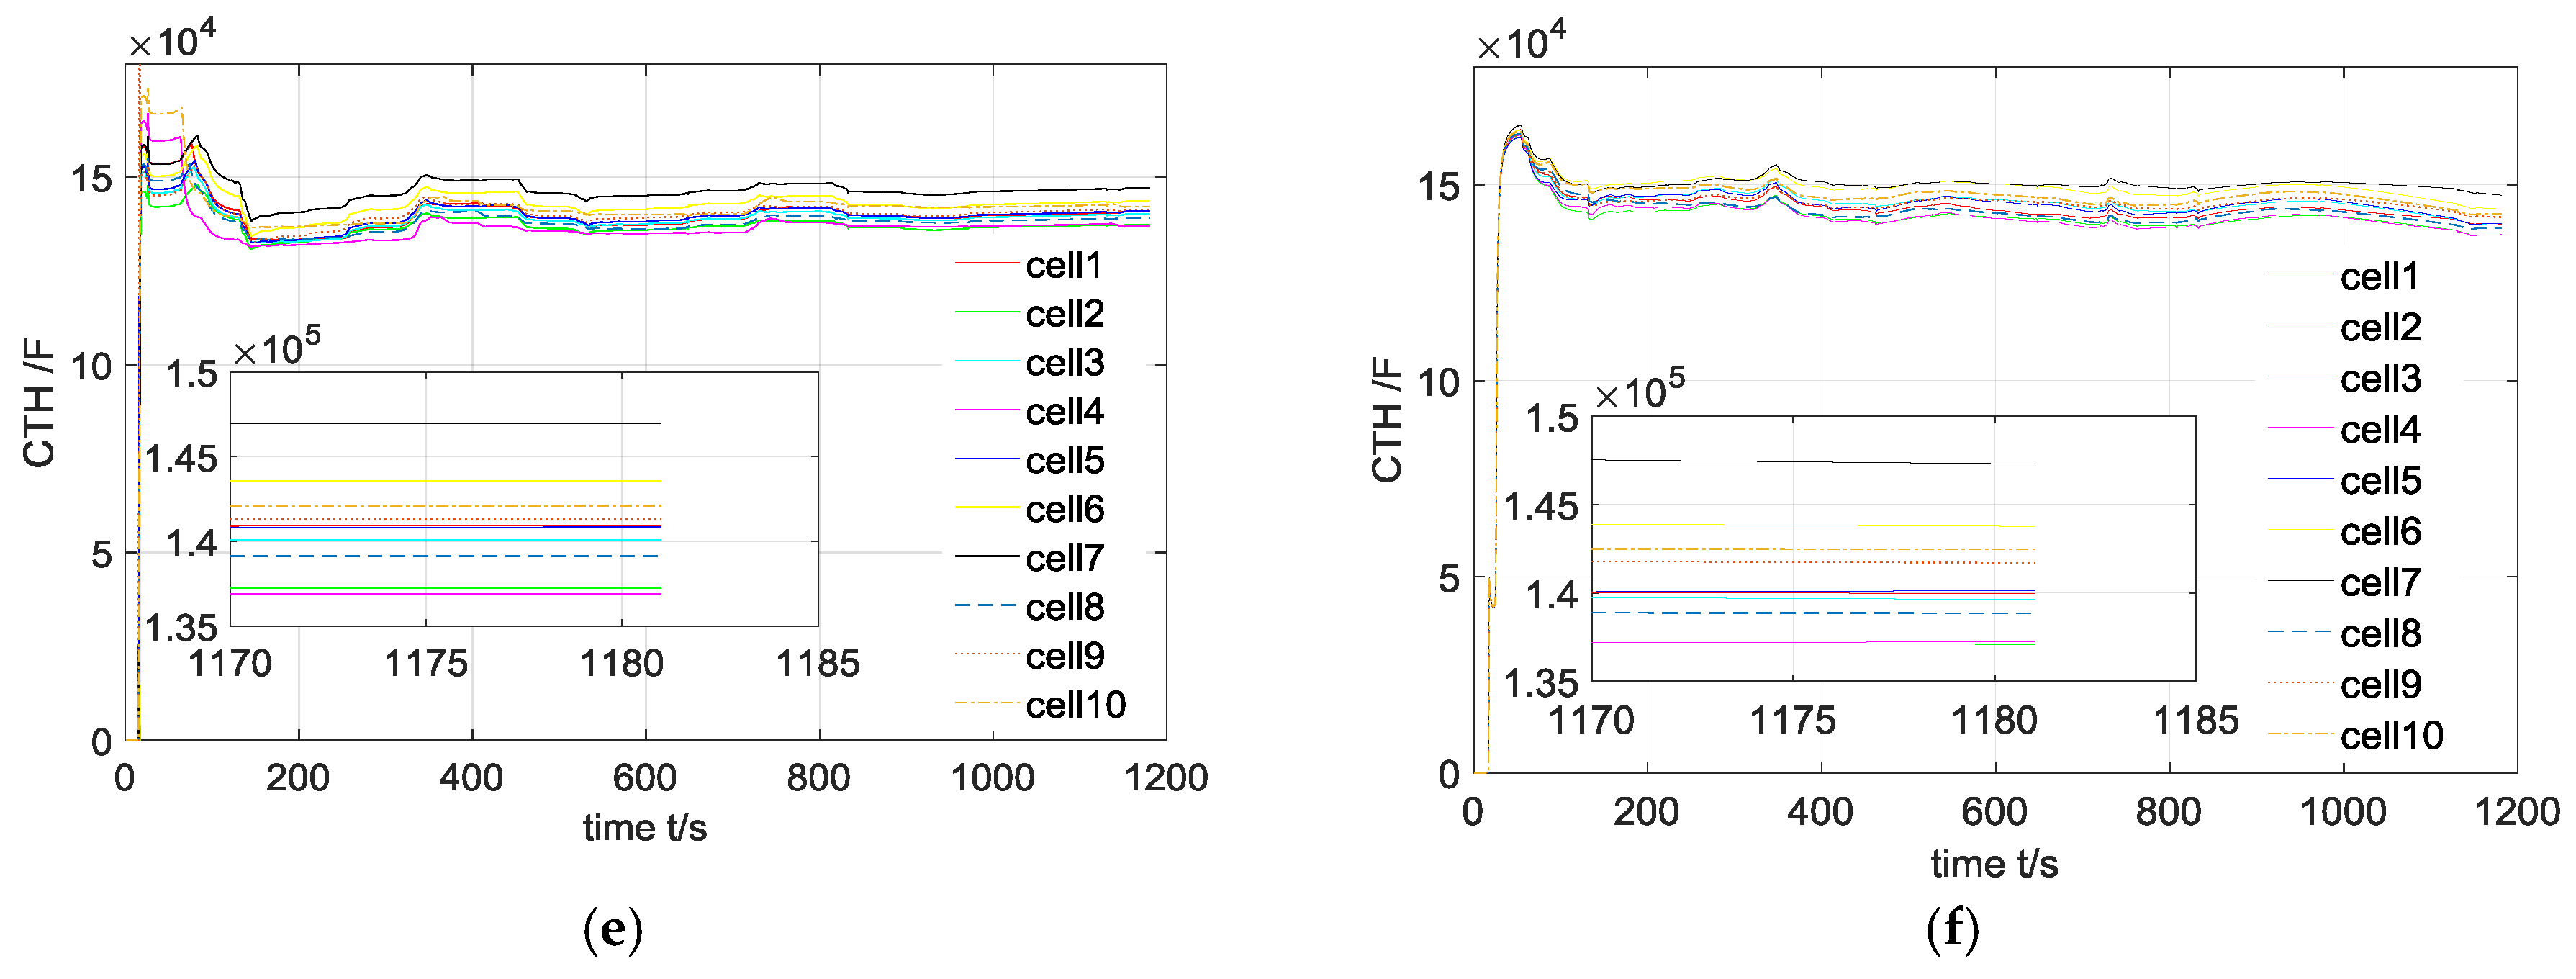
Figure 9, Figure 10 and Figure 11 show the parameter identification results obtained by the repetitive RLS algorithm and the proposed method during the tests. In all tests, we find that the parameters obtained by the proposed method are very close to the reference values identified by the repetitive RLS algorithm, especially after the convergence of the algorithm. We also find that, because of the design of the AF of the ratio vectors, the convergence of the proposed method is a little slower than the repetitive RLS algorithm. This can be seen more clearly by a close look at the identified results during the interval from 0 s to 200 s. In this time interval, the parameters identified by the different methods show big differences. Before convergence, the parameters identified by both methods have large errors, and the errors are also different in different methods. Thus, during convergence, the parameters are not the same in different methods. However, the convergence of the repetitive RLS-based algorithm is faster than the ratio vector-based algorithm. This is because the ratio vector-based algorithm should first use the results identified by traditional RLS as the mean value of the parameters, and then determine the parameters for each individual cell with the ratio vectors. Moreover, to avoid the possible fluctuations and errors, the adaptive filters are further designed, and the adaptive filters slow down the convergence of the algorithm further. Normally, the RLS-based algorithm converges within less than 150 iteration steps, and according to the results, the presented method converges within less than 250 iteration steps.
To validate the accuracy of the parameters identified by the proposed method, we focus on the identification results at the end of the tests, which are also shown in Figure 9, Figure 10 and Figure 11. We can see that the parameters identified by the two methods respectively are almost the same. A clear convergence of the ratio vectors can be found in the identification results. By comparing the impedance results shown in Figure 9, Figure 10 and Figure 11, we can also conclude from the results that, during the aging process, the internal impedances of the battery cells are getting larger, regardless of the ohmic resistance or the charge transfer resistance. The larger impedance during the aging process is caused by increasing the thickness of the SEI layer, and the decreasing the conductivity of the electrolyte etc. [30,31].
Table 2 lists the comparison of the computation time cost by the two methods, from which we can conclude that the proposed method can achieve the same identification accuracy while evidently reducing the computation cost. Note that the time listed in Table 2 is the total computation time cost by the algorithms in different test cycles when they are executed on a PC with a 2.4 GHz CPU.
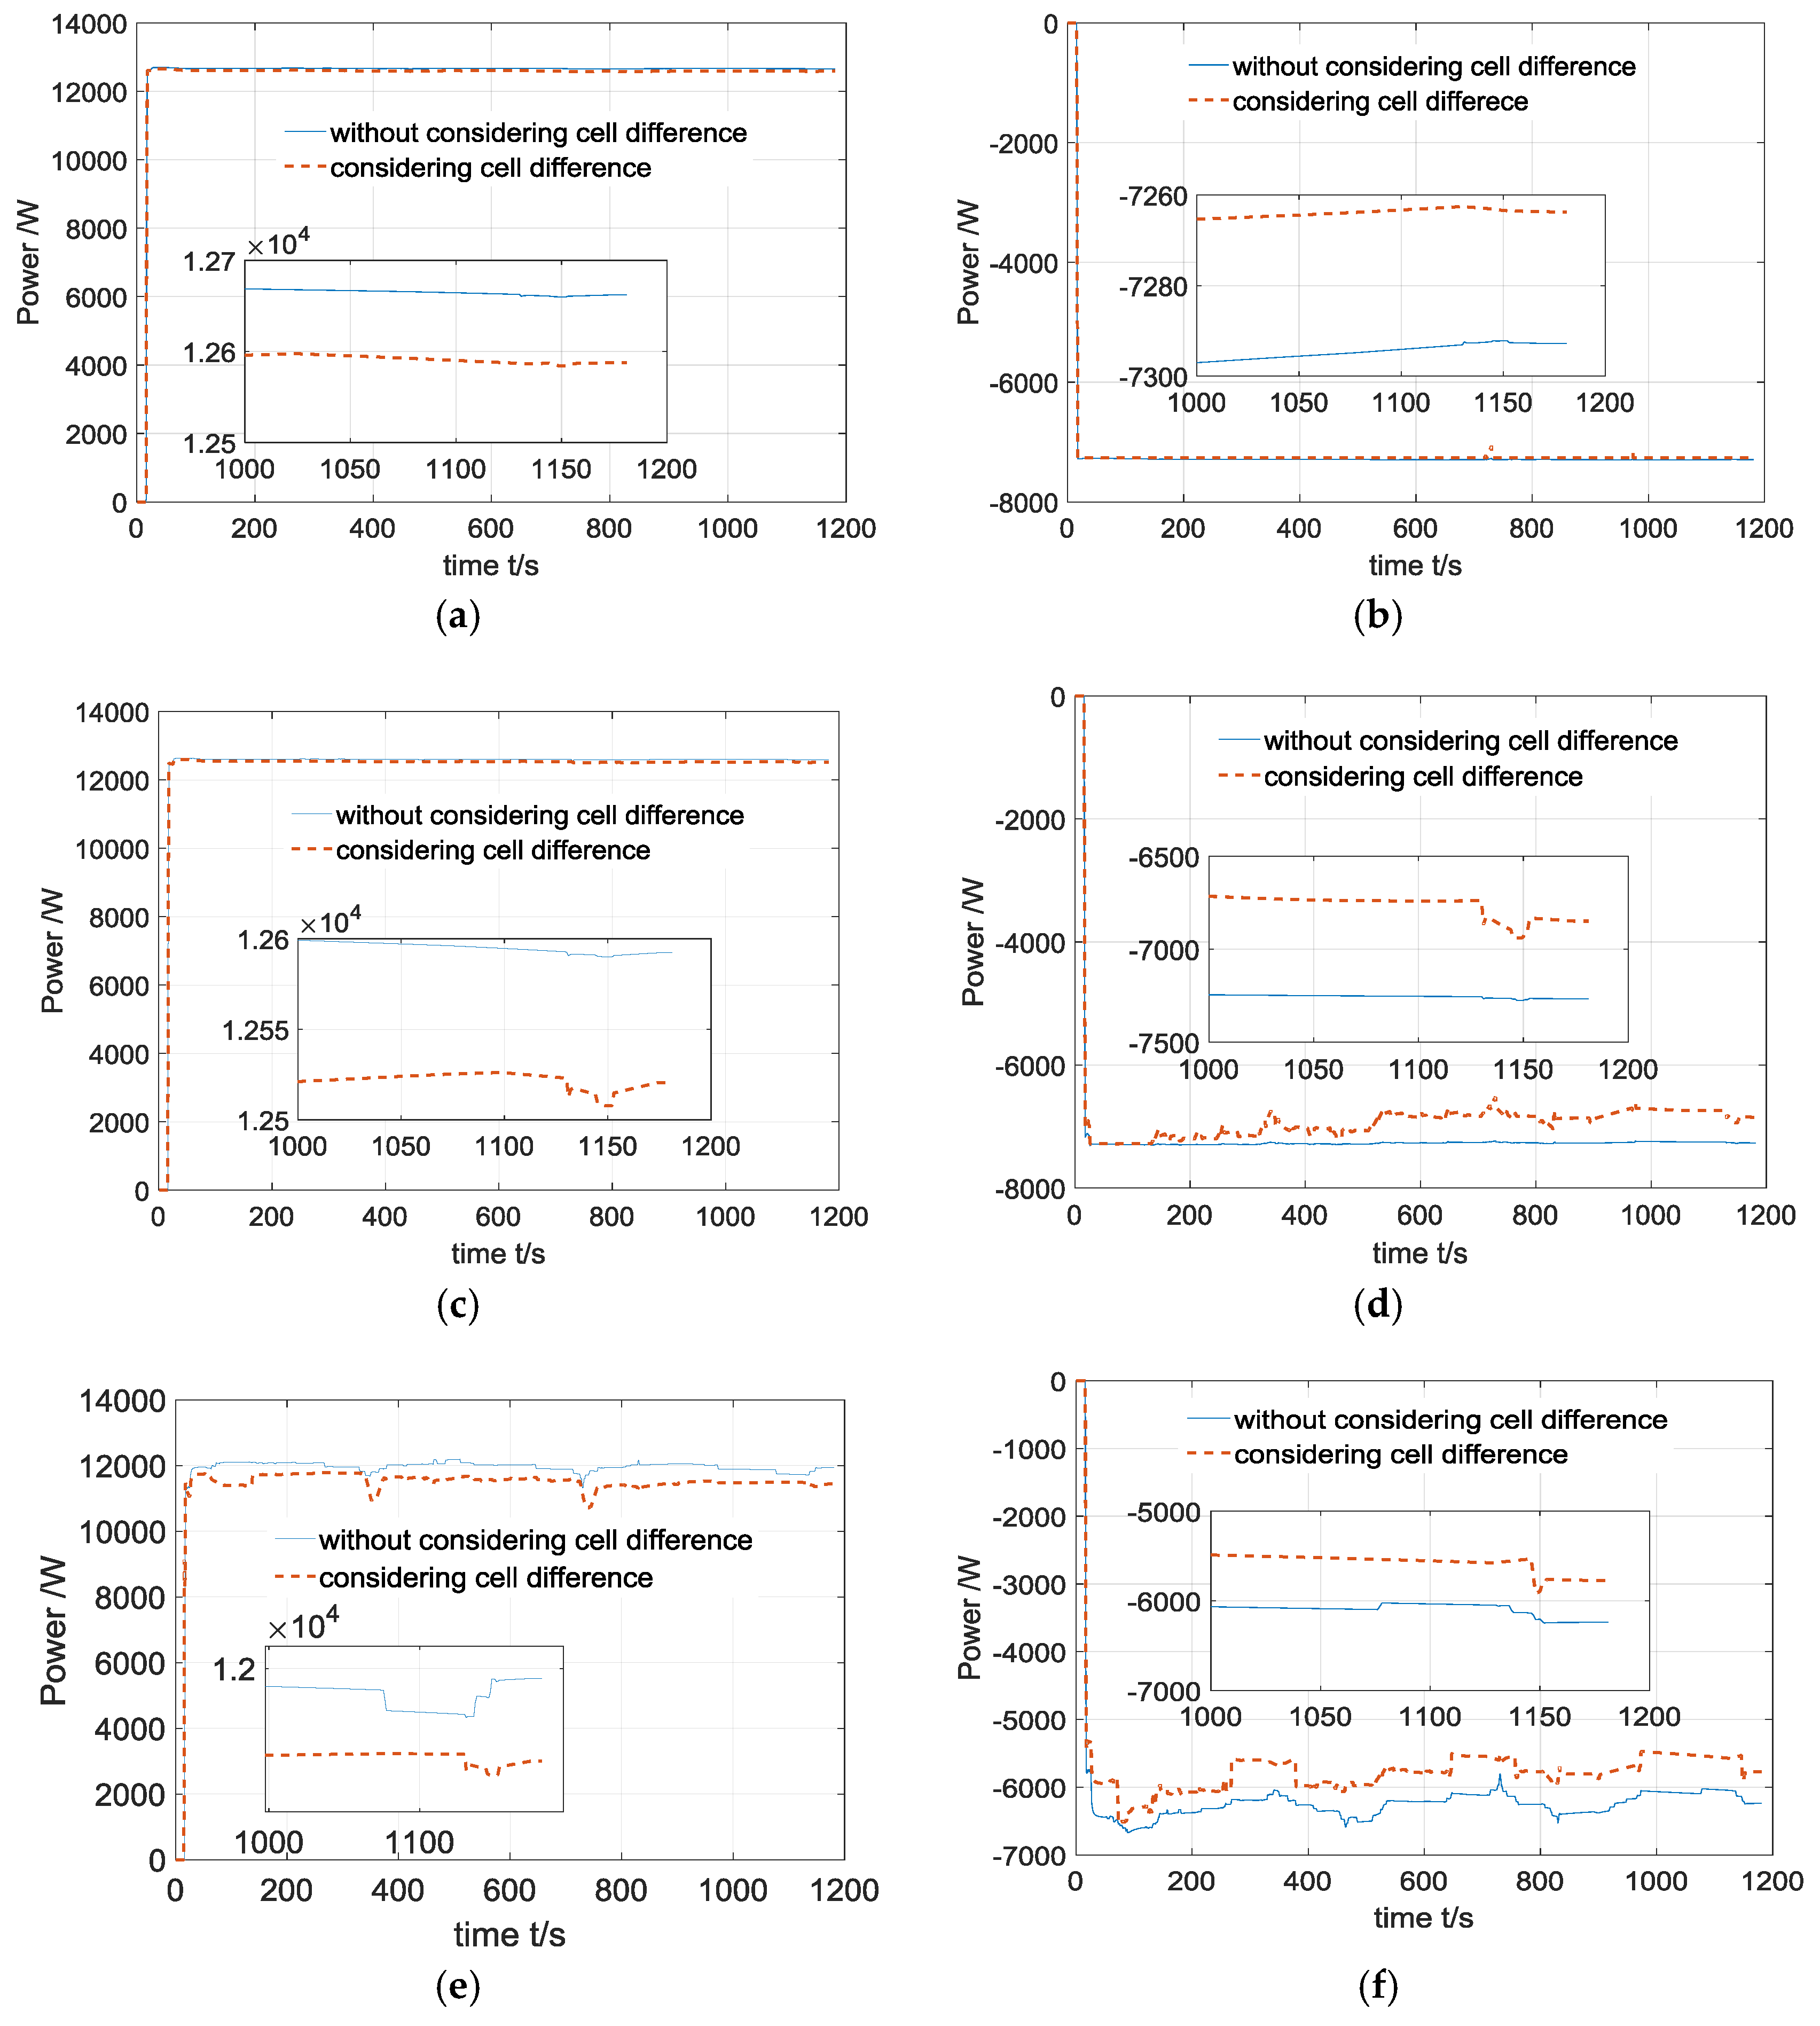
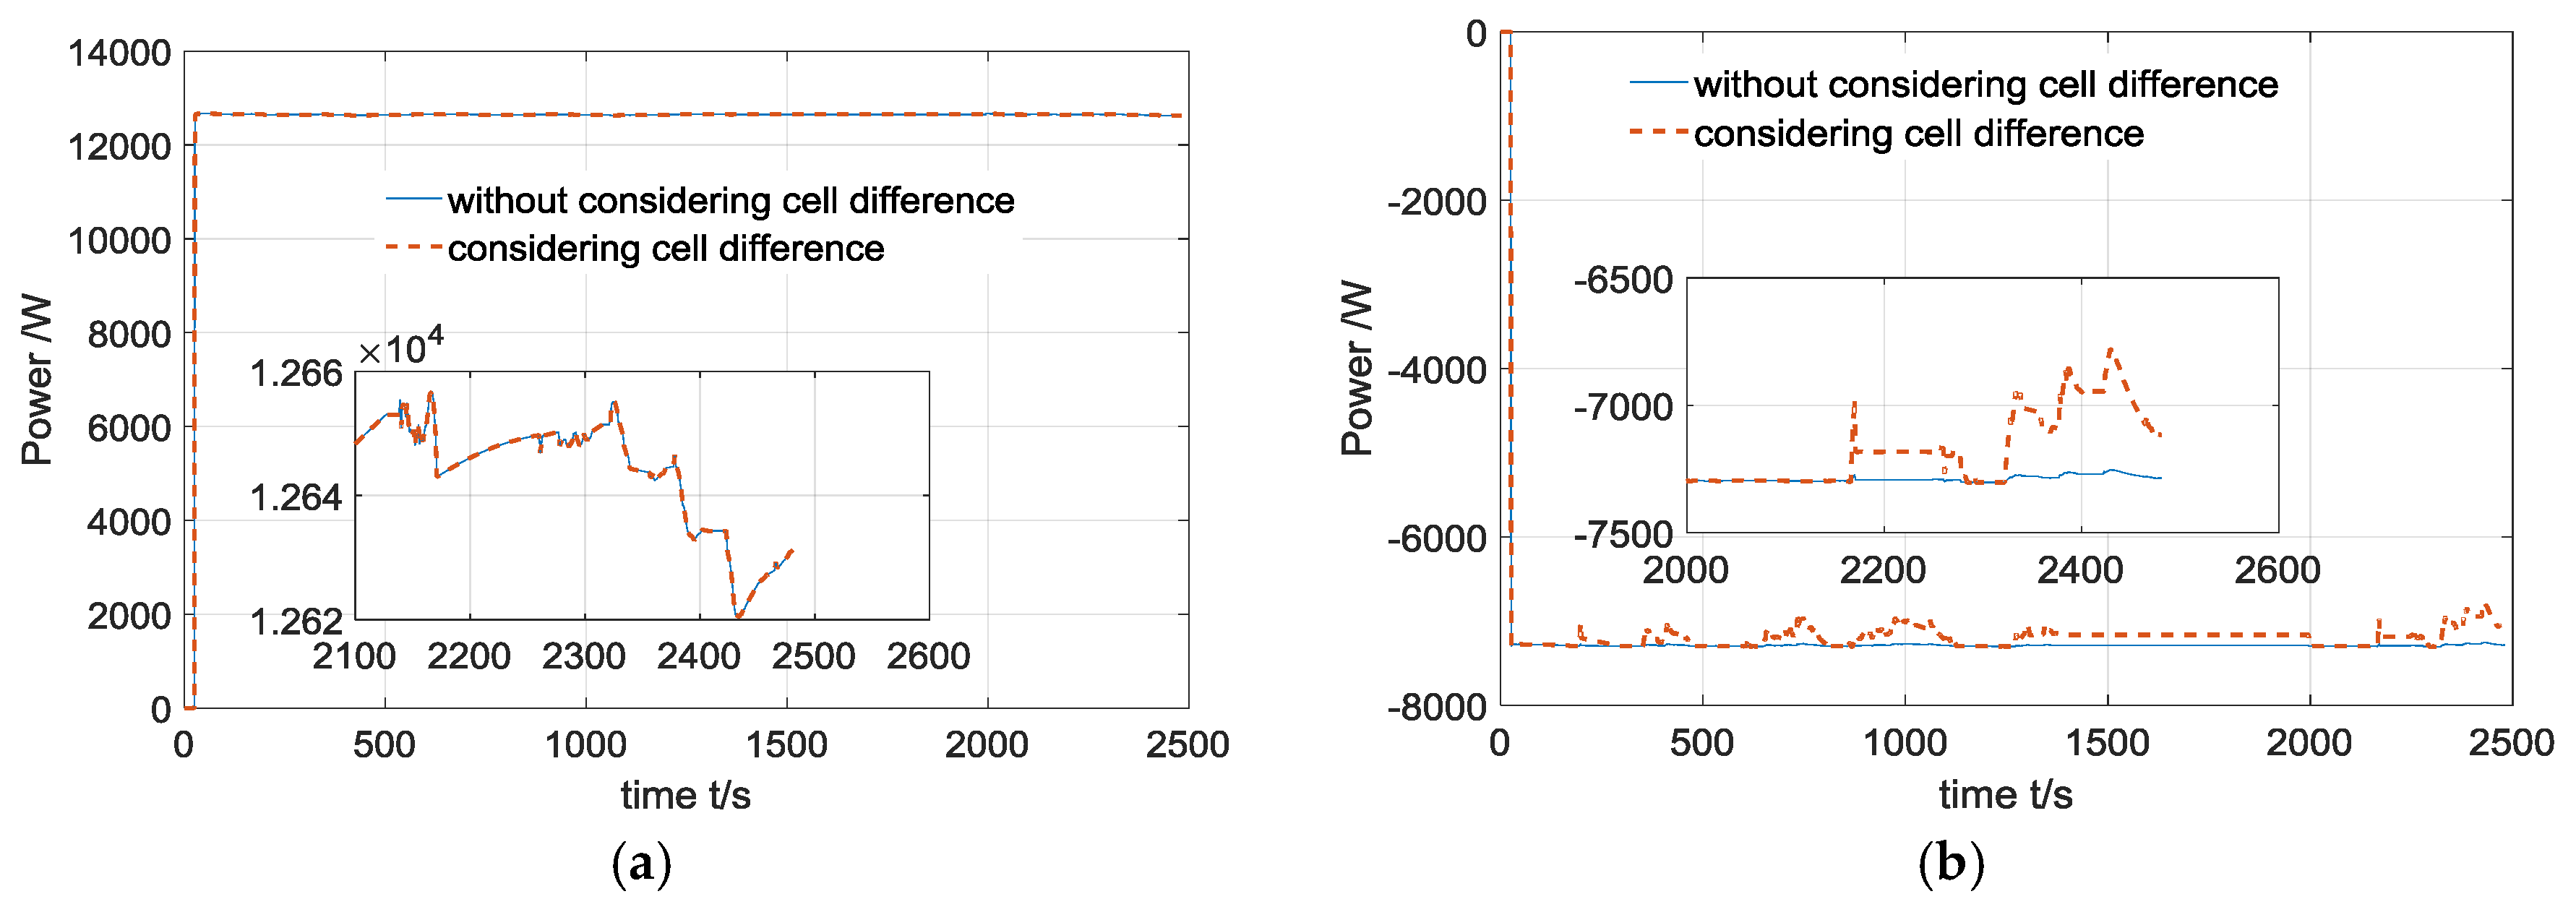
Figure 12 and Figure 13 show the peak power estimation results of the battery pack during the tests. Both the estimations with and without considering cell differences are shown in the figures. Some conclusions can be drawn from the results.
(1) The power capability of the battery pack is firstly influenced by the required power duration; the longer the duration required, the smaller the power capability will be. The power capability lasting for 1 s is obviously larger than the power capabilities lasting for 10 s and 30 s. This is reasonable because during charge/discharge, the impedance caused by the internal polarization of the battery plays a more and more dominant role, which limits the power capability of the batteries. This can also be deduced from Equations (8) and (10).
(2) In the middle SOC range, the charging power capability is smaller than the discharging power capability within the same condition. From Equations (8) and (10), we can see that, if the difference between the charge and discharge impedances is neglected, the main factors affecting charging and discharging power capabilities are the cut-off voltages, Umax and Umin. Generally, the difference between the OCV and Umin is much larger than the difference between the OCV and Umax, especially when the battery works in a middle SOC range, which makes the charging power capability smaller than the discharging power capability.
(3) During the aging process, the power capability of the battery pack is getting smaller. We can see this phenomenon by comparing the estimation results shown in Figure 12 and Figure 13. We can clearly find that the peak power estimations during the FTP-75 test are smaller than those during the NEDC test. As introduced above, between the FTP-75 and NEDC tests, there exist 50 full charge/discharge cycles, in which the impedances of the battery cells are getting larger. The larger impedance introduces a smaller power capability.
(4) Due to cell difference, the power estimation results considering cell difference are smaller than the estimation results without considering cell difference. This result supports the statement that, because of the cell difference, the peak power of the battery pack is limited by the characteristics of the weakest cell. In the estimation without considering cell difference, an equivalent battery module that consisted of mean battery cells is used (Figure 2). The performance of the mean cell will of course be better than the worst cell in the pack.
(5) The influence of the cell difference on the pack power capability is dependent on the power duration. For the charge/discharge powers with a 1 s duration, the influence of cell difference can be neglected. This means that, for instant power capability estimations, it is not necessary to consider the influence of cell difference. However, if the estimation of continuous power capability is needed, then the consideration of cell difference is critical. We can see from the results that, in the estimations of the 30 s power capability, the results considering cell difference are much smaller than those without considering cell difference. The phenomenon can actually be deduced from Equations (8) and (10). During the process of charge/discharge, the impedance caused by the internal polarization of the battery plays a more and more dominant role, limiting the power capability of the batteries. The difference of polarization impedance among the cells then affects the power capability more and more evidently as the current excitation continues.

5. Conclusions

This paper proposed a new method to online estimate the power capability of the battery packs composed of series-connected cells. The main contribution is that the cell inconsistency is considered in the estimation by designing a novel ratio vector-based parameter identification algorithm. The main conclusions and summarizations are drawn below.
(1) A ratio vector-based parameter identification algorithm is proposed which can achieve the same identification accuracy as the repetitive RLS-based identification while evidently reducing the computation cost. This facilitates the online implementation of the algorithm.
(2) Based on the ratio vector-based parameter identification, the estimation of the power capability of the battery pack composed of series-connected cells is further developed. Validation results indicate that the proposed method is effective to estimate the power capability considering cell difference.
(3) Due to cell difference, the power estimation considering cell difference is smaller than the estimation results without considering cell difference.
(4) The influence of the cell difference on the pack power capability is dependent on the power duration. For instant power capability estimations, it is not necessary to consider the influence of cell difference. However, if the estimation of continuous power capability is needed, the consideration of cell difference is critical.

Acknowledgments

This work is financially supported by the National Natural Science Foundation of China (NSFC, Grant No. 51677136).

Author Contributions

Bo Jiang performed the experiments and wrote the paper; Haifeng Dai conceived the idea and designed the experiments; Xuezhe Wei and Letao Zhu analyzed the data; Zechang Sun contributed helpful suggestions in the design of the algorithm. All authors read and approved the manuscript.

Conflicts of Interest

The authors declare no conflict of interest.

Nomenclature

UBBattery terminal voltage
UOCBattery open circuit voltage
IBBattery working current
ROOhmic resistance of the battery
UTHVoltage on network describing the charge transfer effect
RTHResistance of charge transfer
CTHDouble layer capacitor
UdDynamic voltage on the impedance under current excitation
ΔtSampling period
kSampling point
θParameter vector of the battery model
UmaxAllowed maximum voltage of the battery
UminAllowed minimum voltage of the battery
Imax,battAllowed maximum discharge current of the battery suggested by the battery suppliers
Imin,battAllowed maximum charge current of the battery suggested by the battery suppliers
Imax,voltAllowed maximum discharge current of the battery limited by voltage
Imin,voltAllowed maximum charge current of the battery limited by voltage
ROmOhmic resistance of the mean battery cell
RTHmCharge transfer resistance of the mean battery cell
CTHmEquivalent capacitor of charge transfer effect of the mean battery cell
UOVoltage on the ohmic resistance under current excitation
ΔUsmSudden voltage change during current pulse of the mean battery cell
ΔUsSudden voltage change during current pulse of the battery
AVector reflecting the difference of ohmic resistance
BVector reflecting the difference of time constant of charge transfer effect
CVector reflecting the difference of charge transfer resistance
Δ U s p r e Predicted sudden voltage change during current pulse
NNumber of the battery cells connected in series
gAAdjustment gain for vector A
gBAdjustment gain for vector B
gCAdjustment gain for vector C
PsysminMaximum charge power of the battery system
PsysmaxMaximum discharge power of the battery system
K τ , k p r e Predicted ratio of the charge transfer voltages at sampling point k
K τ Ratio of charge transfer voltages
K R T H Ratio of the charge transfer resistance
K R T H , k p r e Predicted ratio of the charge transfer resistance at sampling point

References

  1. Lu, L.; Han, X.; Li, J.Q.; Hu, J.F.; Ouyang, M. Review on the key issues for lithium-ion battery management in electric vehicles. J. Power Source 2013, 226, 272–288. [Google Scholar] [CrossRef]
  2. Castaings, A.; Lhomme, W.; Trigui, R.; Bouscayrol, A. Comparison of energy management strategies of a battery/supercapacitors system for electric vehicle under real-time constraints. Appl. Energy 2016, 163, 190–200. [Google Scholar] [CrossRef]
  3. PNGV Battery Test Manual: Revision 3; US Department of Energy: Washington, DC, USA, 2001.
  4. Gregory, L.P. High-performance battery-pack power estimation using a dynamic cell model. IEEE Trans. Veh. Technol. 2004, 53, 1586–1593. [Google Scholar] [CrossRef]
  5. Waag, W.; Fleischer, C.; Sauer, D.U. Adaptive on-line prediction of the available power of lithium-ion batteries. J. Power Source 2013, 242, 548–559. [Google Scholar] [CrossRef]
  6. Sun, F.C.; Xiong, R.; He, H.W.; Li, W.Q.; Aussems, J.E.E. Model-based dynamic multi-parameter method for peak power estimation of lithium-ion batteries. Appl. Energy 2012, 96, 378–386. [Google Scholar] [CrossRef]
  7. Pei, L.; Zhu, C.B.; Wang, T.S.; Lu, R.G.; Chan, C.C. Online peak power prediction based on a parameter and state estimator for lithium-ion batteries in electric vehicles. Energy 2014, 66, 766–779. [Google Scholar] [CrossRef]
  8. Burgos-Mellado, C.; Orchard, M.E.; Kazerani, M.; Cardenas, R.; Saez, D. Particle-filtering-based estimation of maximum available power state in lithium-ion batteries. Appl. Energy 2016, 161, 349–363. [Google Scholar] [CrossRef]
  9. Xiong, R.; Sun, F.C.; He, H.W.; Nguyen, T.D. A data-driven adaptive state of charge and power capability a data-driven adaptive state of charge and power capability joint estimator of lithium-ion polymer battery used in electric vehicles. Energy 2013, 63, 295–308. [Google Scholar] [CrossRef]
  10. Zhang, W.; Shi, W.; Ma, Z.Y. Adaptive unscented Kalman filter based state of energy and power capability estimation approach for lithium-ion battery. J. Power Source 2015, 289, 50–62. [Google Scholar] [CrossRef]
  11. Malysz, P.; Ye, J.; Gu, R.; Yang, H.; Emadi, A. Battery state-of-power peak current calculation and verification using an asymmetric parameter equivalent circuit model. IEEE Trans. Veh. Tech. 2016, 65, 4512–4522. [Google Scholar] [CrossRef]
  12. Wang, S.Q.; Verbrugge, M.; Wang, J.S.; Liu, P. Power prediction from a battery state estimator that incorporates diffusion resistance. J. Power Source 2012, 214, 399–406. [Google Scholar] [CrossRef]
  13. Waag, W.; Fleischer, C.; Sauer, D.U. Critical review of the methods for monitoring of lithium-ion batteries in electric and hybrid vehicles. J. Power Source 2014, 258, 321–339. [Google Scholar] [CrossRef]
  14. Bohlen, O.; Gerschler, J.B.; Sauer, D.U. Robust algorithms for a reliable battery diagnosis-managing batteries in hybrid electric vehicles. In Proceedings of the 22nd Electric Vehicle Symposium (EVS22), Yokohama, Japan, 23–28 October 2006.
  15. Kim, D.Y.; Jung, D.Y. Method of Estimating Maximum Output of Battery for Hybrid Electric Vehicle. U.S. Patent 7,518,375 B2, 14 April 2009. [Google Scholar]
  16. Duong, V.H.; Bastawrous, H.A.; Lim, K.C.; See, K.W.; Zhang, P.; Dou, S.X. Online state of charge and model parameters estimation of LiFePO4 battery in electric vehicles using multiple adaptive forgetting factors recursive least-squares. J. Power Source 2015, 296, 215–224. [Google Scholar] [CrossRef]
  17. Wei, Z.B.; Lim, T.M.; Skyllas-Kazacos, M.; Wai, N.; Tseng, K.J. Online state of charge and model parameter co-estimation based on a novel multi-time scale estimator for vanadium redox flow battery. Appl. Energy 2016, 172, 169–179. [Google Scholar] [CrossRef]
  18. Plett, L.G. Extended Kalman filtering for battery management systems of LiPB-based HEV battery packs: Part 2. Modeling and identification. J. Power Source 2004, 134, 262–276. [Google Scholar] [CrossRef]
  19. Dai, H.F.; Wei, X.Z.; Sun, Z.C. Recursive parameter identification of lithium-ion battery for EVs based on equivalent circuit model. J. Comput. Theor. Nanosci. 2013, 10, 2813–2818. [Google Scholar] [CrossRef]
  20. Zou, Y.; Hu, X.S.; Ma, H.M.; Li, S.E. Combined state of charge and state of health estimation over lithium-ion battery cell cycle lifespan for electric vehicles. J. Power Source 2015, 273, 793–803. [Google Scholar] [CrossRef]
  21. Nejad, S.; Gladwin, D.T.; Stone, D.A. A systematic review of lump-parameter equivalent circuit models for real-time estimation of lithium-ion battery states. J. Power Source 2016, 316, 183–196. [Google Scholar] [CrossRef]
  22. Feng, T.H.; Yang, L.; Zhao, X.W.; Zhang, H.D.; Qiang, J.X. Online identification of lithium-ion battery parameters based on an improved equivalent-circuit model and its implementation on battery state-of-power prediction. J. Power Source 2015, 281, 192–203. [Google Scholar] [CrossRef]
  23. Sun, F.; Xiong, R.; He, H. A systematic state-of-charge estimation framework for multi-cell battery pack in electric vehicles using bias correction technique. Appl. Energy 2016, 162, 1399–1409. [Google Scholar] [CrossRef]
  24. Lim, K.C.; Bastawrous, H.A.; Duong, V.H.; See, K.W.; Zhang, P.; Dou, S.X. Fading Kalman filter-based real-time state of charge estimation in LiFePO4 battery-powered electric vehicles. Appl. Energy 2016, 169, 40–48. [Google Scholar] [CrossRef]
  25. Partovibakhsh, M.; Liu, G.J. An adaptive unscented Kalman filtering approach for online estimation of model parameters and state-of-charge of lithium-ion batteries for autonomous mobile robots. IEEE Trans. Control Syst. Technol. 2015, 23, 357–363. [Google Scholar] [CrossRef]
  26. Chen, C.; Xiong, R.; Shen, W. A lithium-ion battery-in-the-loop approach to test and validate multi-scale dual H infinity filters for state of charge and capacity estimation. IEEE Trans. Power Electr. 2017. [Google Scholar] [CrossRef]
  27. Hua, Y.; Cordoba-Arenas, A.; Warner, N.; Rizzoni, G.A. multi time-scale state-of-charge and state-of-health estimation framework using nonlinear predictive filter for lithium-ion battery pack with passive balance control. J. Power Source 2015, 280, 293–312. [Google Scholar] [CrossRef]
  28. Dai, H.A.; Wei, X.Z.; Sun, Z.C.; Wang, J.Y.; Gu, W.J. Online cell SOC estimation of Li-ion battery packs using a dual time-scale Kalman filtering for EV applications. Appl. Energy 2012, 95, 227–237. [Google Scholar] [CrossRef]
  29. Roscher, M.A.; Bohlen, O.S.; Sauer, D.U. Reliable state estimation of multicell lithium-ion battery systems. IEEE Trans. Energy Convers. 2011, 26, 7373–7743. [Google Scholar] [CrossRef]
  30. Barre, A.; Deguilhem, B.; Grolleau, S.; Gerard, M.; Suard, F.; Riu, D. A review on lithium-ion battery ageing mechanisms and estimations for automotive applications. J. Power Source 2013, 241, 680–689. [Google Scholar] [CrossRef]
  31. Waag, W.; Kabitz, S.; Sauer, D.U. Experimental investigation of the lithium-ion battery impedance characteristic at various conditions and aging states and its influence on the application. Appl. Energy 2013, 102, 885–897. [Google Scholar] [CrossRef]
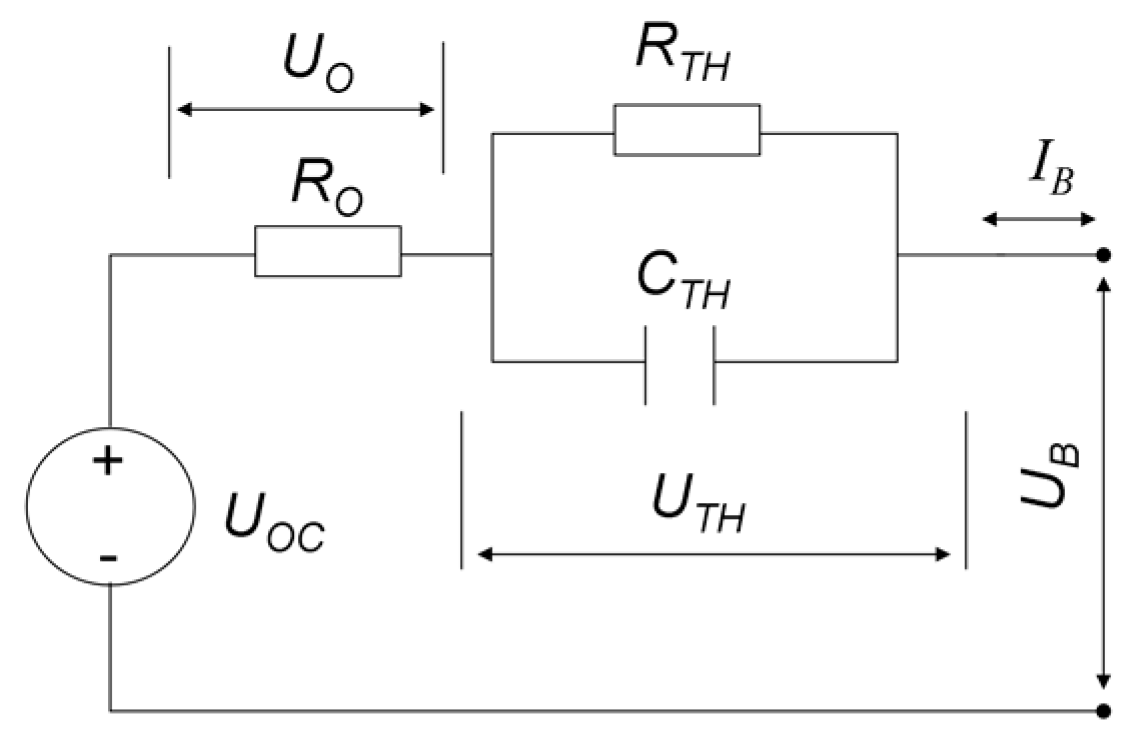
Figure 1. The equivalent circuit model.
Energies 10 00390 g001
Figure 2. Peak power estimation of a single battery cell. SOC: state of charge; and OCV: open circuit voltage.
Energies 10 00390 g002
Figure 3. A simplified battery pack consisting of two series-connected individual cells.
Energies 10 00390 g003
Figure 4. Voltage and ohmic resistance of the two cells: (a) voltage of the two cells; and (b) ohmic resistance of the two cells.
Energies 10 00390 g004
Figure 5. Calculation process of ratio vector B and ratio vector C.
Energies 10 00390 g005
Figure 6. Power estimation of the battery pack consisting of series-connect battery cells considering cell difference.
Energies 10 00390 g006
Figure 7. Current profiles of the tests: (a) current profile of the J1015 cycle test; (b) current profile of the New European Driving Cycle (NEDC) cycle test; and (c) current profile of the Federal Test Procedure-75 (FTP-75) cycle test.
Energies 10 00390 g007
Figure 8. The overall test procedure.
Energies 10 00390 g008
Figure 9. Identified parameters under the NEDC cycle test: (a) RO identified by the repetitive recursive least squares (RLS); (b) RO identified by the proposed new method; (c) RTH identified by the repetitive RLS; (d) RTH identified by the proposed new method; (e) CTH identified by the repetitive RLS; and (f) CTH identified by the proposed new method.
Energies 10 00390 g009aEnergies 10 00390 g009b
Figure 10. Identified parameters under the J1015 cycle test: (a) RO identified by the repetitive RLS; (b) RO identified by the proposed new method; (c) RTH identified by the repetitive RLS; (d) RTH identified by the proposed new method; (e) CTH identified by the repetitive RLS; and (f) CTH identified by the proposed new method.
Energies 10 00390 g010
Figure 11. Identified parameters under the FTP-75 cycle test: (a) RO identified by the repetitive RLS; (b) RO identified by the proposed new method; (c) RTH identified by the repetitive RLS; (d) RTH identified by the proposed new method; (e) CTH identified by the repetitive RLS; and (f) CTH identified by the proposed new method.
Energies 10 00390 g011
Figure 12. Power estimation results under the NEDC cycle test: (a) 1 s discharge power estimation result; (b) 1 s charge power estimation result; (c) 10 s discharge power estimation result; (d) 10 s charge power estimation result; (e) 30 s discharge power estimation result; and (f) 30 s charge power estimation result.
Energies 10 00390 g012
Figure 13. Power estimation results under the FTP75 cycle test: (a) 1 s discharge power estimation result; (b) 1 s charge power estimation result; (c) 10 s discharge power estimation result; (d) 10 s charge power estimation result; (e) 30 s discharge power estimation result; and (f) 30 s charge power estimation result.
Energies 10 00390 g013aEnergies 10 00390 g013b
Table 1. Basic information of the battery cell provided by the supplier.
No.ParameterValue
1Nominal capacity (Ah)80
2Nominal voltage (V)3.7
3Discharge cut-off voltage (V)2.8
4Charge cut-off voltage (V)4.2
5Allowed maximum 30 s pulse discharge current (15%–85% SOC) (A)480
6Allowed maximum 30 s pulse charge current (15%–85% SOC) (A)240
Table 2. Computation time cost of the identification algorithms.
Test CyclesComputation time of the RLS (s)Computation Time of the New Method (s)Time Reduced (%)
J10151.460.6754.1
NEDC2.741.2853.2
FTP755.712.6653.4