
Wave Energy Assessment along Sicilian Coastline, Based on DEIM Point Absorber


Abstract
:1. Introduction
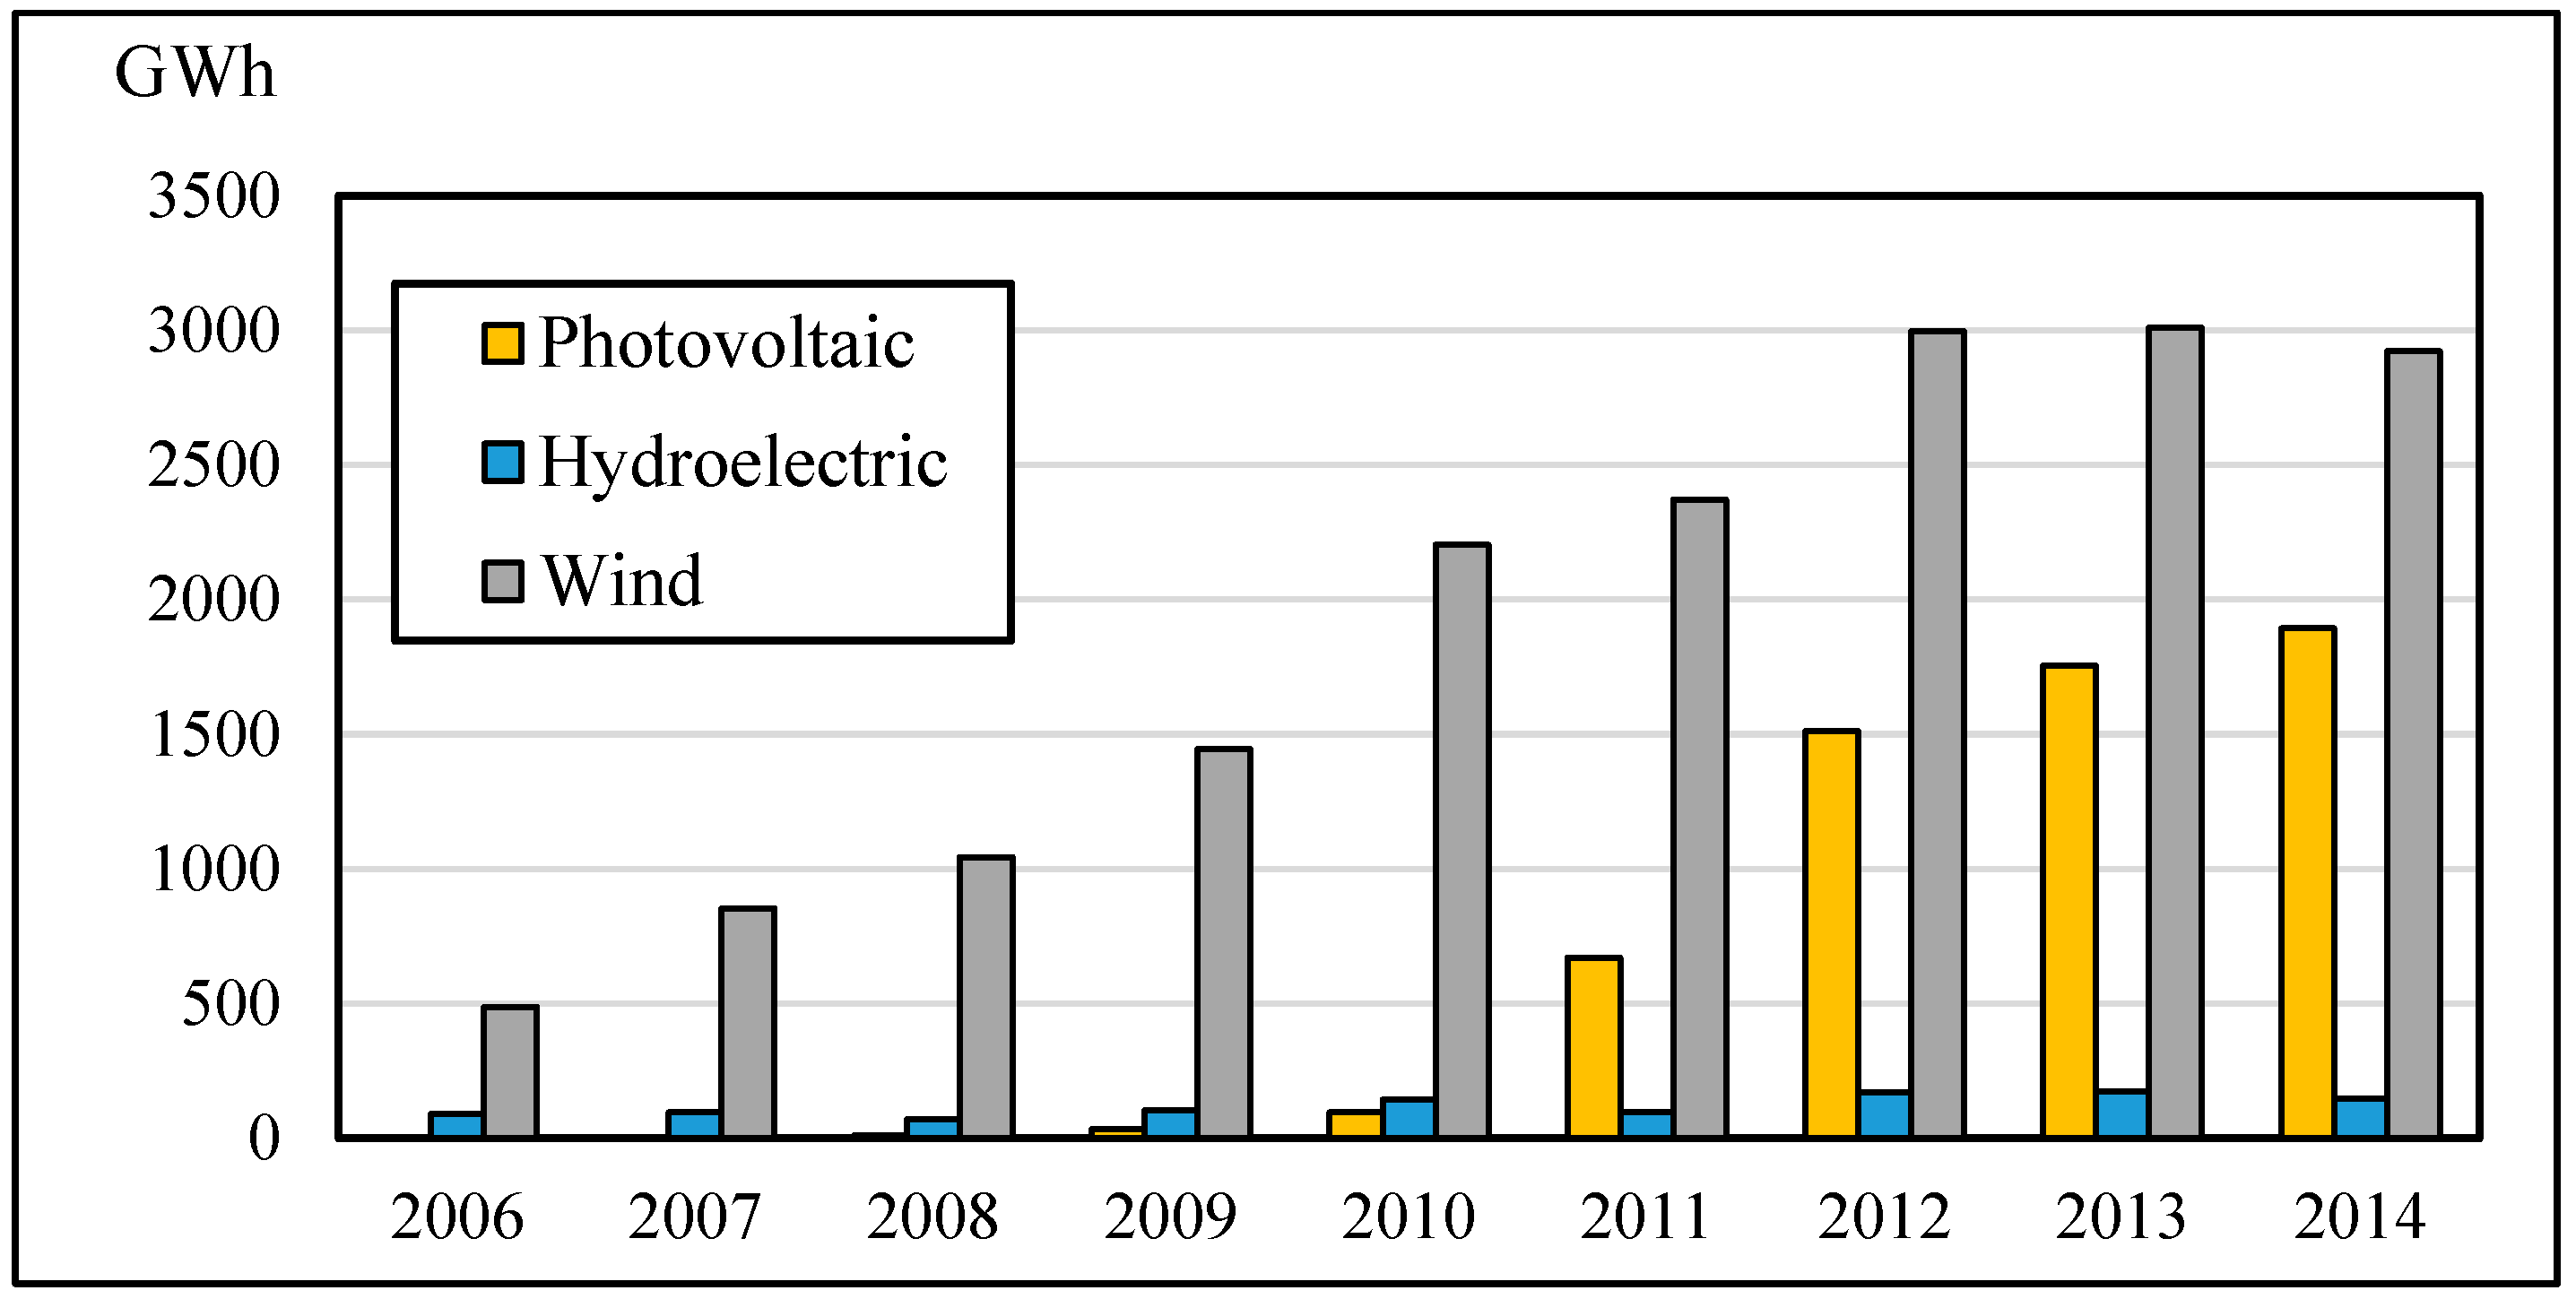
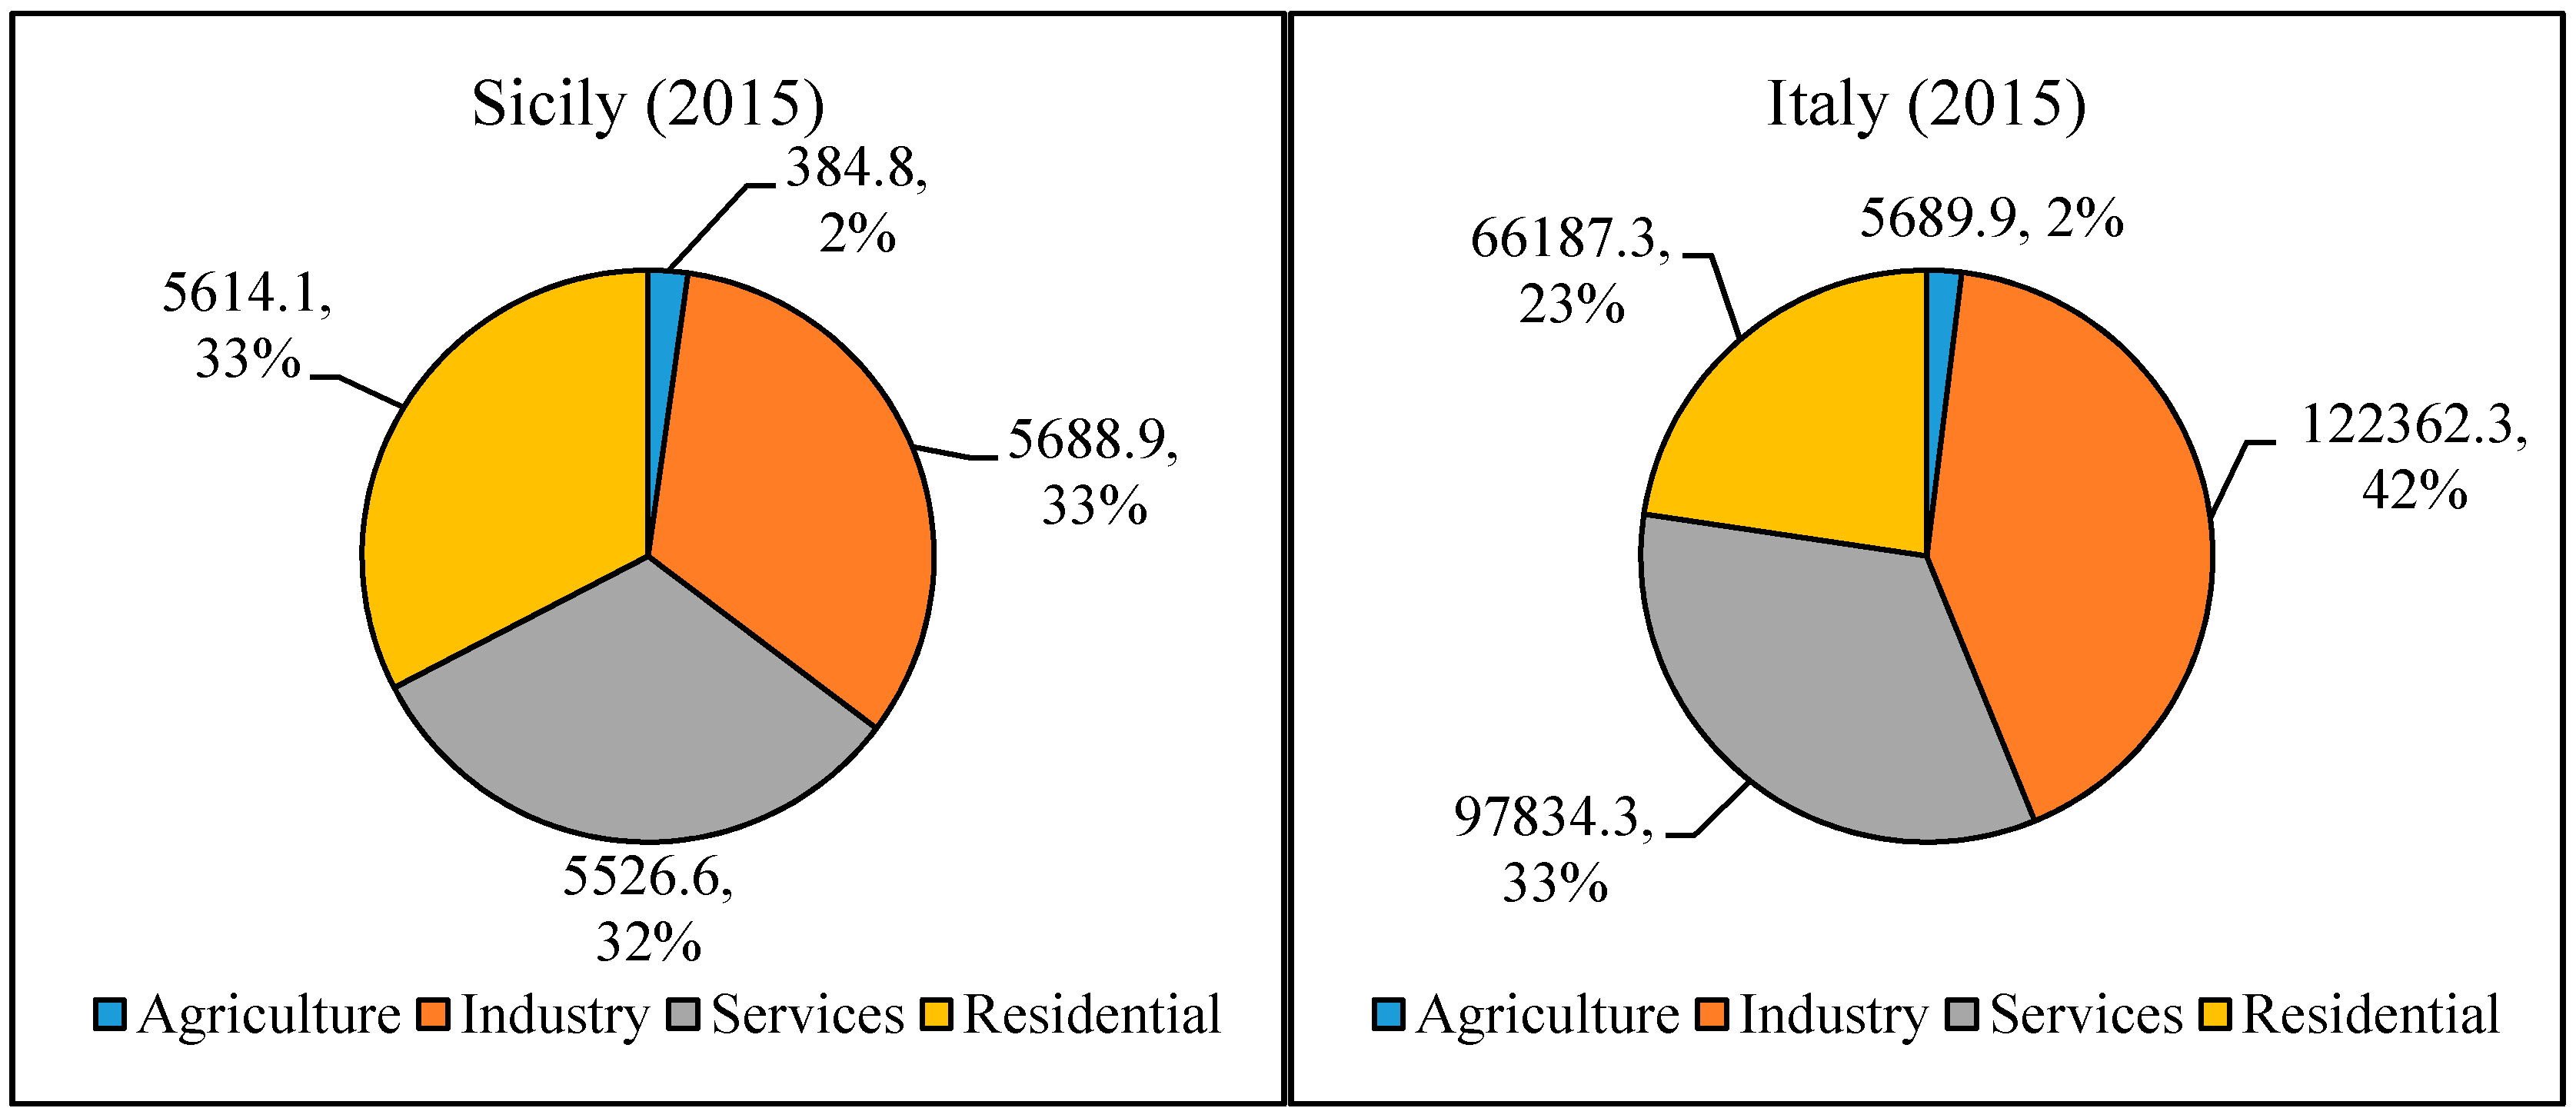
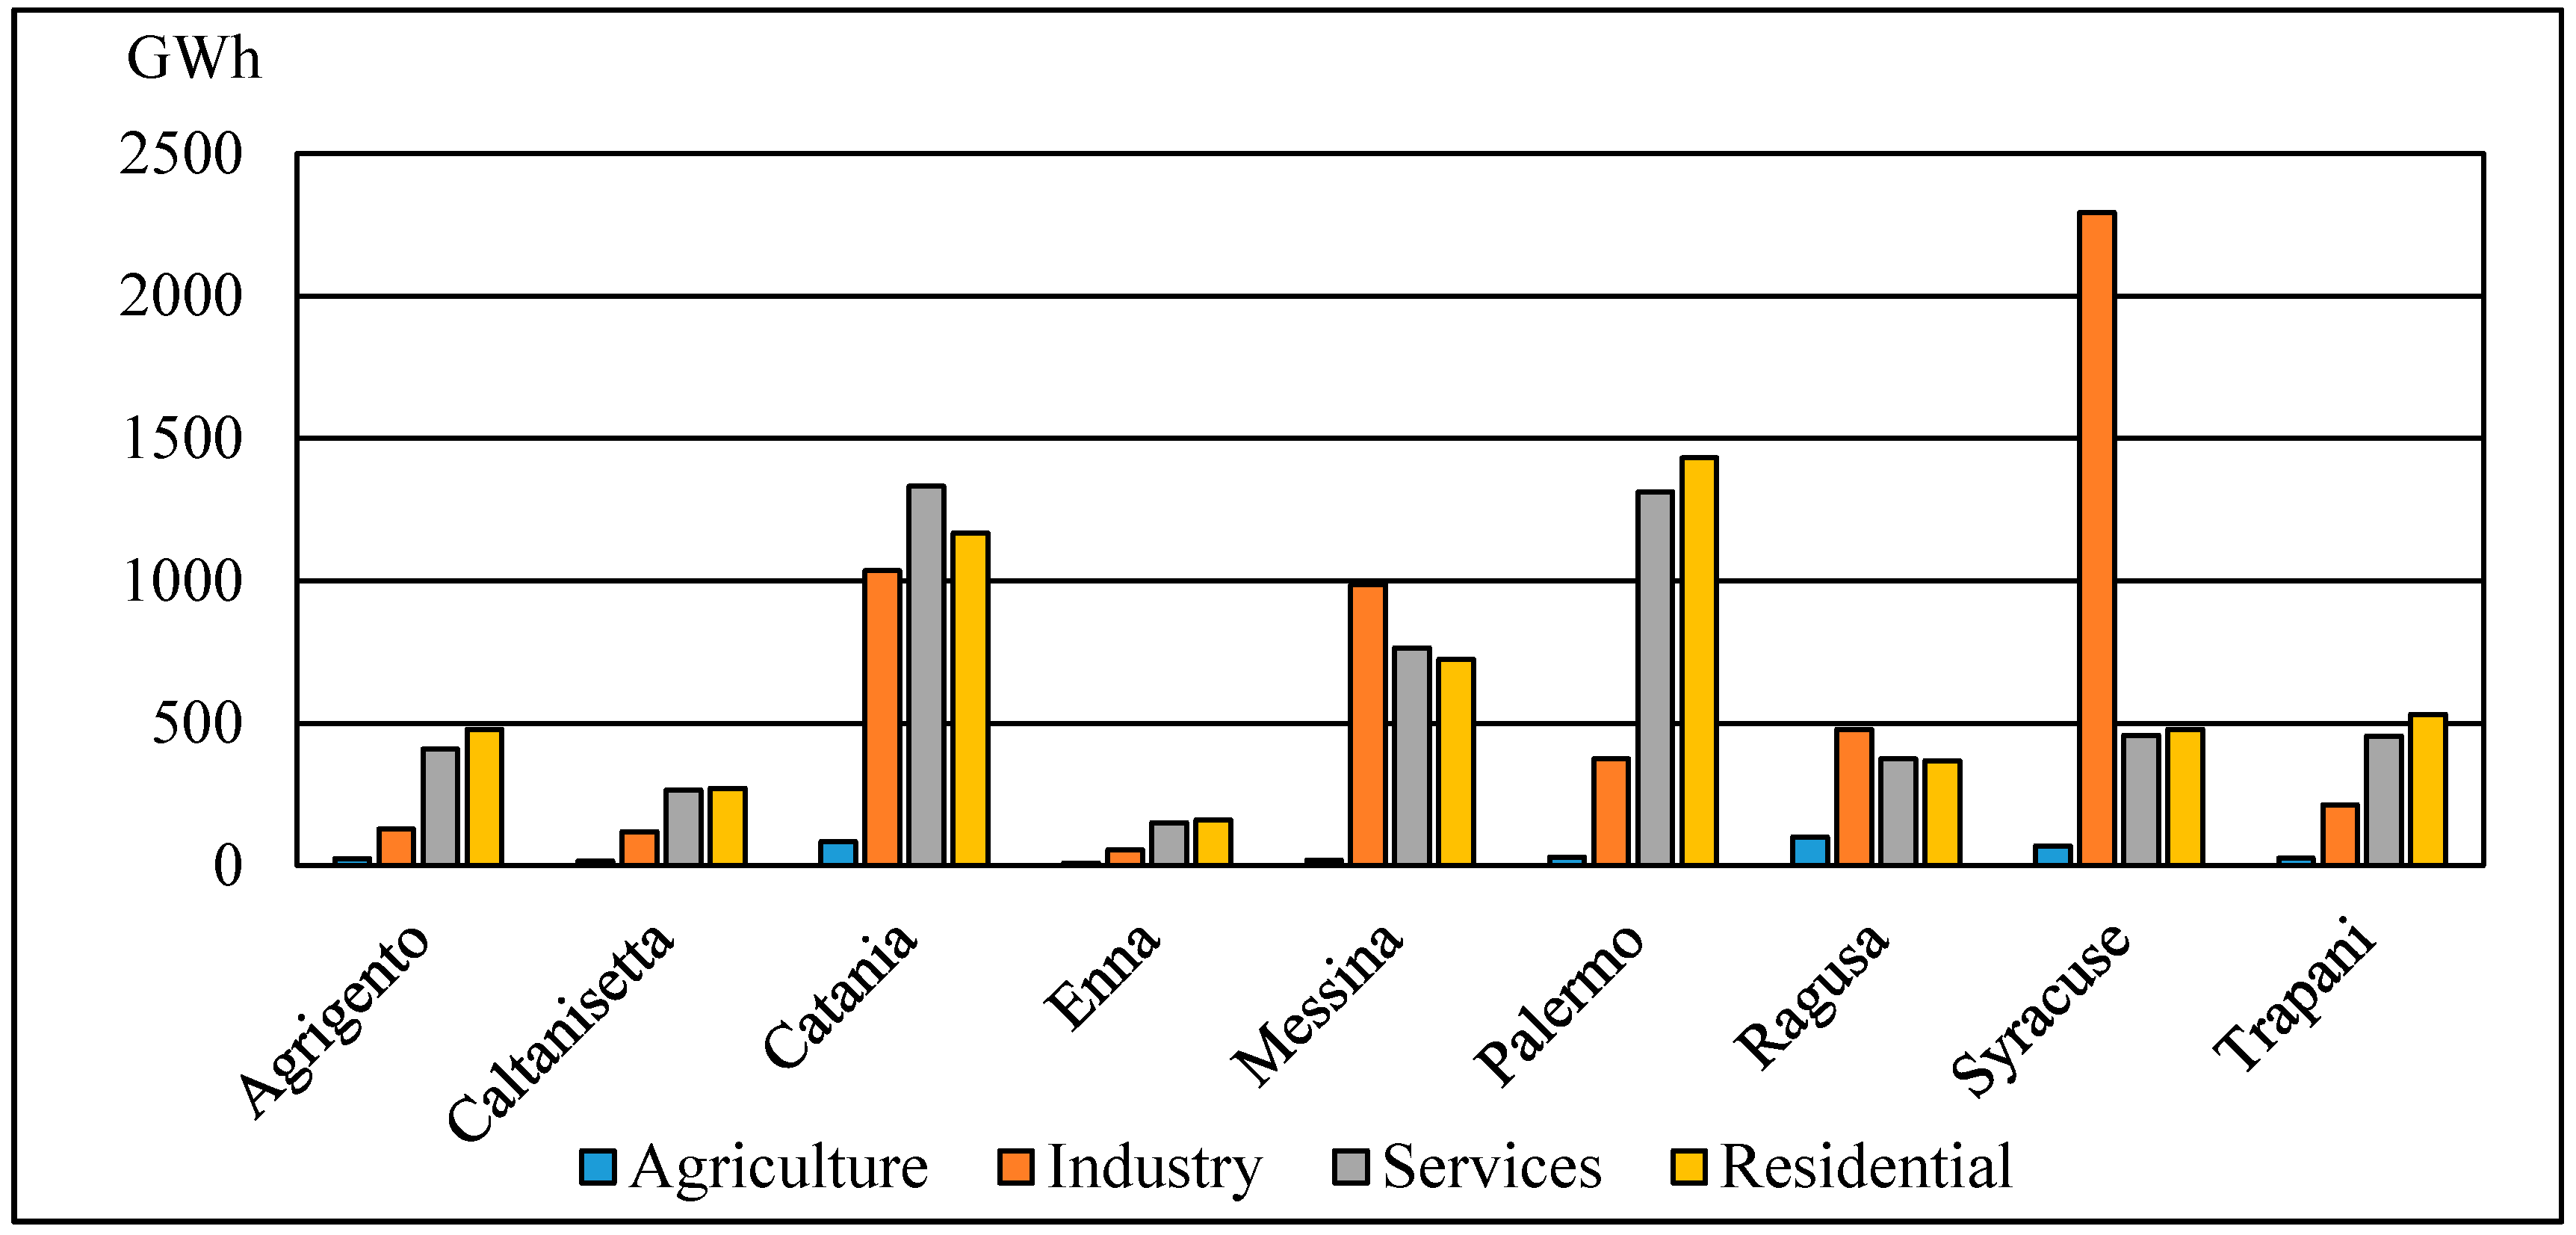
2. Energy Consumption and Renewable Energy Sources in Sicily
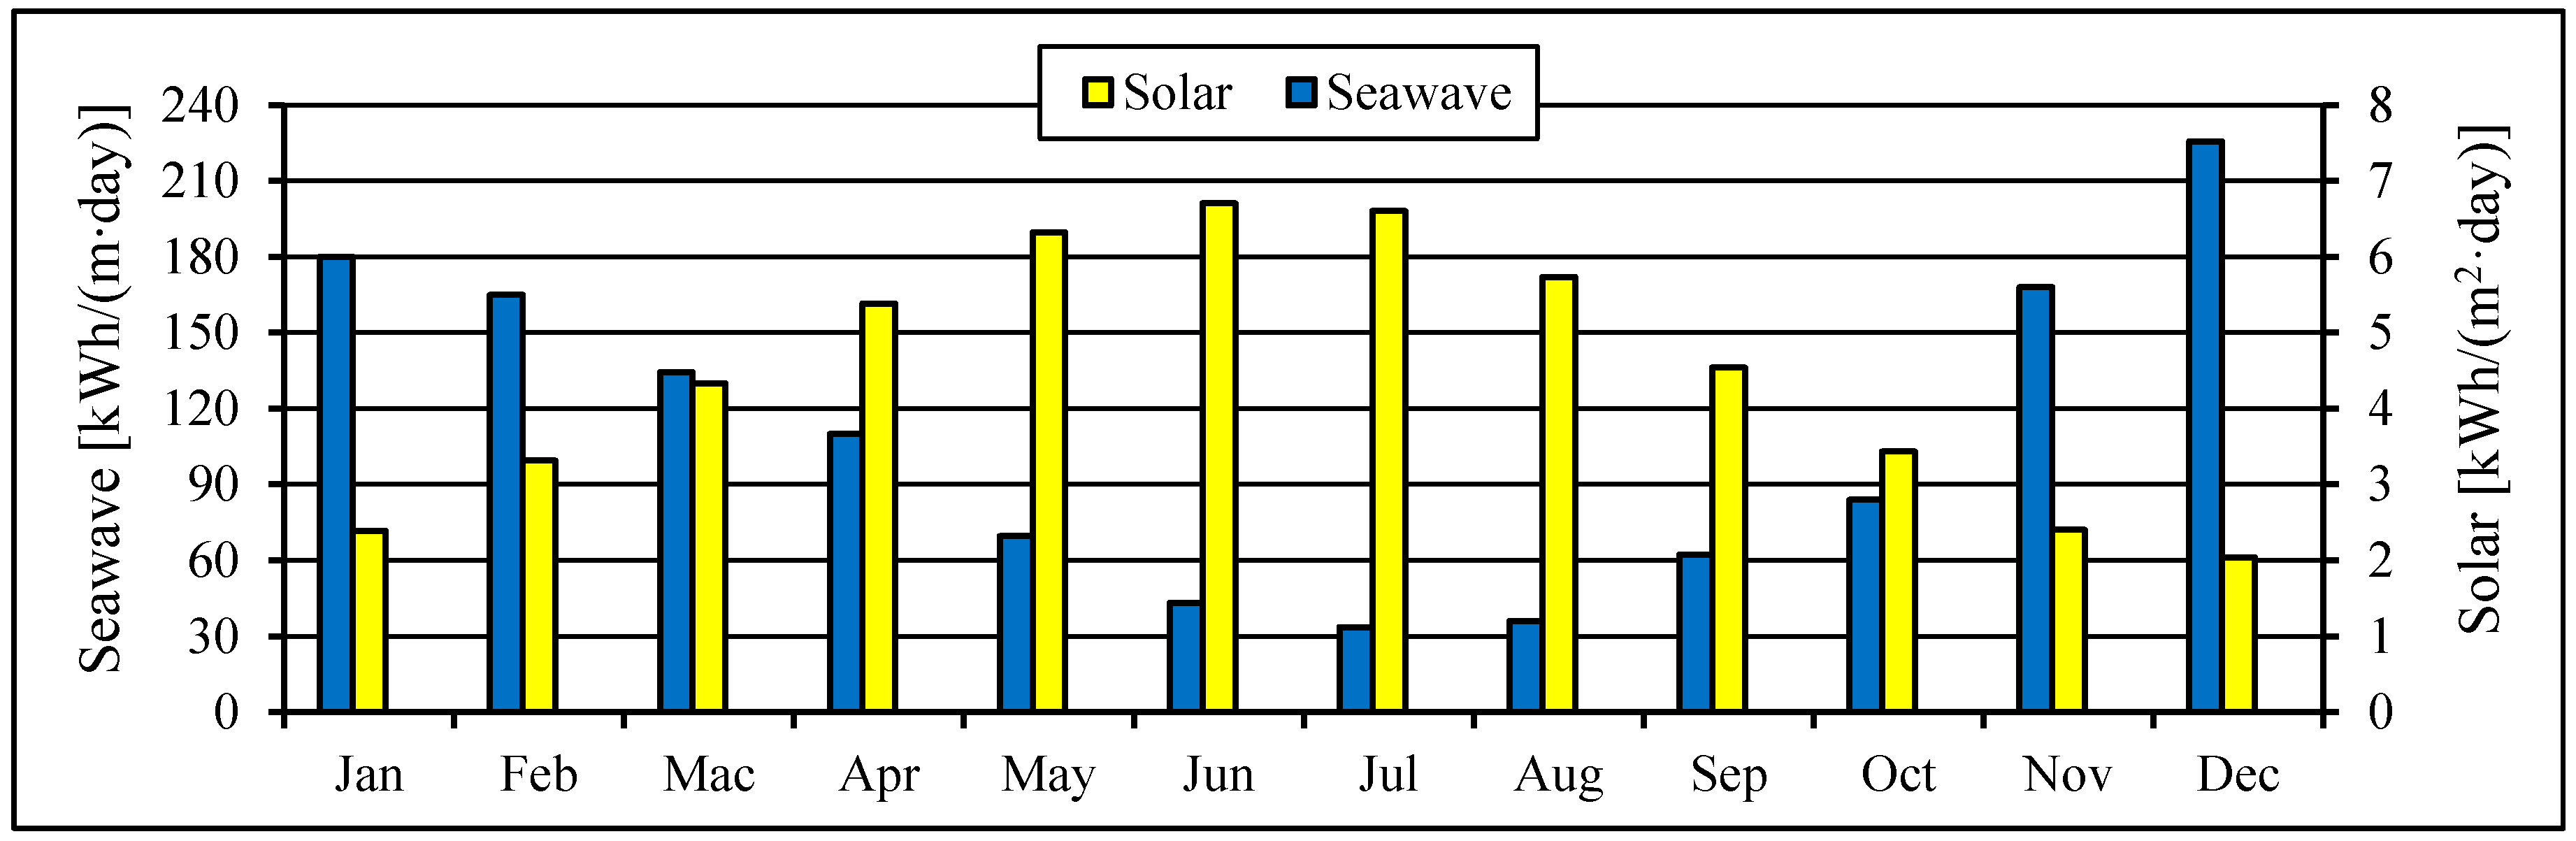
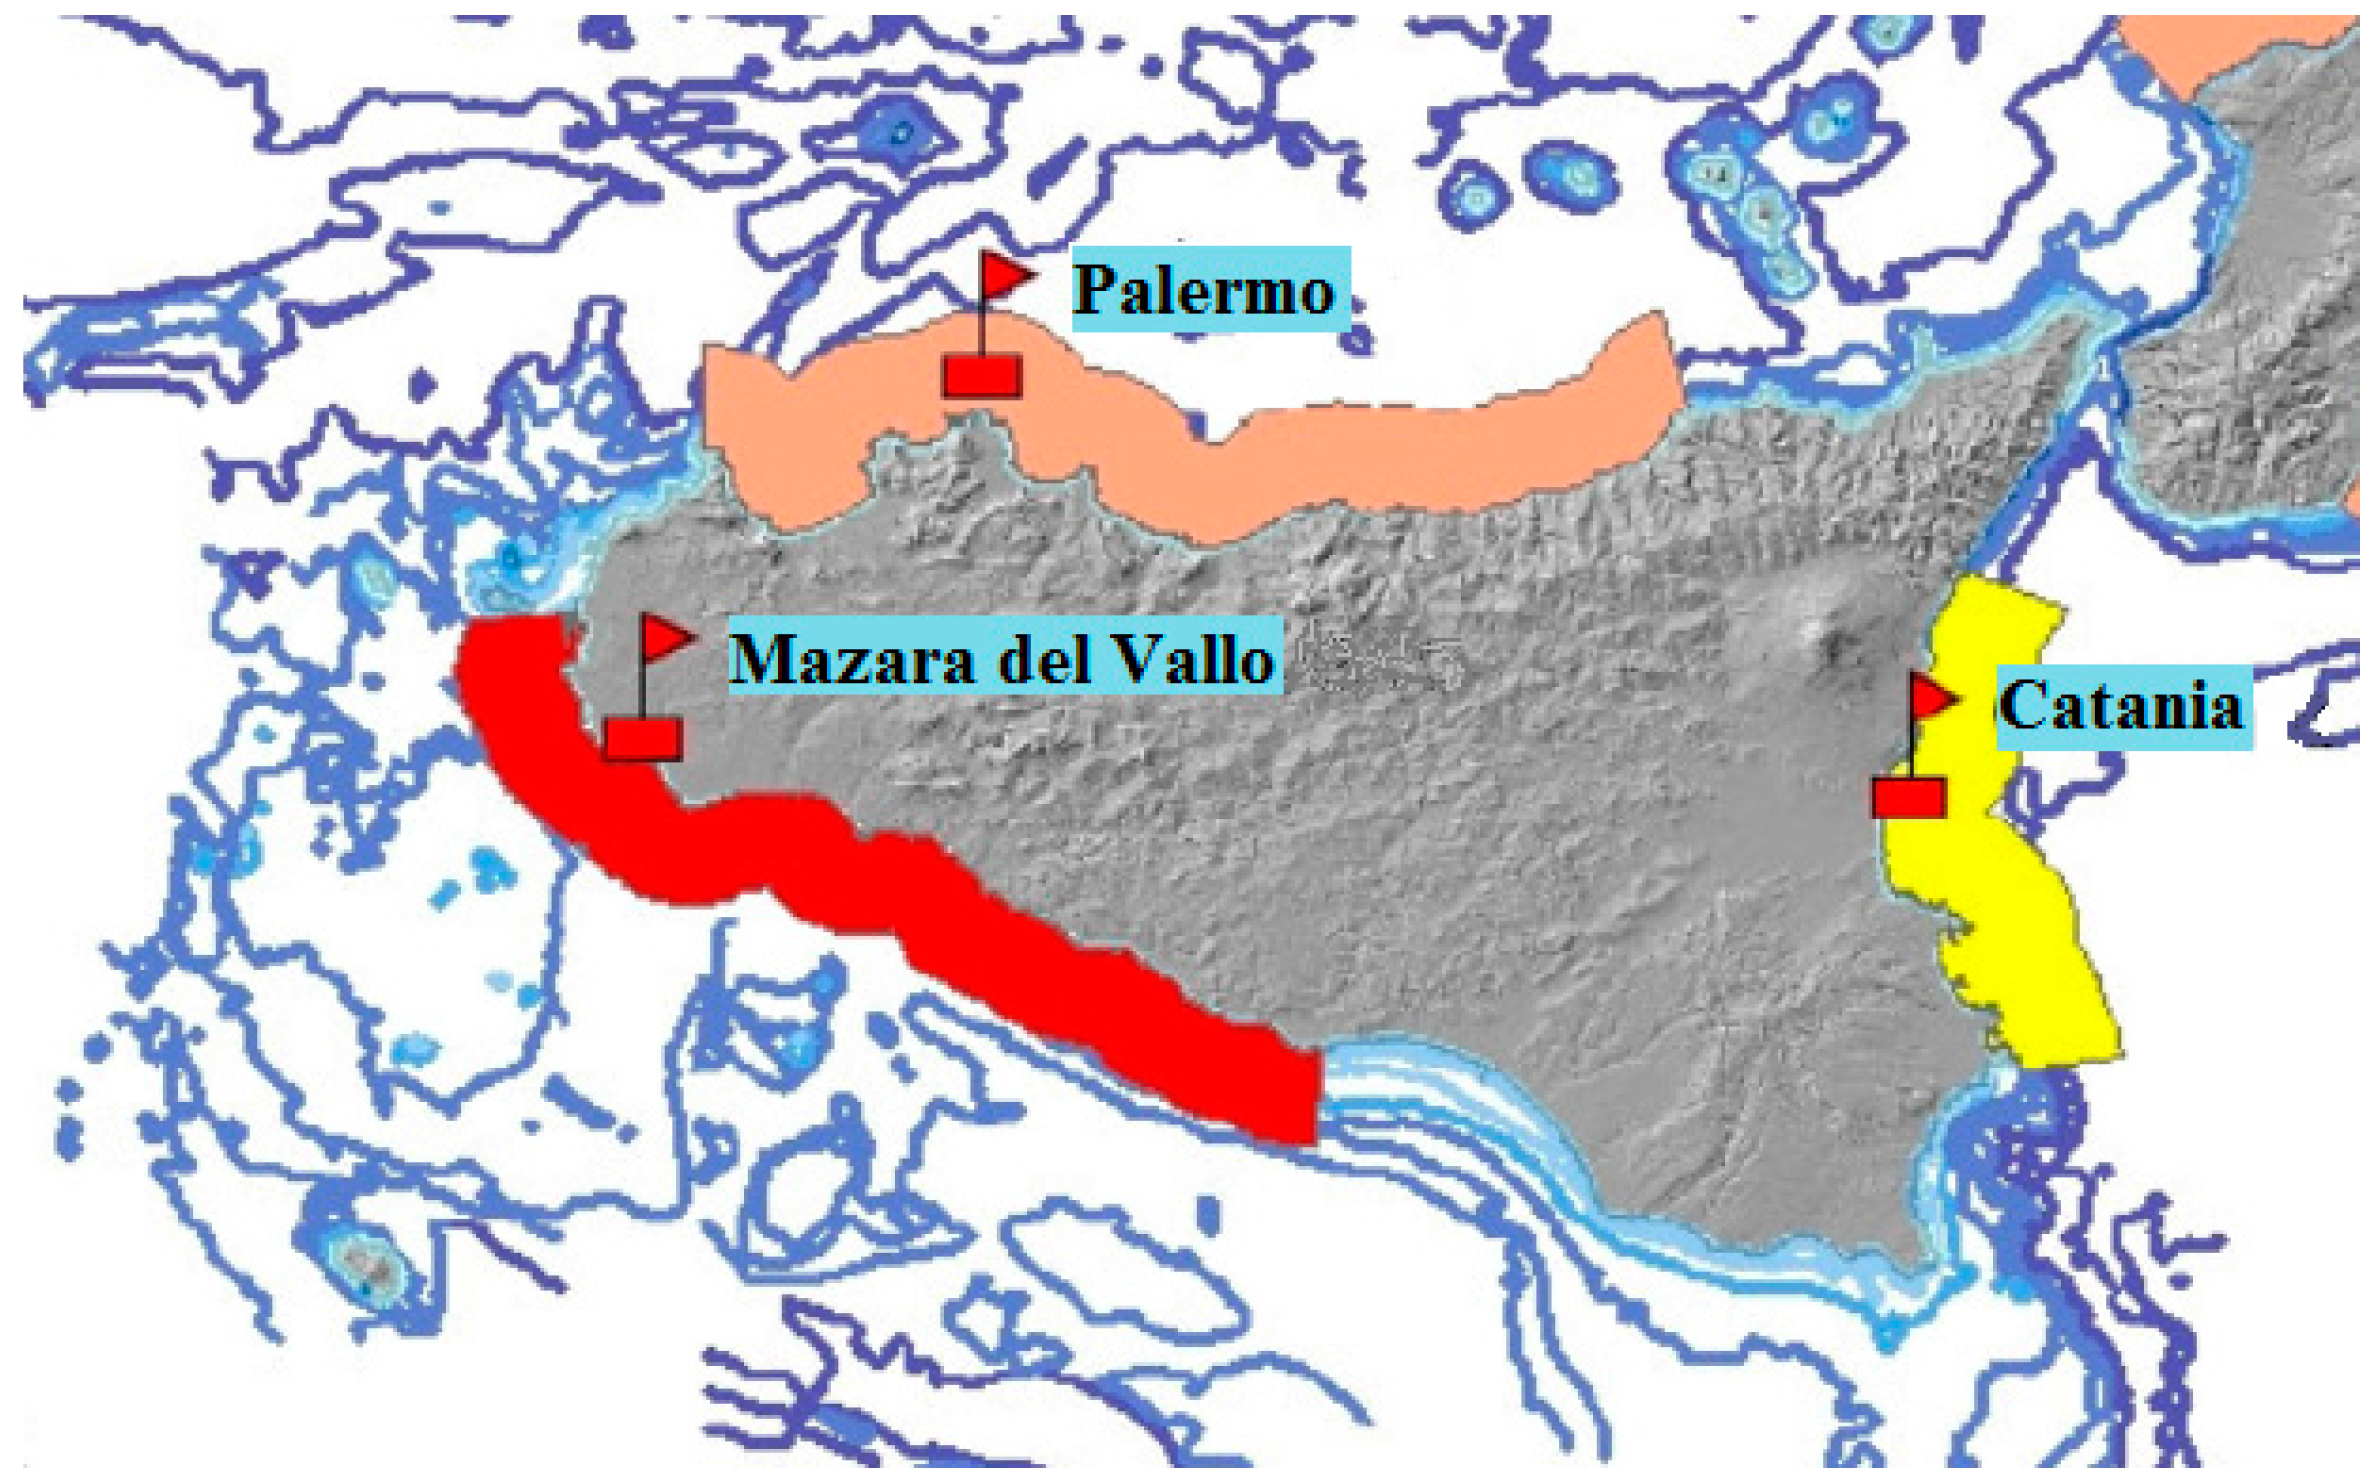
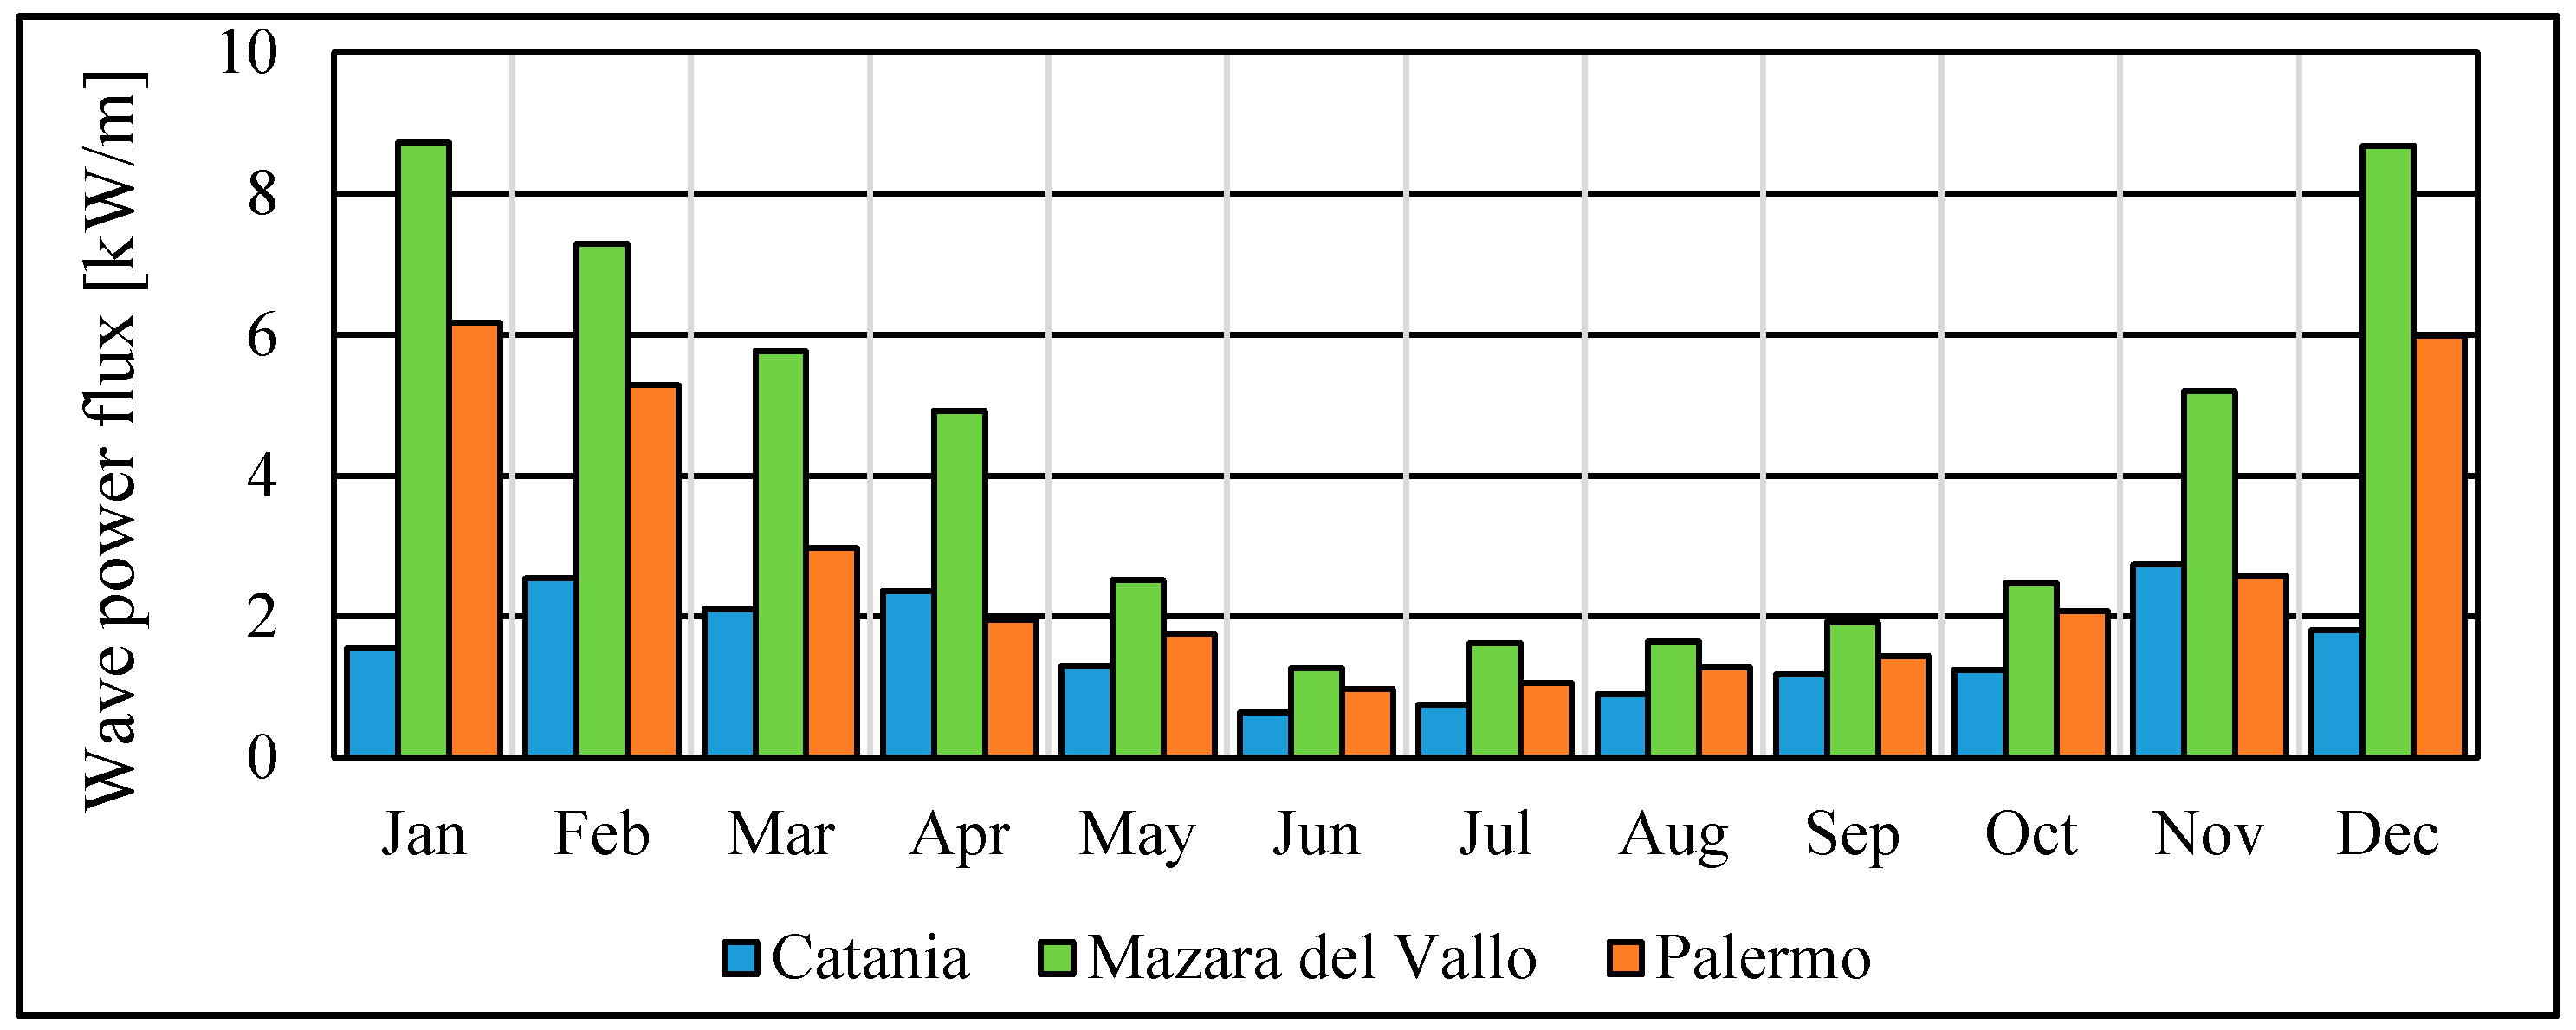
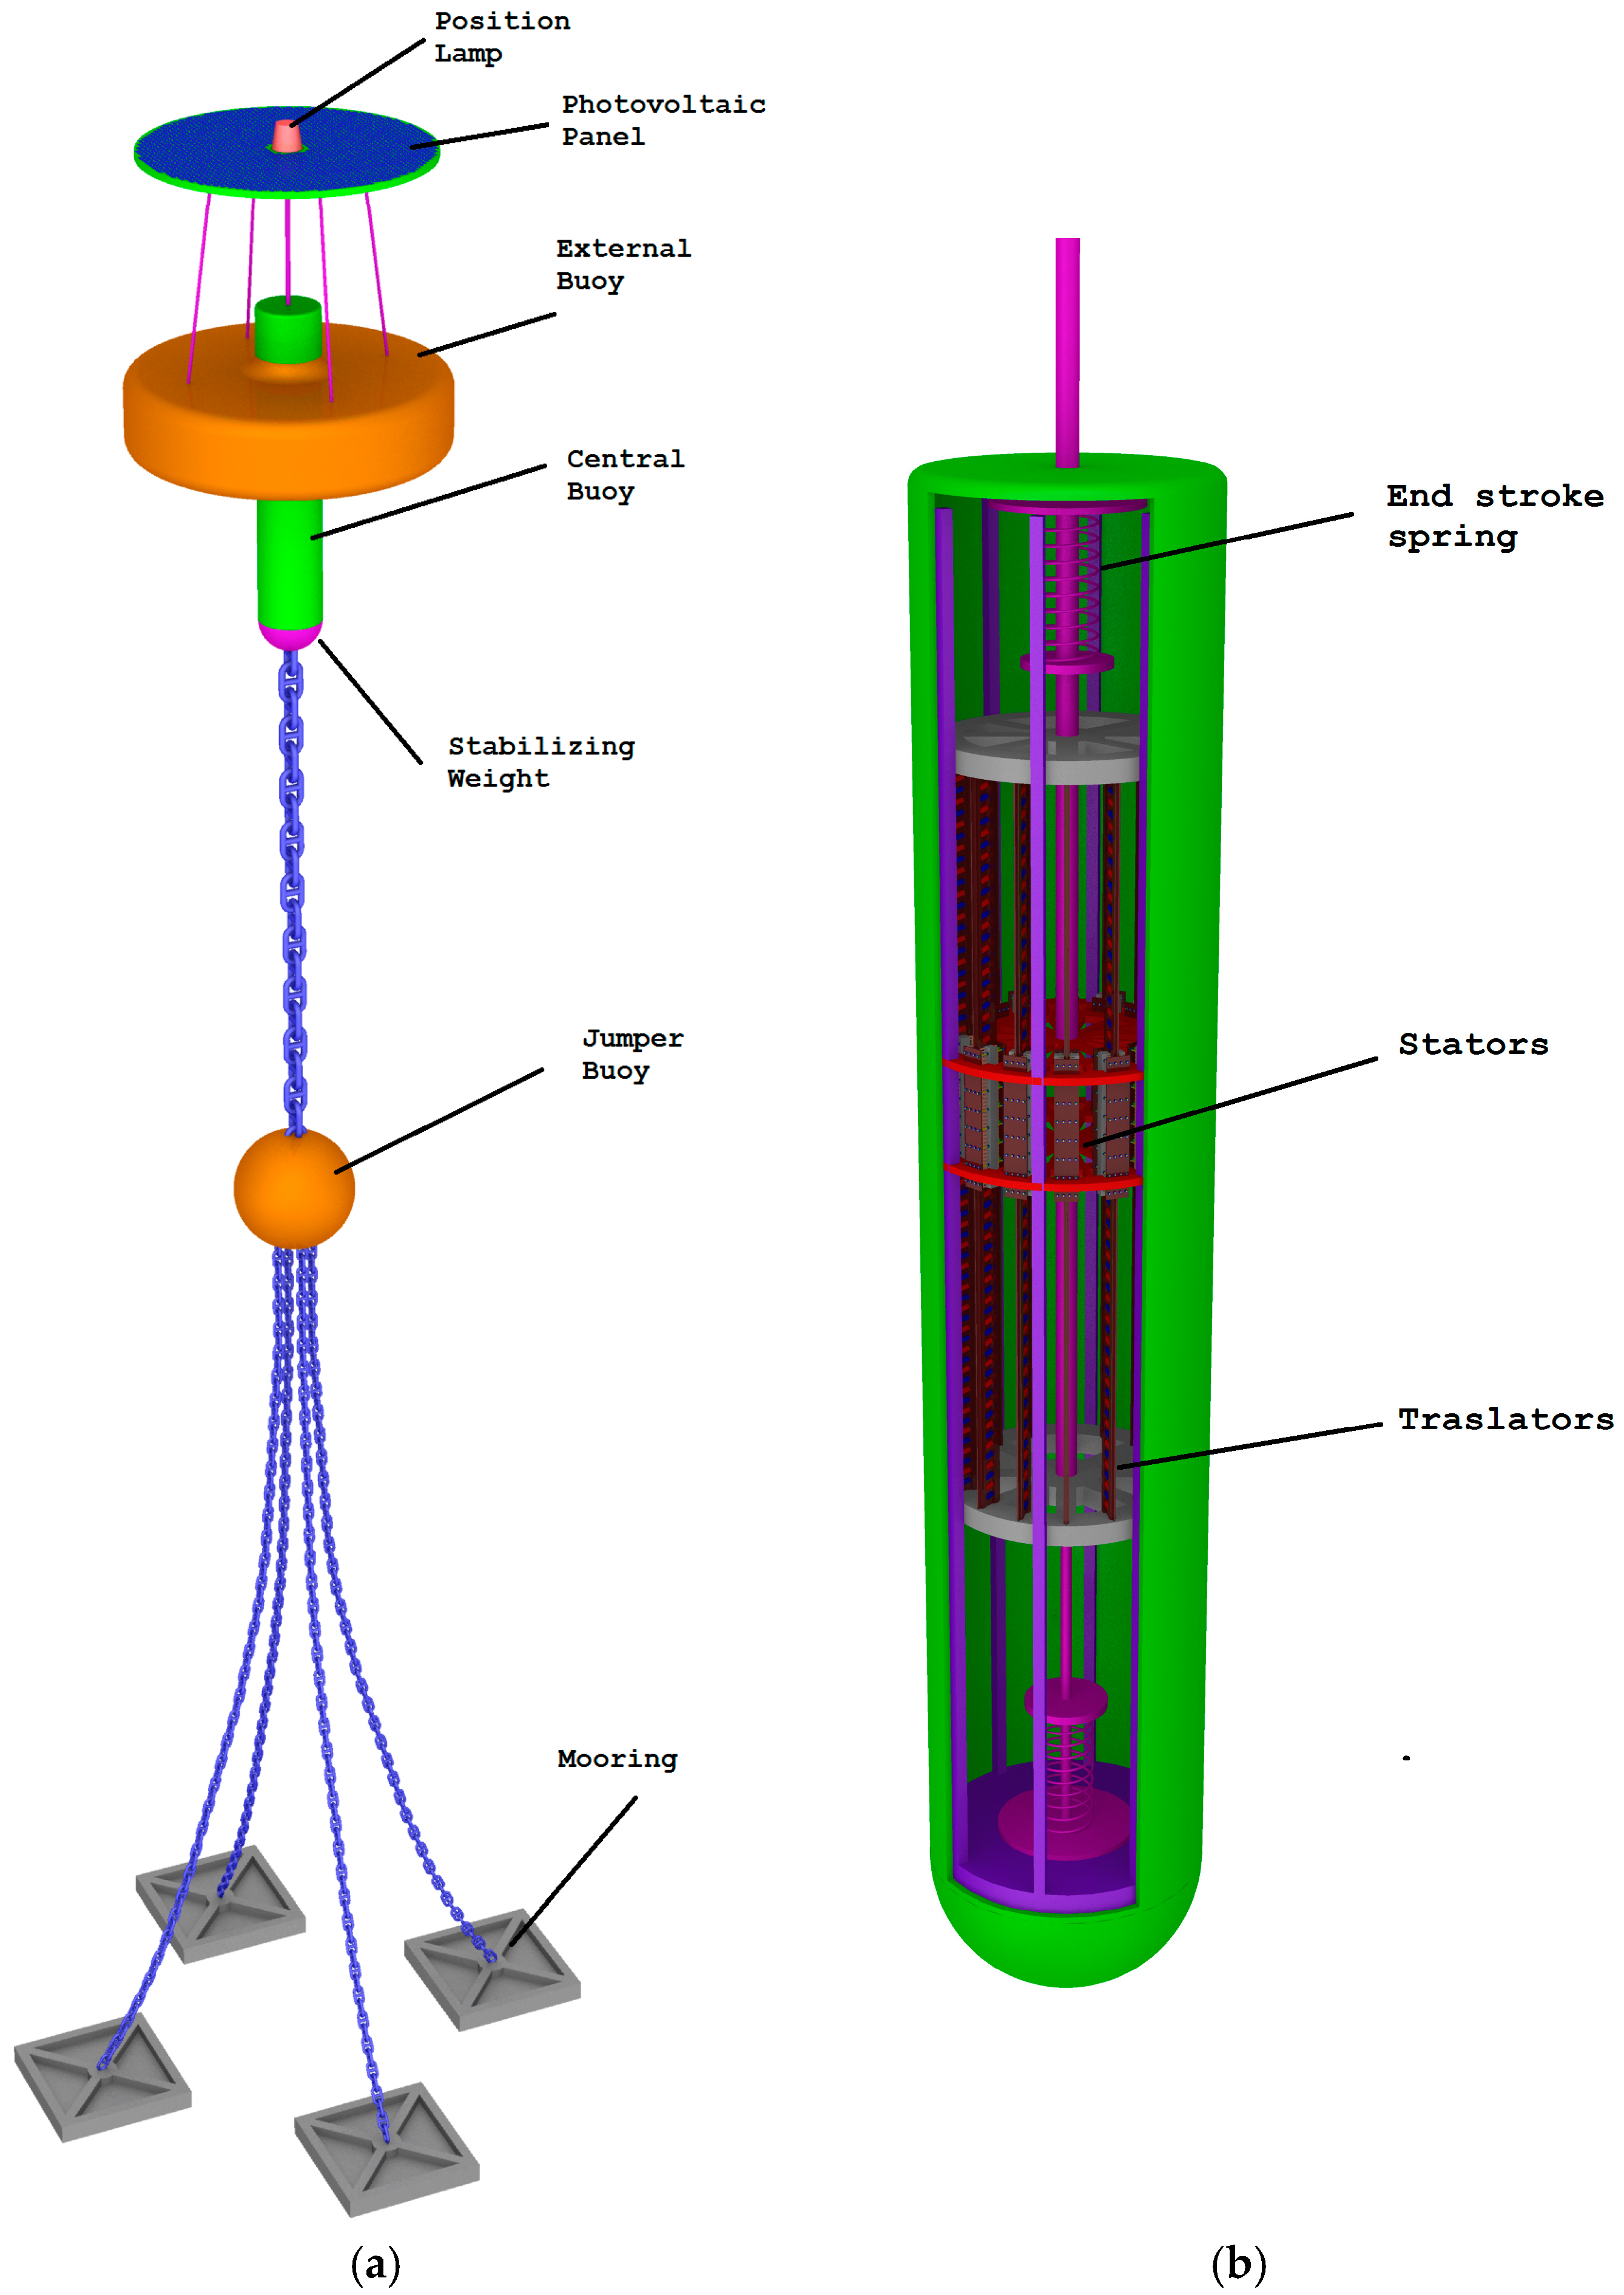
3. Sea Wave and Offshore Photovoltaic Energy Conversion Assessment
- CASE A—the solar–wave energy farms cover the 2% of the electrical demand;
- CASE B—the solar–wave energy farms cover the 5% of the electrical demand.
4. Conclusions
Author Contributions
Conflicts of Interest
Nomenclature
| Significant wave height (m) | |
| Energetic period (s) | |
| Peak period (s) | |
| Average wave direction (°) | |
| P | Power per front wave (kW/m) |
| Sea water density (kg/m3) | |
| Gravitational acceleration (m/s2) | |
| Installed power by sea wave in the site (MW) | |
| Wave power collected by sea wave energy farm (MW) | |
| Rated power of a single point absorber (kW) | |
| Number of point absorber per solar-wave energy farm (-) | |
| Number of buoys lines in a wave energy farm (-) | |
| Number of buoy in a single lines of wave energy farm (-) | |
| Number of solar-wave energy farm per site (-) | |
| Monthly energy production by sea wave in the site (MWh) | |
| Diameter of the external buoy of point absorber (m) | |
| Distance between two buoys (m) | |
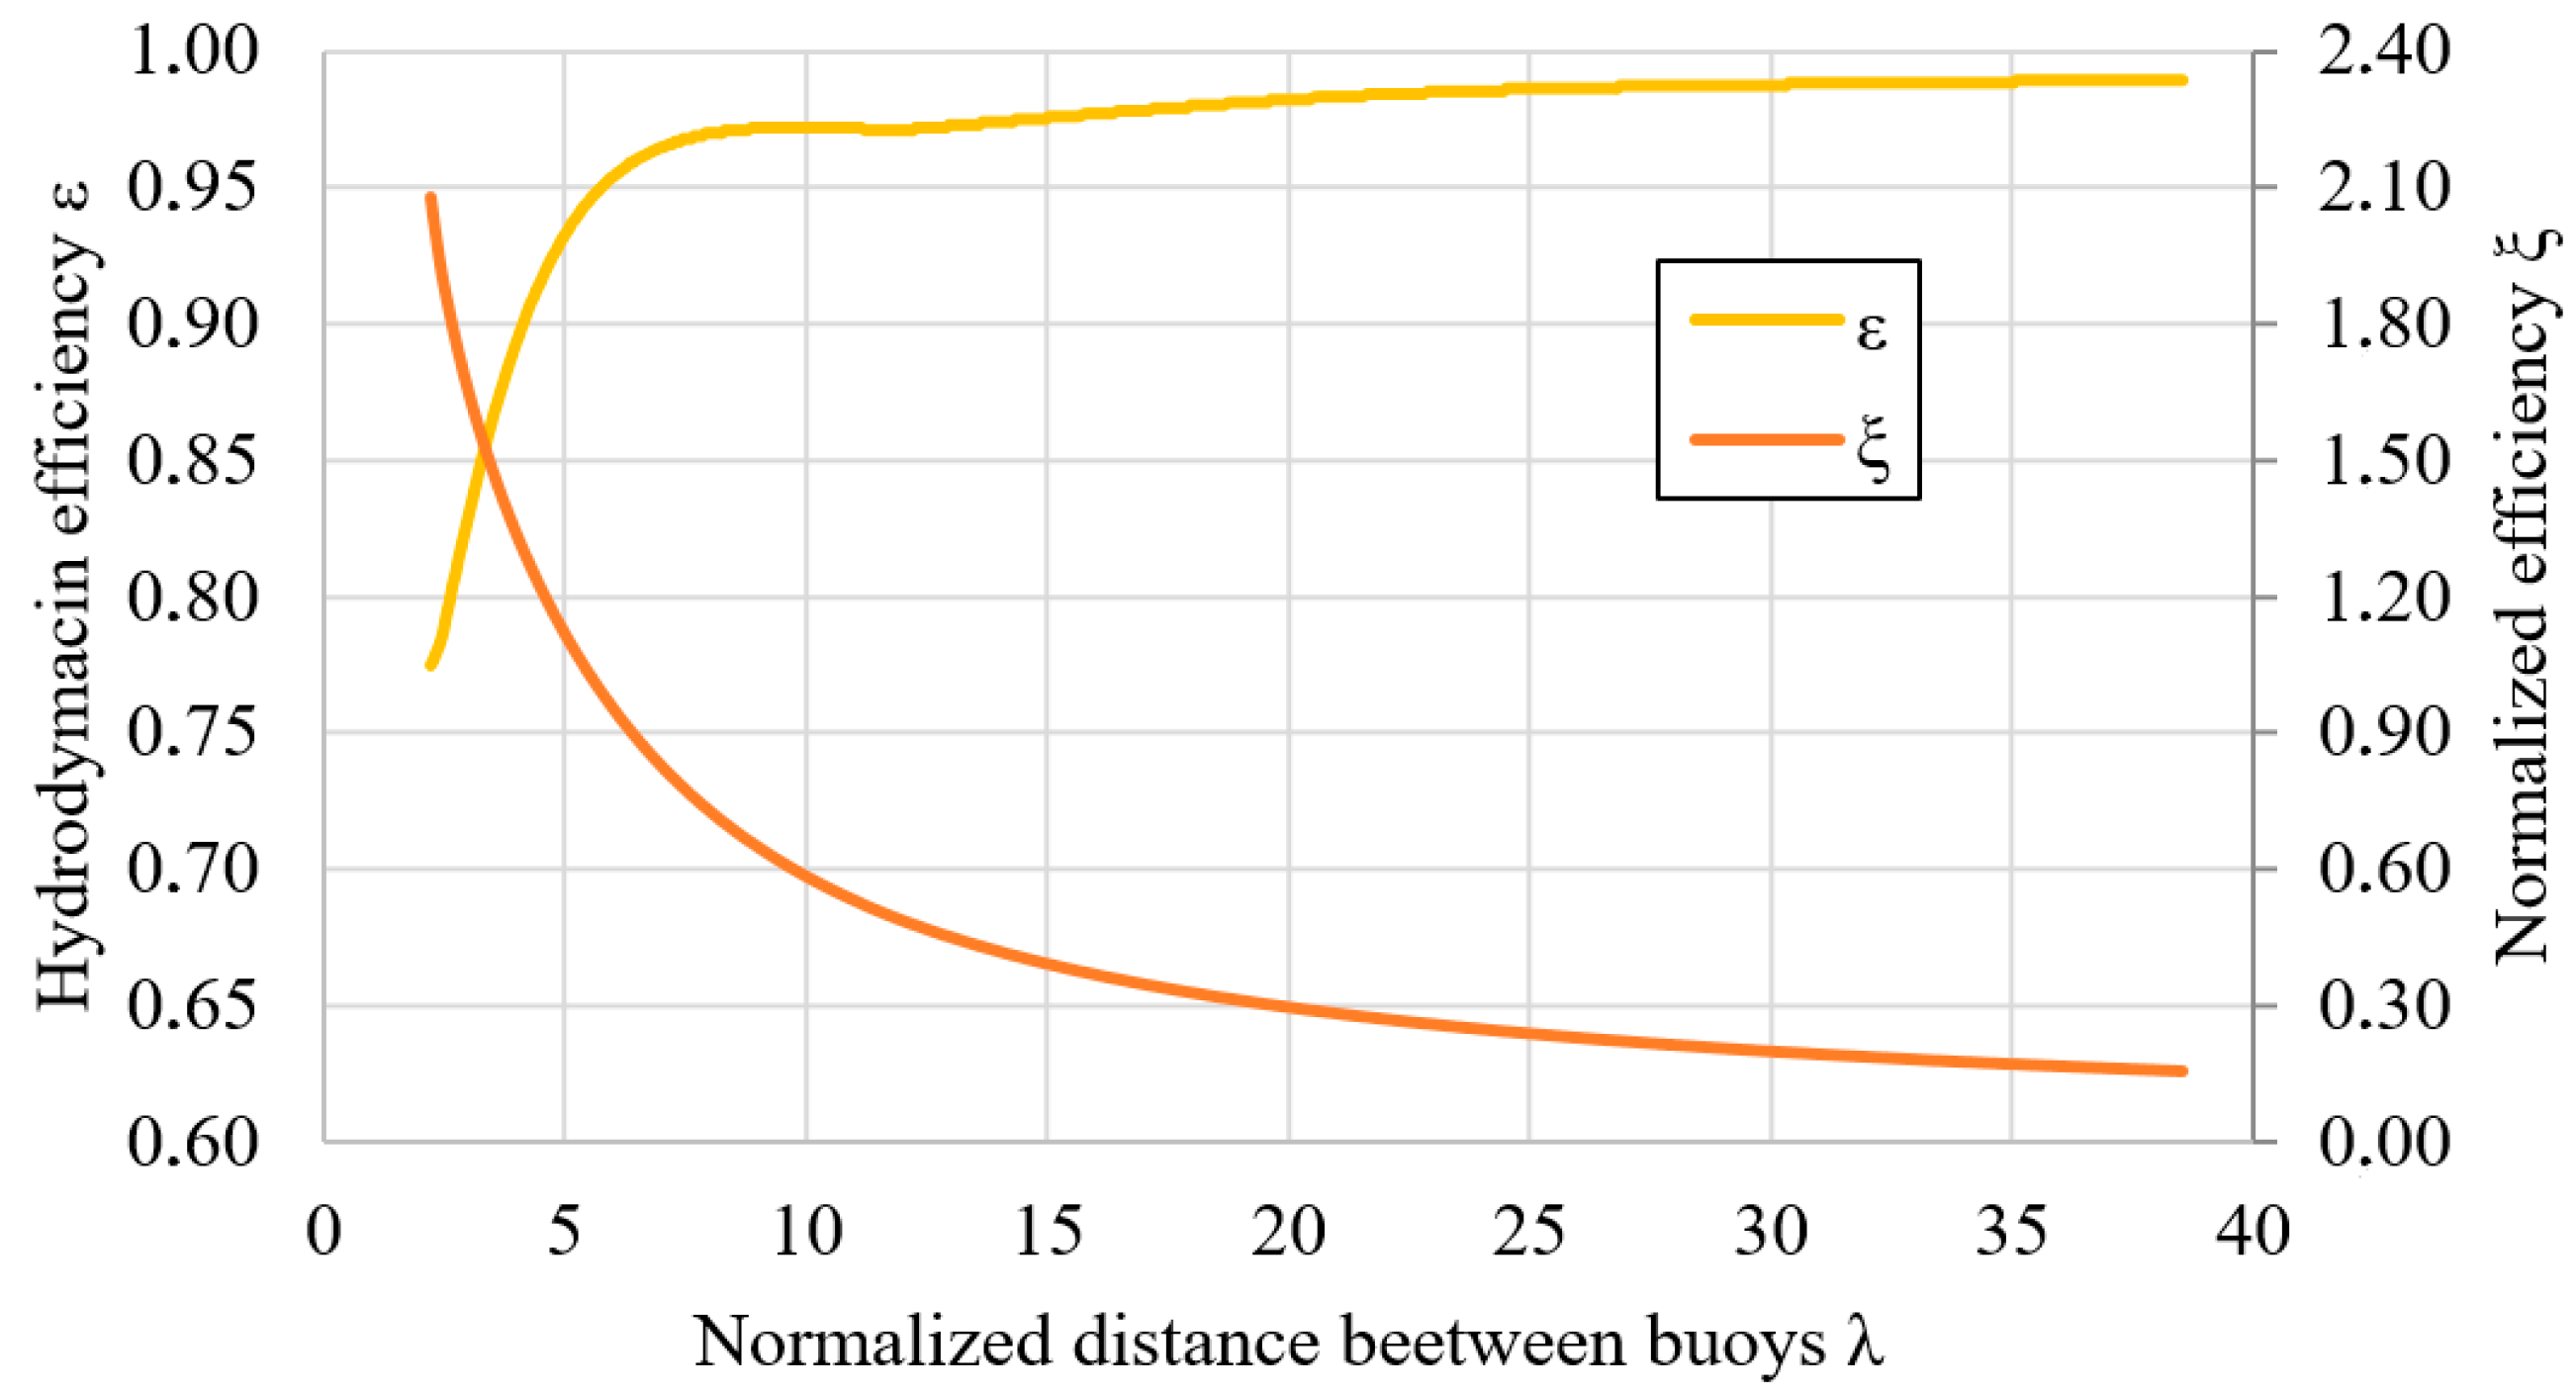
| λ | Normalized distance between two buoys (-) |
| Average energy efficiency of wave converter (%) | |
| Hydrodynamic energy efficiency of wave energy farm (%) | |
| Normalized efficiency of wave energy farm, by normalized buoys distance (-) | |
| Number of hours per month (h/month) | |
| Installed power by solar in the site (MW) | |
| Standard radiation (W/m2) | |
| Surface of photovoltaic panel in a single point absorber (m2) | |
| Average energy efficiency of photovoltaic panel (%) |
References
- International Energy Agency (IEA). Energy and Climate Change; IEA: Paris, France, 2015. [Google Scholar]
- Franzitta, V.; Curto, D.; Rao, D.; Viola, A. Hydrogen production from sea wave for alternative energy vehicles for public transport in Trapani (Italy). Energies 2016, 9, 850. [Google Scholar] [CrossRef]
- Milone, D.; Pitruzzella, S.; Franzitta, V.; Viola, A.; Trapanese, M. Energy Savings through Integration of the Illumination Natural and Artificial, Using a System of Automatic Dimming: Case Study. Appl. Mech. Mater. 2013, 372, 253–258. [Google Scholar] [CrossRef]
- Asdrubali, F.; Presciutti, A.; Scrucca, F. Development of a greenhouse gas accounting GIS-based tool to support local policy making—Application to an Italian municipality. Energy Policy 2013, 61, 587–594. [Google Scholar] [CrossRef]
- Asdrubali, F.; Moncada, L.G.G.; Rotili, A. Influence of new factors on global energy prospects in the medium term: Comparison among the 2010, 2011 and 2012 editions of the IEA’s World Energy Outlook reports. Econ. Policy Energy Environ. 2014, 3, 67–89. [Google Scholar] [CrossRef]
- Franzitta, V.; Milone, A.; Milone, D.; Pitruzzella, S.; Trapanese, M.; Viola, A. A Case Study to Evaluate the Indoor Global Quality. Adv. Mater. Res. 2013, 864–867, 1054–1058. [Google Scholar] [CrossRef]
- Hennicke, P. Scenarios for a robust policy mix: The final report of the German study commission on sustainable energy supply. Energy Policy 2004, 32, 1673–1678. [Google Scholar] [CrossRef]
- Tahara, K.; Kojima, T.; Inaba, A. Evaluation of CO2 payback time of power plants by LCA. Energy Convers. Manag. 1997, 38, S615–S620. [Google Scholar] [CrossRef]
- Karekezi, S. Renewables in Africa—Meeting the energy needs of the poor. Energy Policy 2002, 30, 1059–1069. [Google Scholar] [CrossRef]
- Barstow, S.; Mørk, G.; Mollison, D.; Cruz, J. The wave energy resource. In Ocean Wave Energy; Springer: Berlin/Heidelberg, Germany, 2008; pp. 93–132. [Google Scholar]
- Franzitta, V.; Milone, A.; Milone, D.; Pitruzzella, S.; Trapanese, M.; Viola, A. Experimental evidence on the thermal performance of opaque surfaces in mediterranean climate. Adv. Mater. Res. 2013, 860–863, 1227–1231. [Google Scholar] [CrossRef]
- Viola, A.; Franzitta, V.; Curto, D.; di Dio, V.; Milone, D.; Rodono, G. Environmental impact assessment (EIA) of wave energy converter (WEC). In Proceedings of the OCEANS 2015-Genova, Genova, Italy, 18–21 May 2015; pp. 1–4.
- Rousseau, N. Oceans of Energy—European Ocean Energy Roadmap 2010–2050; European Ocean Energy Association: Brussels, Belgium, 2010. [Google Scholar]
- Di Dio, V.; Franzitta, V.; Milone, D.; Pitruzzella, S.; Trapanese, M.; Viola, A. Design of bilateral switched reluctance linear generator to convert wave energy: Case study in Sicily. Adv. Mater. Res. 2013, 860–863, 1694–1698. [Google Scholar] [CrossRef]
- Iuppa, C.; Cavallaro, L.; Foti, E.; Vicinanza, D. Potential wave energy production by different wave energy converters around Sicily. J. Renew. Sustain. Energy 2015, 7, 61701. [Google Scholar] [CrossRef]
- Arena, F.; Laface, V.; Malara, G.; Romolo, A.; Viviano, A.; Fiamma, V.; Sannino, G.; Carillo, A. Wave climate analysis for the design of wave energy harvesters in the Mediterranean Sea. Renew. Energy 2015, 77, 125–141. [Google Scholar] [CrossRef]
- Antonio, F.D.O. Wave energy utilization: A review of the technologies. Renew. Sustain. Energy Rev. 2010, 14, 899–918. [Google Scholar]
- De Andrés, A.D.; Guanche, R.; Weber, J.; Costello, R. Finding gaps on power production assessment on WECs: Wave definition analysis. Renew. Energy 2015, 83, 171–187. [Google Scholar] [CrossRef]
- Arinaga, R.A.; Cheung, K.F. Atlas of global wave energy from 10 years of reanalysis and hindcast data. Renew. Energy 2012, 39, 49–64. [Google Scholar] [CrossRef]
- Reguero, B.G.; Losada, I.J.; Méndez, F.J. A global wave power resource and its seasonal, interannual and long-term variability. Appl. Energy 2015, 148, 366–380. [Google Scholar] [CrossRef]
- Curto, D. Ottimizzazione delle Performances Energetiche di un Innovativo Generatore di Energia Elettrica da Moto Ondoso; Gruppo Editoriale L’Espresso: Rome, Italy, 2015. [Google Scholar]
- Bozzi, S.; Archetti, R.; Passoni, G. Wave electricity production in Italian offshore: A preliminary investigation. Renew. Energy 2014, 62, 407–416. [Google Scholar] [CrossRef]
- Lionello, P.; Sanna, A. Mediterranean wave climate variability and its links with NAO and Indian Monsoon. Clim. Dyn. 2005, 25, 611–623. [Google Scholar] [CrossRef]
- Colucci, A.; Boscaino, V.; Cipriani, G.; Curto, D.; di Dio, V.; Franzitta, V.; Trapanese, M.; Viola, A. An inertial system for the production of electricity and hydrogen from sea wave energy. In Proceedings of the OCEANS 2015—MTS/IEEE Washington, Ocean, Washington, DC, USA, 19–22 October 2015; pp. 1–10.
- Iglesias, G.; Carballo, R. Wave energy and nearshore hot spots: The case of the SE Bay of Biscay. Renew. Energy 2010, 35, 2490–2500. [Google Scholar] [CrossRef]
- Guillou, N.; Chapalain, G. Numerical modelling of nearshore wave energy resource in the Sea of Iroise. Renew. Energy 2015, 83, 942–953. [Google Scholar] [CrossRef]
- Vicinanza, D.; Cappietti, L.; Ferrante, V.; Contestabile, P. Estimation of the wave energy in the Italian offshore. J. Coast. Res. 2011, 64, 613–617. [Google Scholar]
- Vicinanza, D.; Cappietti, L.; Contestabile, P. Assessment of wave energy around Italy. In Proceedings of the 8th European Wave and Tidal Energy Conference, Uppsala, Sweden, 7–10 September 2009; pp. 256–262.
- Monteforte, M.; Re, C.L.; Ferreri, G.B. Wave energy assessment in Sicily (Italy). Renew. Energy 2015, 78, 276–287. [Google Scholar] [CrossRef]
- Franzitta, V.; Curto, D.; Milone, D.; Viola, A. The Desalination process driven by wave energy: A challenge for the future. Energies 2016, 9, 1032. [Google Scholar] [CrossRef]
- Liberti, L.; Carillo, A.; Sannino, G. Wave energy resource assessment in the Mediterranean, the Italian perspective. Renew. Energy 2013, 50, 938–949. [Google Scholar] [CrossRef]
- Vicinanza, D.; Contestabile, P.; Ferrante, V. Wave energy potential in the north-west of Sardinia (Italy). Renew. Energy 2013, 50, 506–521. [Google Scholar] [CrossRef]
- Besio, G.; Mentaschi, L.; Mazzino, A. Wave energy resource assessment in the Mediterranean Sea on the basis of a 35-year hindcast. Energy 2016, 94, 50–63. [Google Scholar] [CrossRef]
- Terna S.p.A. Dati Storici. 2013. Available online: https://www.terna.it/it-it/sistemaelettrico/statisticheeprevisioni/datistorici.aspx (accessed on 14 March 2017).
- Moreci, E.; Ciulla, G.; Brano, V.L. The Energy System of Sicilian Region, Italy: 2014 situation and evolutionary trends. In Proceedings of the 2015 International Conference on Renewable Energy Research and Applications (ICRERA), Palermo, Italy, 22–25 November 2015; Volume 5, pp. 1348–1353.
- Dipartimento dell’Energia—Regione Sicilia. Rapporto Energia 2015 Monitoraggio Sull’energia in Sicilia; Regione Sicilia: Palermo, Italy, 2015. [Google Scholar]
- Mancuso, E. La Contabilità Delle Emissioni dei Gas ad Effetto Serra a Livello Locale: Le Emissioni Regionali di CO2; Energia, Ambiente e Innovazione (EAI): Rome, Italy, 2011. [Google Scholar]
- Autorità per L’energia Elettrica il Gas e il Sistema Idrico (AEEG). Delibera EEN 3/08—Aggiornamento del Fattore di Conversione dei kWh in Tonnellate Equivalenti di Petrolio Connesso al Meccanismo dei Titoli di Efficienza Energetica; AEEG: Rome, Italy, 2008. [Google Scholar]
- Dipartimento di Ricerche Energetiche ed Ambientali (DREAM)—Università degli Studi di Palermo. Piano Energetico Ambientale Regionale Della Regione Siciliana; Regione Sicilia: Palermo, Italy, 2007. [Google Scholar]
- Iuppa, C.; Cavallaro, L.; Vicinanza, D.; Foti, E. Investigation of suitable sites for wave energy converters around Sicily (Italy). Ocean Sci. Discuss. 2015, 12, 315–354. [Google Scholar] [CrossRef]
- Viola, A.; Franzitta, V.; Trapanese, M.; Curto, D. Nexus water & energy: A case study of wave energy converters (WECs) to desalination applications in Sicily. Int. J. Heat Technol. 2016, 34, S379–S386. [Google Scholar]
- Cornett, A.M. A global wave energy resource assessment. In Proceedings of the Eighteenth International Offshore and Polar Engineering Conference, Vancouver, BC, Canada, 6–11 July 2008.
- Franzitta, V.; Curto, D.; Milone, D.; Rao, D. Assessment of renewable sources for the energy consumption in Malta in the Mediterranean Sea. Energies 2016, 9, 1034. [Google Scholar] [CrossRef]
- Franzitta, V.; Trapanese, M.; Giaconia, C.; Ferrara, P.; Viola, A. Design and experimental test of a low costweather buoy. In Proceedings of the 2013 MTS/IEEE OCEANS—Bergen, Bergen, Norway, 10–14 June 2013; pp. 1–5.
- Trapanese, M.; Franzitta, V.; Viola, A. A dynamic model for hysteresis in magnetostrictive devices. J. Appl. Phys. 2014, 115, 1–4. [Google Scholar] [CrossRef]
- Franzitta, V.; Di Dio, V.; Viola, A.; Giaconia, C.; Ferrara, P.; Trapanese, M. Experimental results of a low cost weather buoy. In Proceedings of the 2013 OCEANS, San Diego, CA, USA, 23–27 September 2013; pp. 1–5.
- Franzitta, V.; Viola, A.; Trapanese, M. Design of a transverse flux machine for power generation from seawaves. J. Appl. Phys. 2014, 115, 17E712. [Google Scholar] [CrossRef]
- Balitsky, P.; Bacelli, G.; Ringwood, J.V. Control-influenced layout optimization of arrays of wave energy converters. In Proceedings of the ASME 2014 33rd International Conference on Ocean, Offshore and Arctic Engineering, San Francisco, CA, USA, 8–13 June 2014; p. V09BT09A022.
- Franzitta, V.; Curto, D.; Rao, D. Energetic sustainability using renewable energies in the Mediterranean Sea. Sustainability 2016, 8, 1164. [Google Scholar] [CrossRef]
- Franzitta, V.; Curto, D. Sustainability of the renewable energy extraction close to the Mediterranean Islands. Energies 2017, 10, 283. [Google Scholar] [CrossRef]
- Ente Italiano di Normazione (UNI). Norma UNI 10349 Parte 1—Dati Climatici Ed. 2016; Ente Italiano di Normazione: Rome, Italy, 2016. [Google Scholar]


| Renewable Source | Power (MW) | Annual Electricity Saving (GWh/Year) | CO2 Avoided (kt CO2) |
|---|---|---|---|
| Photovoltaic | 4500 | 7100 | 5985 |
| Wind | 10,345 | 24,710 | 16,900 |
| Catania | Jan. | Feb. | Mar. | Apr. | May | Jun. | Jul. | Aug. | Sep. | Oct. | Nov. | Dec. |
| (m) | 7.51 | 7.90 | 7.48 | 11.33 | 8.92 | 8.16 | 8.65 | 9.14 | 8.26 | 7.06 | 7.43 | 6.58 |
| (s) | 0.64 | 0.80 | 0.75 | 0.65 | 0.54 | 0.40 | 0.42 | 0.44 | 0.53 | 0.59 | 0.86 | 0.74 |
| (kW/m) | 1.6 | 2.5 | 2.1 | 2.4 | 1.3 | 0.6 | 0.8 | 0.9 | 1.2 | 1.2 | 2.7 | 1.8 |
| Palermo | Jan. | Feb. | Mar. | Apr. | May | Jun. | Jul. | Aug. | Sep. | Oct. | Nov. | Dec. |
| (m) | 6.97 | 6.66 | 6.32 | 5.95 | 6.62 | 6.44 | 6.53 | 6.43 | 6.22 | 6.19 | 6.22 | 6.82 |
| (s) | 1.33 | 1.26 | 0.97 | 0.81 | 0.73 | 0.55 | 0.57 | 0.63 | 0.68 | 0.82 | 0.91 | 1.33 |
| (kW/m) | 6.2 | 5.3 | 3.0 | 2.0 | 1.8 | 1.0 | 1.1 | 1.3 | 1.4 | 2.1 | 2.6 | 6.0 |
| Mazara del Vallo | Jan. | Feb. | Mar. | Apr. | May | Jun. | Jul. | Aug. | Sep. | Oct. | Nov. | Dec. |
| (m) | 7.45 | 7.44 | 7.15 | 6.95 | 6.49 | 6.02 | 6.03 | 5.72 | 5.99 | 6.05 | 6.68 | 7.13 |
| (s) | 1.53 | 1.40 | 1.27 | 1.19 | 0.88 | 0.65 | 0.73 | 0.76 | 0.80 | 0.90 | 1.25 | 1.56 |
| (kW/m) | 8.7 | 7.3 | 5.8 | 4.9 | 2.5 | 1.3 | 1.6 | 1.7 | 1.9 | 2.5 | 5.2 | 8.7 |
| Parameter | Symbol | Value | Unit |
|---|---|---|---|
| Buoy diameter | 20 | m | |
| Rated power of a wave converter | 160 | kW | |
| Average wave converter efficiency [21,49,50] | 50 | % | |
| Average hydrodynamic efficiency of wave farm | 93 | % | |
| Number of buoys in wave farm | 81 | - | |
| Surface of photovoltaic panel | 254.5 | m2 | |
| Average photovoltaic efficiency | 17 | % | |
| Rated power of photovoltaic panel | 43.3 | kW |
| (kWh/m2) | Jan. | Feb. | Mar. | Apr. | May | Jun. | Jul. | Aug. | Sep. | Oct. | Nov. | Dec. |
|---|---|---|---|---|---|---|---|---|---|---|---|---|
| Catania | 69.2 | 97.5 | 140.0 | 150.0 | 192.5 | 204.2 | 215.0 | 189.2 | 145.0 | 112.5 | 85.0 | 62.5 |
| Palermo | 61.7 | 77.5 | 121.7 | 149.2 | 185.8 | 200.8 | 205.0 | 178.3 | 135.8 | 107.5 | 79.2 | 57.5 |
| Mazara | 84.2 | 101.7 | 135.0 | 158.3 | 198.3 | 200.0 | 205.8 | 187.5 | 156.7 | 120.8 | 87.5 | 69.2 |
| Parameters | CASE A | CASE B | ||||
|---|---|---|---|---|---|---|
| Catania | Palermo | Mazara | Catania | Palermo | Mazara | |
| Number of farms | 5 | 7 | 7 | 14 | 16 | 18 |
| Installed Wave Power (MW) | 64.8 | 90.7 | 90.7 | 181.6 | 207.4 | 233.3 |
| Installed Solar Power (MW) | 17.5 | 24.5 | 24.5 | 49.1 | 56.1 | 63.1 |
| Annual energy by wave (MWh/y) | 52,303 | 109,746 | 182,417 | 146,450 | 250,848 | 469,072 |
| Annual energy by solar (MWh/y) | 40,778 | 38,264 | 41,821 | 93,207 | 87,461 | 95,590 |
| Total annual energy (MWh/y) | 465,329 | 1,142,627 | ||||
© 2017 by the authors. Licensee MDPI, Basel, Switzerland. This article is an open access article distributed under the terms and conditions of the Creative Commons Attribution (CC BY) license ( http://creativecommons.org/licenses/by/4.0/).
Share and Cite
Franzitta, V.; Catrini, P.; Curto, D. Wave Energy Assessment along Sicilian Coastline, Based on DEIM Point Absorber. Energies 2017, 10, 376. https://doi.org/10.3390/en10030376
Franzitta V, Catrini P, Curto D. Wave Energy Assessment along Sicilian Coastline, Based on DEIM Point Absorber. Energies. 2017; 10(3):376. https://doi.org/10.3390/en10030376
Chicago/Turabian StyleFranzitta, Vincenzo, Pietro Catrini, and Domenico Curto. 2017. "Wave Energy Assessment along Sicilian Coastline, Based on DEIM Point Absorber" Energies 10, no. 3: 376. https://doi.org/10.3390/en10030376
APA StyleFranzitta, V., Catrini, P., & Curto, D. (2017). Wave Energy Assessment along Sicilian Coastline, Based on DEIM Point Absorber. Energies, 10(3), 376. https://doi.org/10.3390/en10030376