1. Introduction
Countries around the world are facing increasing environmental problems resulting from the rapid growth of energy generation. According to the recent key world energy statistics, electricity generation has continuously increased, and reached 24,255 terawatt-hours (TWH) in 2015. Nevertheless, 66.3% of 2015 world’s electricity was generated from fossil fuels (coal, oil, and natural gas). Fossil-fuel power generation has carbon dioxide (CO2), sulfur dioxide (SO2), nitrogen oxides (NOX), particulates, liquid and solid wastes. The fossil-fuel fired power plants produce pollutants that are harmful to health and are a source of climate change.
The most important environmental impact associated with fossil fuel fired power plants is airborne pollution [
1,
2]. Air pollutants’ dispersion is governed by chemical and physical atmospheric conditions. In addition, the majority of pollutants undergo some chemical transformations [
3]. However, fossil fuel remains the main sources of primary energy, especially in the developing countries [
4]. It is widely recognized that air pollution from power plants adversely affects public health. Pollutants cause significant damage to both mortality and morbidity due to long- or short-term exposure. A number of studies show a significant relationship between air pollution and health impacts [
5,
6,
7].
In energy markets across the world, prices for fossil fuels are lower than the prices of energy generated from renewable sources, regardless of their negative effects to public health and the environment. These negative effects are called external costs because those are outside of the pricing system. The sum of the private costs and external costs gives social costs. External costs are an important category of market failure and are imposed on society; accounting for these externalities can make fossil fuels more expensive than renewables [
8,
9,
10]. Choosing one energy option over another may influence many aspects of society and the environment, which should be accounted for if we want to obtain the highest benefits for society [
11]. Internalizing the external cost into energy production cost is a useful measure to indicate the actual costs of energy. The results can be applied by policy makers to take measures to avoid additional costs and promote applications of newer and cleaner energy sources [
12,
13].
Iran is one of the most hydrocarbon-rich areas in the world and has large reserves of natural gas and crude oil. In Iran, most of the power plants are based on fossil fuels, such as natural gas, diesel, and fuel oil. Iran is the world’s 6th- and 4th-largest producer of electricity from oil and natural gas, respectively [
14]. Hence, the overall objective of this paper is to estimate the health effects and related costs of fossil electricity generation in Iran. In this analysis, we cover for the first time the whole country and investigate health effects from all major Iranian electricity plants (96% of fossil fuel electricity generation), one by one. In this way, we provide a complete and very detailed estimation of external costs of Iranian fossil power plants while previous estimations were based on extrapolation of a single plant or a small number of plants.
The remainder of the paper is organized as follows:
Section 2 describes the method for calculation of external costs from fossil electricity generation,
Section 3 presents a short overview of electricity sector in Iran and its emissions,
Section 4 indicates the results, and
Section 5 discusses of the achieved results and concludes the paper.
3. External Costs from Iran Fossil Electricity Generation
Currently, 100% of urban and 99.9% of rural populations in Iran have full access to electricity [
39,
40]. In the last three decades, on average, more than 91% of Iran electricity production has been from thermal power plants that consume fossil fuels (natural gas, diesel, and fuel oil). Energy balance sheets issued by Iran’s Ministry of Energy state that power plants have a high contribution in air pollutants (especially SO
2 and NO
X) with respect to other sectors (transportation, industry, agriculture, and residential sectors) and more than one-third of SO
2 and NO
X emanate from electricity generation.
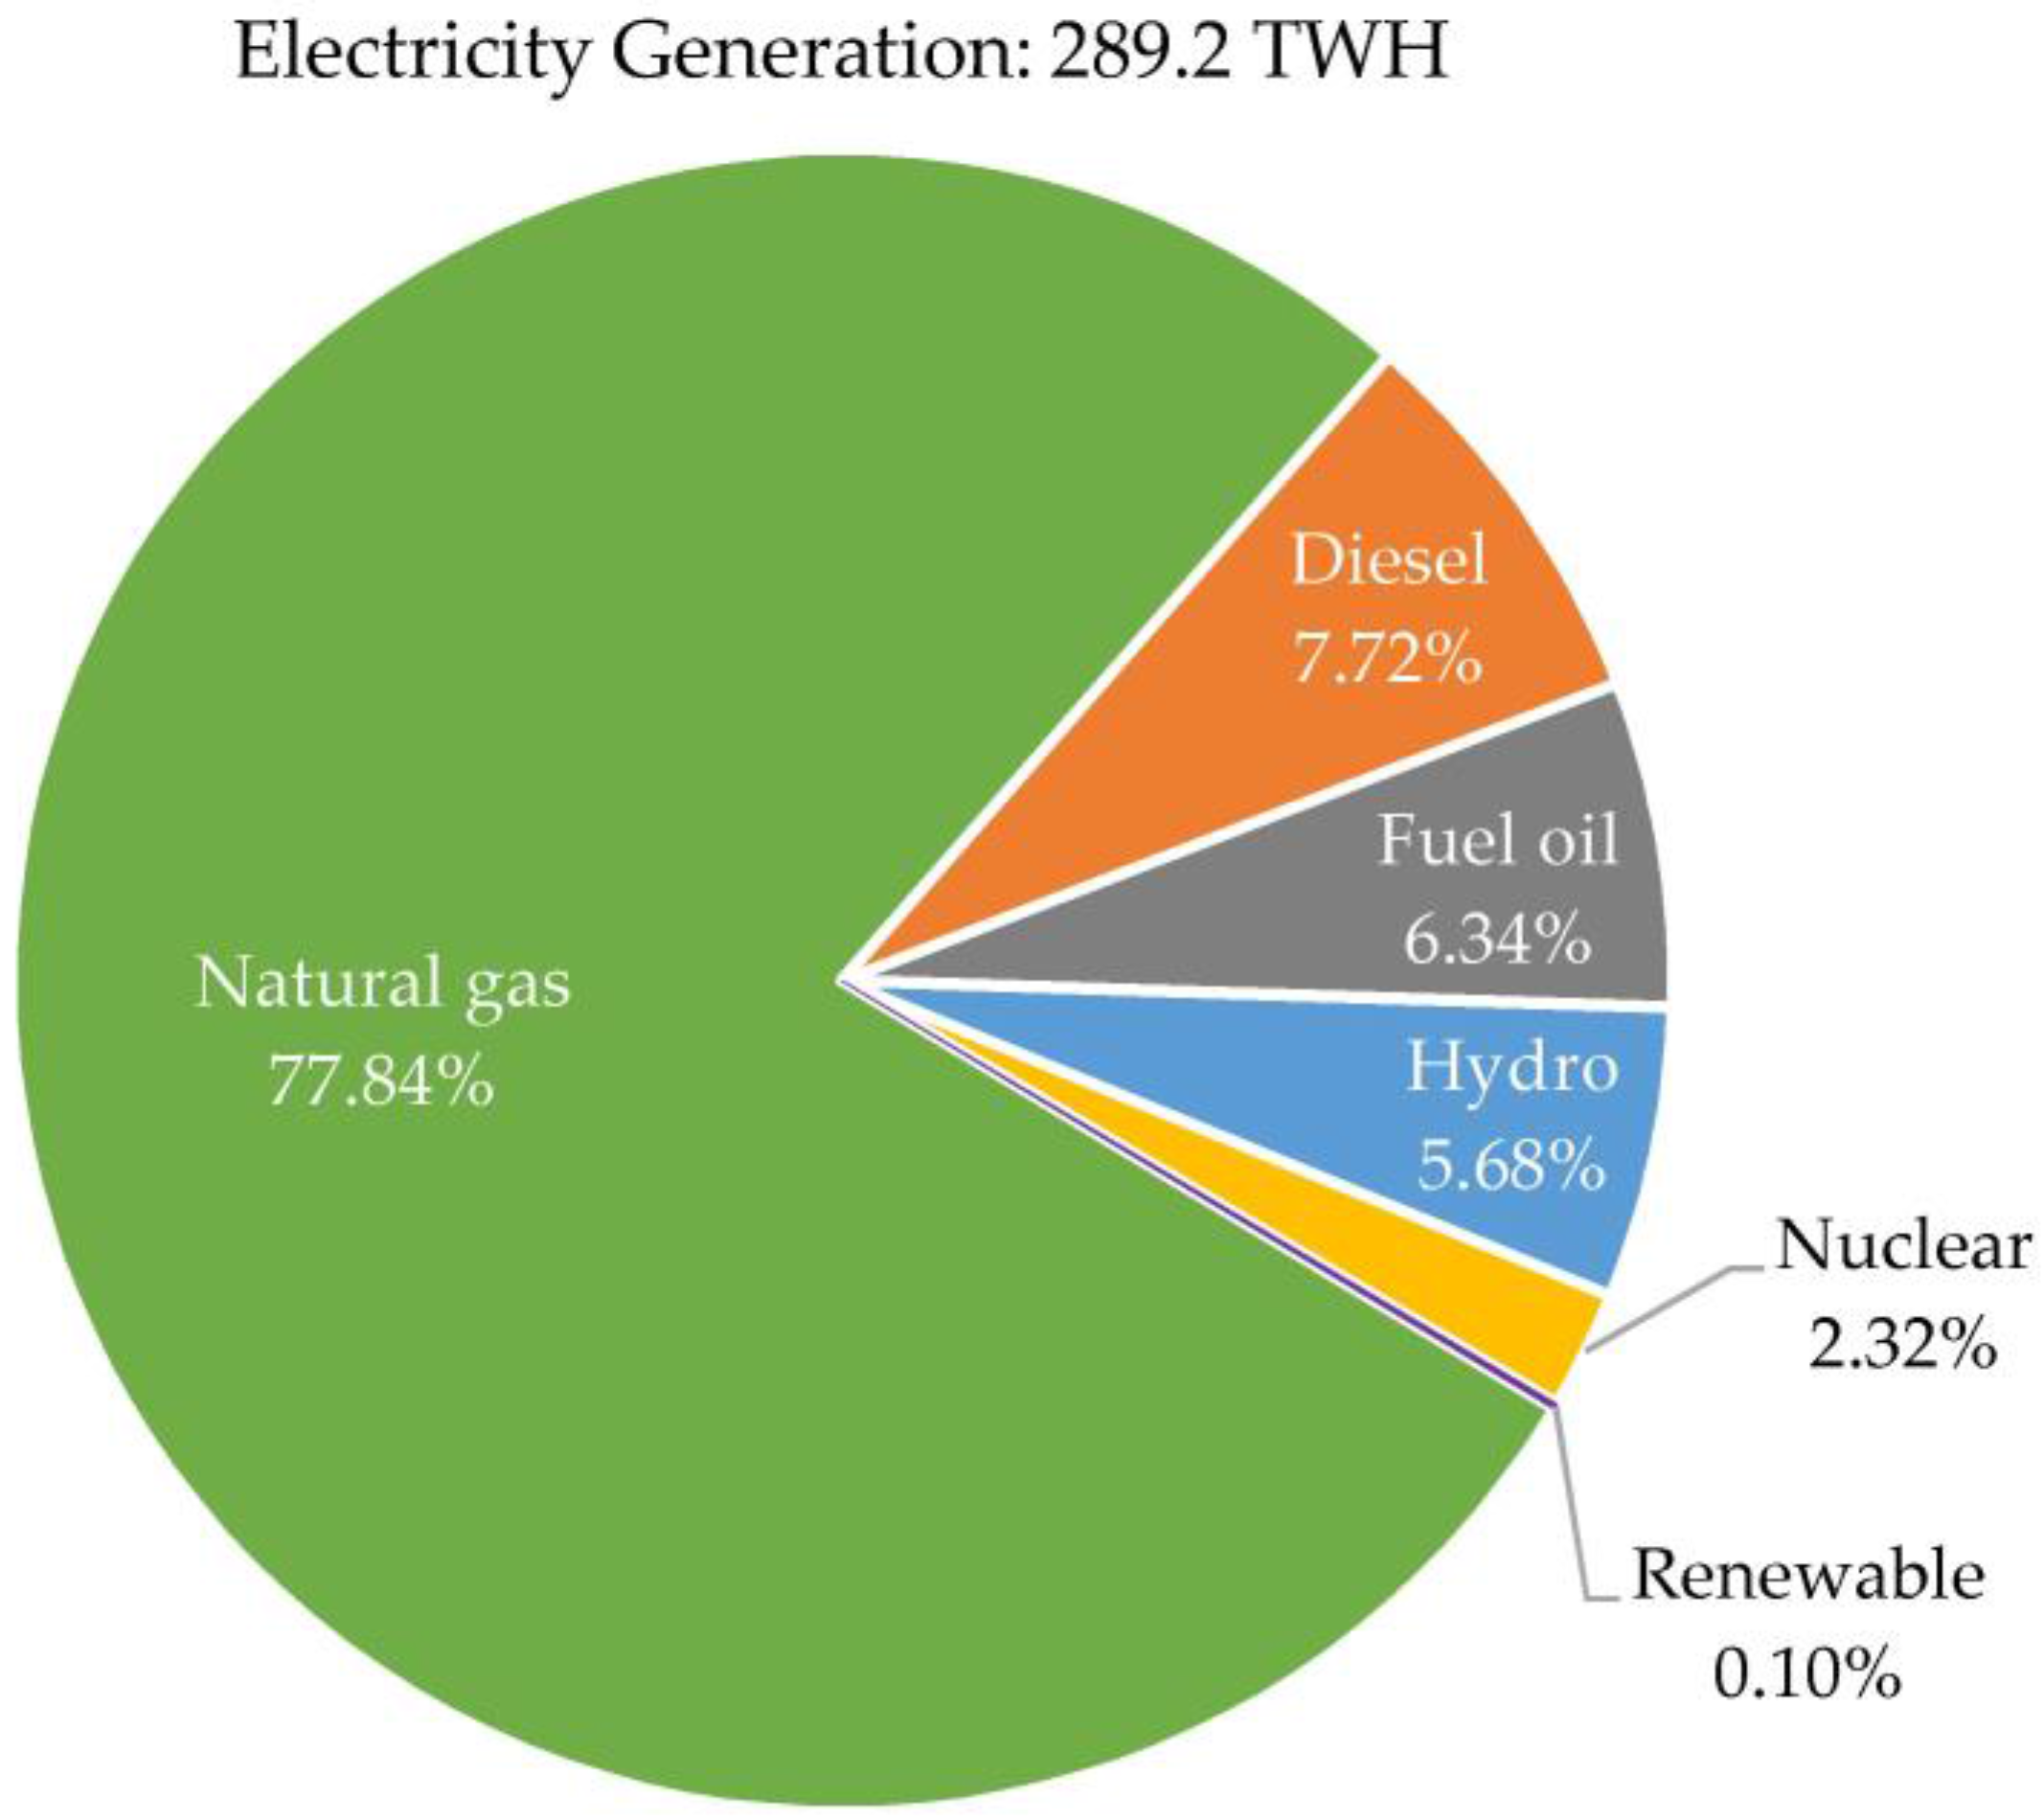
In this study, we investigate health damages from Iran fossil-based electricity generation for one year. Using the latest available statistical data for Iranian calendar year 1395, the study encompassed a one-year period starting from 20 March 2016 through 20 March 2017. In this year, Iran gross generation was 289,195.8 GWH. Fossil-fuel power plants generated 265,775.6 GWH; that is, 91.9% of total generation. The electricity production of different fossil plants varies from 0.5 to 13,913 GWH. We selected all large power plants with generation of more than 1000 GWH in the year of analysis. There are 61 power plants with this condition, so our study includes 95.6% of total Iran fossil power generation. Most of the 61 fossil plants are multi-fuel plants, which use a variety of fossil fuels. Seven plants consume three types of fossil fuels. Forty three plants consume both of natural gas and diesel, and also 4 plants consume both of natural gas and fuel oil. Six plants consume only natural gas, and one plant also consumes only diesel. The plants have different geographical and climate conditions, so estimation of health effects from these 61 plants, independently, increase the accuracy of the results. Furthermore, with respect to the model, this study is only about the electricity production phase, externalities and life cycle assessment has not been included.
In Iran, Tavanir organization is responsible for management of generation, transmission, and distribution of electric power. According to the statistical reports of Iran electric power industry issued by this organization, in the past 30 years, the total nominal capacity of Iran’s power plants has increased from 13.3 GW to 76.4 GW. In this period, natural gas consumption has reached from 5.45 to 61.78 billion cubic meters, diesel from 1.48 to 5.87 billion liters, and fuel oil from 3.56 to 4.48 billion liters. These facts demonstrate that the share of natural gas in generation, as the cleanest fuel among commercial fossil fuels, has improved. Moreover, the share of fossil fuels with high sulfur content (especially fuel oil) has decreased.
Figure 3 shows fuel shares of Iran electricity generation for the year of the analysis.
In these three decades, Iran’s population has increased from 50.7 to 79.9 million. The average age of Iran’s thermal power plants is about 16 years and Iran has 10 GW fossil plants over 30 years old. At the time of the power plants’ construction, they were far from populated areas. Because of population growth, the number of people near the plants has increased.
The determination of the population at risk from power plant pollutants is one of the major components of external cost calculation. Several studies, especially in the developing countries, assume constant population in the whole country or provinces and use the average population density for these areas. In this study, to find a better estimation of population density around every power plant, we collected the population of all sub-provinces from the 2016 National Population and Housing Census of Statistical Centre of Iran. According to Ministry of the Interior data, Iran currently has 31 provinces and 429 sub-provinces.
Figure 4 displays the locations of the selected 61 power plants and population density for all sub-provinces. These plants have been given a number according to their generation in descending order from highest generation (#1) to lowest generation (#61).
As shown in
Figure 4, the population north and west of Iran is comparatively high and most of the fossil plants are in the high-density areas. The average population density of Iran (total population ratio to the total country area) is 49 person/km
2. The population density in the sub-provinces varies from 1 to 8343 persons/km
2. The highest populated areas are near Tehran, where the plants numbered 1, 7, 27, 31, and 50 are located.
In this study, we chose the regional level in SIMPACTS to investigate the effects of power plant’s air pollution 1025 km from the plant. We used the ArcGIS 10.5 (Esri (Environmental Systems Research Institute), California, CA, USA) to calculate the precise population density in 1681 cells 50 × 50 km at a square area size of 2050 × 2050 km around each of the 61 plants, individually.
Figure 5 exhibits the population density for the sample power plant, Yazd (#17), that is located almost in the center of Iran. To find a better view of the population near the plant, the density at a square size of 250 × 250 km (i.e., in 25 cells) around of the plant has been shown as well. Impacts of pollutants from power plants act over 1000 km or even more [
3,
13]; however, in this study, only those impacts arising on Iran’s borders and territory are assessed.
In addition, in
Appendix A,
Table A1 summarizes the population density around the selected plants. This table displays Iran’s population coverage at square size of 2050 × 2050 km by each of the plants. The population at square size of 250 × 250 km (i.e., in 25 cells) around of the selected plants has been presented in
Table A1 as well. According to this table, the plants Besat (#50), Parand (#31), MontazerQaem (#7), RoodShur (#27), Damavand (#1), Rajayi (#2), and Qom (#18) have the highest population in the 250 × 250 km range. For example, the plant Besat (#50) is in the capital and 19.84 million persons live in a square size of 250 × 250 km around it.
Generally, Iran’s plants don’t have conventional abatement technologies like flue-gas desulfurization equipment, so the annual quantities of emitted air pollutants from each power plant are estimated by multiplying the emission factors with the consumed fuel quantity. To determine the flue gas emission factor, a project entitled “developing pollutant map of Iran’s thermal power plant” has been done in Tavanir, during 2007–2008. Thus, 50 thermal power plants, with the total installed capacity of 34,863 MW, have been investigated [
42]. According to the results of this project, we use the average emission factors of SO
2 and NO
X for different fossil fuels. These values are grams per KWH (g/KWH) generated electricity. Since there is no local value for PM
10 emissions, we used PM
10 emission factors from the 2016 EMEP (European Monitoring and Evaluation Programme)/EEA (European Environment Agency) air pollutant emission inventory guidebook. These values are grams per gigajoules (g/GJ) of thermal input for electricity production. Consequently,
Table 1 shows the emission factors for the three pollutants with respect to fuel types. Since the average sulfur content of Iran’s fuel oil is 3%, we used 45 g/GJ for PM
10 emissions from fuel oil as well. According to the updated permit of Iran Department of Environment, SO
2 emission limits for existing plants depending on the type of fuel are 200, 150, and 800 milligrams per normal cubic meter (mg/Nm
3) for natural gas, diesel, and fuel oil, respectively. Furthermore, NO
X emission limits are 300, 250, and 400 mg/Nm
3 for natural gas, diesel, and fuel oil, respectively. Particulates emission limits is 150 mg/Nm
3. On the other hand, old plants with low efficiency, high consumption of heavy oil in cold seasons, and lack of emission abatement equipment increase air pollutants.
Moreover, average calorific values of fuel used in Iran’s thermal power plants for natural gas, diesel, and fuel oil are 35.98 (MJ/m3), 38.63 (MJ/Lit), and 40.96 (MJ/Lit), respectively.
According to the manual of the SIMPACTS, for a power plant with multiple stacks, since the stacks are not far from each other, we model them as one. Accordingly, we use the average values for stack specification. Additionally, according to the available statistical reports of Tavanir Org., we use average values for exit temperature and exit velocity of stacks. Average exit temperatures for steam, combined cycle, and gas power plants are 440, 550, 780 Kelvin, respectively. Additionally, average exit velocities for steam, combined cycle, and gas power plants are 21, 30, and 46 m per second, respectively.
In
Appendix A,
Table A2 shows characteristics of the selected 61 power plants. It displays generation, fuel consumption, and pollutant emissions for the year of the study as well. These plants have been arranged according to their generation from largest to smallest. The total nominal capacity and gross generation of the 61 power plants are 53.6 GW, and 254 GWH, respectively. The generation of the selected plants varies from 1.1 GWH to 13.9 GWH. As shown in
Figure 3, these plants use mostly natural gas. The plants Ramin (#5), Montazeri (#6), Rajayi (#2), Damavand (#1), Kerman (#3), MontazerQaem (#7), and Neka (#4) have the highest consumption of natural gas. Furthermore, Damavand (#1), Chabahar (#58), Gilan (#8), Pareh-sar (#15), Rajayi (#2), Sanandaj (#19), and Uromieh (#29) are largest in diesel consumption. As mentioned above, fuels with more pollutants (i.e., fuel oil and diesel) gradually are being replaced by natural gas. According to
Table A2, in the year of this study, 10 plants did not consume diesel, 50 power plants did not consume fuel oil.
In addition, Neka (#4), Bandar-abbas (#10), Bistoon (#20), Mofateh (#13), Toos (#26), Rajayi (#2), and Iran-shahr (#55) use the most fuel oil, consuming 92.1% of the total. Consequently, Neka (#4), Bandar-abbas (#10), Bistoon (#20), Mofateh (#13), Rajayi (#2), Toos (#26), and Sahand (#25) are largest producer of SO2 pollutants and these seven plants produce 75.4% of total SO2.
The large natural gas consuming plants have the main contribution in NOX emissions. Therefore, Damavand (#1), Rajayi (#2), Kerman (#3), Neka (#4), Ramin (#5), Montazeri (#6), and MontazerQaem (#7), with respect to their high generation, are the top seven in NOX production.
Also, Neka (#4), Bandar-abbas (#10), Bistoon (#20), Mofateh (#13), Toos (#26), Rajayi (#2), and Iran-shahr (#55) have the highest PM10 emissions and 72.6% of PM10 emanate from these seven plants.
After the characteristics of the plants, their precise latitude and longitude in decimal degree format is put into the model. The time frame for the model is a full year. The final required data for the SIMPACTS are exposure-response functions and unit costs for the impacts. The ExternE has collected exposure–response functions from several epidemiological studies. Additionally, sulfates and nitrates are treated as particles, assuming for sulfates the toxicity of PM
10 and for nitrates, half the toxicity of sulfates [
15].
Table A3 summarizes health impacts of pollutants, including mortality (chronic, acute, and infant) and morbidity (chronic bronchitis, bronchodilator usage, lower respiratory symptom, restricted activity days, and hospital admissions) and related ERFs that have been considered in the current study.
In this study, the ERFs have also been assumed to be linear, without threshold behavior, which is vital for linear transfer of values and their adjustment. The simplification of linearized functions without thresholds to very low increments in air pollution may lead to an overestimation of effects, which must be remembered when using the results of such studies [
3,
13,
28,
29,
44].
Since most of the developing countries have no WTP studies, SIMPACTS offers the possibility of transferring the values assessed for European Union. According to Equation (1), we use the unit transfer with income adjustment. Per capita GDP (at PPP) for Iran and EU are 5910 and 20,269 USD (2000), respectively. Also in this modification, the elasticity of willingness to pay with respect to income is supposed to be one (
γ = 1).
Table 2 presents the results of the applied adjustments and unit damage costs for different health impacts.
4. Results
After collecting and calculating the required data, we ran the model for every plant separately and individually and calculated the health impacts and costs from air pollution of the fossil plants.
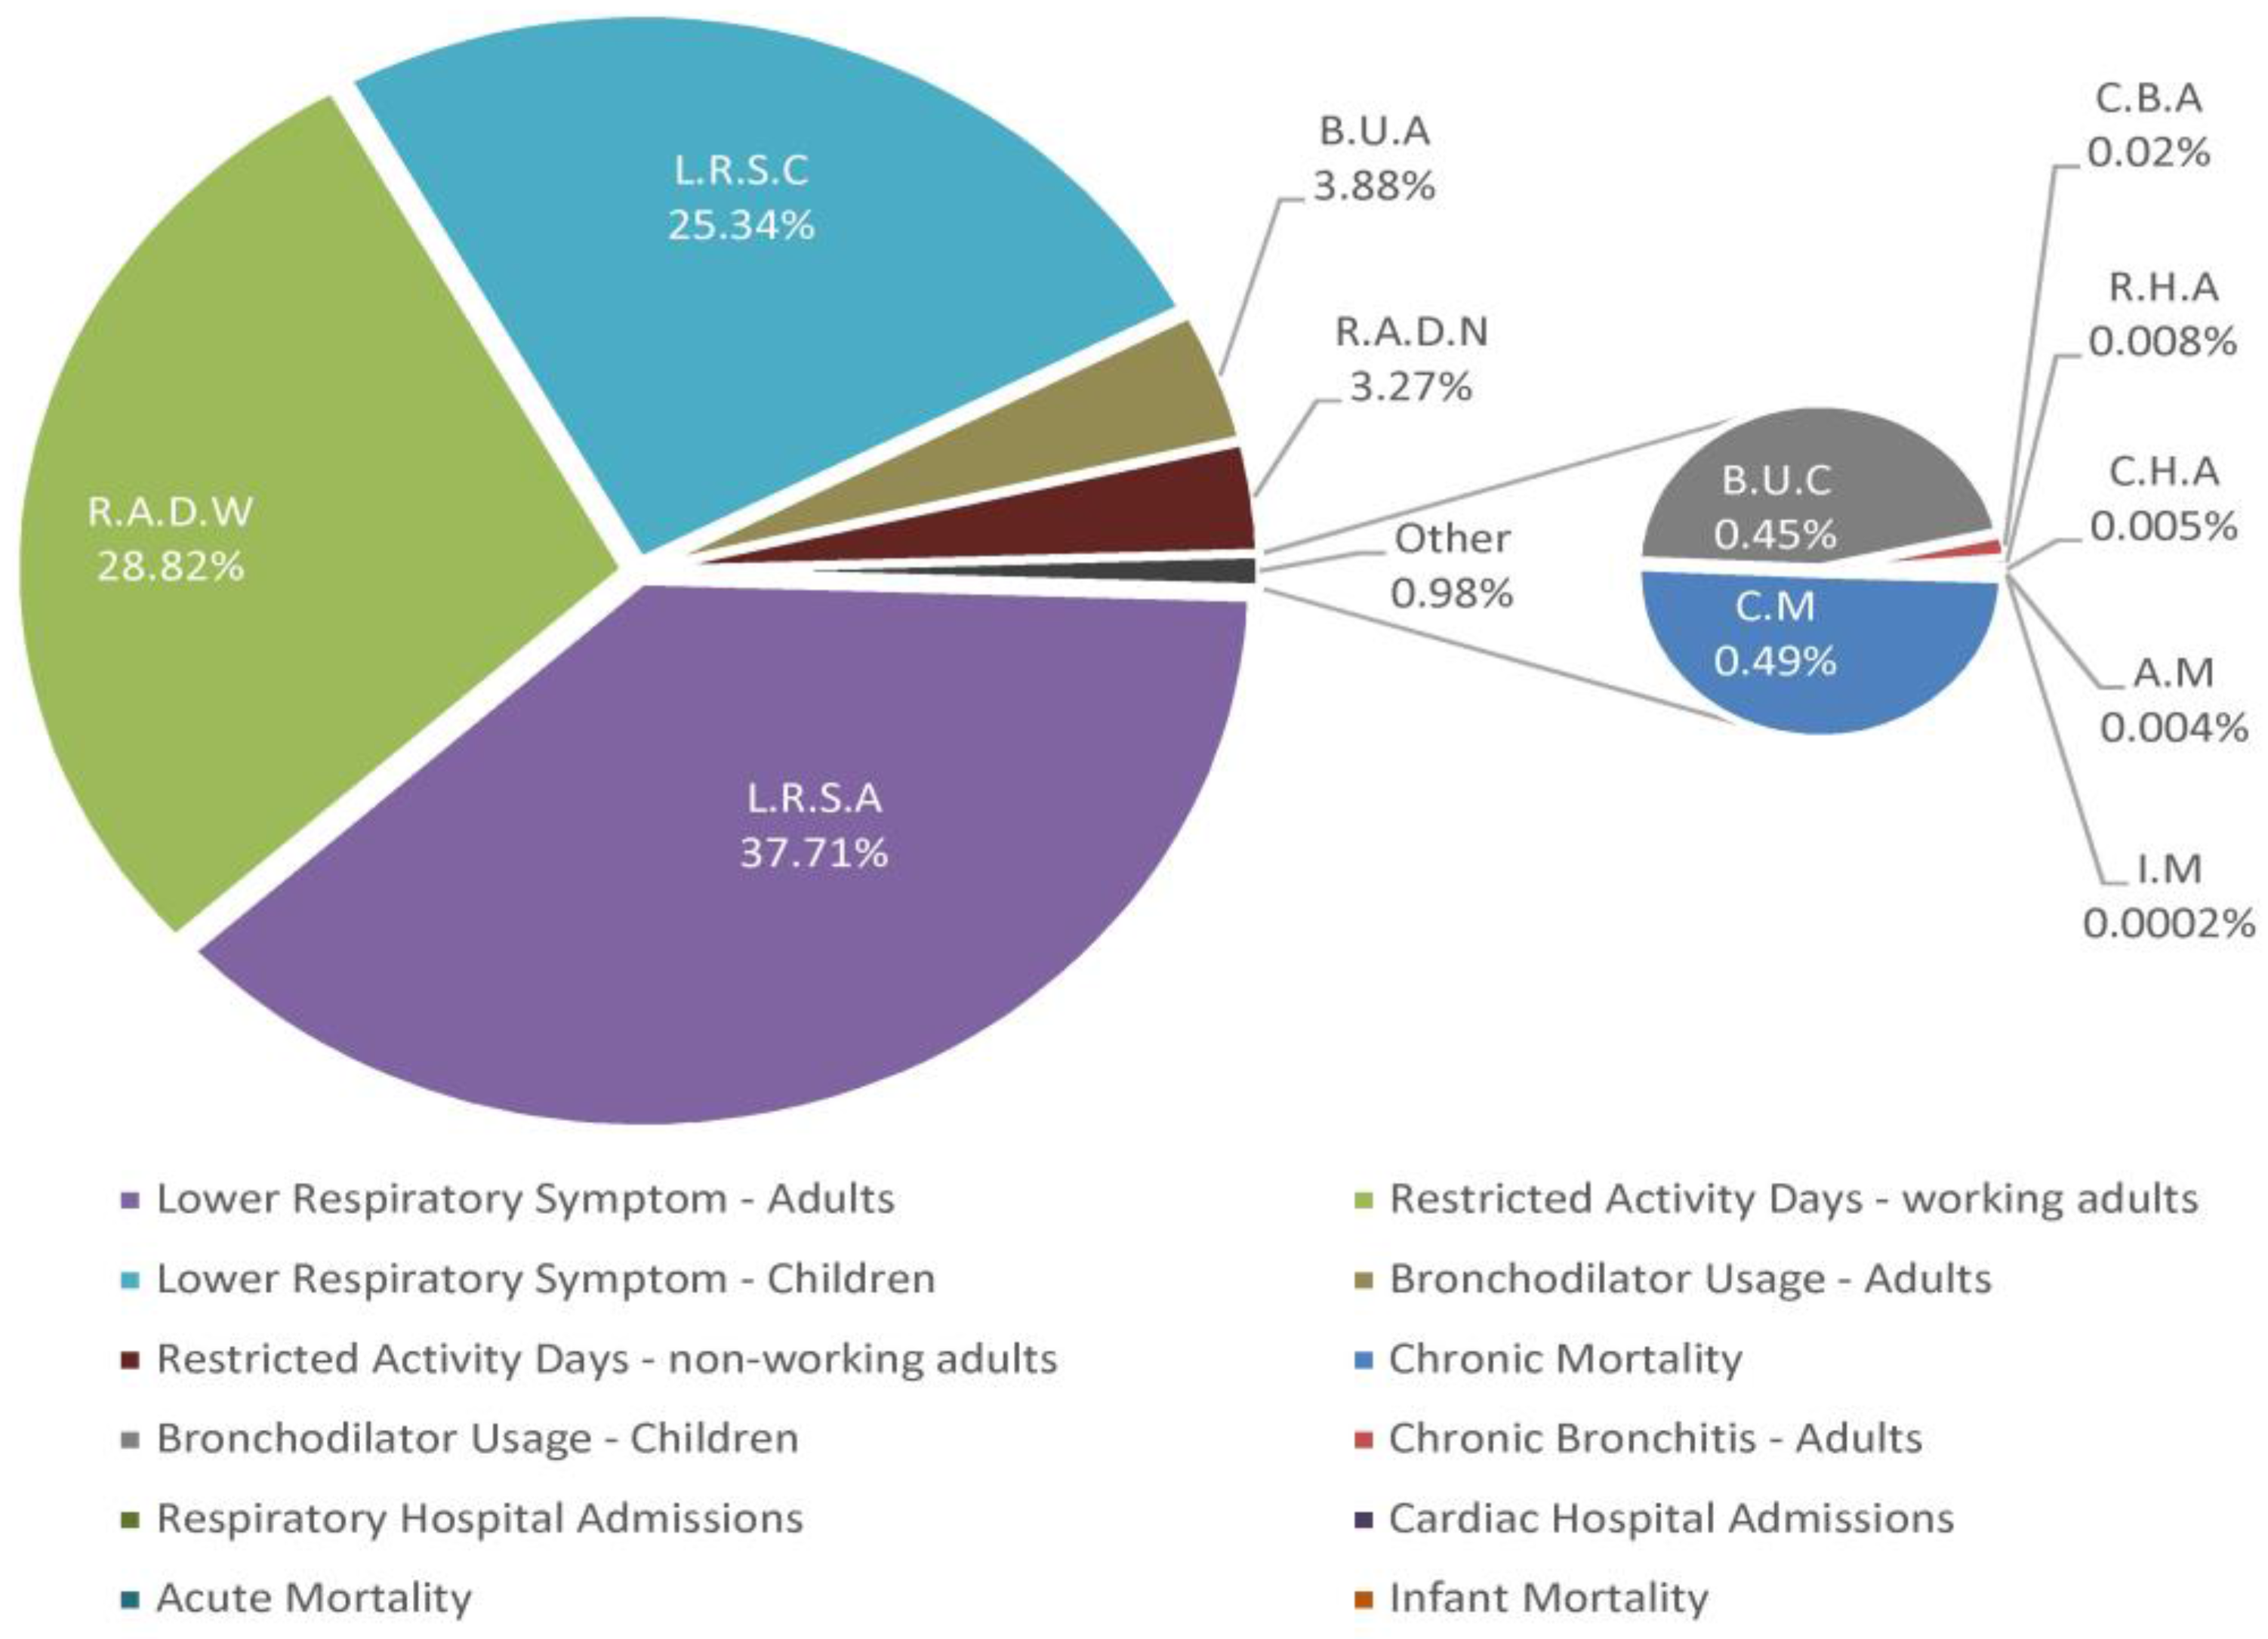
Table A4 demonstrates the results of the considered human health impacts from the 61 plants with respect to the type of pollutants. Additionally, according to this table,
Figure 6 shows the share of each health impact in total cases from all the 61 power plants.
As shown in
Figure 6, in the all impacts from the total power plants, Lower Respiratory Symptom in Adults, Restricted Activity Days in Working Adults, and Lower Respiratory Symptom in Children have the highest health impacts with shares of 37.71%, 28.82%, and 25.34%, respectively. Multiplying the number of cases of each impact to the unit cost of the impact gives the damage cost from the impacts.
Furthermore, in
Appendix A,
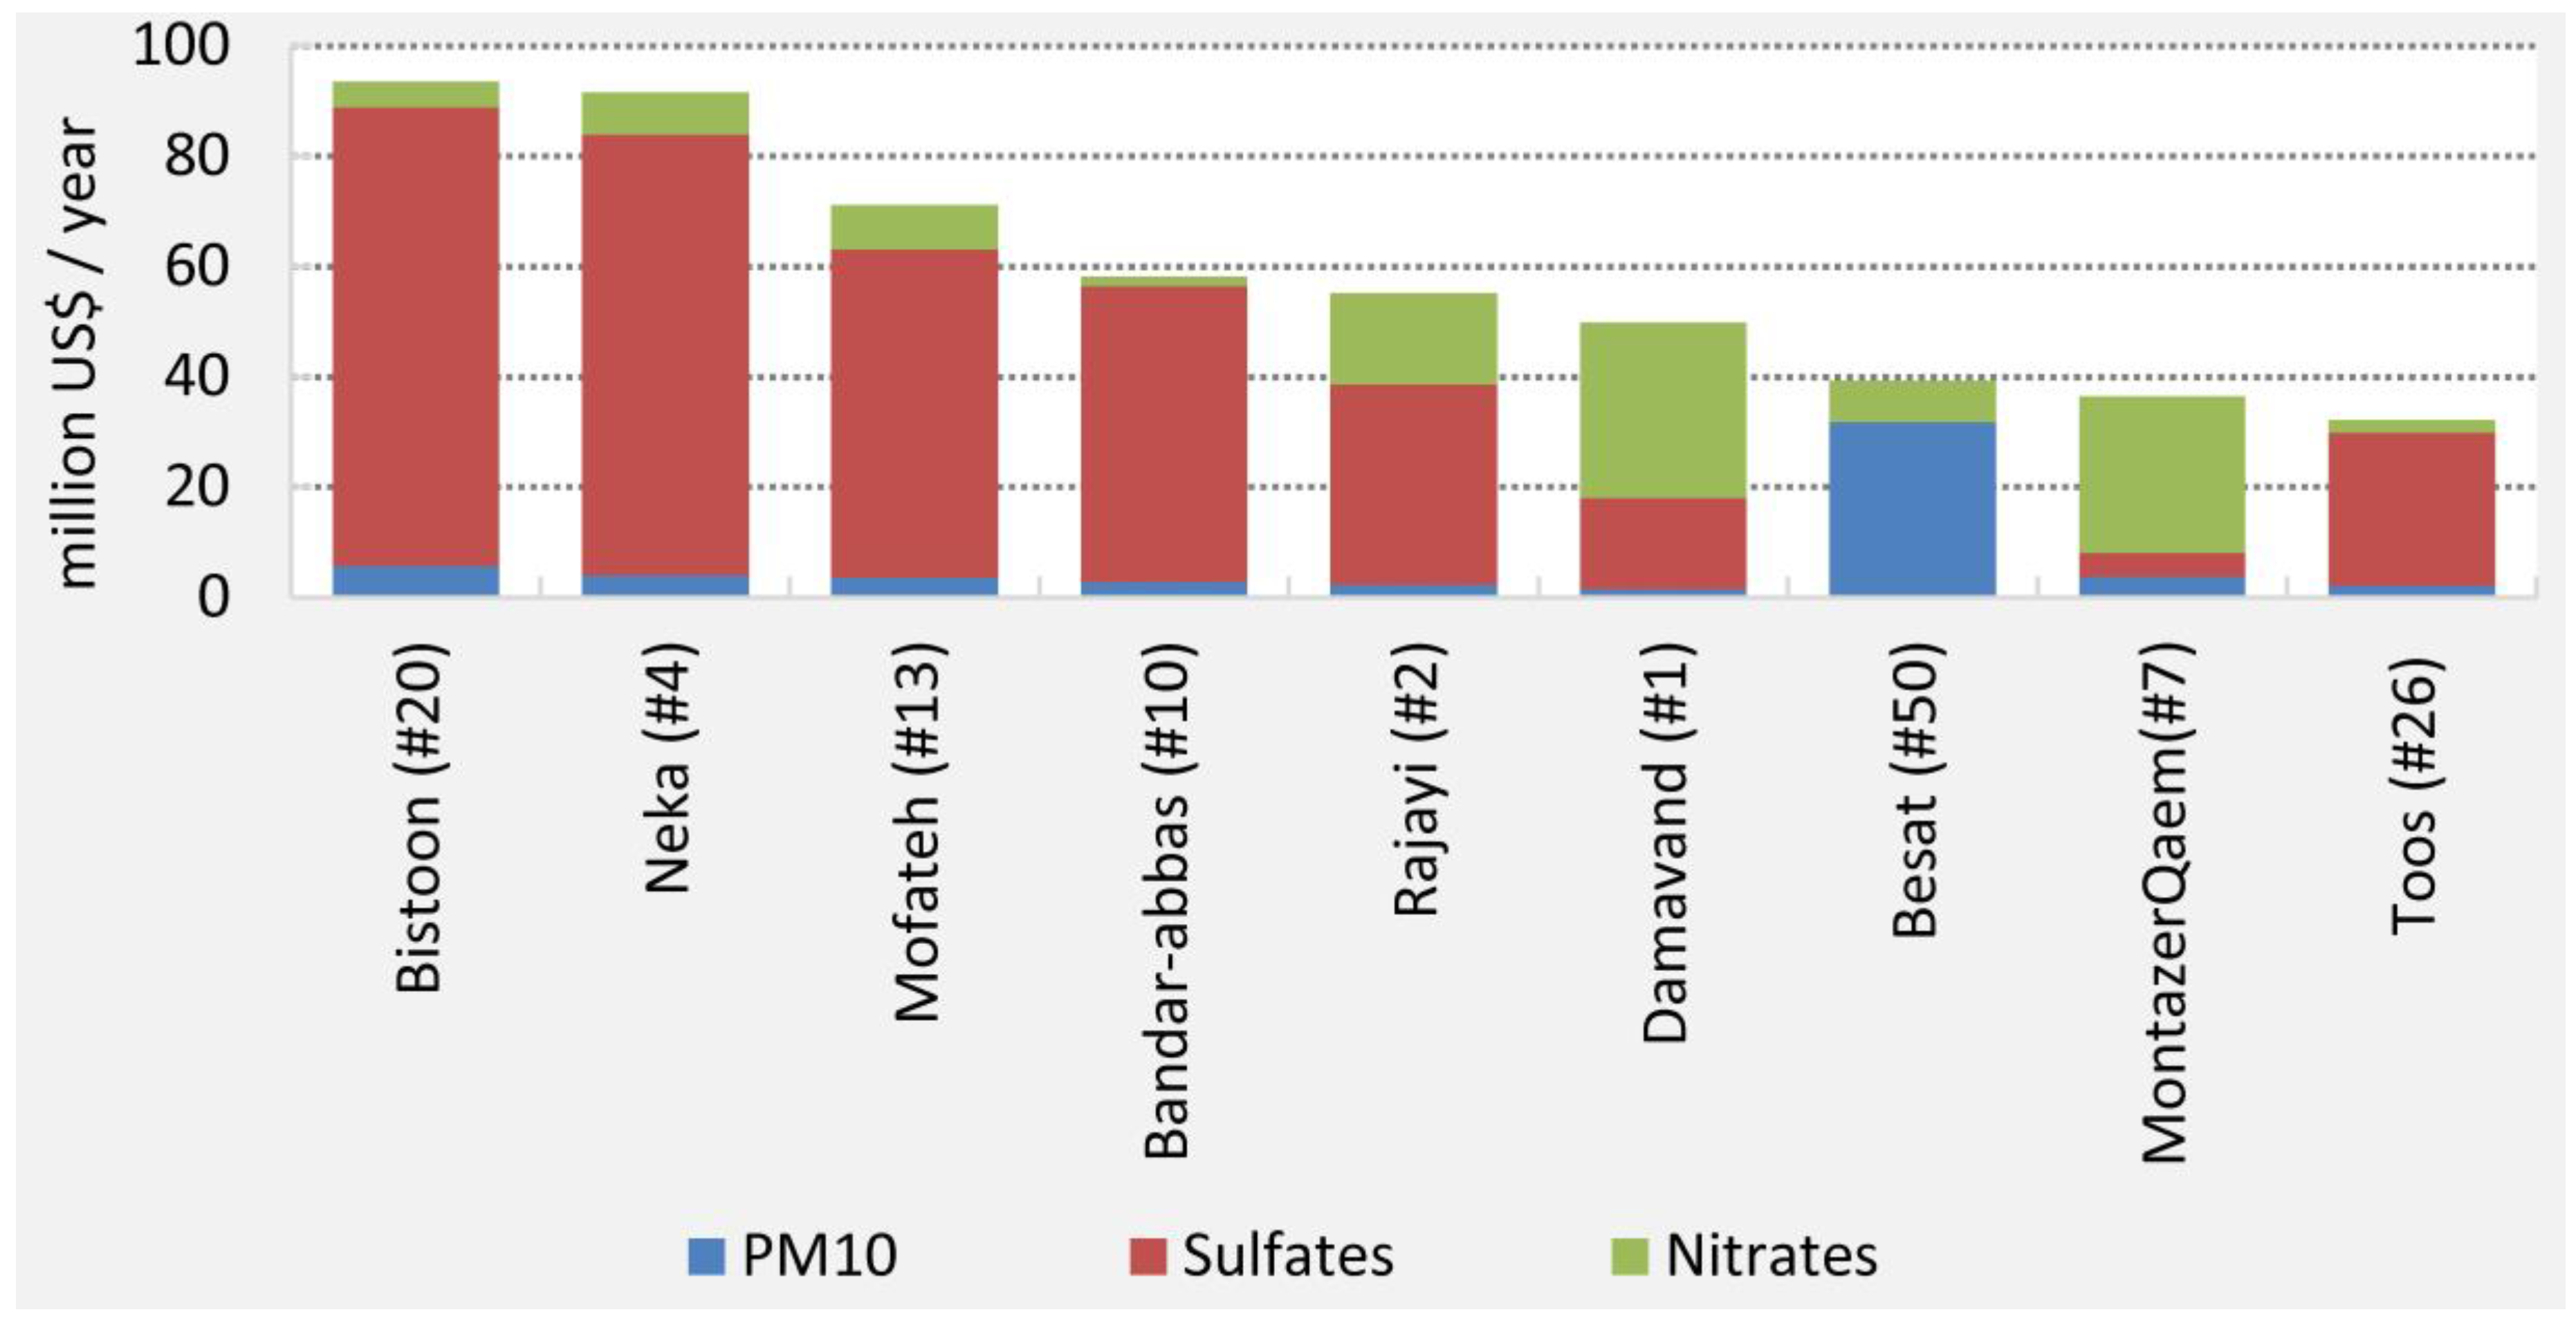
Table A5 presents the health damage costs from the 61 power plants by type of pollutants and damage cost per generated electricity, as well. This table shows that the total damage cost from all the 61 power plants is 723.42 million USD (2000) and health damage costs vary from 0.11 to 93.59 million USD. The plants Bistoon (#20), Neka (#4), Mofateh (#13), Bandar-abbas (#10), Rajayi (#2), Damavand (#1), Besat (#50), MontazerQaem (#7), and Toos (#26) are the highest in total health damage costs. These nine plants cause 72.9% of total damage costs.
Figure 7 shows health damage costs from these nine plants with respect to the type of pollutants. The majority of these nine plants have the high contribution in fuel oil consumption and consequently in SO
2 pollution, except for Besat (#50) and MontazerQaem (#7). These two plants are near the capital with very high population density, and hence the large amount of the receptors increases the health costs from these plants. As mentioned earlier, SIMPACTS shows the results for all 1681 grids around the plant. Therefore, it shows that 98% and 82% of health costs occur on 25 grids around Besat (#50) and MontazerQaem (#7), respectively. Generally, on average, about 35% of health costs occur on 25 grids around the 61 power plants (i.e., at a square size of 250 × 250 km).
Furthermore, Iran-shahr (#55) consumes a large quantity of diesel and this plant is 8th-largest in SO
2 emissions. Nevertheless, according the
Figure 4 and
Table A1, this plant is in the low-density population area. Consequently, the location of the power plant has a significant effect on the external cost due to pollution. Generally, the low quality of fossil fuel and high population density around power plants account for large health effects.
In addition,
Table A5 shows that damage cost per generated electricity varies from 0.06 to 22.41 USD/MWh. The average cost from the 61 plants (i.e., total health damage costs to total electricity generation from the 61 plants) is 2.85 USD/MWh. The damage cost per generated electricity of Besat (#50), Bistoon (#20), Mofateh (#13), Neka (#4), Toos (#26), and Bandar-abbas (#10) are highest and their values are more than 8 USD/MWh. Since Besat (#50) is a comparatively small plant, but with a high damage cost, its damage cost per generated electricity is 22.41 USD/MWh.
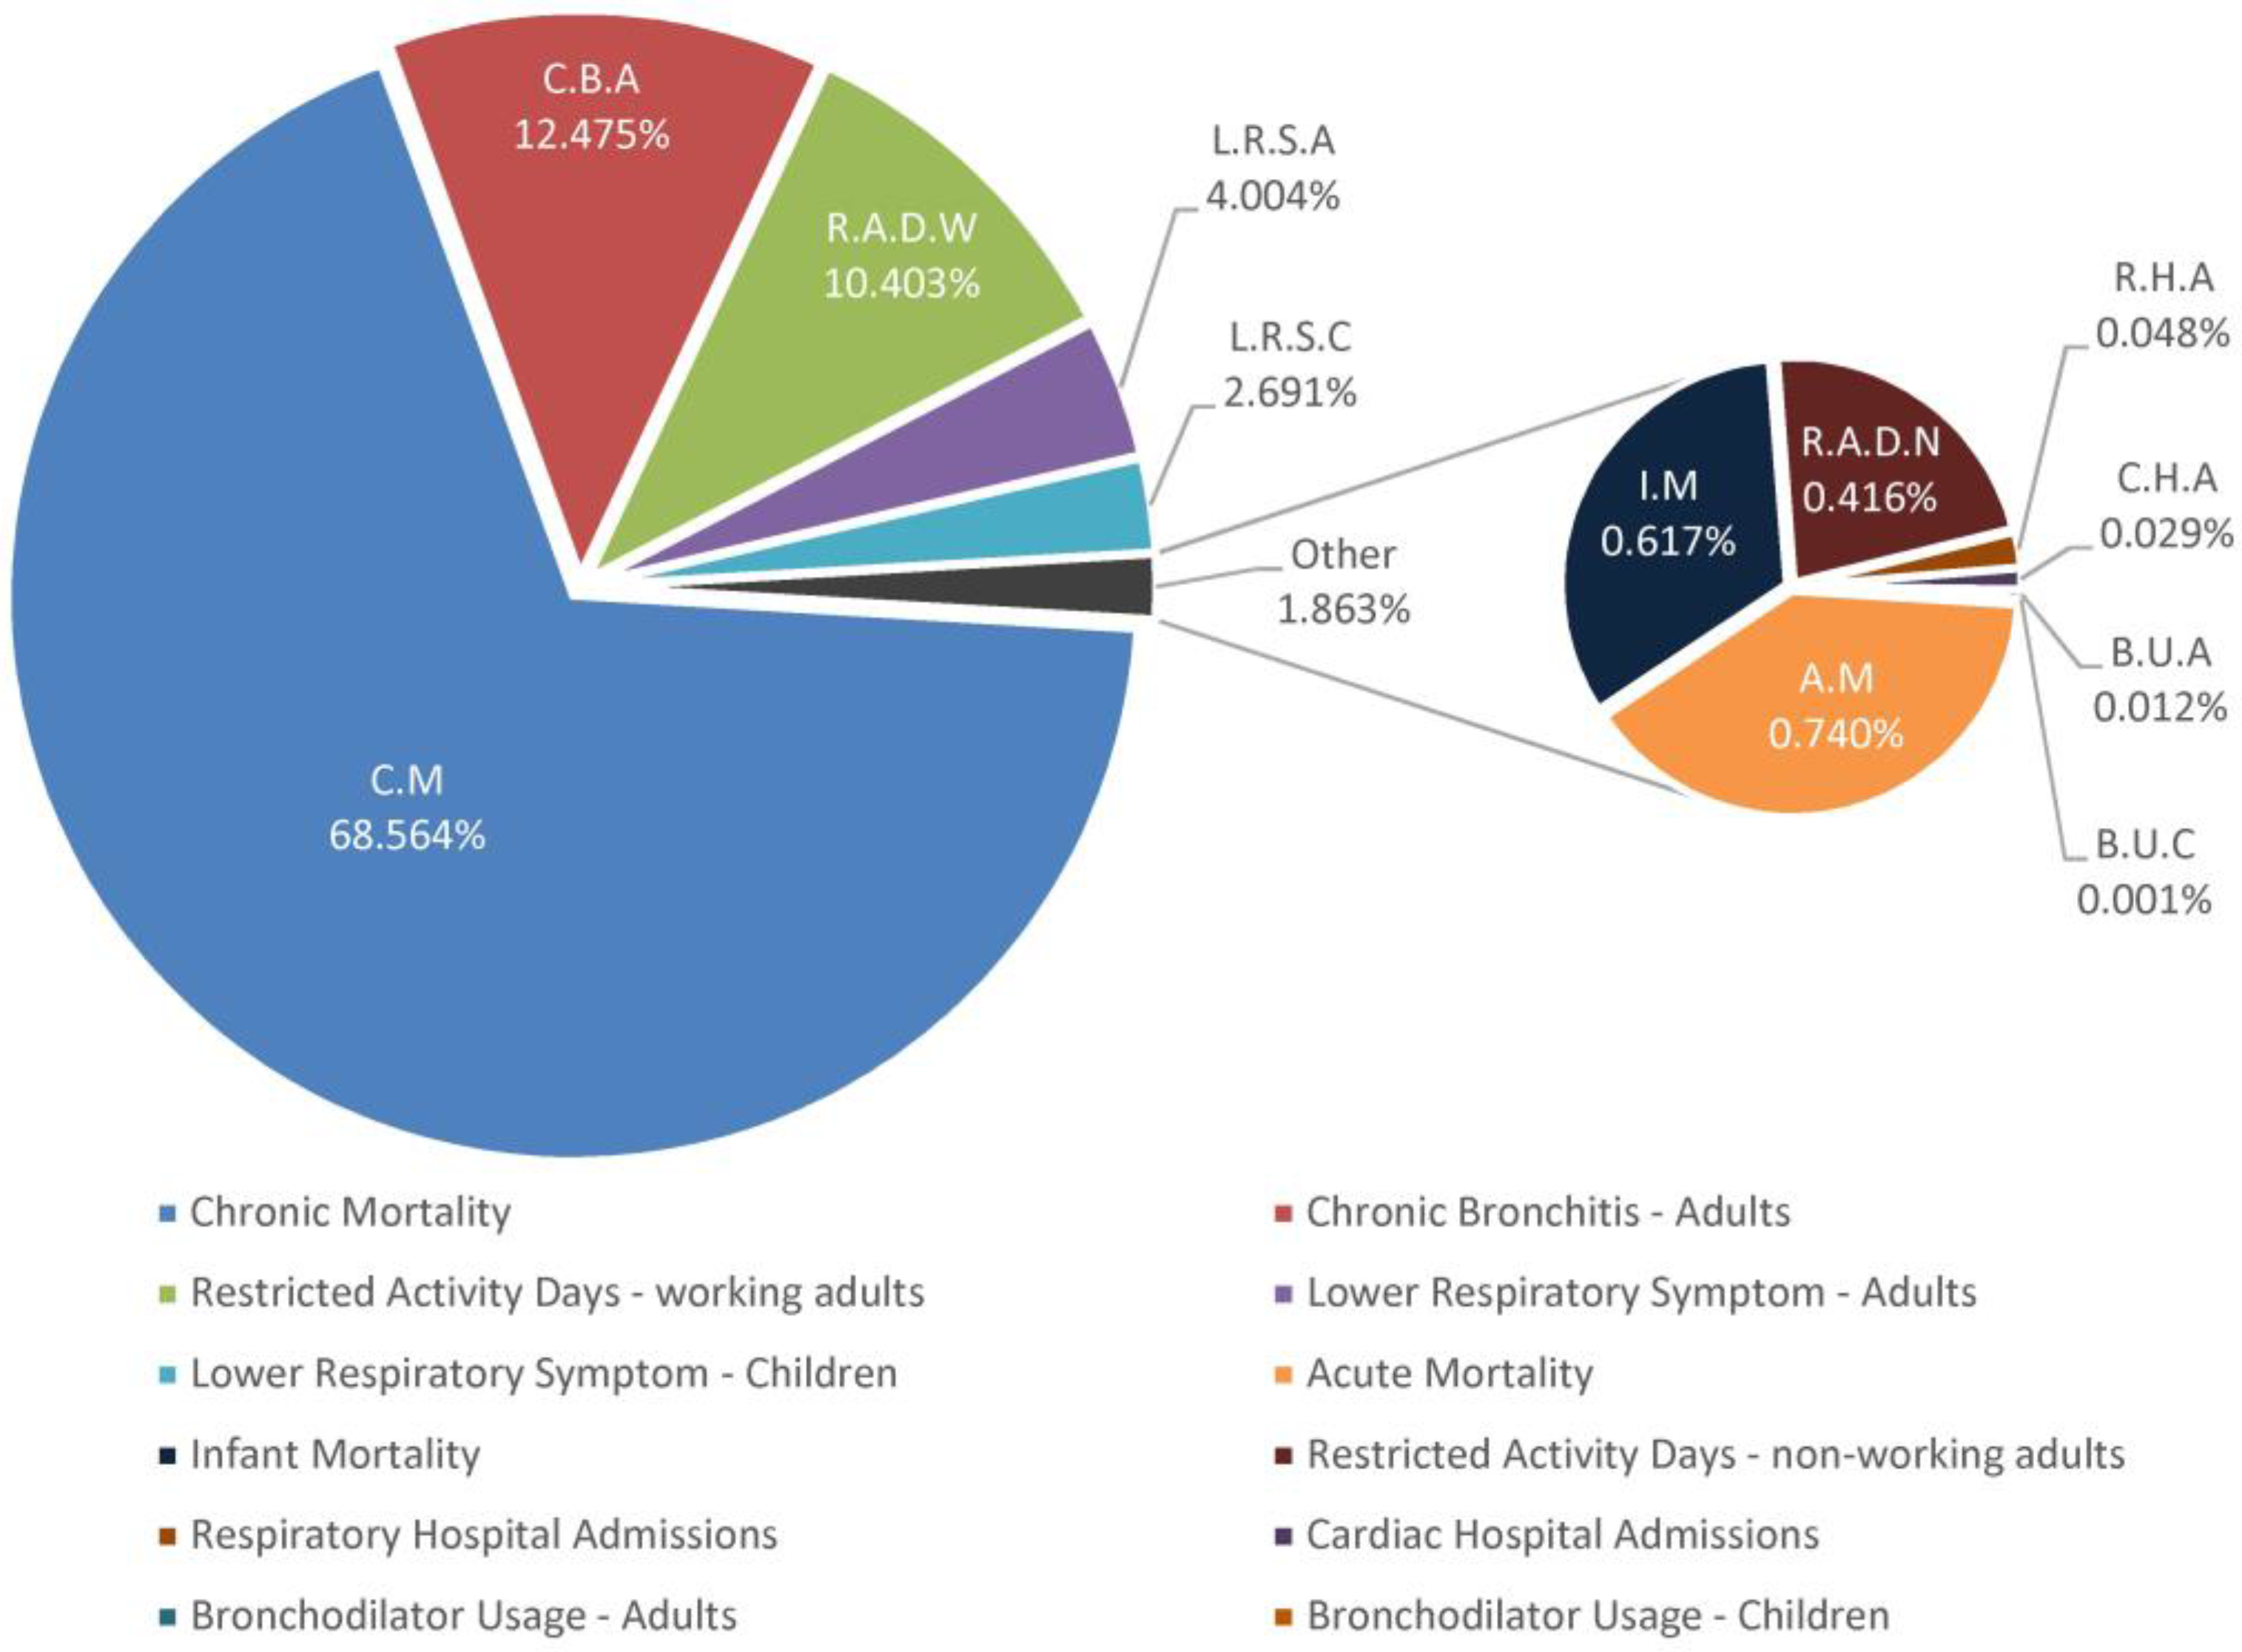
Table 3 displays the total health damage costs from the 61 power plants by type of the health impact and by type of the pollutants.
With respect to
Table 3,
Figure 8 shows that the impacts of Chronic Mortality, Chronic Bronchitis in Adults, and Restricted Activity Days in Working Adults have the highest health costs, with shares of 68.56%, 12.47%, and 10.40%, respectively.
The results show that the pollutants caused significant damage to both mortality and morbidity. These results describe that chronic mortality costs stand for majority of the total damage costs obtained. Additionally, the low damage costs are mainly due to the negligible sulfur content in the fuel and the low PM
10 and NO
X emissions and lower population density near the power plants. In addition, sulfur species represent main part of the total costs. The last row of
Table 3 states that the major impacts for all considered pollutants have been made by sulfates, which accounted up to 60.4% of the total damage costs, and the costs from nitrates and PM
10 contributed 30.0% and 9.6%, respectively. Since Iranian plants consume large amounts of natural gas, the sulfate share in the total cost is smaller than similar studies; further, the nitrate share is larger than in similar studies. For example, Thai and Syrian studies have estimated that sulfates accounted up to 83% and 88% of the total damage costs, respectively, with the costs from nitrates being 9% and 10%, and the costs from PM
10 being 8% and 2%, respectively. In these studies, Thai power plants consume natural gas, lignite, and oil, while Syrian plants use heavy fuel oil and natural gas [
13,
16].
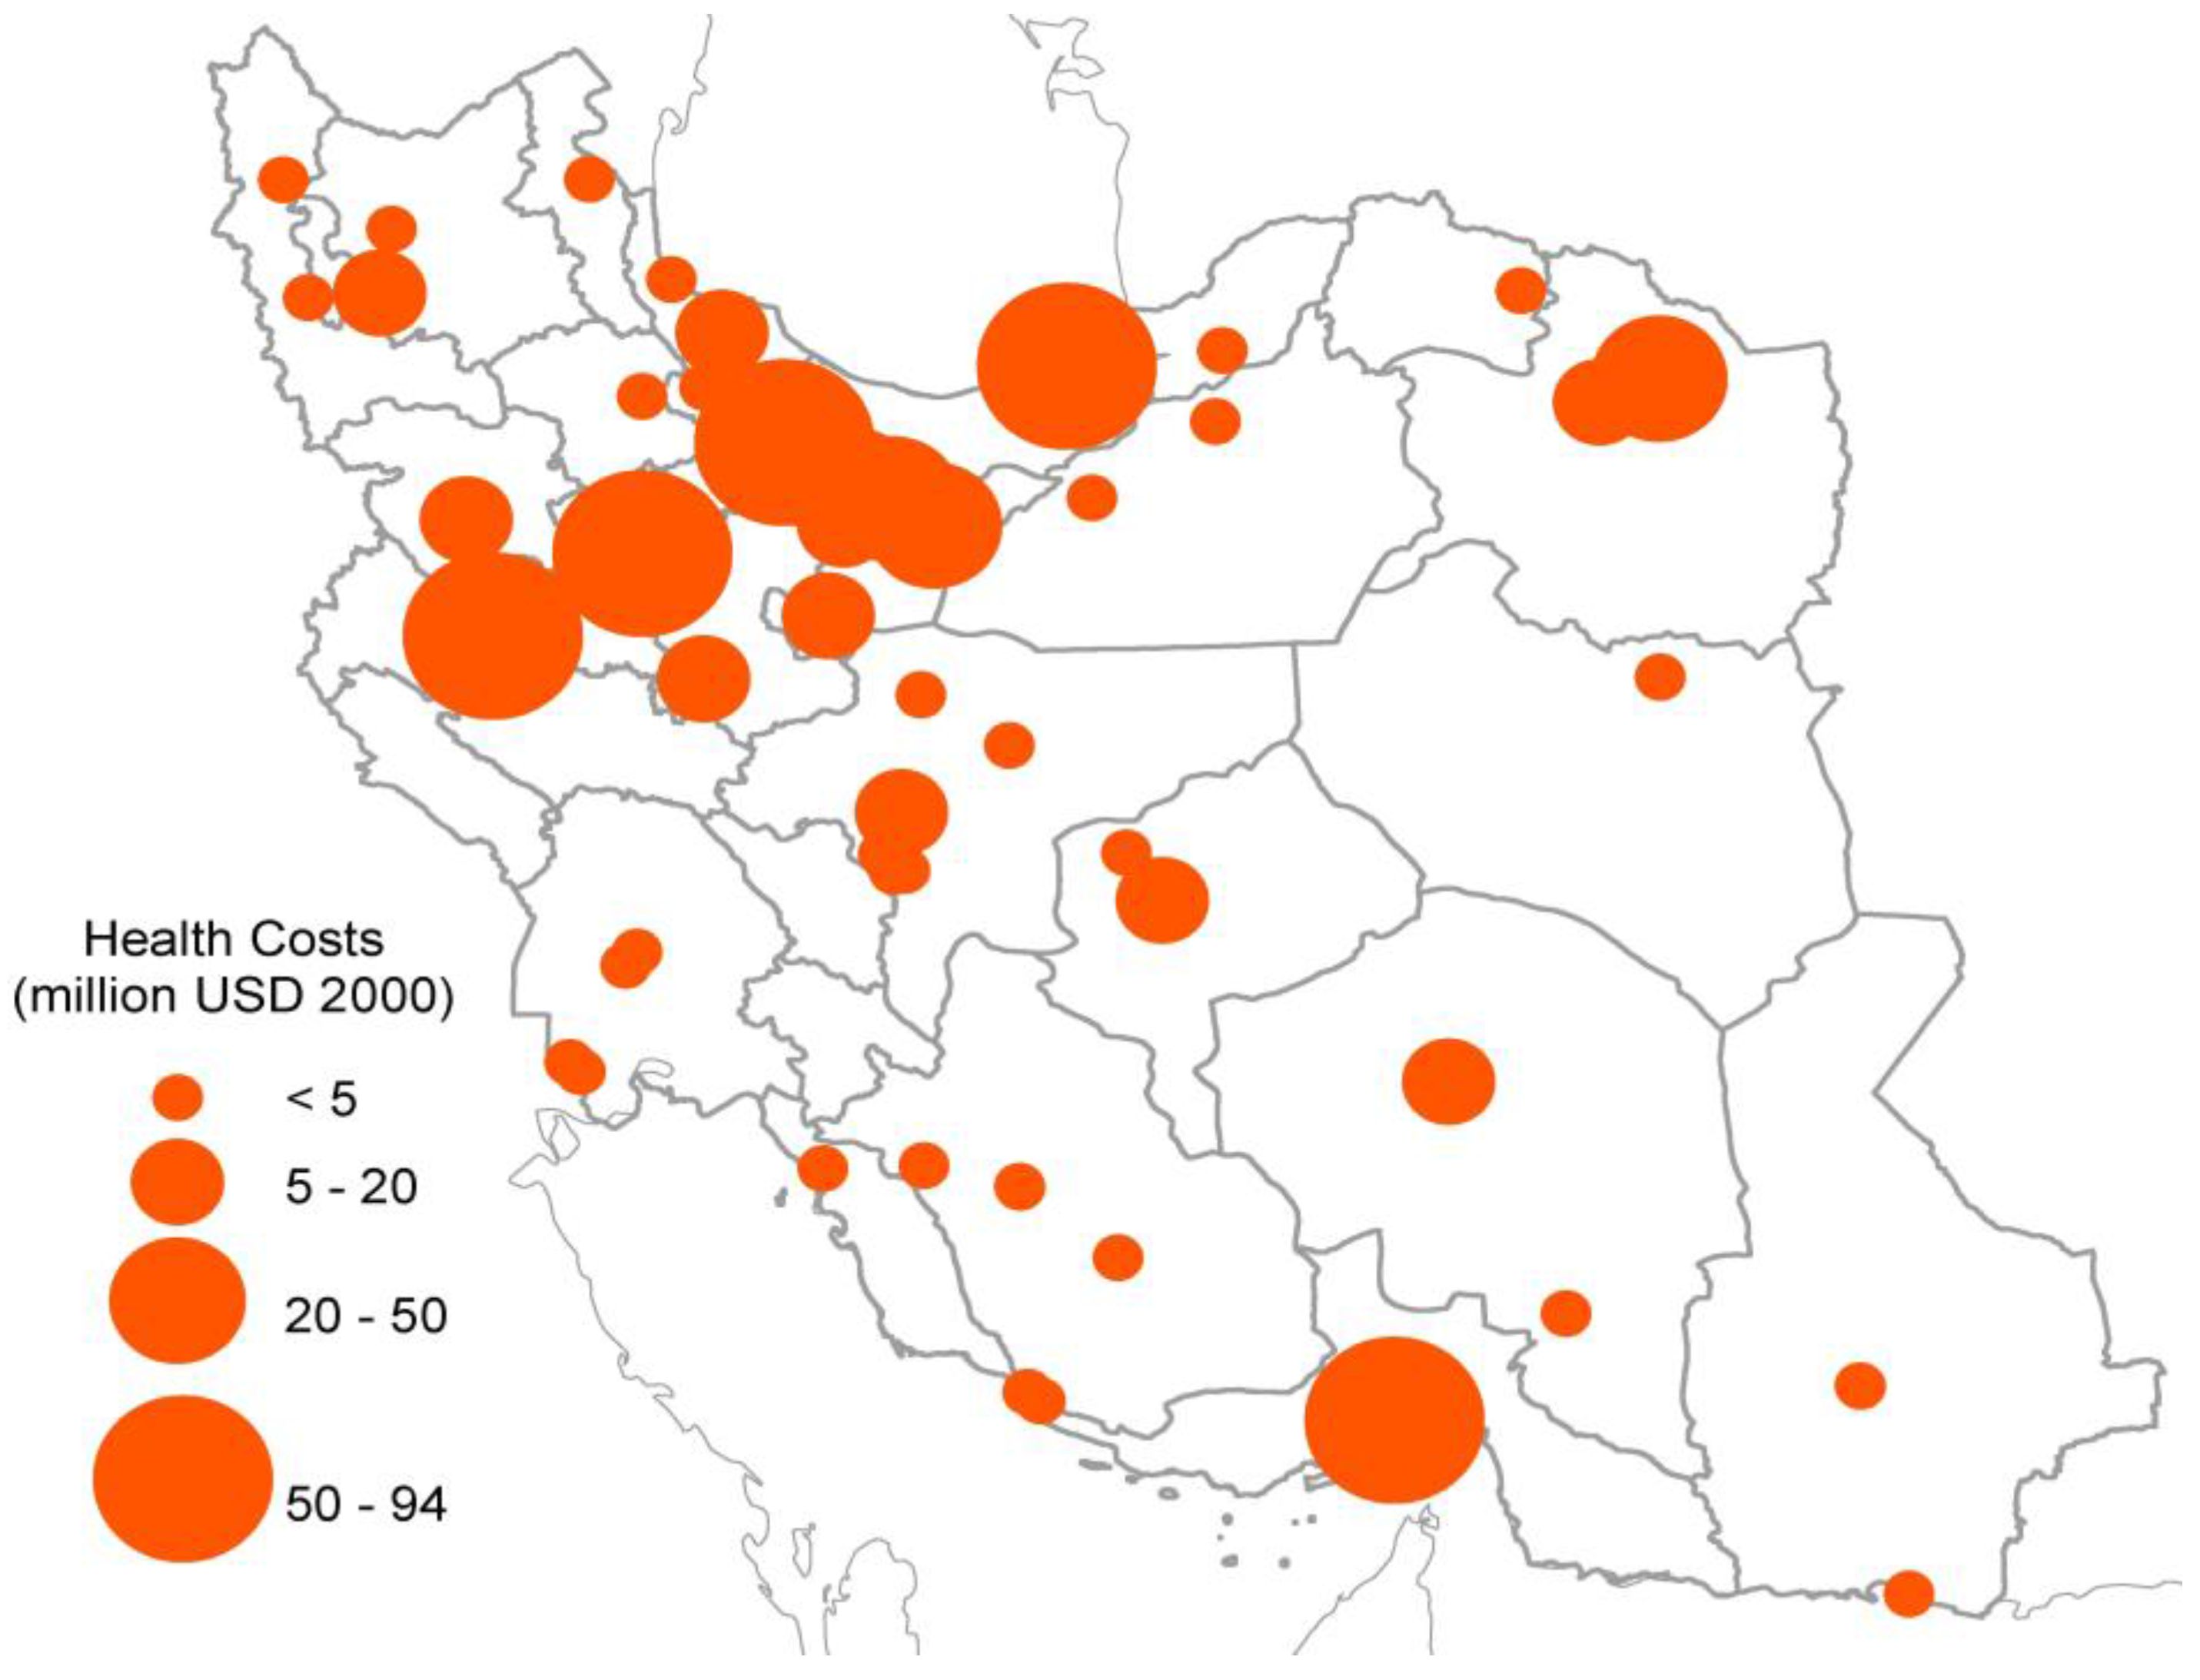
As a final point,
Figure 9 depicts distribution of total health costs from all 61 power plants in Iran. According to
Table A5, the health costs of 41 plants are less than 5 million USD. Moreover,
Figure 9 shows that the health costs are high mainly around the capital and west provinces of the capital, where pollutants from electricity generation cause significant damage on human health.
5. Discussion and Conclusions
The most important impact of fossil-based power plants is airborne pollution. The external costs of electricity generation represent the uncompensated monetary value of the associated environmental and health damages. Thus, society will accept the excess costs from electricity production that are not reflected in market prices.
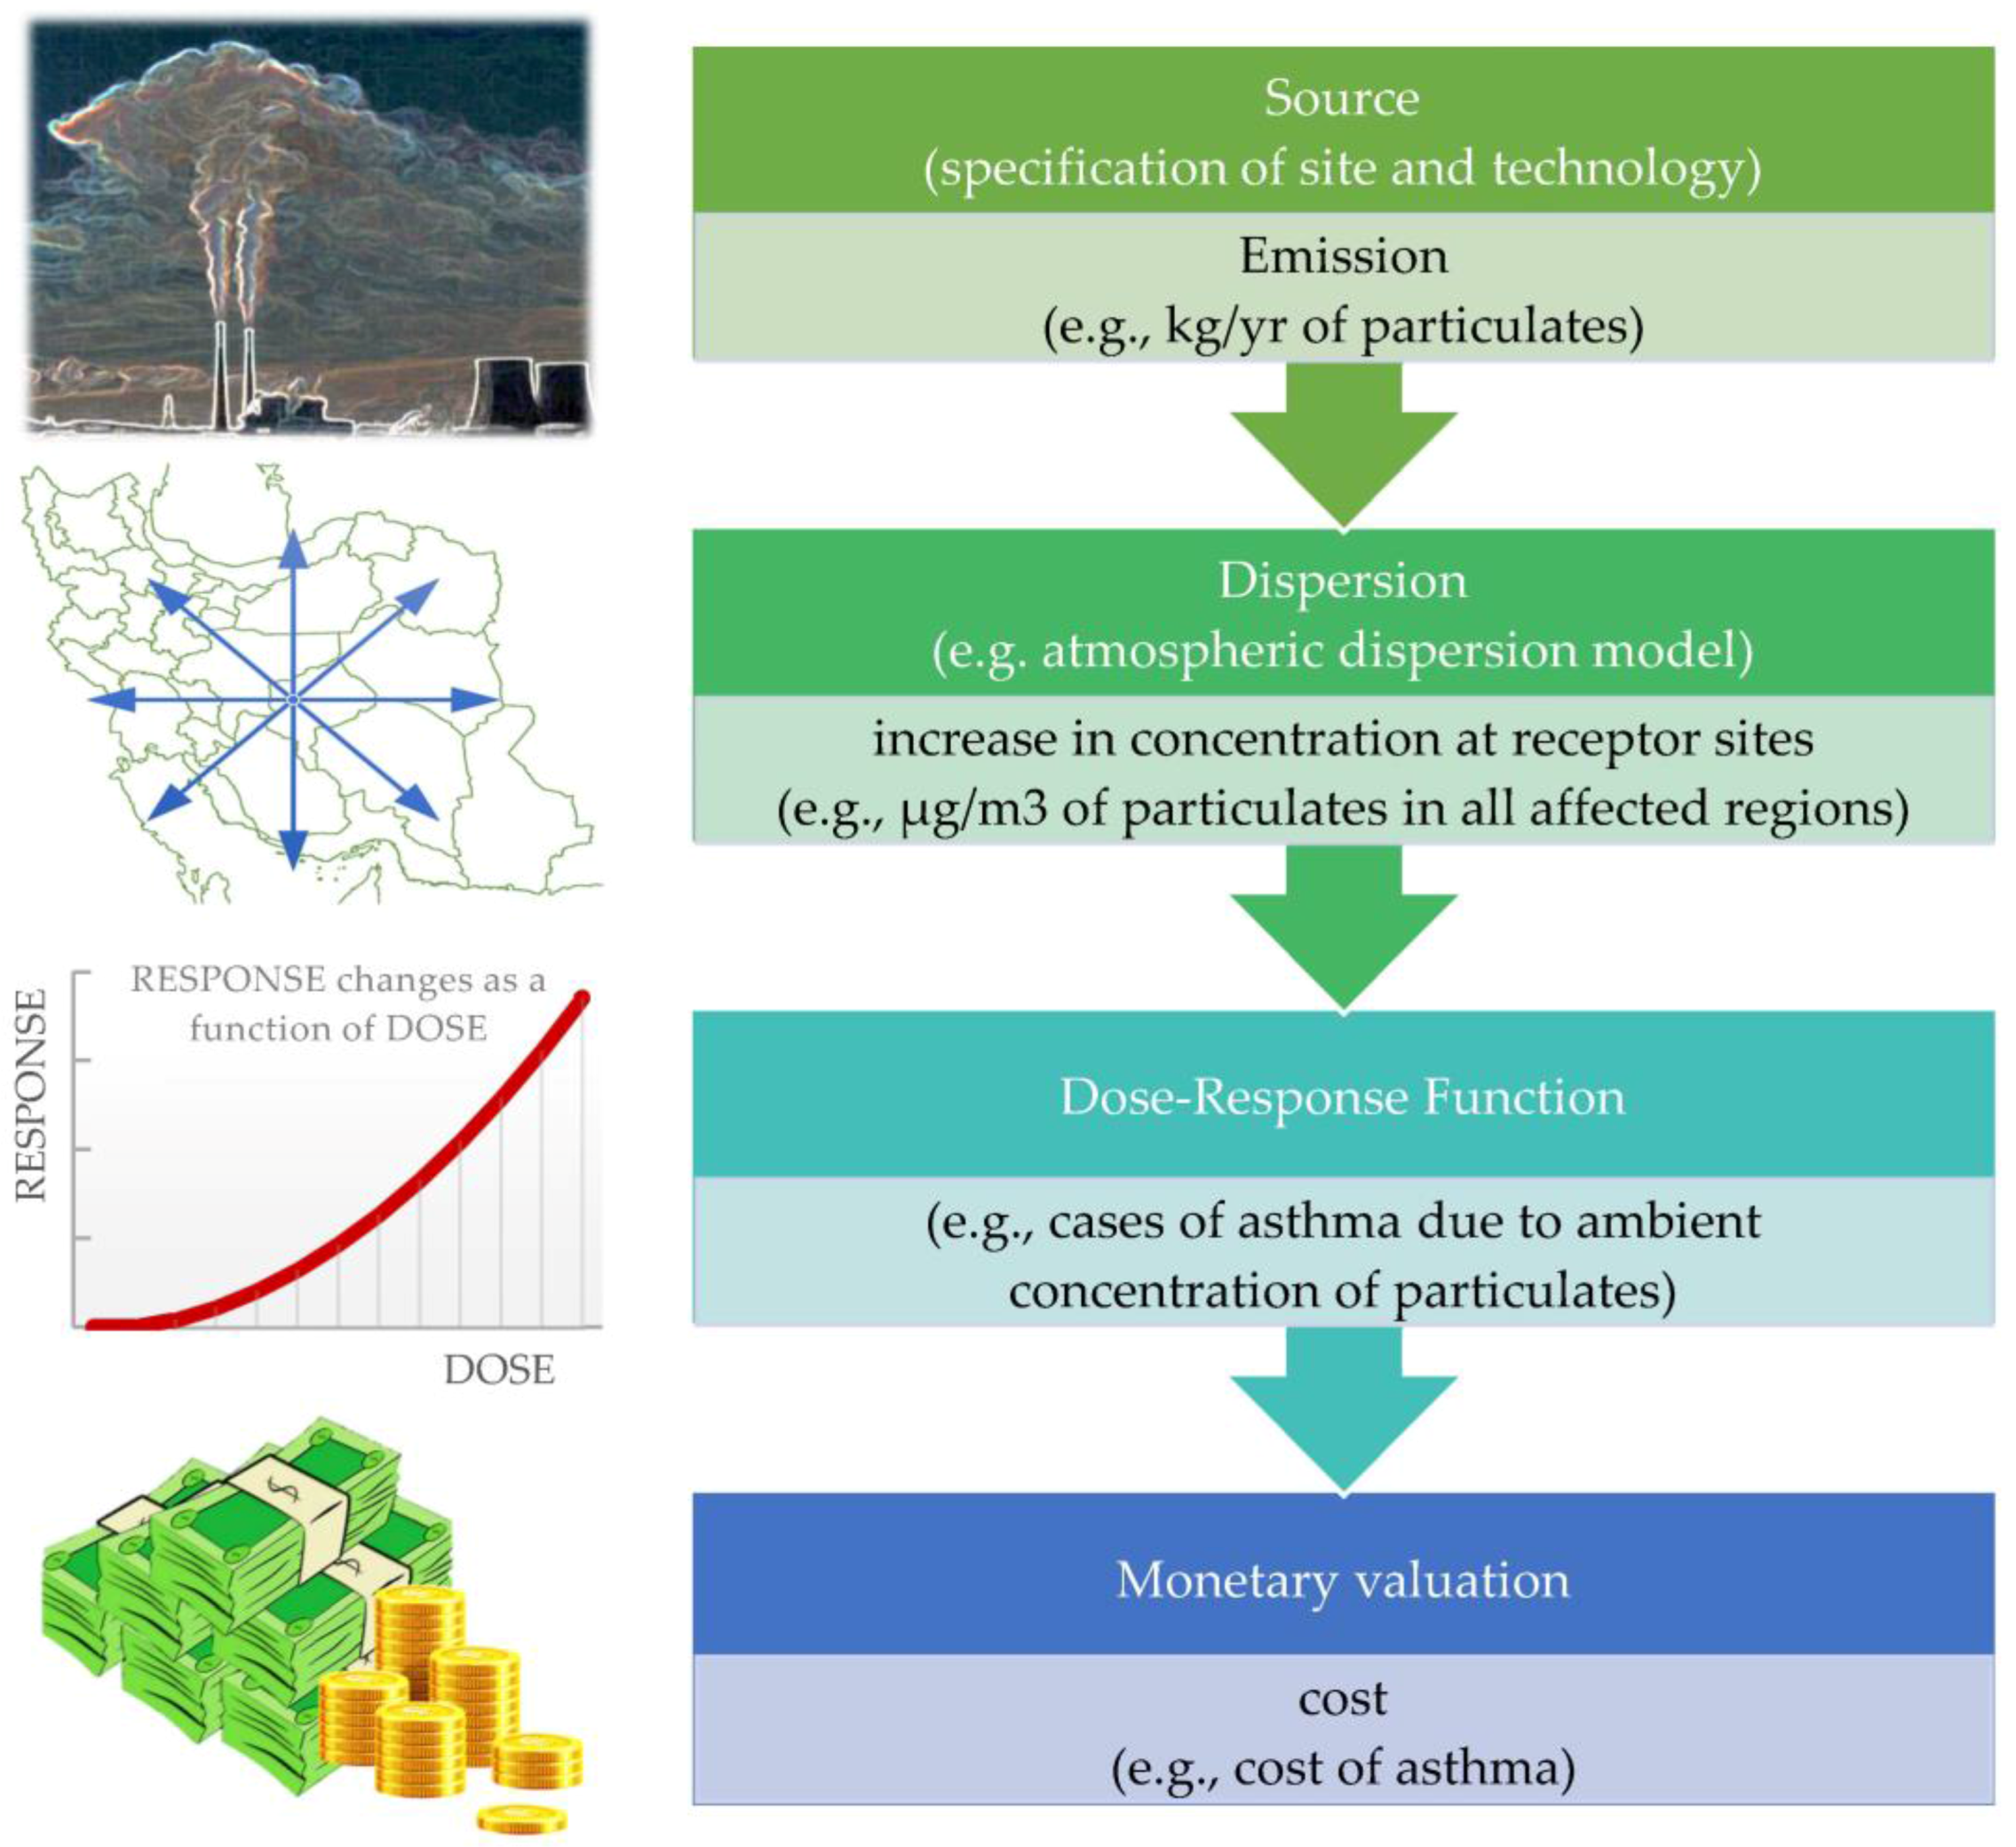
In this study, we apply the impact pathway approach to estimate the health impacts arising from air emissions stemming from Iranian fossil-based electricity generation for one year. In a next step, we evaluate the monetary costs of the estimated damages. We use the new version of SIMPACTS (March 2016) to investigate the health effects from the 61 fossil power plants separately and individually. In this analysis, we cover the whole country and investigate health effects from all large fossil power plants, one by one. Our detailed approach strongly increases the reliability of the results because the different locations, the distribution of population around the plants, the meteorological conditions, the fuel consumption, and the pollutant emissions are jointly taken into account. In this way, our approach provides more reliable estimations in comparison with previous studies using extrapolations based on one or a limited number of plants. Moreover, to find a better value for population density around every power plant, we use the population of all sub-provinces of Iran. Subsequently with the help of the ArcGIS 10.5, we calculate the precise population density for each of the 61 power plants. Since fossil plants have a high contribution in SO2 and NOX emission, we use the appropriate national values for emission factors of these air pollutants from electricity generation. We use the benefit transfer method to fill in gaps in the availability of information. The calculated total health damage cost is 723.42 million USD 2000. The damage cost per generated electricity unit varies from 0.06 to 22.41 USD/MWh, and its average is 2.85 USD/MWh.
There is another Iran study conducted in 2007 selecting only five fossil plants to calculate external costs by generalizing the results to all regions of Iran. The damage cost per generated electricity of their study vary from 15.94 to 74.66 USD (2000) per MWh [
44]. Their study consists of SO
2, NO
X, and SO
X pollutants. Additionally, their results include the environmental damage cost of CO
2. They mention that for the estimation of total external damages generated by power plants (besides health costs), a medium value of 85% is selected for external health effects of air pollution. Thus, these matters cause the different results between the 2007 study for Iran and the current study. In addition, the fuel oil consumption in Iran has decreased by about 50% from 2007 to 2017.
Although economic issues are still the main factor in choosing the generation method, Iran has taken several measures to consider environmental issues and to decrease the adverse effects of electricity generation, such as the implementation of environmental assessment in construction of new power plants, developing and using renewable energy, and increasing efficiency of thermal power plants by construction of steam section of combined cycle power plants, and dispatching units with respect to higher efficiency. One of the most significant actions in reduction of pollutants from Iran power plants in the last years is replacing liquid fuels (fuel oil and diesel) with natural gas as a clean fuel, especially in plants close to large cities. This action started in 2014 and has continued by cooperation between Iran’s Ministry of Petroleum and Ministry of Energy. Nevertheless, in the cold seasons, due to consumption of natural gas in residential sectors, several plants, despite the proximity to high density population areas, use liquid fuels.
This study exhibits the health impacts and costs for every 61 plants. These independent results are useful to classify the power plants based on their health damages and taking measures according to their priority. We found that there are power plants near the densely populated regions that create high health impacts and costs. The plants Bistoon, Neka, Mofateh, Bandar-abbas, Rajayi, Damavand, Besat, MontazerQaem, and Toos cause high health damage costs. These nine plants cause 73% of total damage costs from Iran electricity generation. The majority of these nine plants have a high contribution in fuel oil consumption. In addition, Damavand, Rajayi, and MontazerQaem use large amounts of diesel. Consequently, at first, the liquid fuels in these plants should be replaced quickly. For instance, the statistical reports show that MontazerQaem has consumed large amounts of fuel oil in the past years but then the fuel oil consumption in this plant has reached to zero. Such actions decrease the emissions of health-harmful air pollutants. In addition, improving efficiency and fuel consumption, using the appropriate emission reduction technologies, and locating polluting plants farther from densely populated areas decrease the external costs.
There are uncertainties involved in calculating external costs for power generation, for example, estimating of the data, the applied assumptions in models, and deriving the monetary valuation of damage costs. Nevertheless, it is better to have even an estimation of the externalities instead of disregarding them entirely. Also despite the uncertainties in the results, it is possible to reach meaningful conclusions. However, more research in the field of fossil electricity externality is necessary.
A general conclusion from this study is that air emissions from fossil plants have a large impact on human health and the related external costs are high. Considering the external costs can affect the electricity generation expansion planning. Internalization of the external costs in the price of electricity would increase the production cost from fossil fuels and hence fossil electricity alternatives become competitive. Therefore, cleaner and low emissions energy technologies with lower external costs (even with higher private costs) can be used to increase benefits for society.


