Article

Research on Pulsed Jet Flow Control without External Energy in a Blade Cascade

Jiangsu Province Key Laboratory of Aerospace Power System, College of Energy and Power Engineering, Nanjing University of Aeronautics and Astronautics, Nanjing 210016, China
*
Author to whom correspondence should be addressed.
Energies 2017, 10(12), 2004; https://doi.org/10.3390/en10122004
Submission received: 15 October 2017 / Revised: 19 November 2017 / Accepted: 22 November 2017 / Published: 1 December 2017

Abstract

:
To control the flow separation in the compressors, a novel pulsed jet concept without external energy injection is proposed. The new concept designs a slot in the middle of the blade and sets a micro device to switch the slot periodically. Such a structure is expected to generate a pulsed jet by the pressure difference between the pressure side and the suction side of the blade. In order to analyze the interaction between the pulsed jet and unsteady separated flow, our numerical and experimental study is based on a specific cascade (with a flow separation inside) and a pulsed jet (one of the unsteady flow control method). The experimental and numerical results both show that when the frequency of pulsed jet is approximate to that of the separation vortex, then the control tends to be more effective. Based on the numerical simulations, the proper orthogonal decomposition (POD) is then used to reveal the control mechanism, extracting the different time-space structures from the original field. The results with the aid of POD show that the pulsed jet can redistribute the kinetic energy of each mode, and strengthen or weaken certain modes, particularly, while the steady jet reduces the kinetic energy of high-order modes in whole. Also, pulsed jet with proper parameters can transfer the energy from higher modes to the first flow mode (averaged flow), which is due to the conversion of the spatial vortical structures and the time evolution of the modes.

1. Introduction

Flow separations are always related to drag increase, lift, and kinetic energy losses, and so on. Many researchers have long been preoccupied with finding the solutions with the declining flow separation. Some are even avoiding this issue entirely. The flow control techniques have been mainly focused on the optimizing design of compressors. The passive flow control has been widely used in most studies for convenient application [1], but it is not flexible during the off-design conditions and may suffer from poor performance in some statuses. Meanwhile, the active flow control can be adjusted with the change of the actual flow condition.
Two typical active flow control methods, aspirated control (steady) and synthetic jet (unsteady), are promising to apply for compressors. Kerrebrock et al. from MIT firstly brought up the concept of aspirated compressor [2], which introduces an additional low-pressure air supply to aspirate low-energy fluid, in order to suppress the separation and improve the pressure ratio of a single stage. After this concept was put forward, MIT, NASA, GE, and P & W have done a lot of researches on aspirated compressor. It is worth mentioning that GE employs the aspirated compressor technique on high bypass ratio turbofan, and this helps to increase about 30% of the aerodynamic load [3]. According to both experiments and numerical simulations, flow separations are shown to be unsteady in a wide range of Reynolds number. Using the unsteadiness potential, the unsteady flow control or periodic excitement methods were seen as more effective than the traditional steady flow control methods, and could save one or two orders of magnitude of the momentum injection that is necessary to achieve the same improvement of performance [4,5,6]. Similar results had also been validated in the compressors [7,8,9]. Unlike aspirated control, synthetic jet control that uses periodic excitation to interact with the unsteady vortices, is a typical kind of unsteady flow control method. Culley et al. [10], from NASA Glenn research centre, and Hecklau [11] from Germany, have done a representative research on the introduction of synthetic jet to compressors. Culley’s study shows that the using only 0.1% mass flow rate of the compressor, the synthetic jet can reduce 4% total pressure loss of the stator. Moreover, the characteristics of the pulsed jet actuator are focused on [12] and LEM (lumped-element model) evolved to help the design and the performance evaluation of synthetic jet actuators [13]. Thus, it turns out that synthetic jet is an effective unsteady flow control technique.
However, active flow control is usually related to the complex structure, increased weight, and external air supply, making it more practical in external flow, while being barely used in the internal flow of the compressor. With such drawbacks, its current technical development cannot satisfy the requirements of high load compressors. That means the active flow control method is necessary to improve the performance and to avoid the shortcomings when using the passive flow control of the compressors. So, MIT and NASA presented the researches of the aspirated compressors, which control the flow separation by steady suction if needs to work [14,15]. But, the steady active control methods need external energy and devices, such as: steady suction and blowing.
Thus, this paper presents a novel implementation to control the flow separation in the high load compressors, using the unsteady control method in order to decrease the energy cost for flow control. As a preliminary work, this idea is aimed at stators and guide vanes. In comparison to the aspirated compressor [16] and synthetic jet [17], micro pulsed jet has the advantages of no external energy injection, lightweight, simple structure, and the potential of better control.
To attain the remarkable control effects with this new implementation, it is important to analyze the unsteady control features and mechanism initially. Although some studies were seen of its potential and many applications in recent years, the essential understanding of its mechanism and the true optimization of the control strategy seem not to match with its growth [18]. Currently, there is no unifying in-depth background on the unsteady control mechanism; for example, some interpreted it as an influence between the separation vortex and vortex pair that is induced by the pulsed jet [11]. Some attribute it to reasonably organizing different coupling vortices in the flow field [19]. The complex coupling of trans-scale vortical structures makes the unsteady control mechanism difficult to reveal, so it is necessary to establish a reduced-order model [20] or to employ a method to extract the useful information from the flow field, such as proper orthogonal decomposition (POD) method. A number of methods are suitable for extracting the essential dynamical features from data describing fluid flows, but general techniques are not as well developed for nonlinear systems [21]. So, a nonlinear reduced-order model was established by us in order to partially deal with this issue [20]. POD can help us to decouple the time-space structures in the complex field, so it is introduced in this paper.
Initially, POD was brought up by Lumley (1967) [22] to evaluate the coherency of the turbulent structures. Due to the function of the dimension reduction and feature extraction, POD was firstly used to analyze the features of the simple flow, such as the flat plate boundary layer [23] and circular cylinder flow [24]. In recent years, POD was extended to deal with the hidden structures of the complex flow, for example, the multi-element airfoil [25] and rotor-stator interaction in turbines [26]. POD can be used to produce a certain amount of patterns from the original unsteady flow field during a certain period, and then these patterns will be expressed mathematically as a series of expansions. Due to that the sorting of these patterns is based on its kinetic energy, the main characteristics of the original flow field can be approximately described by several high energy or low-order modes. The change of a certain flow structure with different control parameters can then be analyzed by comparing the corresponding modes, making it easier and more efficient to obtain the mechanism of unsteady flow control.
In this paper, a novel pulsed jet concept without external energy injection is proposed initially. With this concept, the micro pulsed jet is driven by the pressure difference between the suction side and pressure side of a blade. The unsteady flow control (employing pulsed jet) based on it is evaluated experimentally and numerically to get its characteristics with and without the external control. Also, in analyzing the mechanism of the unsteady flow control, POD is used to illustrate our main conclusions accordingly.

2. The Novel Concept of Pulsed Jet without External Energy Injection

2.1. Analysis of Typical Unsteady Flow Control Schemes

In this paper, several possible and practical unsteady flow control schemes, including synthetic jet, unsteady aspiration, pulsed jet, and the combination of unsteady aspiration and pulsed jet, are analyzed. The schematic diagram of these schemes is shown in Figure 1.
With regard to synthetic jet, the large kinetic energy for creating high-velocity synthetic jet is extracted from the electrical energy, which is a kind of external energy supply. Also, the additional circuit tends to make the structure more complex. For unsteady aspiration, pressurized air may be released into the ambient atmosphere or a low-pressure stage, creating additional thrust loss or energy loss. Moreover, for pulsed jet and the combination of unsteady aspiration and pulsed jet, the energy supply is within the engine itself, and no pressurized air is released into the ambient atmosphere, however, the air bleeding pipe will make the structure of the compression system very complex and induce additional losses due to long pipes.
The practical unsteady flow control scheme demands simple structure and small energy losses. By comparing these schemes, we tend to use an unsteady flow control scheme with a nearby internal energy supply. Thus, in this paper, we introduce a novel concept of pulsed jet, which makes no use of external energy supply.

2.2. Introduction of the Novel Concept of Pulsed Jet without External Energy Injection

To suppress the flow separation on the suction side of the compressor blade, a novel concept of pulsed jet is presented, including a suction and a jet slot on each side of the blade, a fixed and a moveble slot gate, and an actuating device, as shown in Figure 2. The key parts of this idea are the two slot gates that are close to each other. One is fixed and the other is movable, drawn by the driving device at a certain frequency, thus, resulting in an unsteady throttling action, which matters mostly in the pulsed jet. When the slotted gate is opened and closed repeatedly, because of the pressure difference between the two slots, the pulsed jet of a certain frequency and velocity will then be generated. Using this frequency controllable pulsed jet, the flow separation over the suction side may be suppressed or even eliminated.
To verify the feasibility of this concept, an effective and practical electromagnetic driving device is designed as a preliminary work. A rotating slotted hollow cylinder was designed as the movable slot gate, which was driven by a micro motor. It is the key part of this easy-to-implement pulsed jet device, serving as the periodically on-off valve. When the slotted hollow cylinder rotates, sometimes the air circuit is connected to form the jet, while sometimes it is blocked and stops the jet. Through changing the oscillation mode to the rotation mode, the inertia of the movable slot gate can be weakened remarkably, saving energy for driving this switch. The schematic diagram of an electromagnetic pulsed jet device is shown in Figure 3.
Prior to using this pulsed jet device, some characteristics of the pulsed jet are investigated first, as shown in Figure 4. In this figure, we can see the blade with static pressure holes for us to measure the static pressure on its surface. The dynamic pressure transducer helps us to measure the dynamic pressure in the flow field. The inlet pressure cubage helps to stabilize the pressure at the inlet of the pulsed jet. To produce pulsed jet, the jet slot is controlled by a rotation slot gate, which is driven by an electromotor. An annular magnet is installed on the rotation slot gate, thus we can use a speed transducer to measure its rotating speed by monitoring the change of magnetic field. Based on the experimental data, the pulsed jet can be developed by this device, and then the pulsed jet frequency is proportional to the rotation speed of the hollow cylinder or electromotor. In this case, the frequency of the pulsed jet could reach a maximum of 800 Hz and continuously be adjusted by controlling the rotation speed of the micro electromotor, while the velocity waveform of the pulsed jet is close to a sine curve and its maximum velocity is about 35 m/s. All of the measured characteristics were used in setting the boundary conditions in the numerical simulation.

3. Numerical Simulation and Analysis of Flow Control in Cascade by a Pulsed Jet without External Energy Injection

3.1. Numerical and Flow Field Analysis (POD) Method

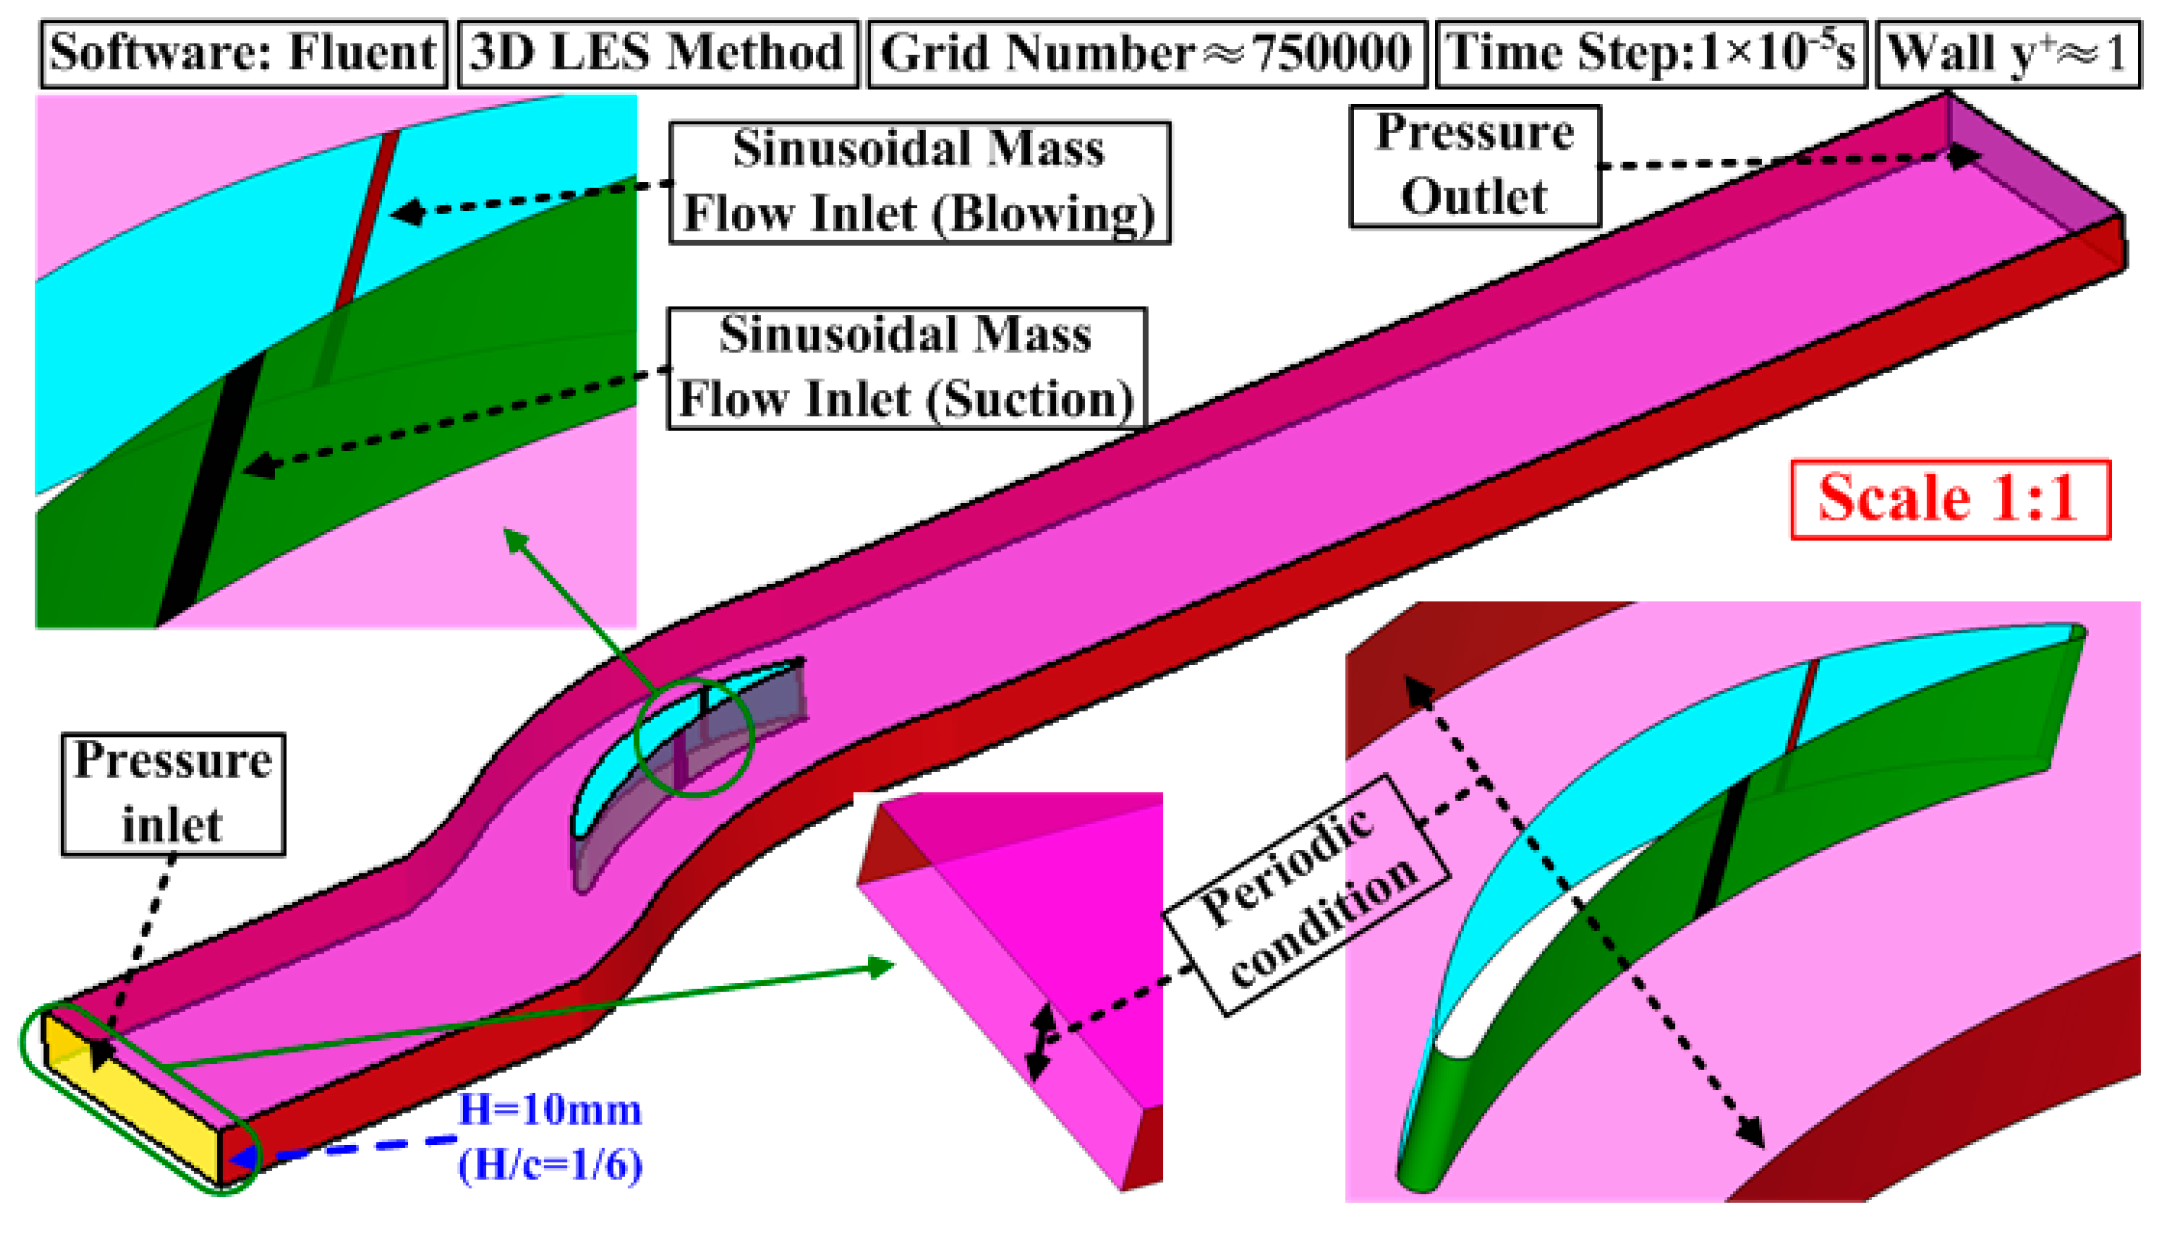
3.1.1. Numerical Method

The main parameters of the adopted cascade are listed in Table 1. The model for numerical simulation is shown in Figure 5, along with some essential details about the simulation. The commercial software Fluent is used for computing the three-dimensional (3D) Large eddy simulation (LES), with the influence of the small vortices added by Smagorinsky-Lilly subgrid model and the initial field comes from the steady results using the turbulence mode of SST. The computational domain streamwise extends from 1.5 chord lengths upstream to four chord lengths downstream, while spanwise extends 1 pitch and periodic boundary condition is then applied. To reduce computer time, only 1/6 blade height is taken into consideration for the simulation. The periodic boundary condition is also applied for the top and bottom boundaries. About 0.75 million grids are used, with refined mesh near walls, leading edges, and trailing edges (satisfying the needs of LES that y + 1 near walls). According our grid resolution study, the total pressure loss of the cascade will be almost constant when the grid points are over 0.75 million. The boundary conditions of inlet and exit are set to keep the inlet Mach number equal to 0.1. The dual-time stepping is used to achieve the time marching computation, and the physical time step is 10−5 s. As discussed, the velocity waveform of the pulsed jet is approximate to the sinusoidal curve, and is identified by the difference of pressure and suction surface near the slot. Based on the experimental results, the periodic pulsed jet is set by a given sinusoidal time-dependent mass flow with the maximum velocity of the jet about 20 m/s, and the corresponding momentum coefficient (see definition in ref [4]) about 0.1%. As the mass flow of pulsed jet comes from the periodic suction of air, the jet slot and the suction slot are both set to the periodic mass flow boundary conditions. However, the mass flow of the jet slot is equal, but in opposite direction, to that of the suction slot.

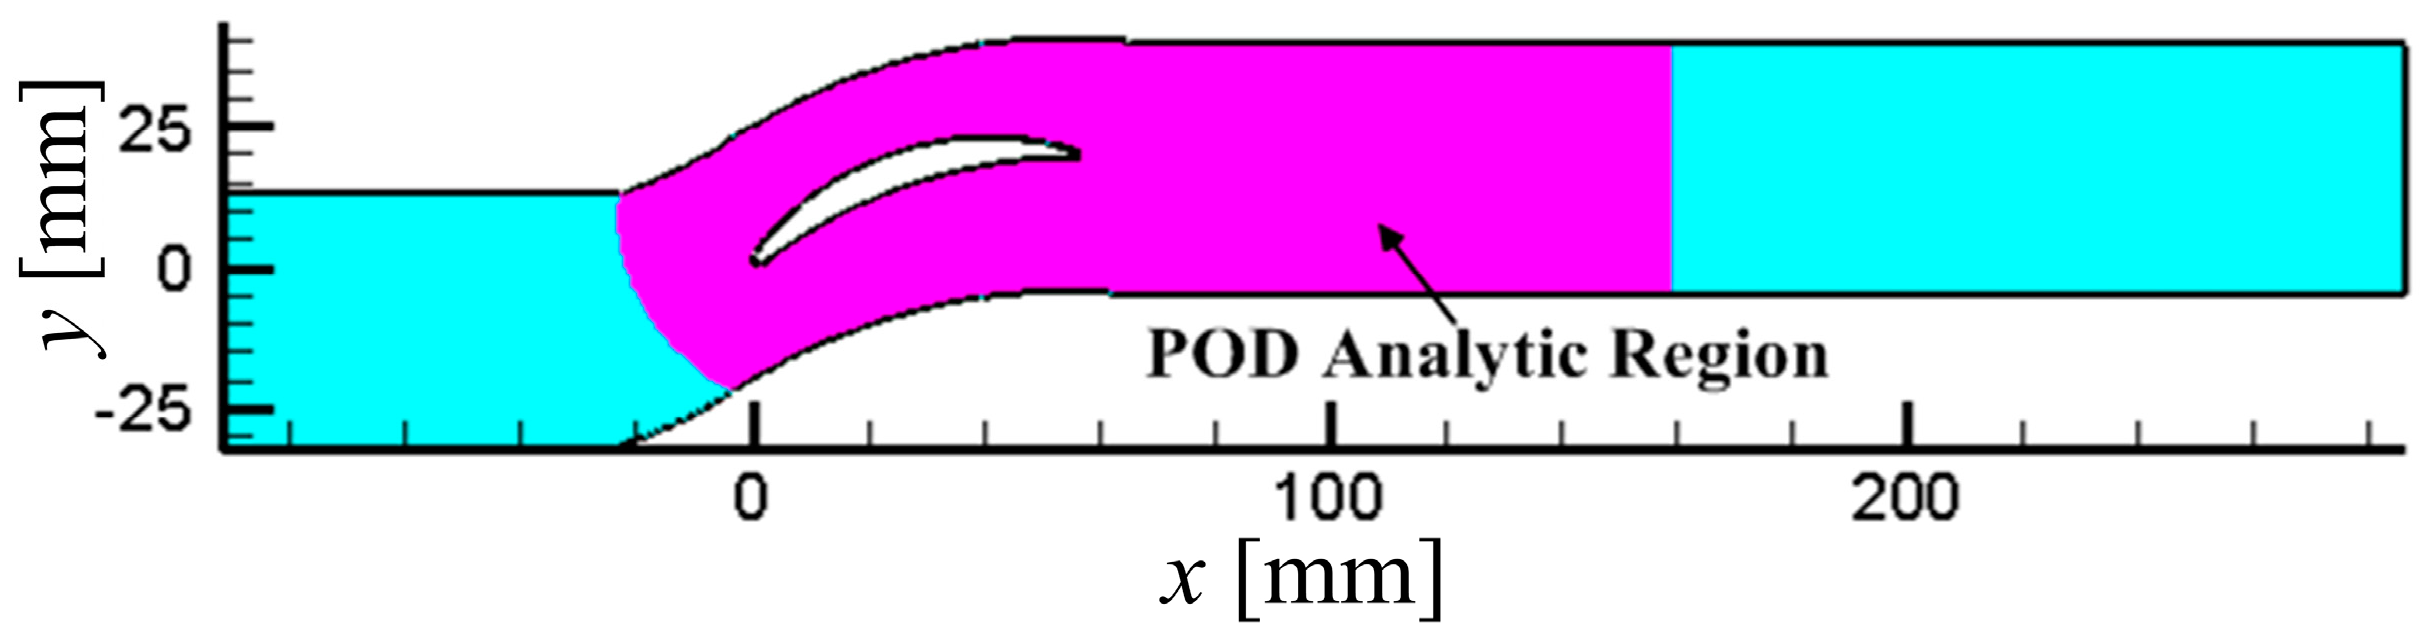
3.1.2. Flow Field Analysis Method (POD)

The unsteady flow simulation generates huge information about the dynamic flow field, which is extremely hard to display the characteristics and laws of the coherent flow. The POD, a flow field analysis method, is a tool that is used to overcome this difficulty. Based on this POD and its analysis of the spatiotemporal characteristics [23,27], it will be more effective to extract the coherent vortical structures and understand the mechanism of the unsteady flow control. The POD method is briefly discussed.
A parameter in the time-dependent flow field z ( x , t ) (x represents the space coordinates and t represents the time coordinate) can be approximately treated as a finite sum in the form of the separable variables.
z ( x , t ) k = 1 M λ i a k ( t ) φ k ( x )
The time basis functions a k ( t ) and space basis functions φ k ( x ) are not unique, while the POD method provides an algorithm employing singular value decomposition (SVD) to determine them and to make them have a certain physical meaning. From the mathematical view, the core of the POD method is calculating the best orthogonal basis functions or modes { φ k ( x ) , k = 1 , 2 , , M } , which ensures that the original function z ( x , t ) can be precisely described with least terms or modes, meaning having the best fitting [28]. Different POD modes represent different flow structures in the flow field, and the magnitude of modes (or modal value, singular values computed by SVD) λ i presents the magnitude of energy. Thus, the dominant modes have higher modal values, representing a large-scale or the main part of the flow structures, while others with smaller modal values are only reflecting small-scale ones or trifle parts. To summarize, the POD method can be used to decouple the spatial and temporal structure of the unsteady flow field, treat the actual unsteady flow field as the composition of the various modes with different amplitudes, for processing convenience.

3.2. Numerical Simulation and POD Analysis of Unsteady Flow in the Cascade without Flow Control

In Figure 6, the flow separation occurs in the flow field of the cascade by numerical simulation, and its origin is at about 70% chord length (x/c = 70%), in agreement with the subsequent experimental results (x/c = 69%). The unsteady flow field, characterized by transient vorticity, is complex and chaotic. However, the obvious discrete separation vortices exist, composed of the large-scale coherent structures in the flow field. With the frequency spectrum of the static pressure by Fast Fourier Transform (FFT) analysis, the dominant frequency of separation vortices is about 439 Hz (Figure 7), which is also consistent with the experimental results (478 Hz). Briefly, the numerical method used shows good credibility, both in time-averaged and unsteady characteristics, attaining the need for numerical analysis.
In analyzing the influence of the pulsed jet to vortical structures in the cascade, the unsteady flow field in the cascade without flow control is evaluated by the POD method initially. About 250 snapshots of the transient flow fields during 0.015 s, which are about 6.6 period of separation vortex are analyzed during POD procedure. The POD analytic region is selected as parts of the surface in the middle height, as shown in Figure 8, to greatly reduce the amount of computation.
In Figure 9, the first mode of the flow field by the POD method is shown. By comparing with Figure 6, it can be seen that the first mode represents the structure of the time-averaged flow. Also, in Figure 9 and Figure 10, when compared with the transient flow structures shown in Figure 6, both the second and third modes are thought to reflect the structure of separation vortices, while the other high-order modes represent the complex and small-scale vortices structures. Overall, as the order of mode increases, the scale of coherent structures it represents becomes smaller and more chaotic (See Figure 10 and Figure 11).
The modal value is an important index computed by the POD method, representing the magnitude of the kinetic energy that one mode captures. In POD, a lower order mode has a higher energy. The energy ratio is defined as c k = λ k / i λ i , where λ k is the kth modal value, reflecting the weight of one mode. As illustrated in Figure 12, the energy ratio of the first mode is 42.23%, mostly dominating, while the energy ratio of the other modes is at least one order of the magnitude less, for example, the energy ratio of the 11th mode is less than 1%. Based on the energy ratio, the corresponding accumulative energy ratio is defined as a k = i = 1 k c i shown in Figure 13. In this figure, the first 25 modes occupy 69.6% of the total energy, while the first 100 modes actually occupy 91.3% of the total energy. This means that the main characteristic of the unsteady flow field is embedded in several specific leading low-order modes, and the analysis can be greatly simplified when only these dominated modes or vortical structures are focused.
Figure 14 shows the time-evolution of the typical modal coefficients, which reflect the instantaneous proportion of the current mode to the original undecomposed flow field. It is defined as λ i a k ( t ) from Equation (1). It can be seen from Figure 14, and the second and third modes are more periodic, regular, and low-frequency (the frequency equals that of separation vortices), as explained previously, mainly reflecting the characteristics of the separation vortices. However, high-order modal coefficients are more complex, small-amplitude, and high-frequency, because they are related to the small-scale vortices to a certain extent.

3.3. Numerical Simulation and POD Analysis of Unsteady Flow in the Cascade with Steady and Pulsed Jet Flow Control

Based on the numerical results and POD analysis of the unsteady flow in the cascade without flow control, the numerical simulation and POD analysis with pulsed jet control is analyzed in this section. Most of the details on the numerical simulation method of the pulsed jet have already been discussed in Section 3.1.
Figure 15 shows the relative loss coefficient of the cascade ω ˜ c ( ω ˜ c = ( ω ˜ ω ˜ 0 ) / ω ˜ 0 × 100 % , where ω ˜ 0 is the total pressure loss coefficient of the cascade without flow control and ω ˜ is the total pressure loss coefficient of the cascade with pulsed jet flow control), as reduced jet frequency F + ( F + = f / f s h e d , where f is the jet frequency and fshed is the dominant frequency of the separation vortices in the cascade without flow control) changes from 0.25 to 2. Shown in Figure 15, as the jet frequency increases, the total pressure loss of the cascade first reduces gradually to a minimum, and then increases. When the jet frequency equals to the dominant frequency of the separation vortices, the control effect is the most significant, serving as a typical unsteady characteristic.
Based on the unsteady flow field from the numerical simulation, the POD method is used to analyze the flow field in the cascade with steady and pulsed jet flow control, and learn the changes of the vortical structures because of the different flow controls. The energy ratio spectra without the flow control, with steady and different frequency pulsed jet controls are shown in Figure 16. Generally, the distribution of the energy ratio with the different control parameters is similar to that without control. It is viewed that the energy of high-order modes with steady and F + = 1 pulsed jet control declines, indicating that small-scale vortices are suppressed. Also, the energy of the first order (rank 1) is the highest for the best-pulsed jet control ( F + = 1 ), so the energy of the small-scale vortices is thought to be transferred to the time-averaged flow. But, the energy of second and third for the best pulsed jet control ( F + = 1 ) are nearly the lowest, basically equivalent to that without control, while for invalid control of ( F + = 0.25 and F + = 2 ), these two modes are significantly increased. Because both the second and third modes reflect the separation vortices, the POD analysis indicates that effective unsteady control of F + = 1 using the dominated separation vortex to transfer the energy of the small-scale vortices to the time-averaged flow, while the invalid unsteady control simply has little effect or even enhance the separation vortex. Thus, unlike the steady flow control, the main function of pulsed jet reallocates the kinetic energy of each mode, and enhancing or weakening some particular modes, using the existing unsteady vortices in the flow field.
Reflecting the transient characteristics, the evolution of modal coefficients of the second mode without control and with different pulse frequencies is shown in Figure 17. The visible periodicity can be seen in this figure. However, the modal coefficient without control seems a certain chaotic, especially in the time domain of 3tshed to 6tshed , indicating that the vortex shedding frequency is not strictly constant. When the reduced frequency F + = 1 , the time-evolution pattern looks like that without control, but with the effect of the pulsed jet, the curve is smoother, indicating that the flow structures tend to be more simple and orderly. However, when F + = 0.25 and F + = 2 , the evolution characteristics differ from that without control, suggesting that the periodicity of the second mode is weakened by the pulsed jet, and that the flow fields are more complex with the interaction of pulsed jet. In combination with Figure 15, it is reasonably deduced that the complexity of the flow field caused by the invalid pulsed frequency may bring additional losses when compared with more orderly flow field that is caused by effective pulsed frequency, so the pulsed frequency is a fatal parameter to efficient unsteady flow control.

4. Experimental Verification of Pulsed Jet Flow Control in Cascades

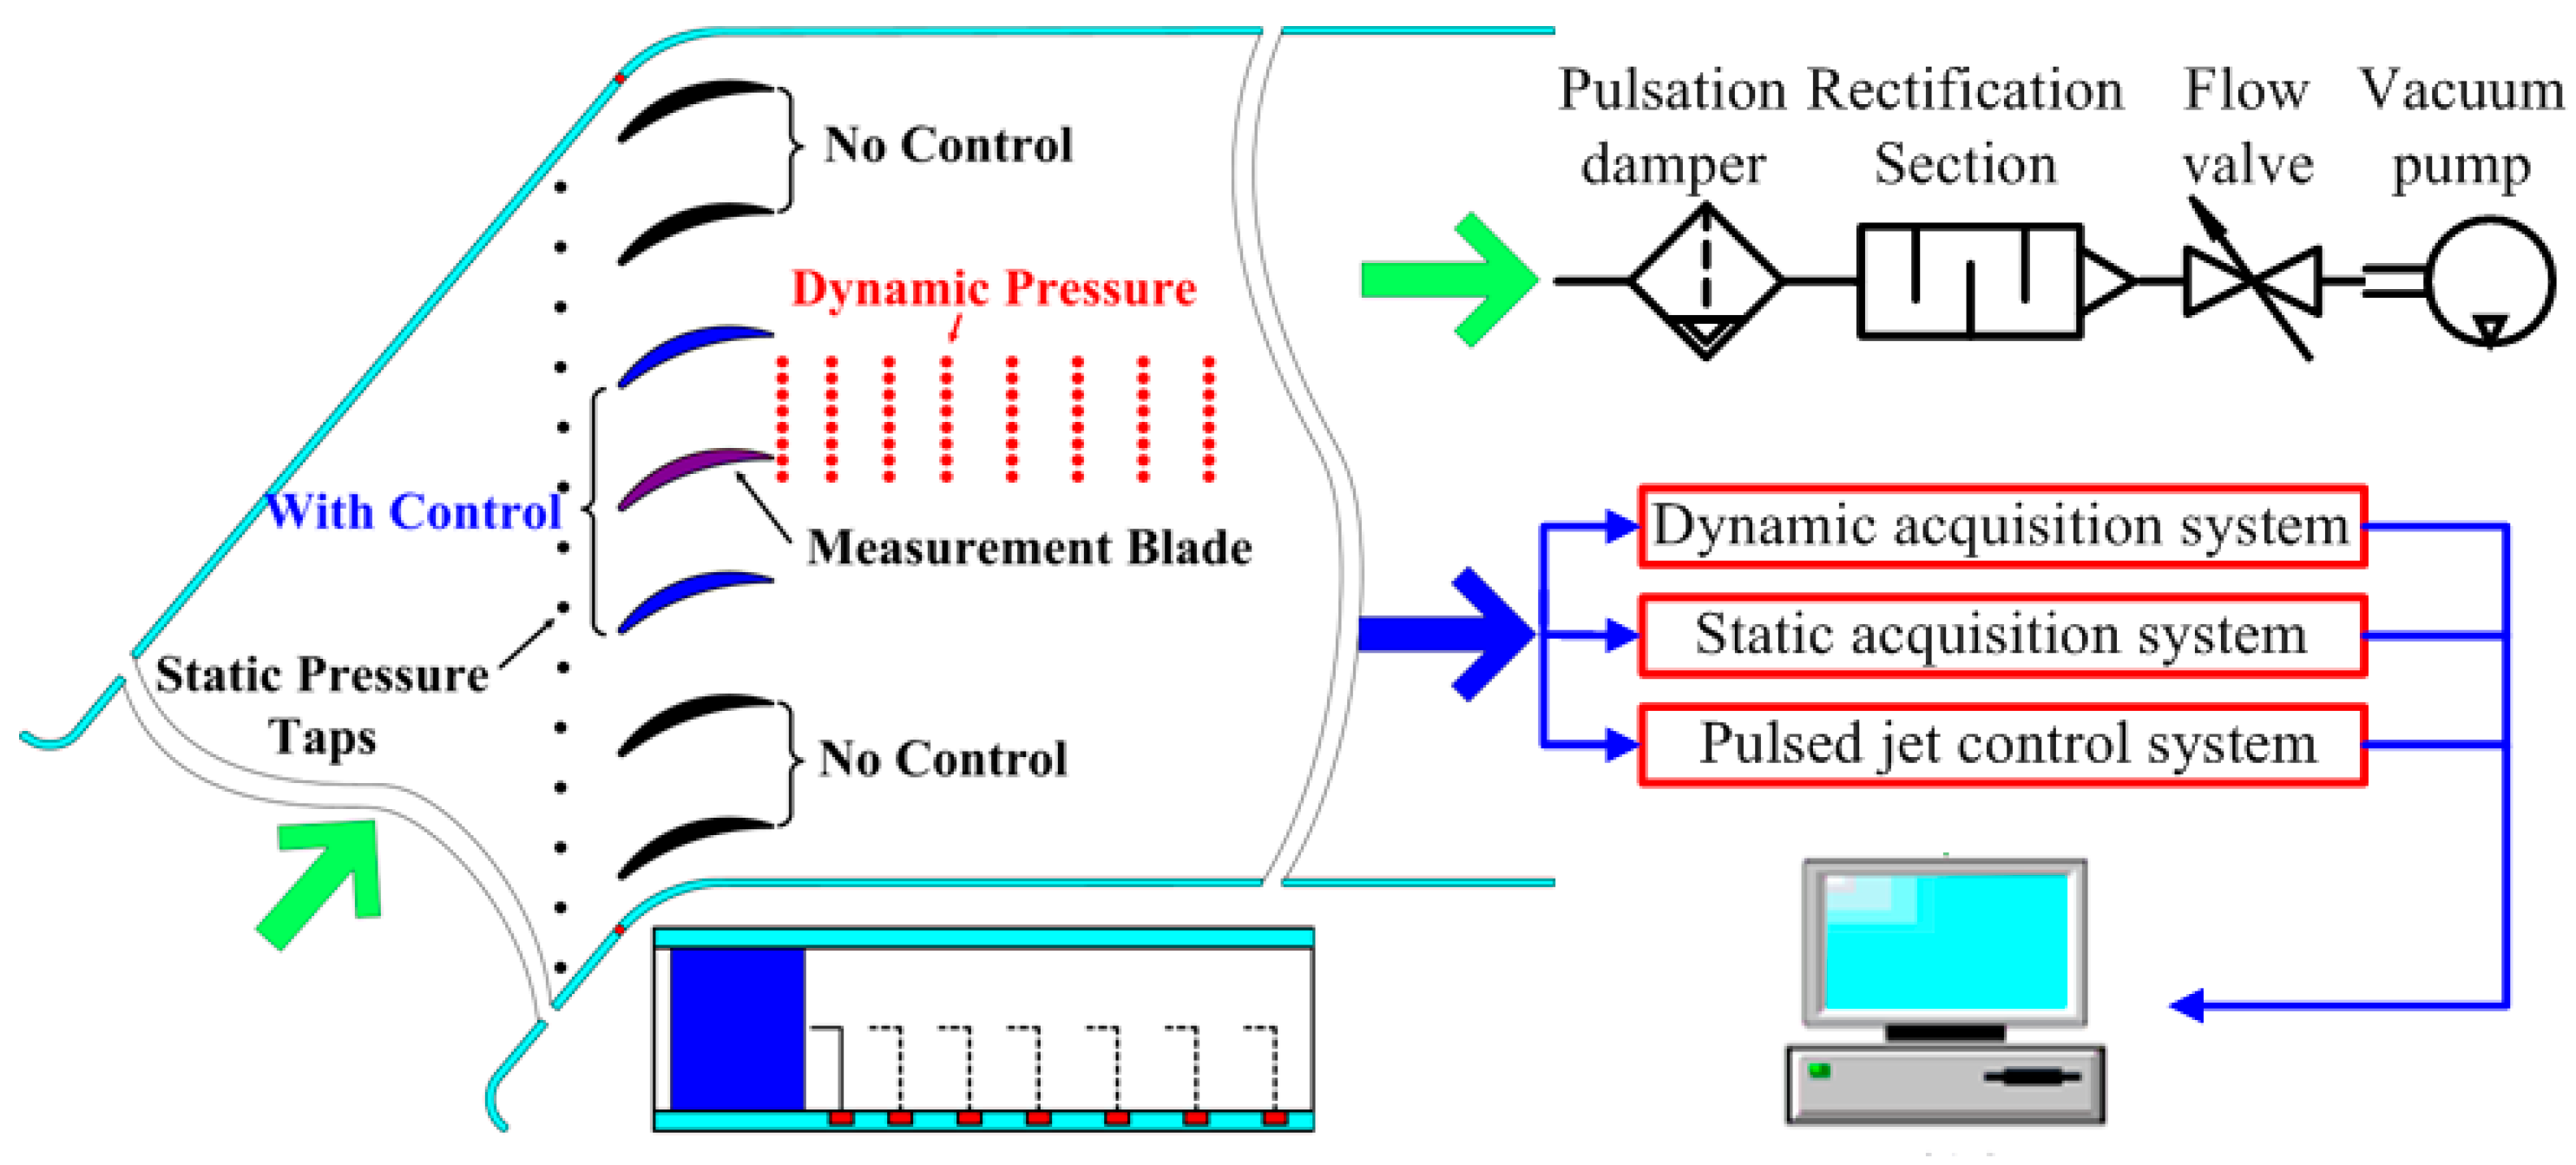
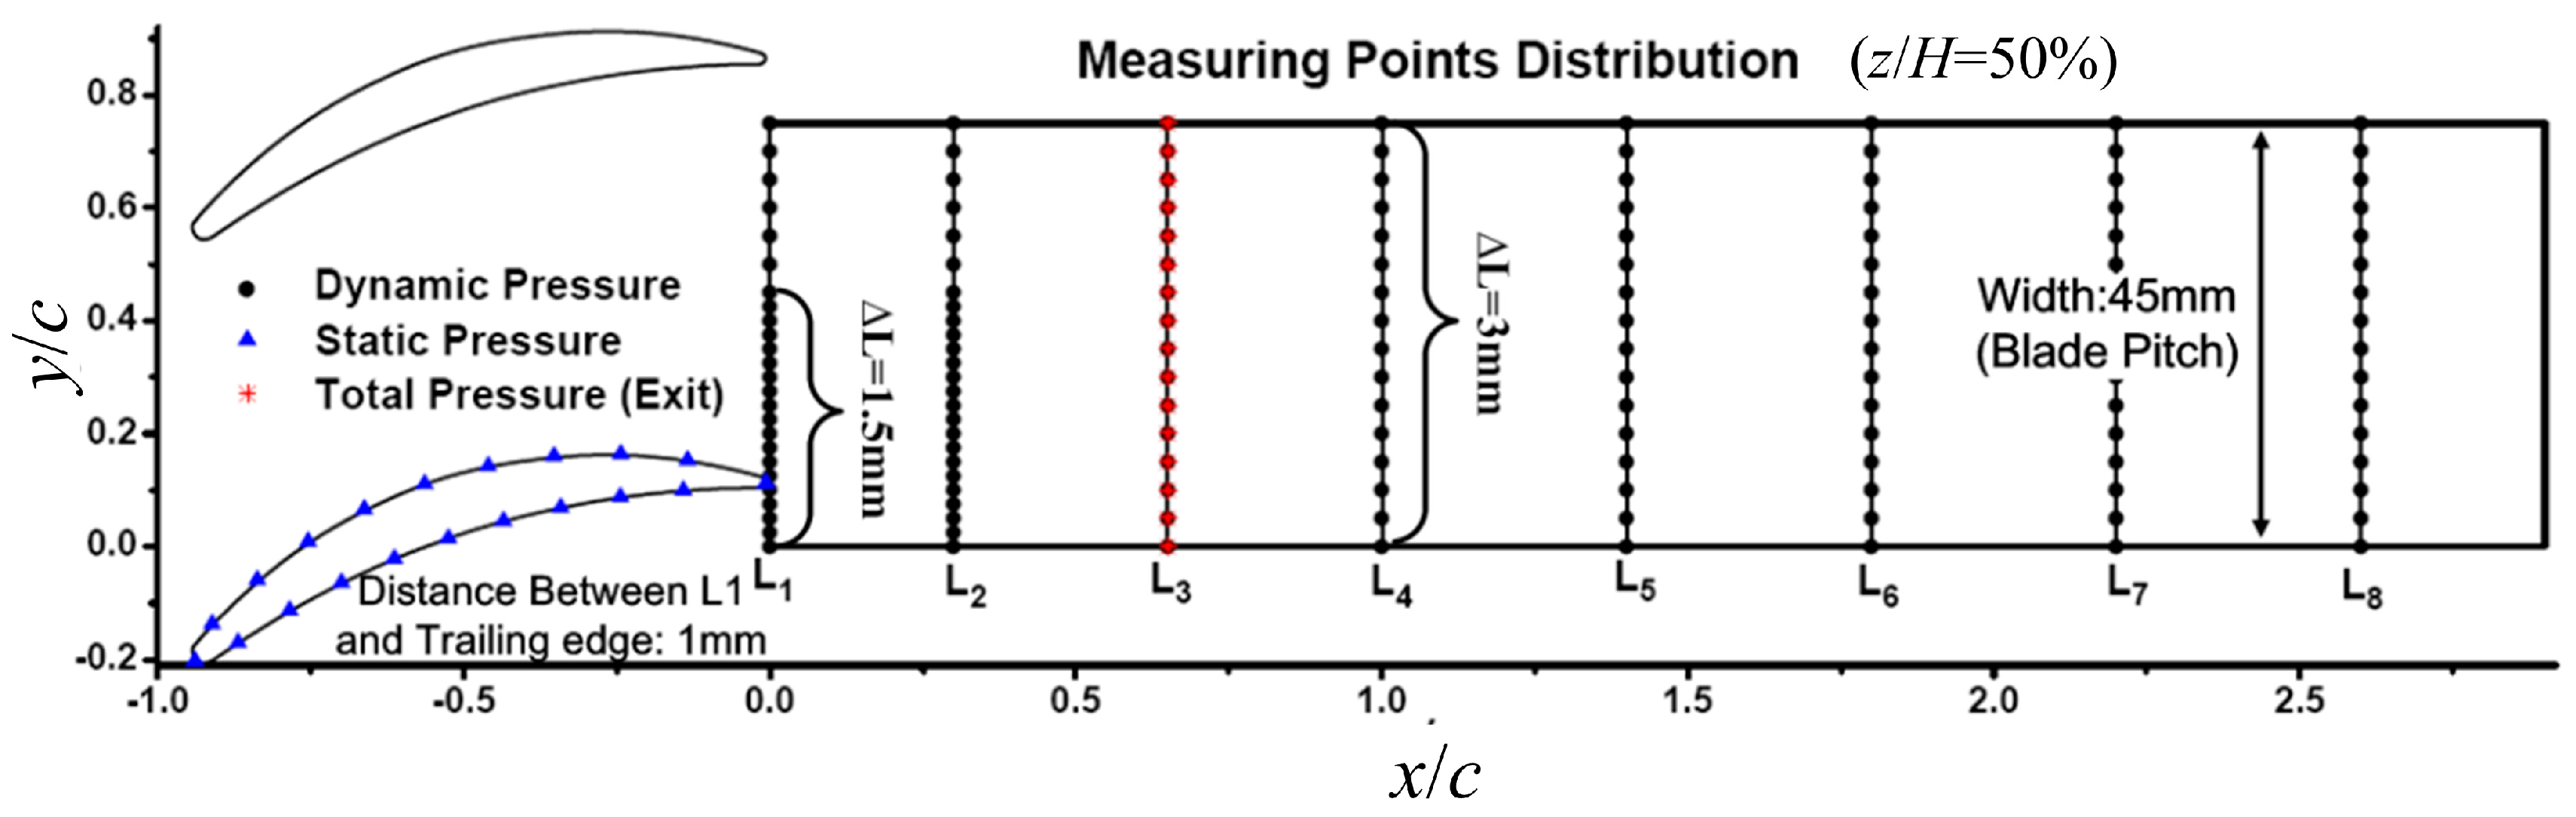
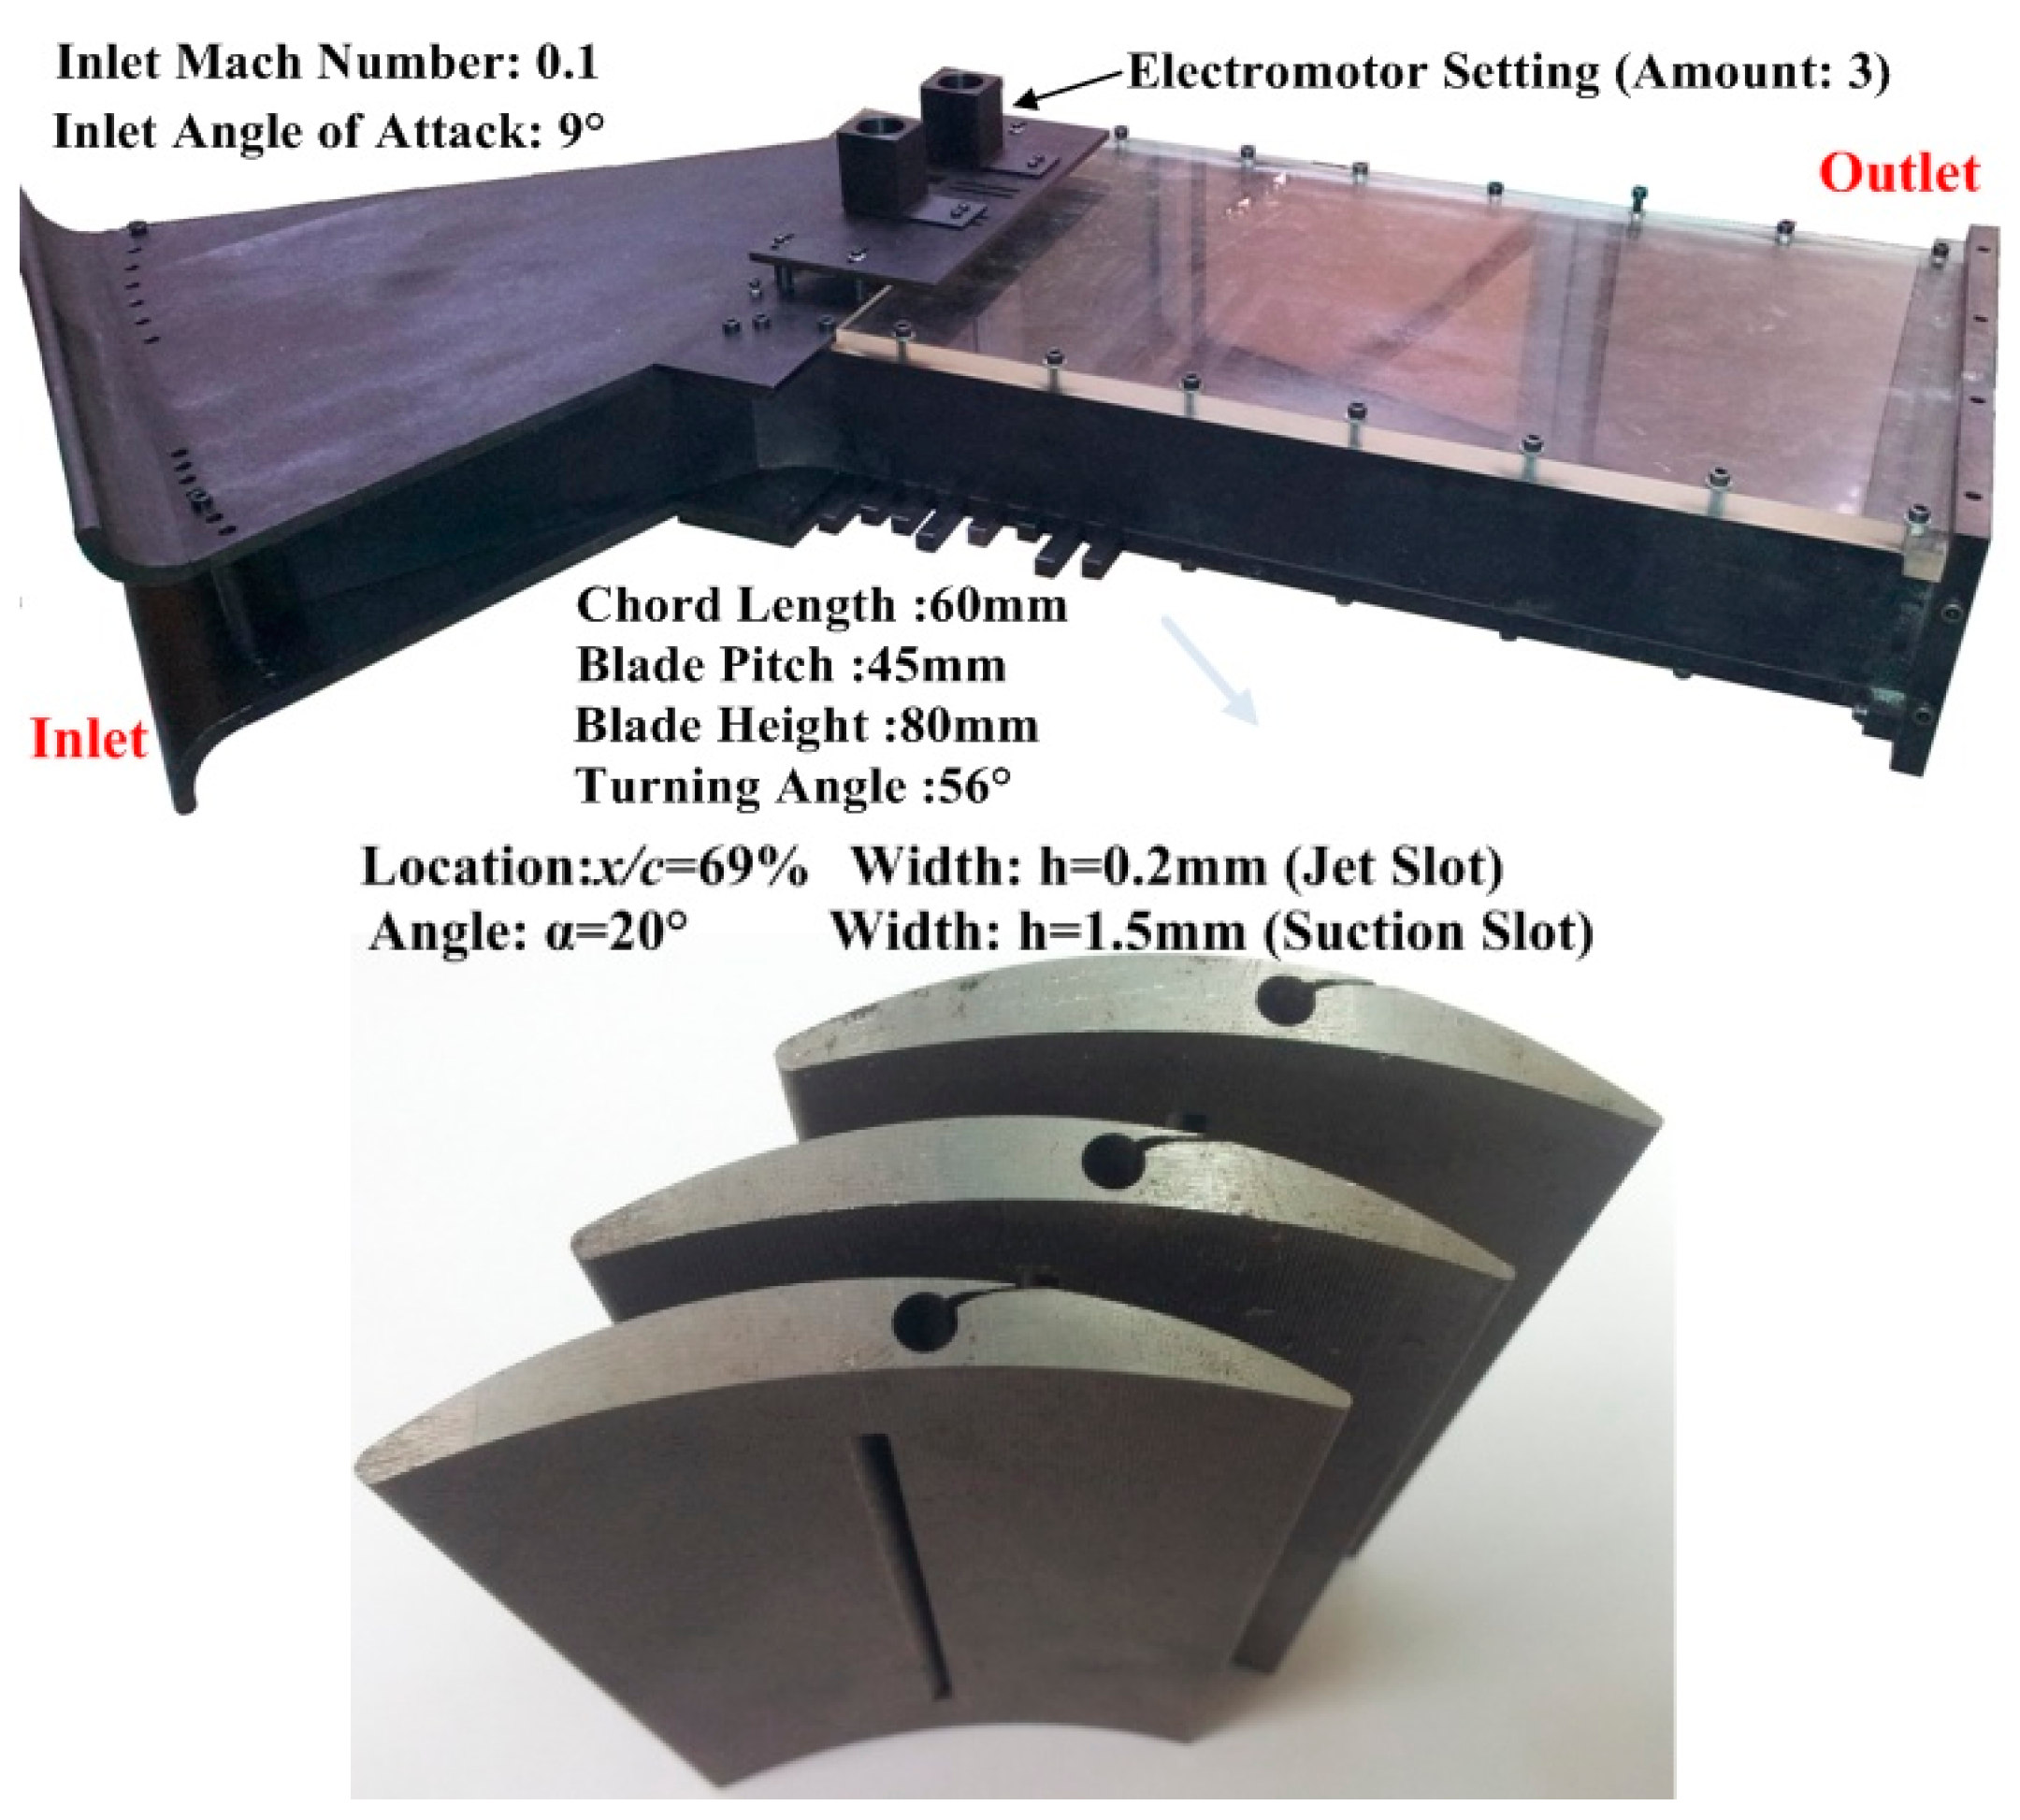
4.1. Test and Measurement System

In verifying the effectiveness of this novel pulsed jet flow control without external energy injection, a test model of the cascade is established. This corresponds to the model that is used for the numerical simulation. The test system mainly consists of inlet section, movable side plate, cascades, displacement mechanism, pulsation damper, rectification section, flow valve, vacuum pump, and pulsed jet control system, as shown in Figure 18.
The measurement system involves the steady and dynamic pressure measurement system. With these, the steady measurement parameters include the static pressure of the inlet and that distributed along the blade surface, and the total pressure distributed spanwise of the outlet. The parameters include the dynamic total pressure that is distributed streamwise and spanwise in the cascade and measured by moving the position of the sensor. The sensors are installed on the displacement mechanism, driven by a stepper motor and controlled by the computer. The locations of the measuring points in the cascade are shown in Figure 19. The steady parameters are collected by intelligent pressure scanners that are manufactured by Pressure System Inc, and dynamic pressure sensor coded CYG504GL, of which, the sampling frequency is 63,356 Hz, is qualified and selected to measure the dynamic pressure.
The geometry and aerodynamic parameters of the cascade are provided in Table 1, while the experimental system and blades of the cascade with slots are shown in Figure 20. The pulsed jet device adopted is already discussed in Section 2, as shown in Figure 4.

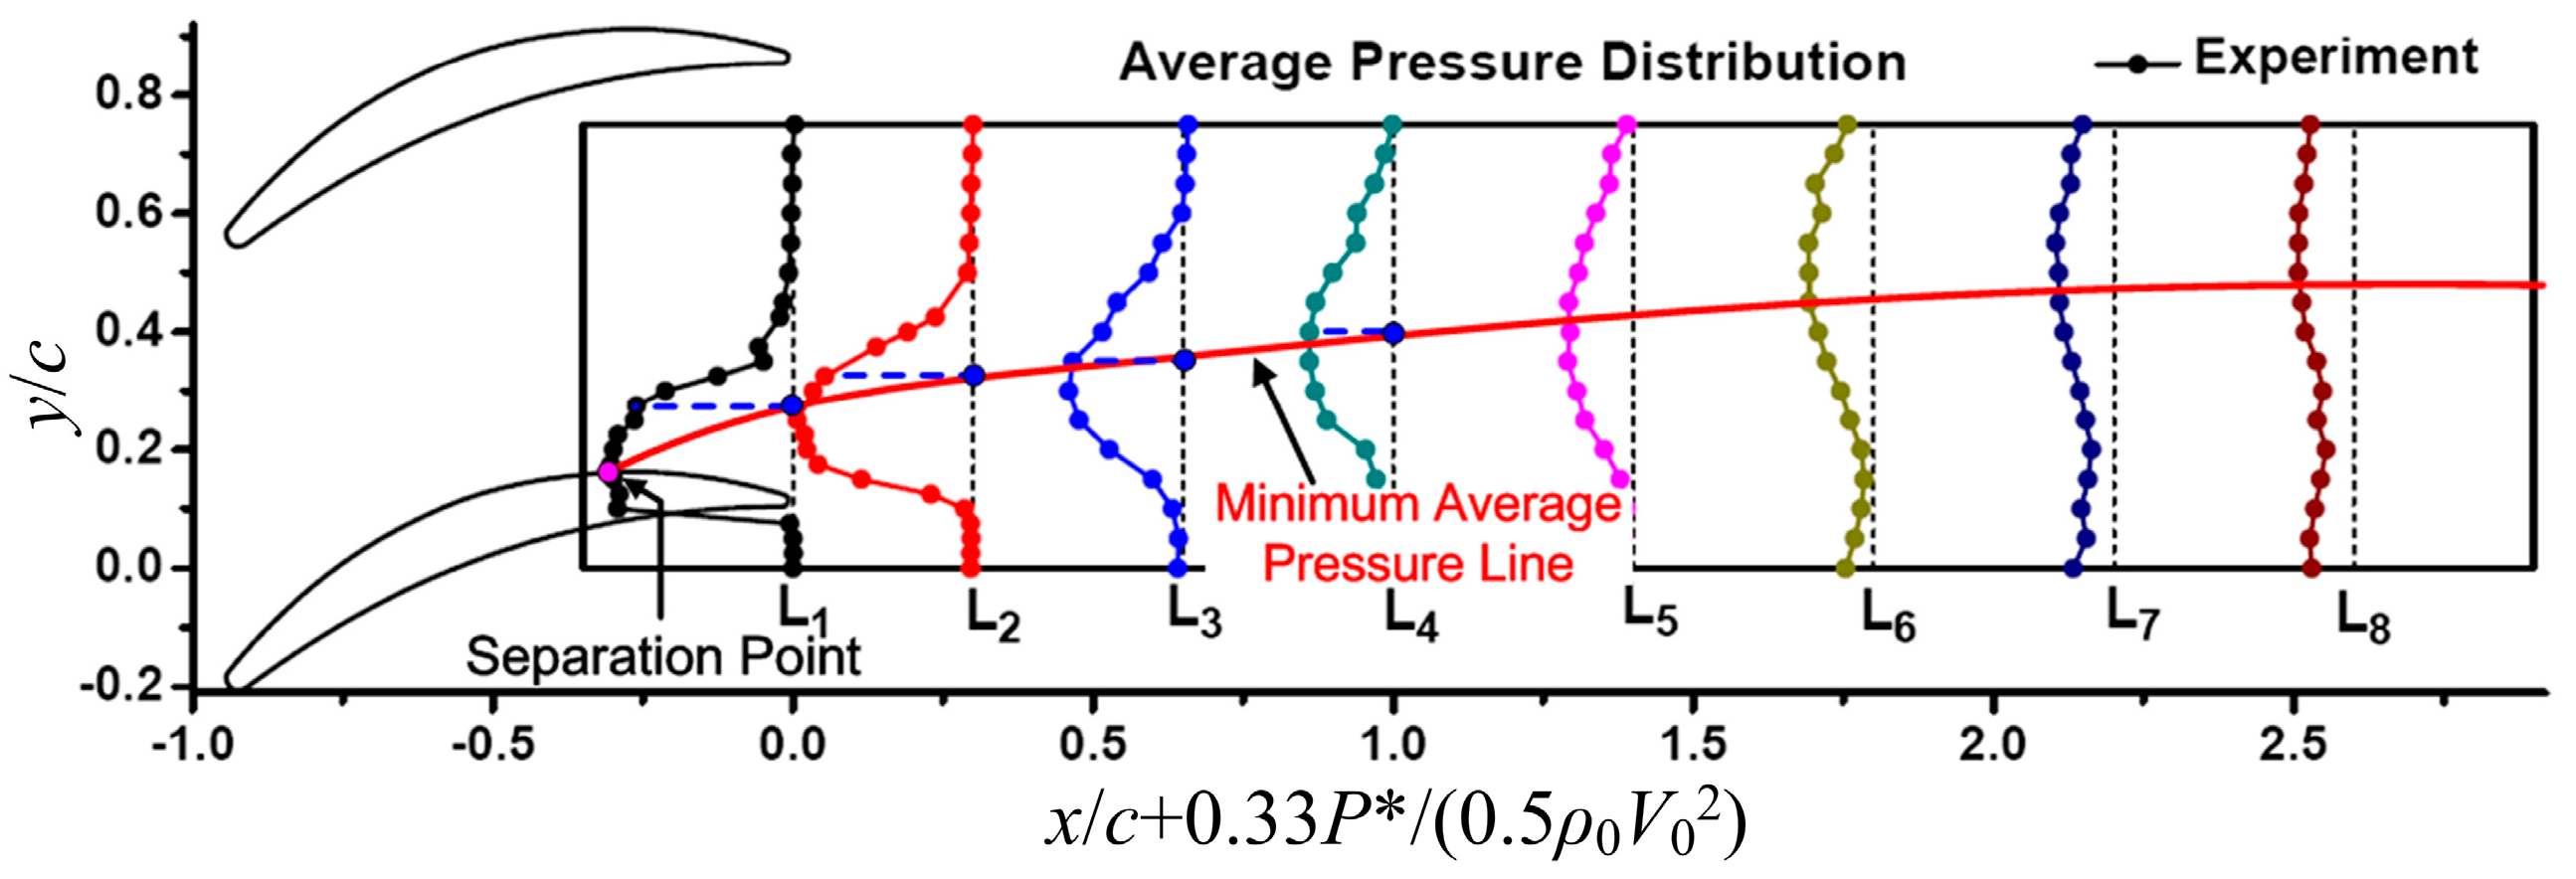
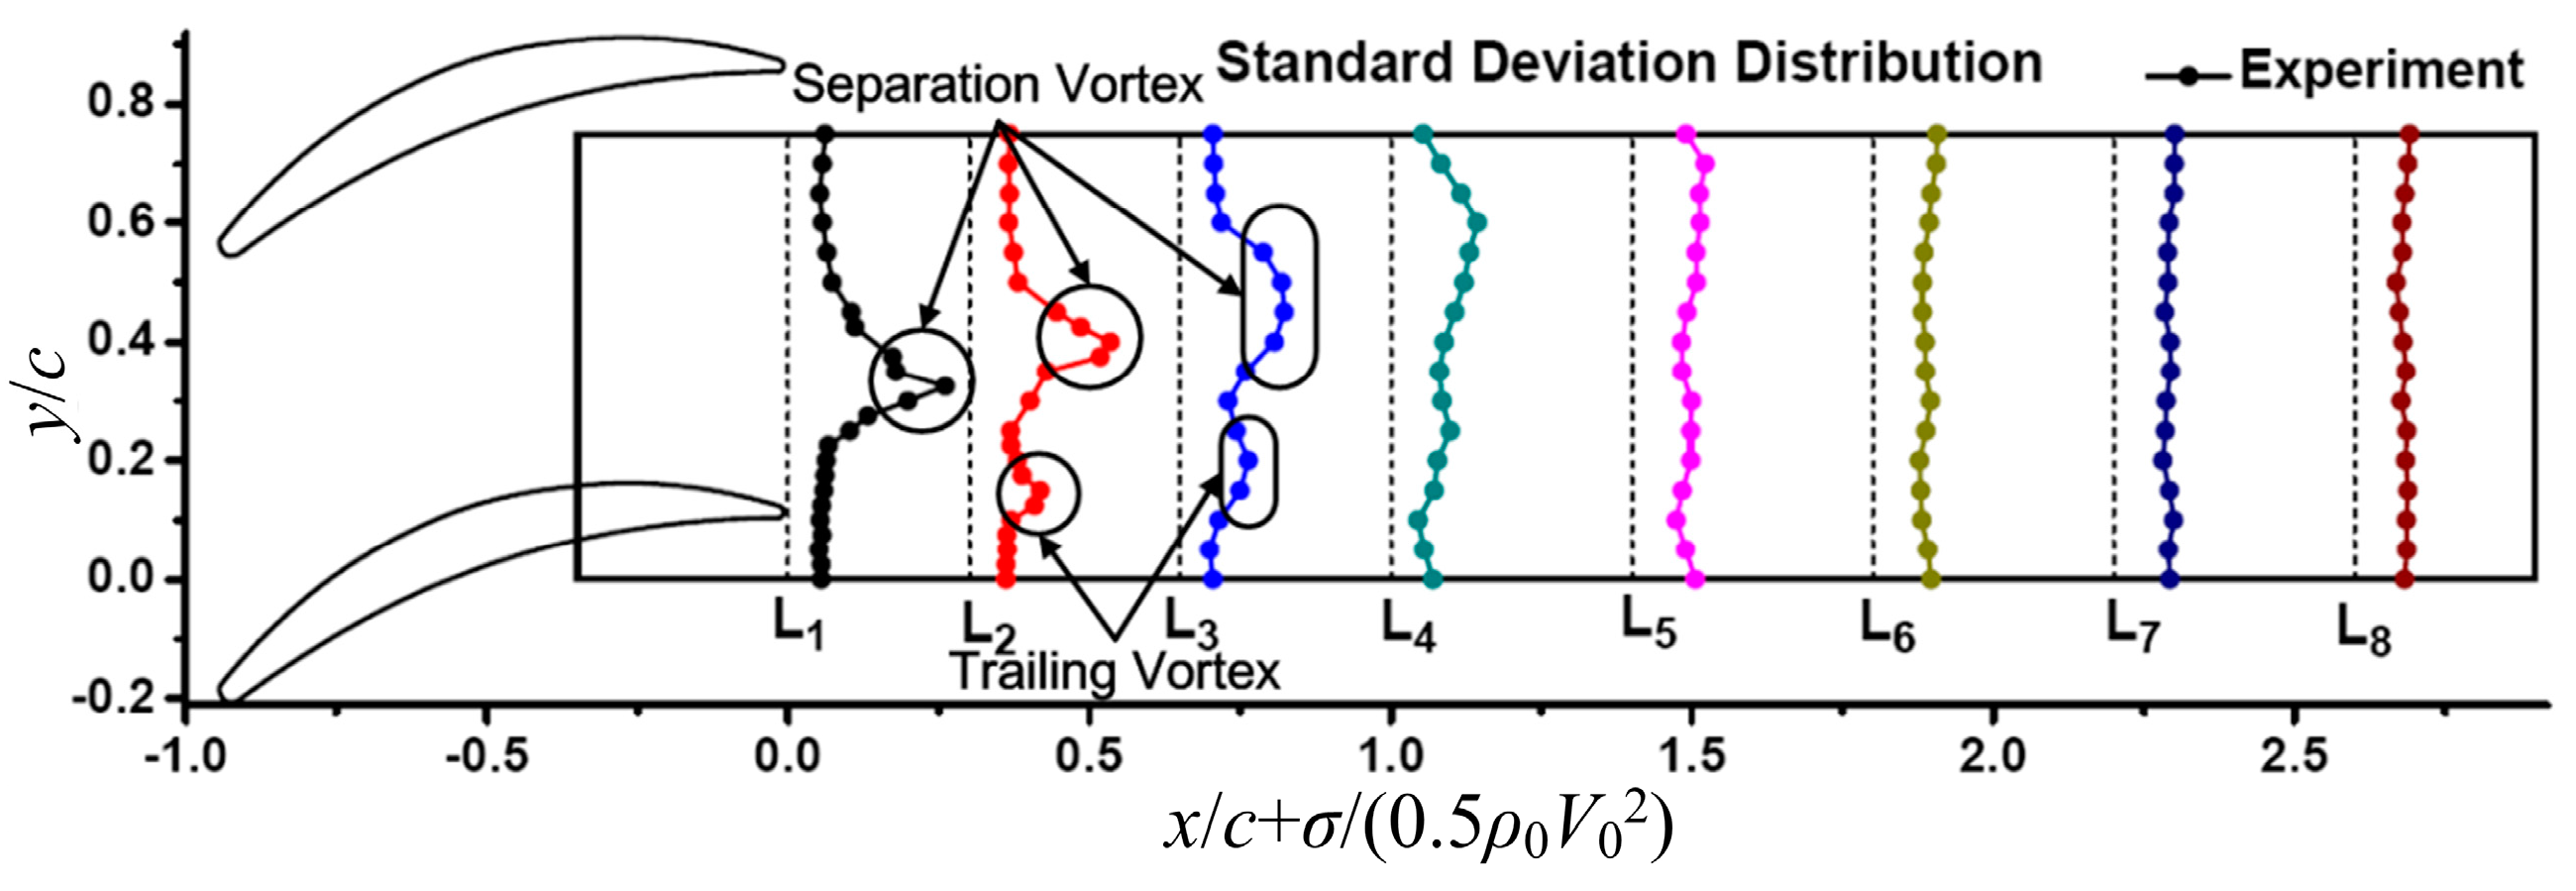
4.2. Experimental Analysis of Flow Characteristics in the Cascade without and with Flow Control

The driving force of the pulsed jet comes from the pressure difference between the pressure and the suction surface of the blade, so there is no external energy injection. In the experiment, the static pressure distribution is initially measured, as shown in Figure 21 (the numerical results are also illustrated in this figure). In this figure, it is apparent that the static pressure keeps increasing downstream, and remains unchanged from about x/c = 69% to the trailing edge of the blade. It indicates a separation zone starting at x/c = 69%. When compared to static pressure distribution of the suction surface, the static pressure distribution of the pressure surface remains unchanged, thus the bleed location has a little effect on the bleed pressure, making it convenient to design the pulsed jet device.
To analyze the characteristic of the separation vortices, the average total pressure distribution is measured, as shown in Figure 22, where P * represents the average pressure, 1 / 2 ρ 0 V 0 2 shows the dynamic pressure at the inlet. The pressure invariant zone at section L1 reflects the scale of the separation zone. However, as the mixing occurs streamwise, the separation tends to decline, as shown in sections L1 to L8. The standard deviation distribution of pressure ( σ ) in the cascade is illustrated in Figure 23. From Figure 22 and Figure 23, the average pressure loss in Figure 22 generally corresponds to the high standard deviation of pressure in Figure 22. The places, where the vortices pass by, are where the total pressure loss and turbulent fluctuation occur. However, the two climaxes of pressure distribution occur in Sections L2 and L3 in Figure 23 due to the effect of separation vortices and trailing edge vortices, merge together and cannot be distinguished in the average pressure distribution (Figure 22).
To analyze the impact of the frequency on the control performance, it is essential to initially get the characteristic frequency of the separation vortex in precision. Figure 24 shows the frequency spectra in the width direction of section L2 (the section marked in Figure 19, Figure 22 and Figure 23), where Y represents the length between the sensor position to the lowest point, and L represents the probe movement range, which is equal to a pitch. A represents the amplitude of the frequency, which is normalized by Amax, the maximum amplitude of frequency in all of the sensor positions in the figure. There are peaks of the amplitude of the frequency spectra. It is recognized that the dominant frequency of the separation vertex is 478 Hz in the experiment, which is consistent with that obtained by numerical simulation (439 Hz), verifying the reliability of the numerical method.
Based on the unsteady cascade characteristics, the experiments with the pulsed jet control are carried out. For the convenience of the research, while highlighting the main unsteady factor, location, angle, and width of the pulsed jet are fixed. In this case, because of the ability of the pulsed jet device, jet frequency is adjustable from 148 Hz to 840 Hz. In Figure 15, it is also shown the influence of the reduced jet frequency on the relative loss coefficient in the experiment. The experiment stress that when the frequency of pulsed jet is approximate to that of the separation vortex, the loss coefficient of average total pressure decreases about 5.5% to its minimum. Otherwise, when the frequency of the pulsed jet is far from the separation vortex frequency, the control effect becomes weaker gradually, indicating that the optimum frequency of pulsed jet equals that of the separation vortex. The results both with pulsed jet and the steady jet control correspond with that by numerical simulation, verifying the validity of this novel pulsed jet flow control without the external energy injection.
Figure 25 shows the total pressure loss coefficient distribution at the outlet of the cascade without, with steady and with F + = 1 control. With the jet injected from the suction side, both steady and F + = 1 control remarkably reduce the total pressure loss at the outlet near the suction side. It is worth emphasizing that the pulsed jet control of F + = 1 reduces the loss the most. Due to the small quantity of mass flow required and a great reduction of the flow loss, the pulsed jet without external energy injection is a promising flow control method for cascades.

5. Conclusions

(1)
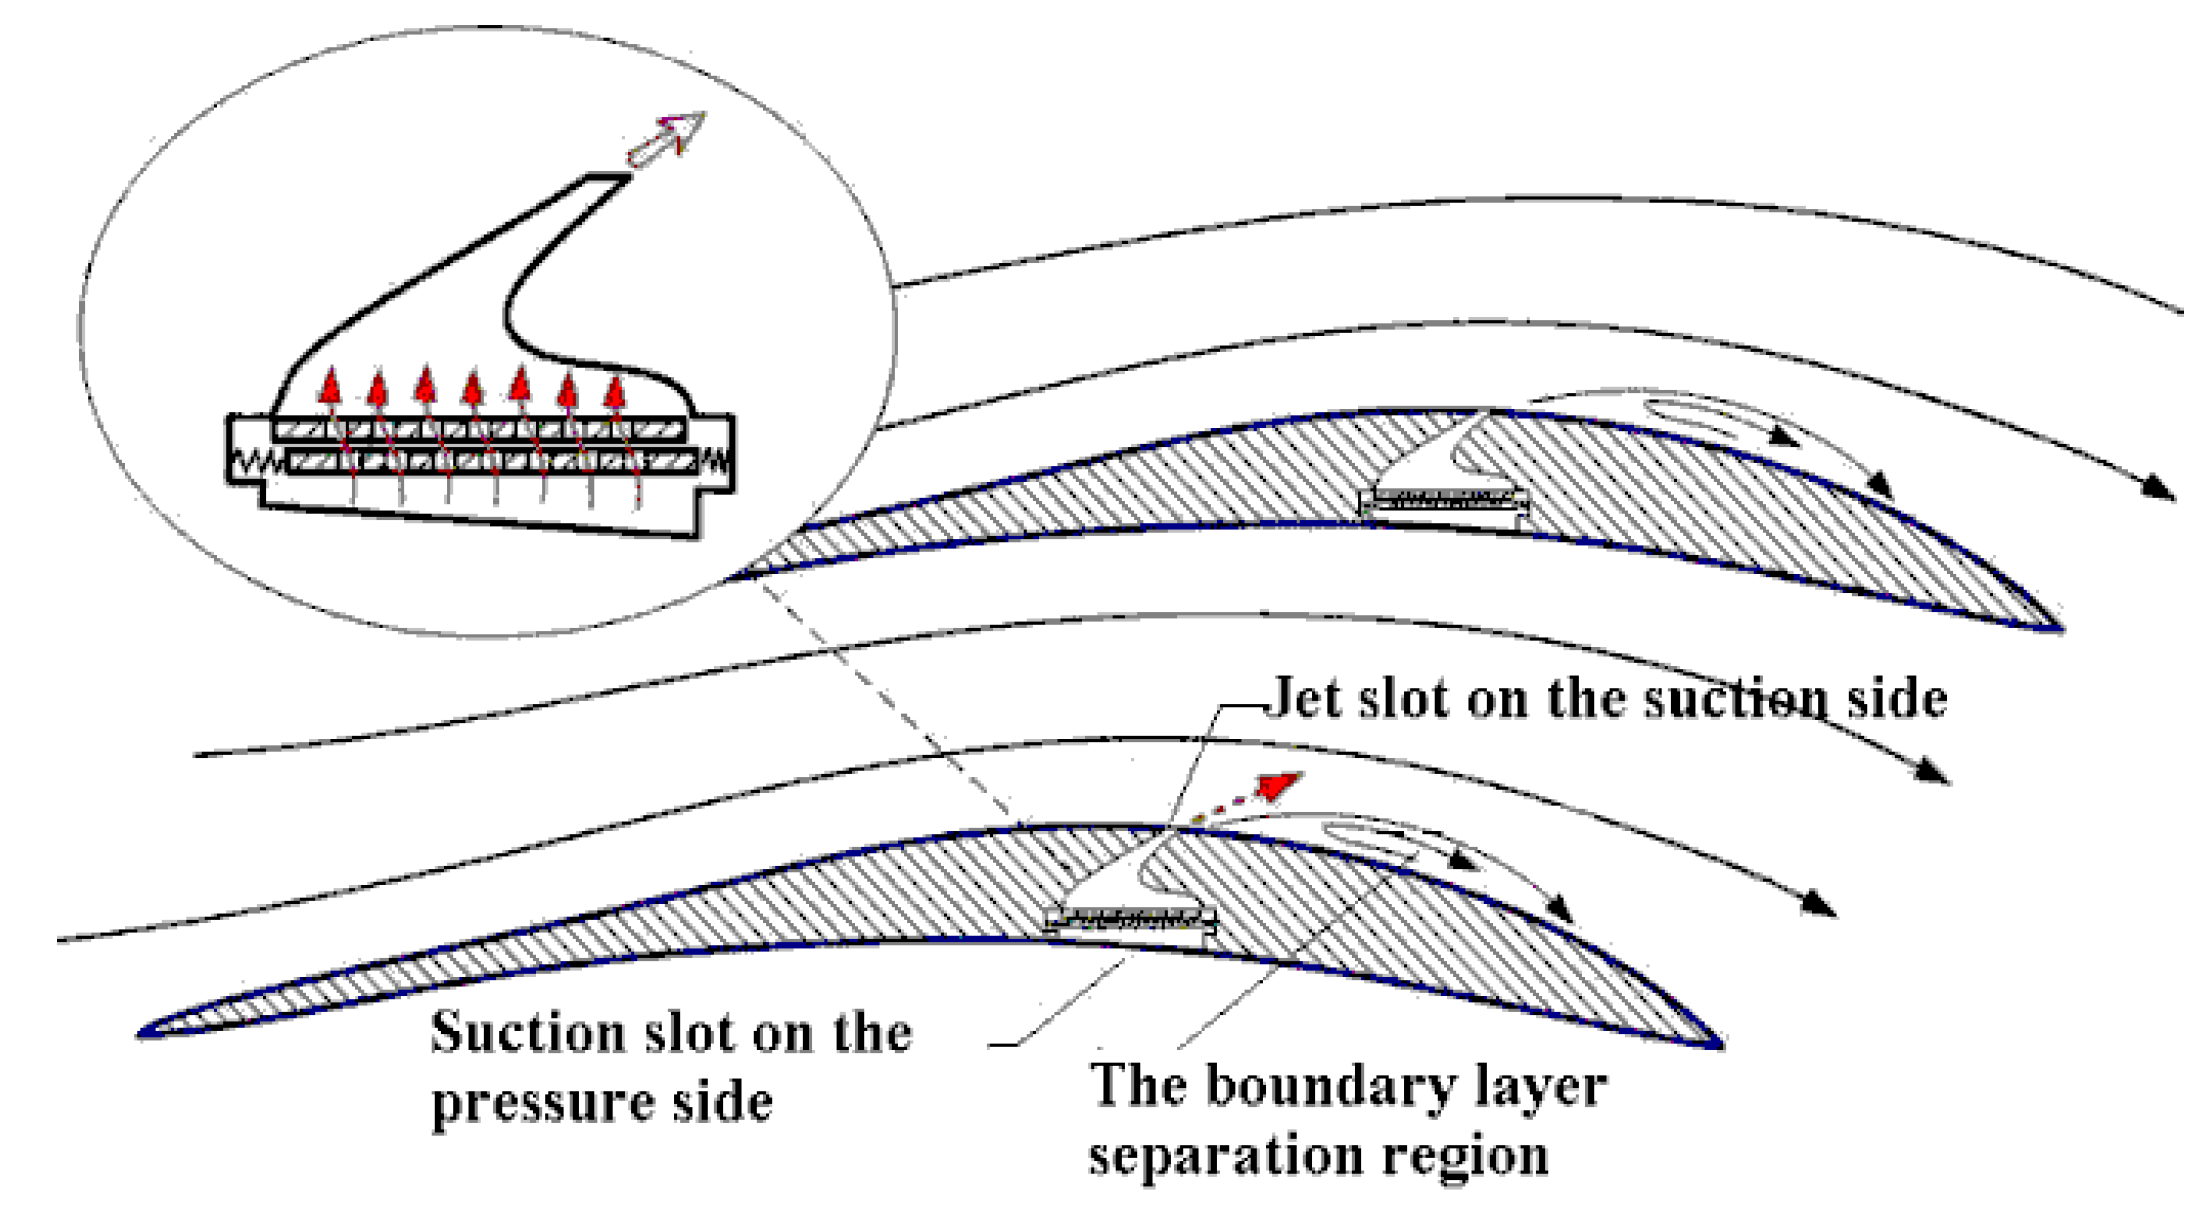
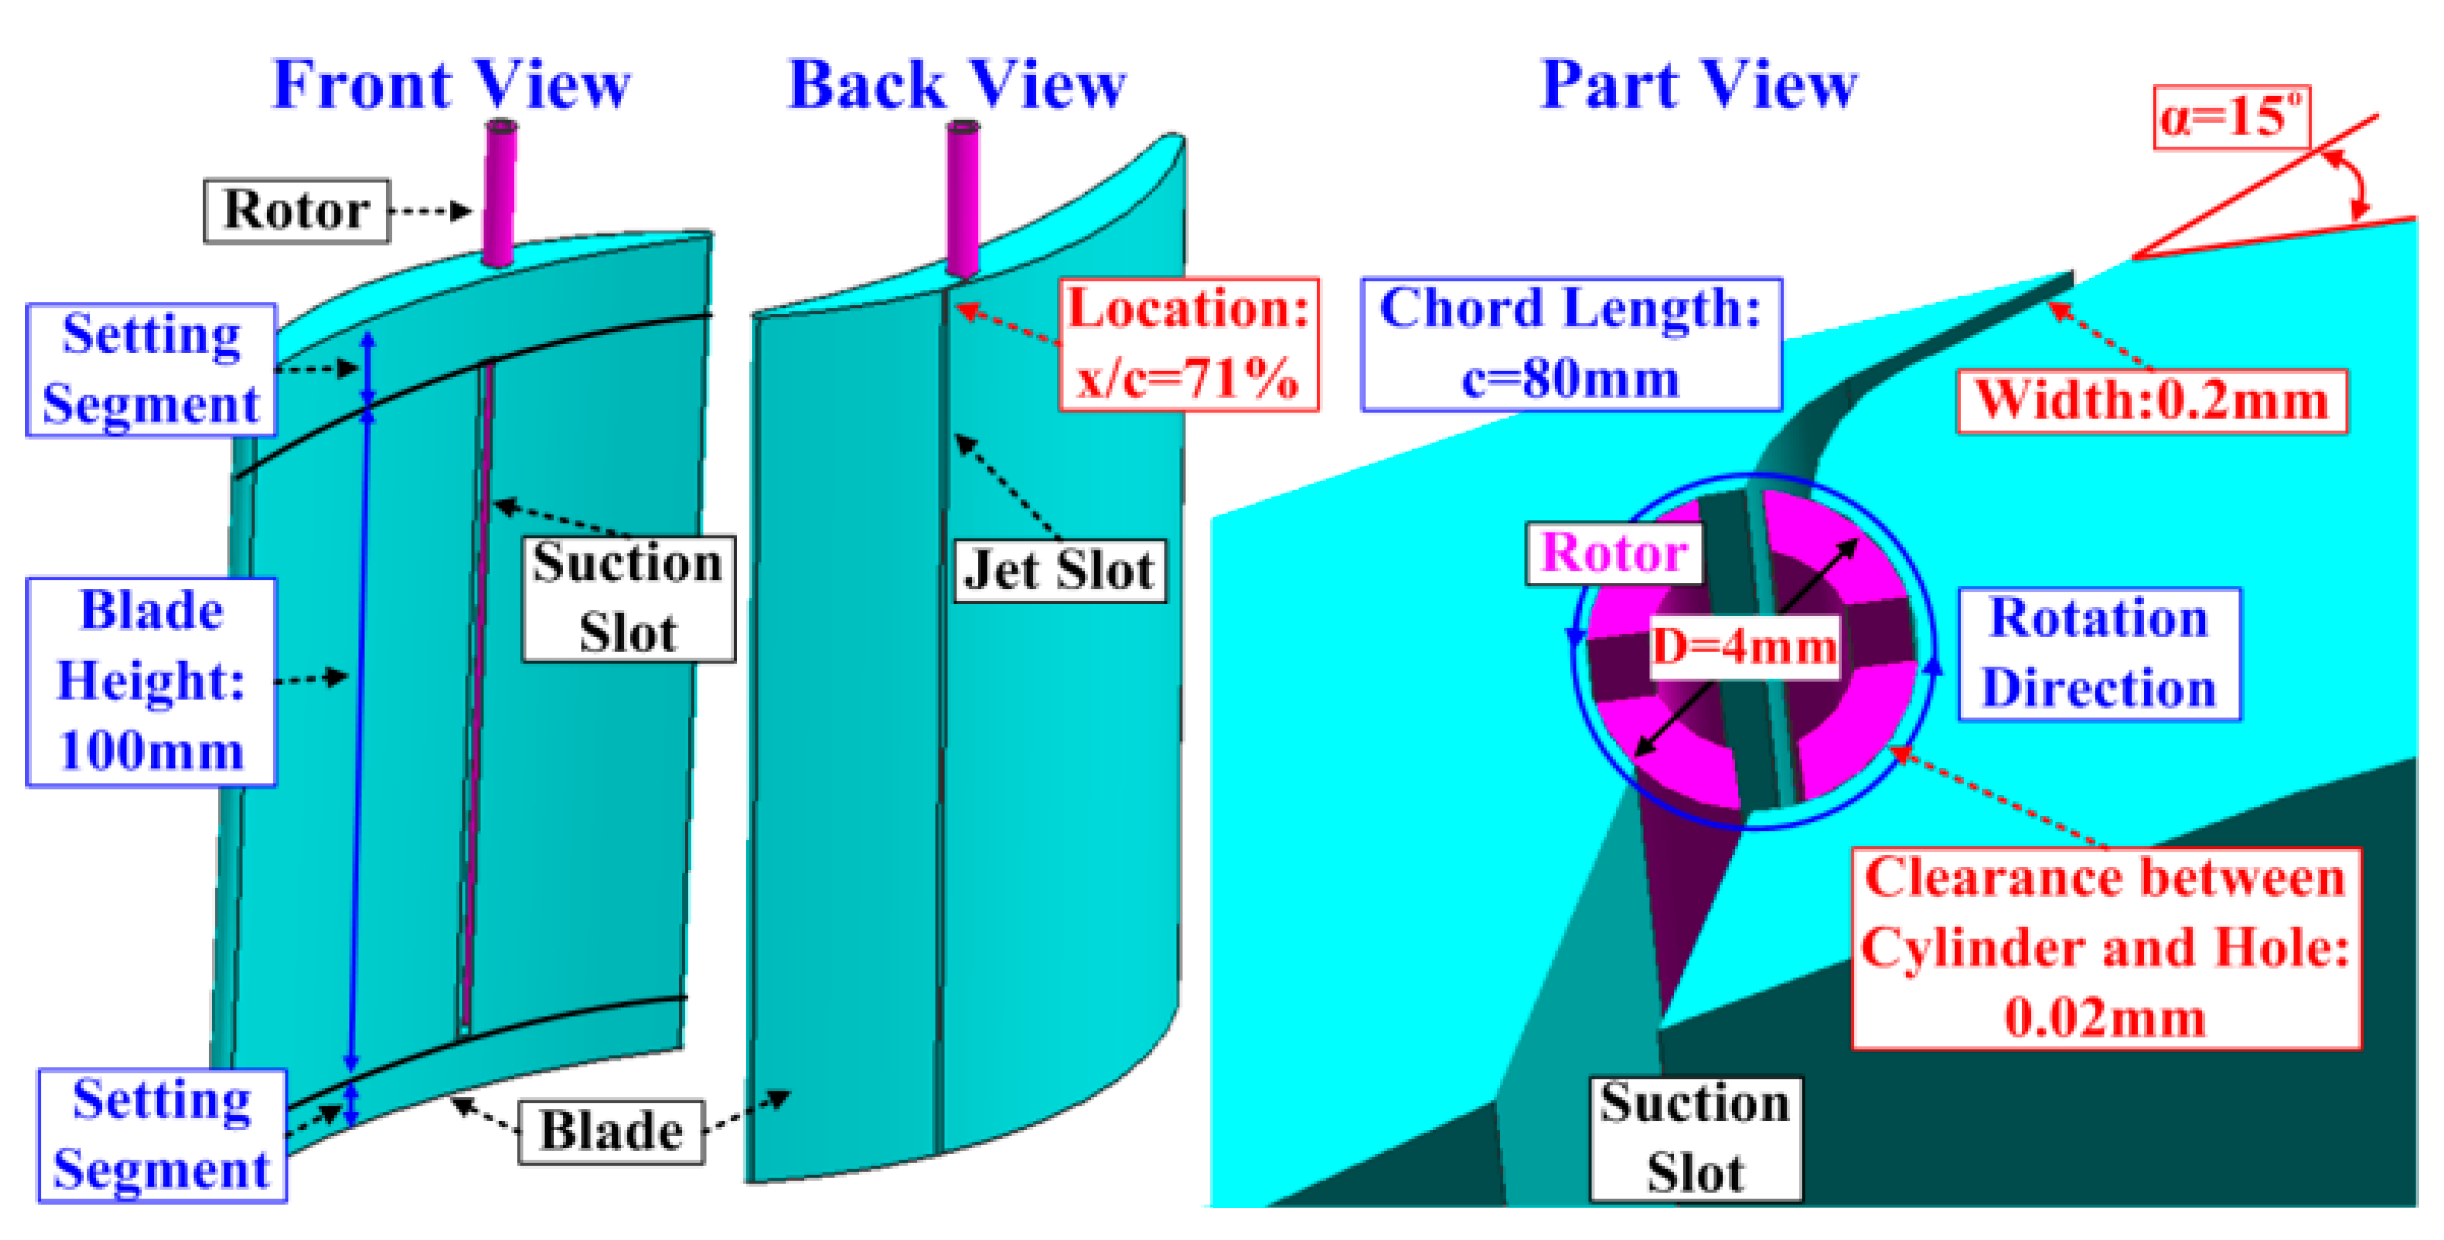
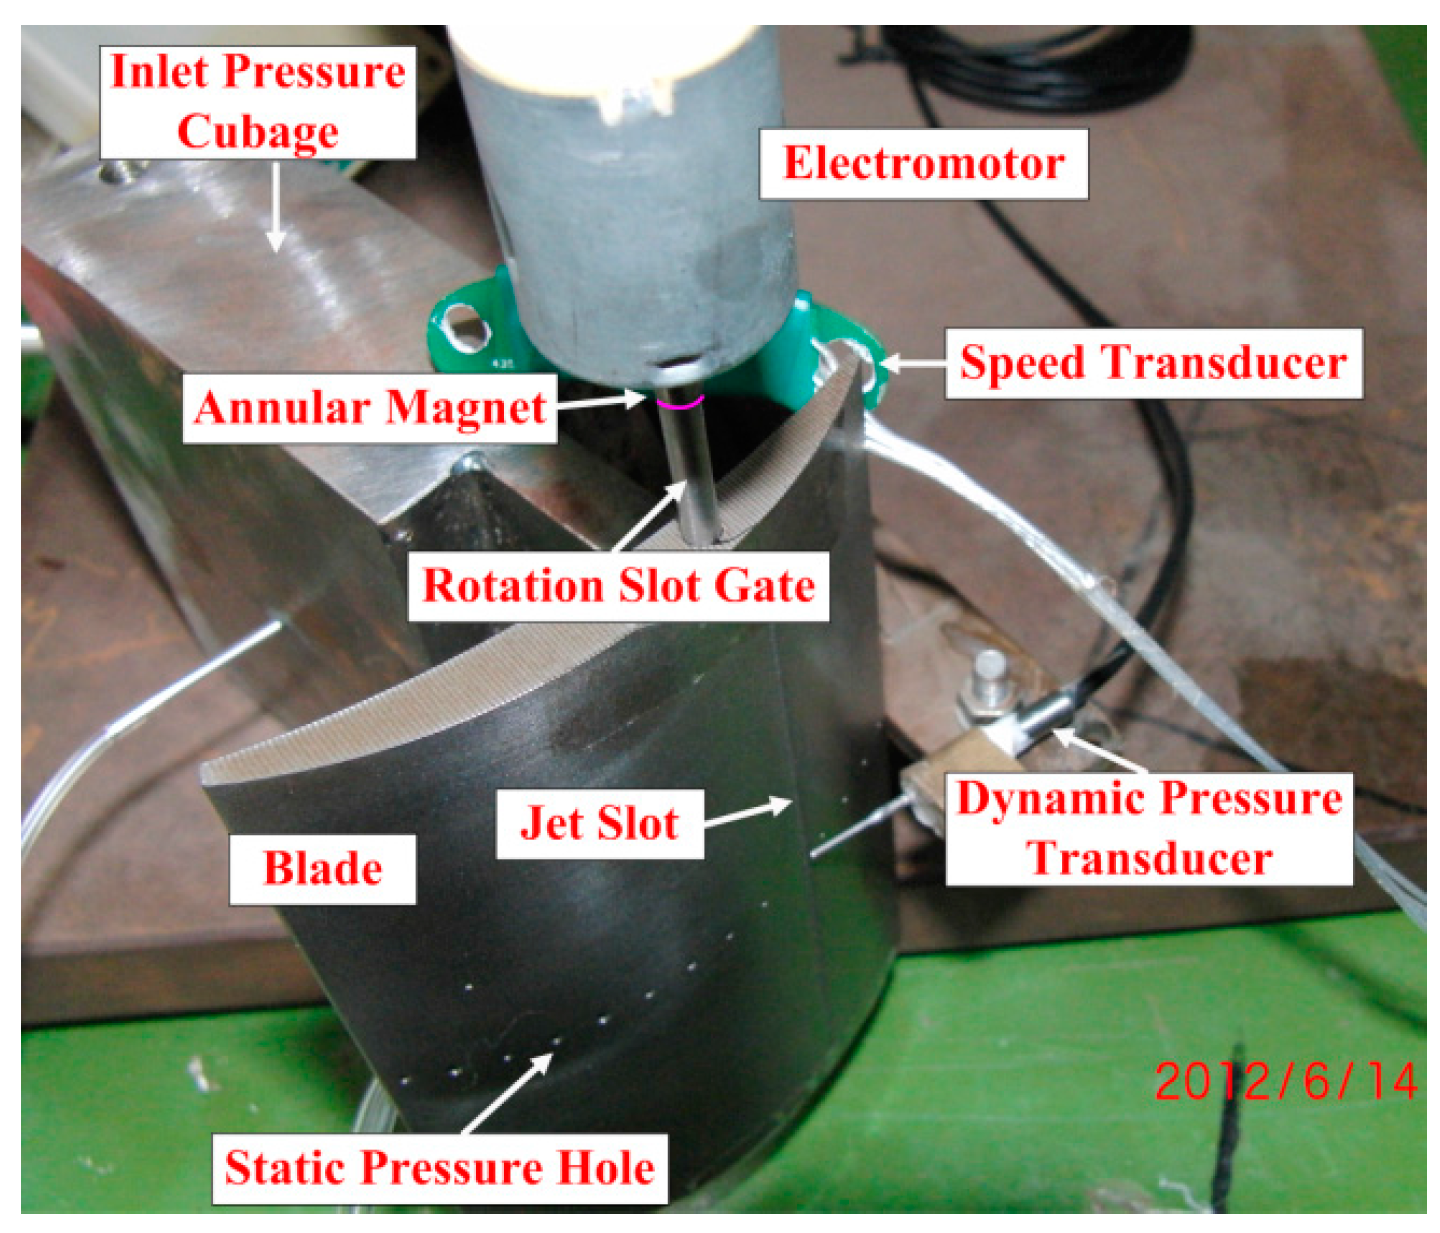
A novel pulsed jet flow control method without external energy injection is brought up in this paper. The new concept employs a micro switch to control the slot in the blade on and off to generate the pulsed jet of a certain frequency by the pressure difference between the pressure side and suction side of the blade. The corresponding cascade model is established for numerical and experimental studies.
(2)
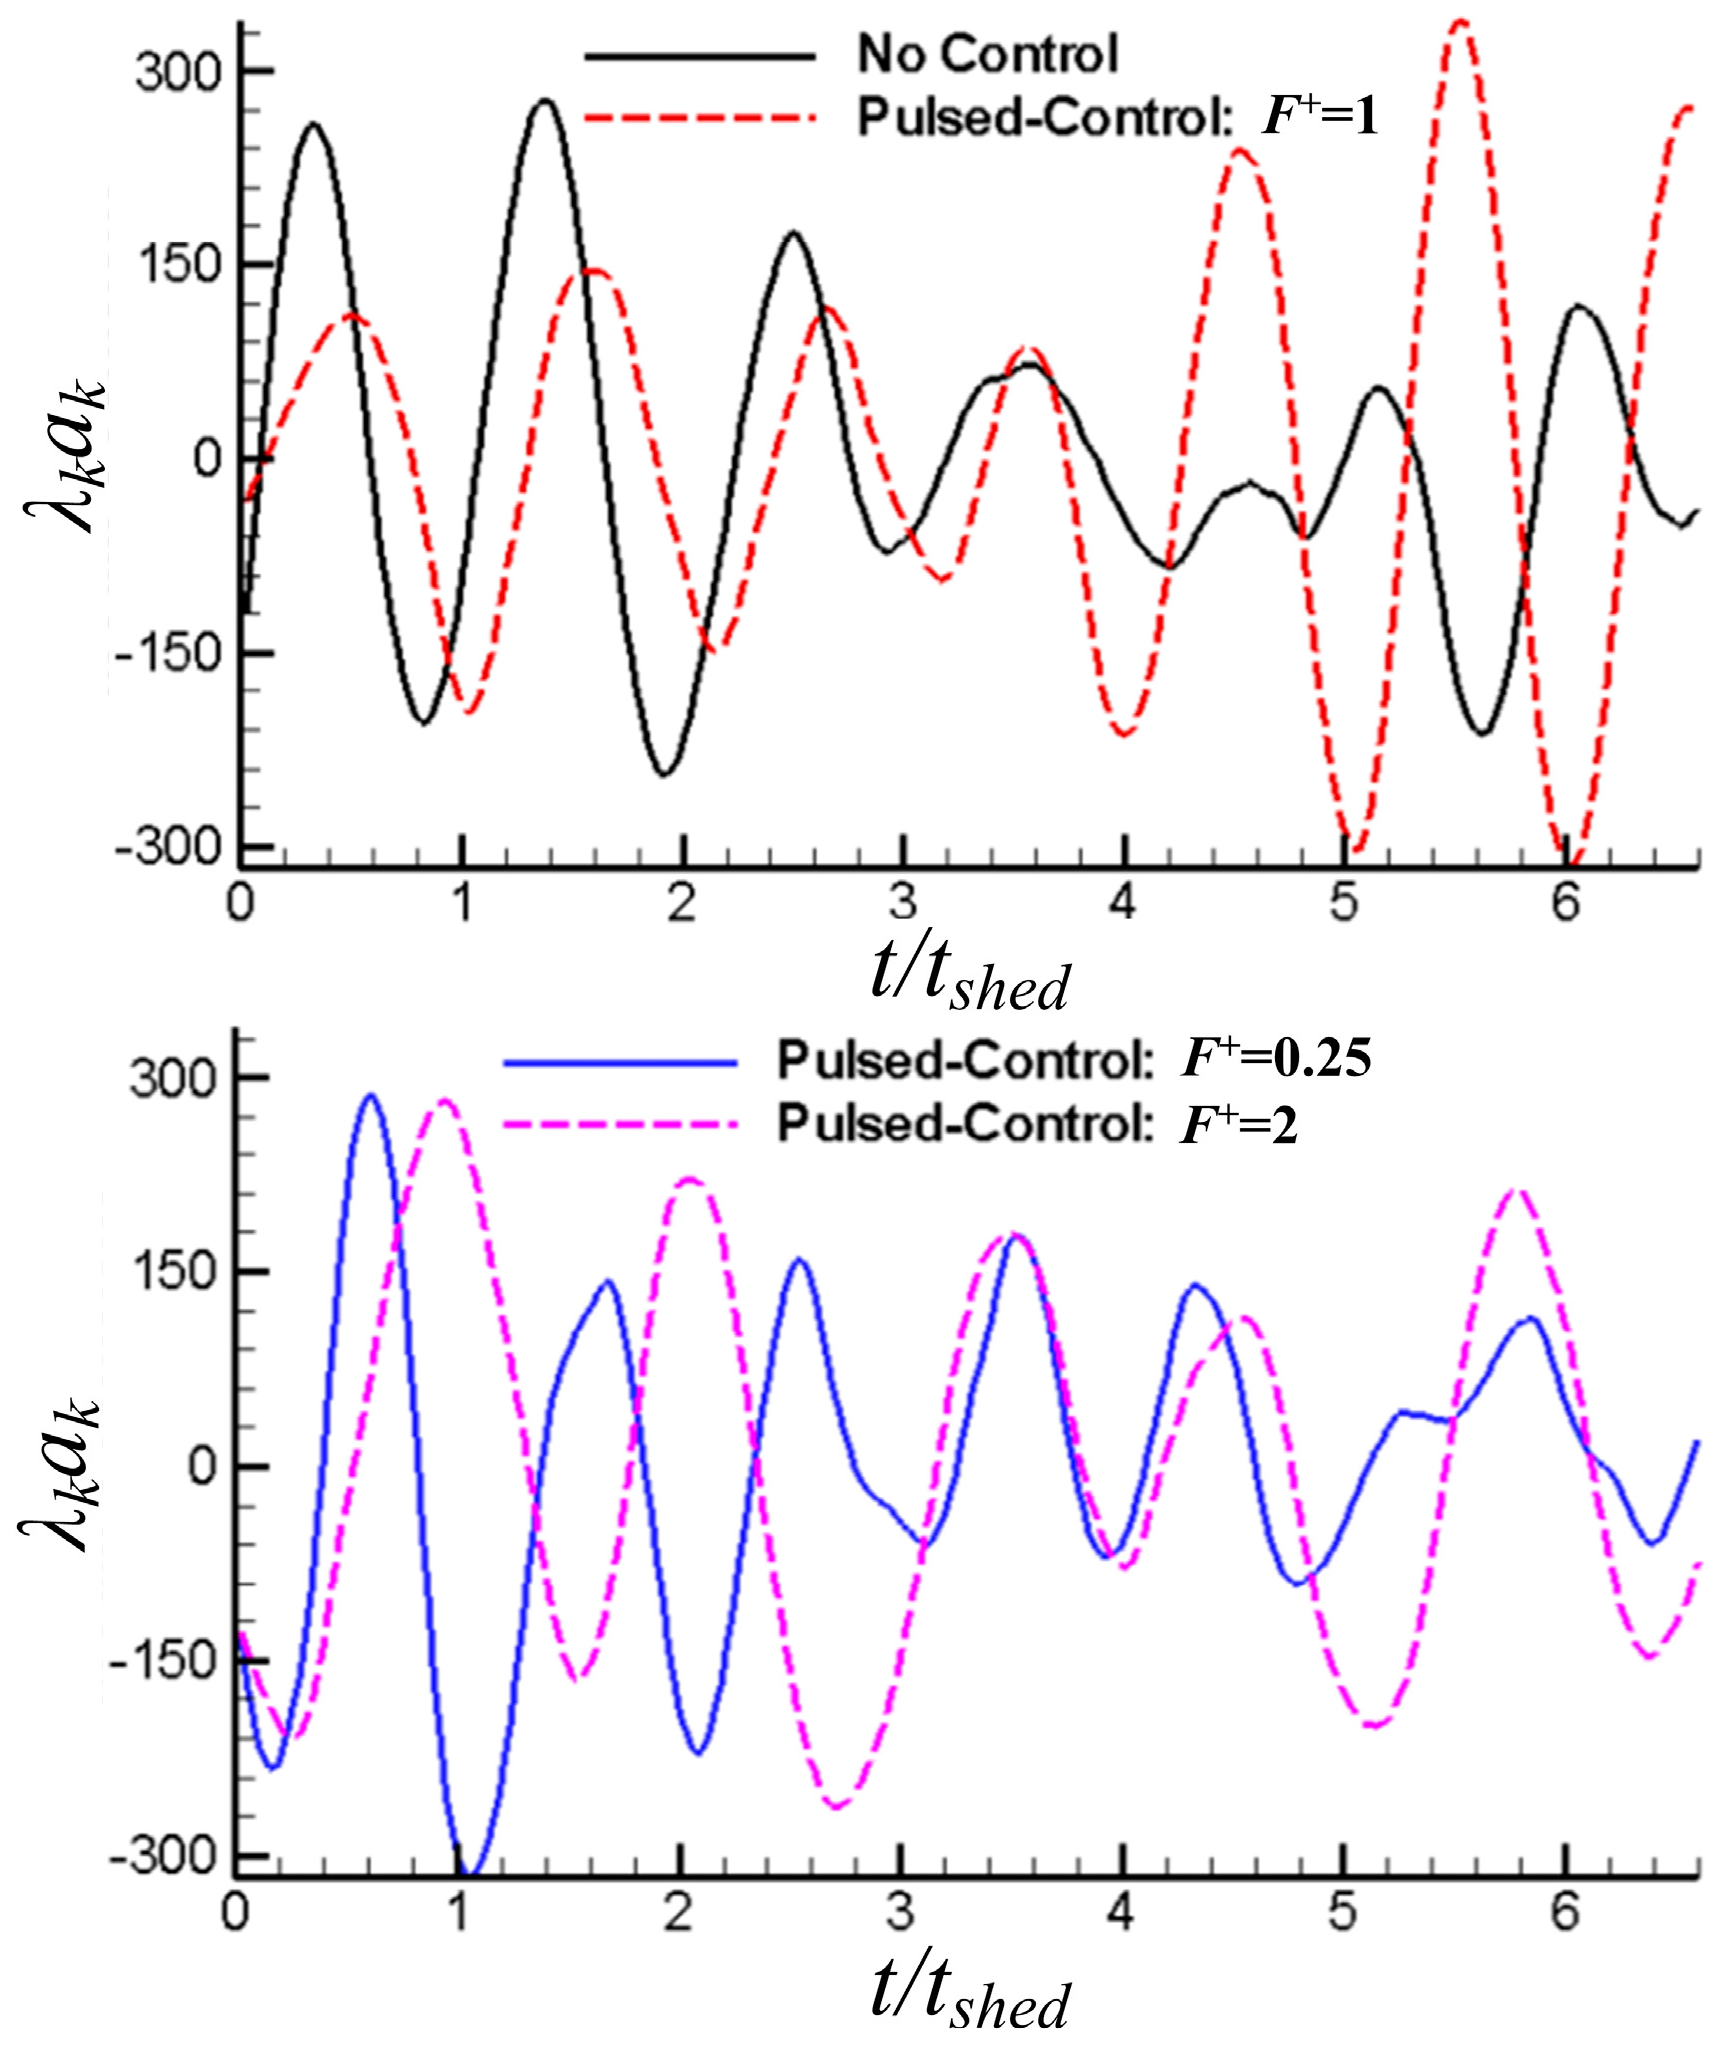
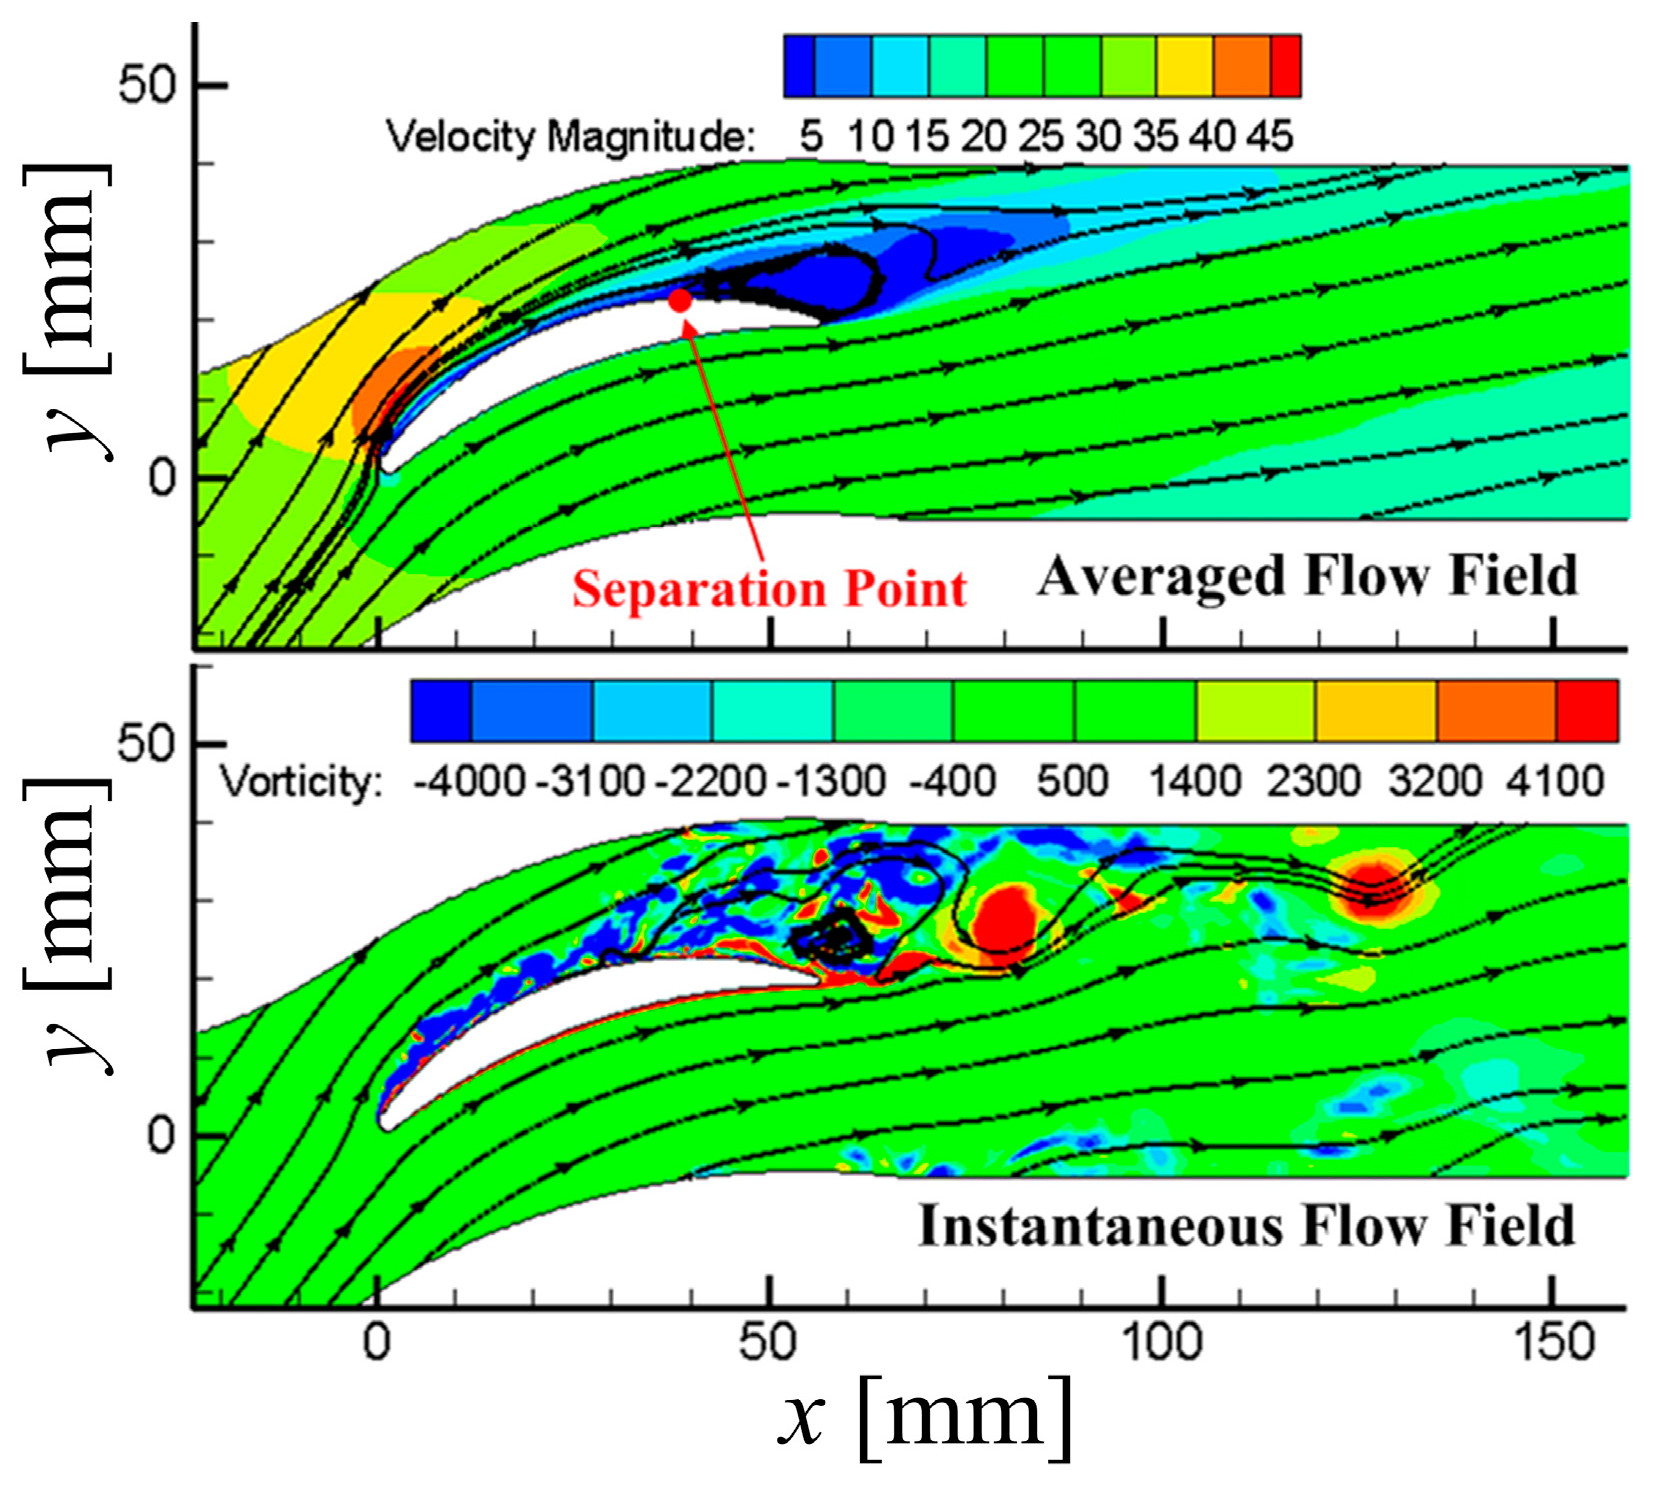
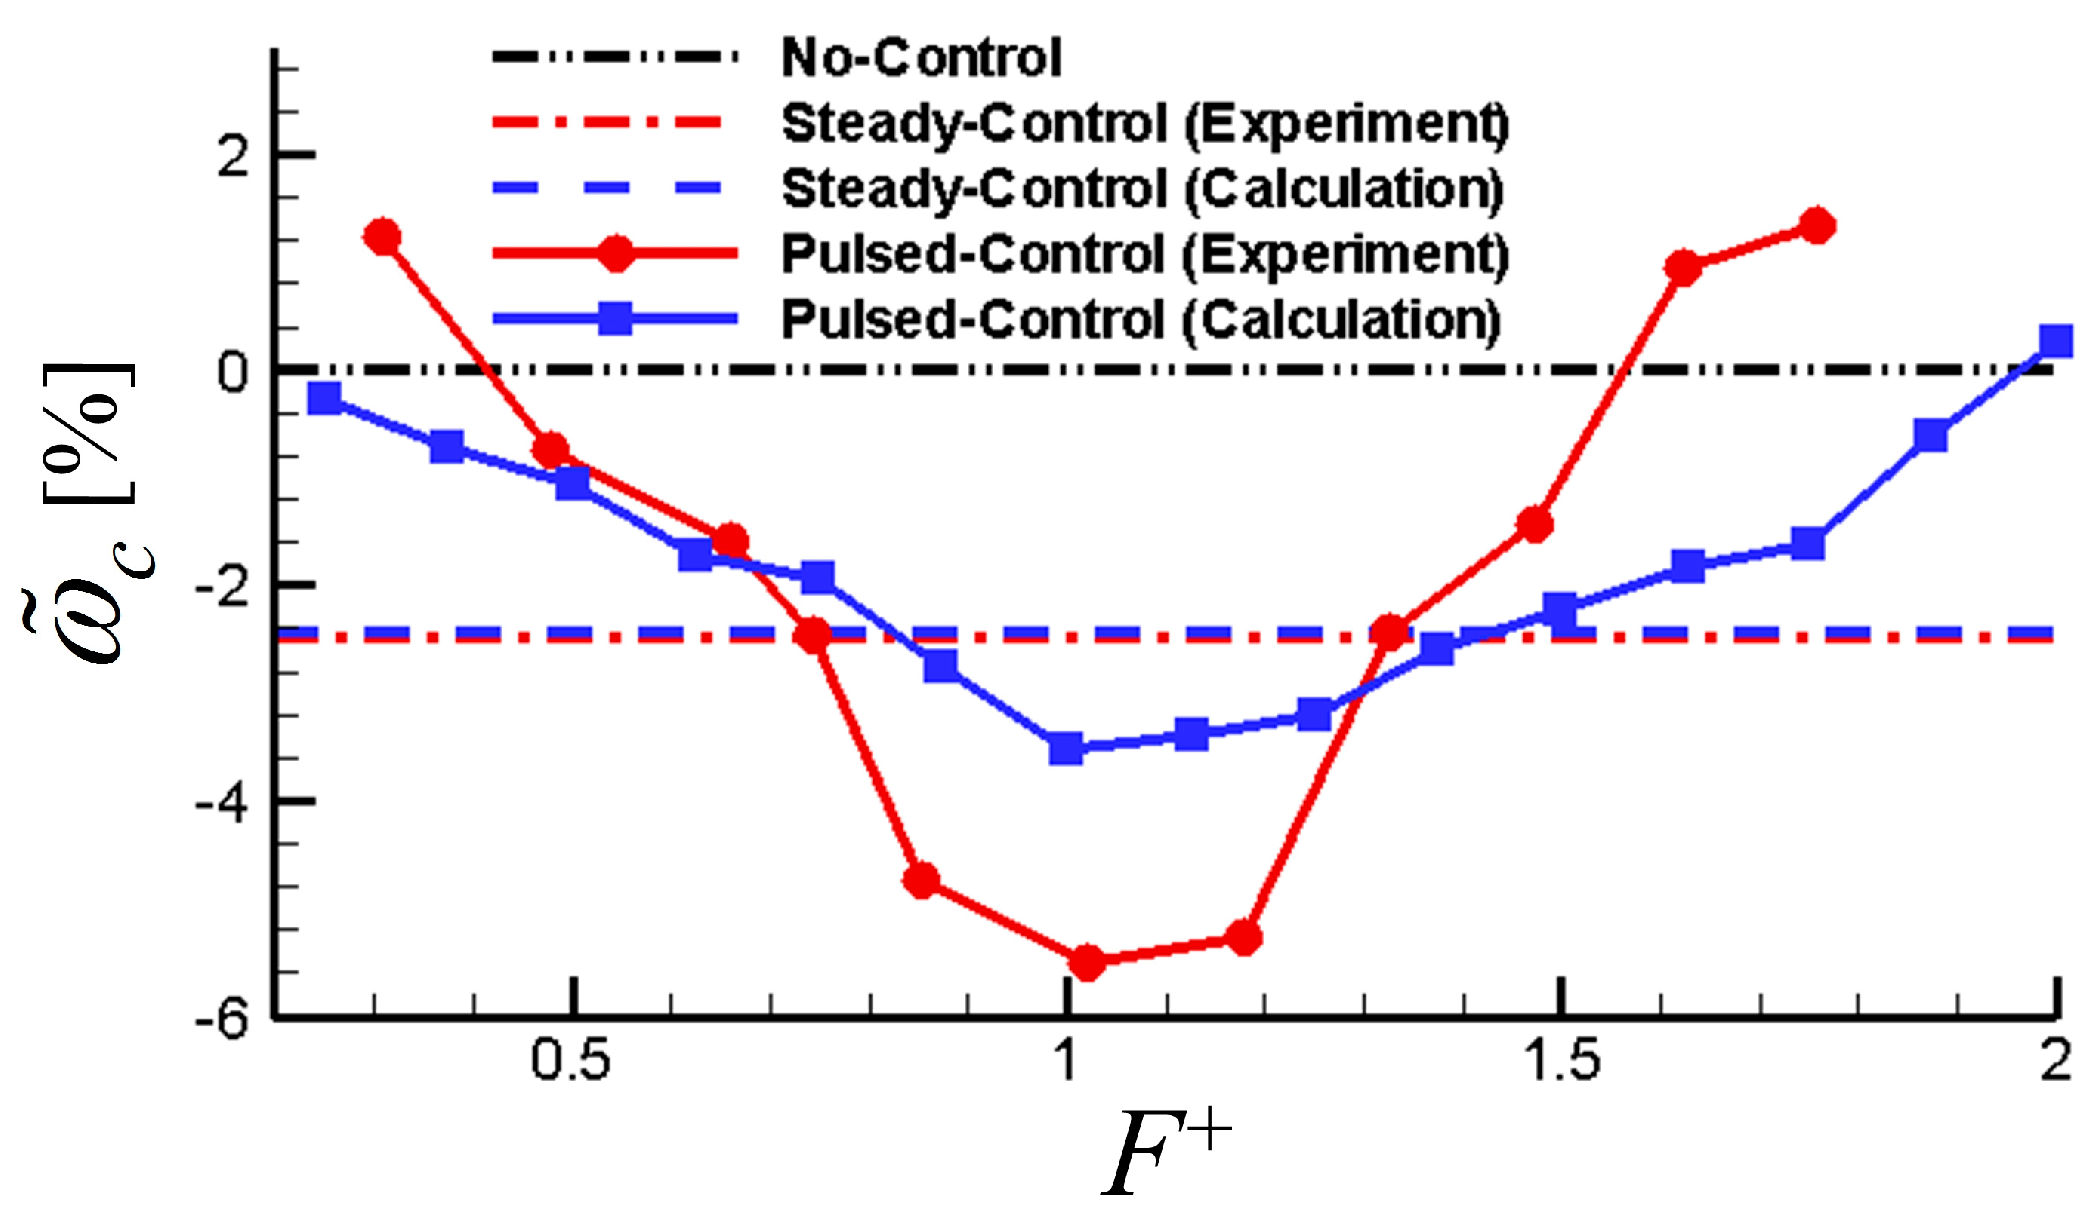
Large eddy simulation is held referring to this cascade with and without pulsed jet flow control on it. The numerical simulations show that when the frequency of pulsed jet is approximate to that of separation vortex, the control effect is more visible.
(3)
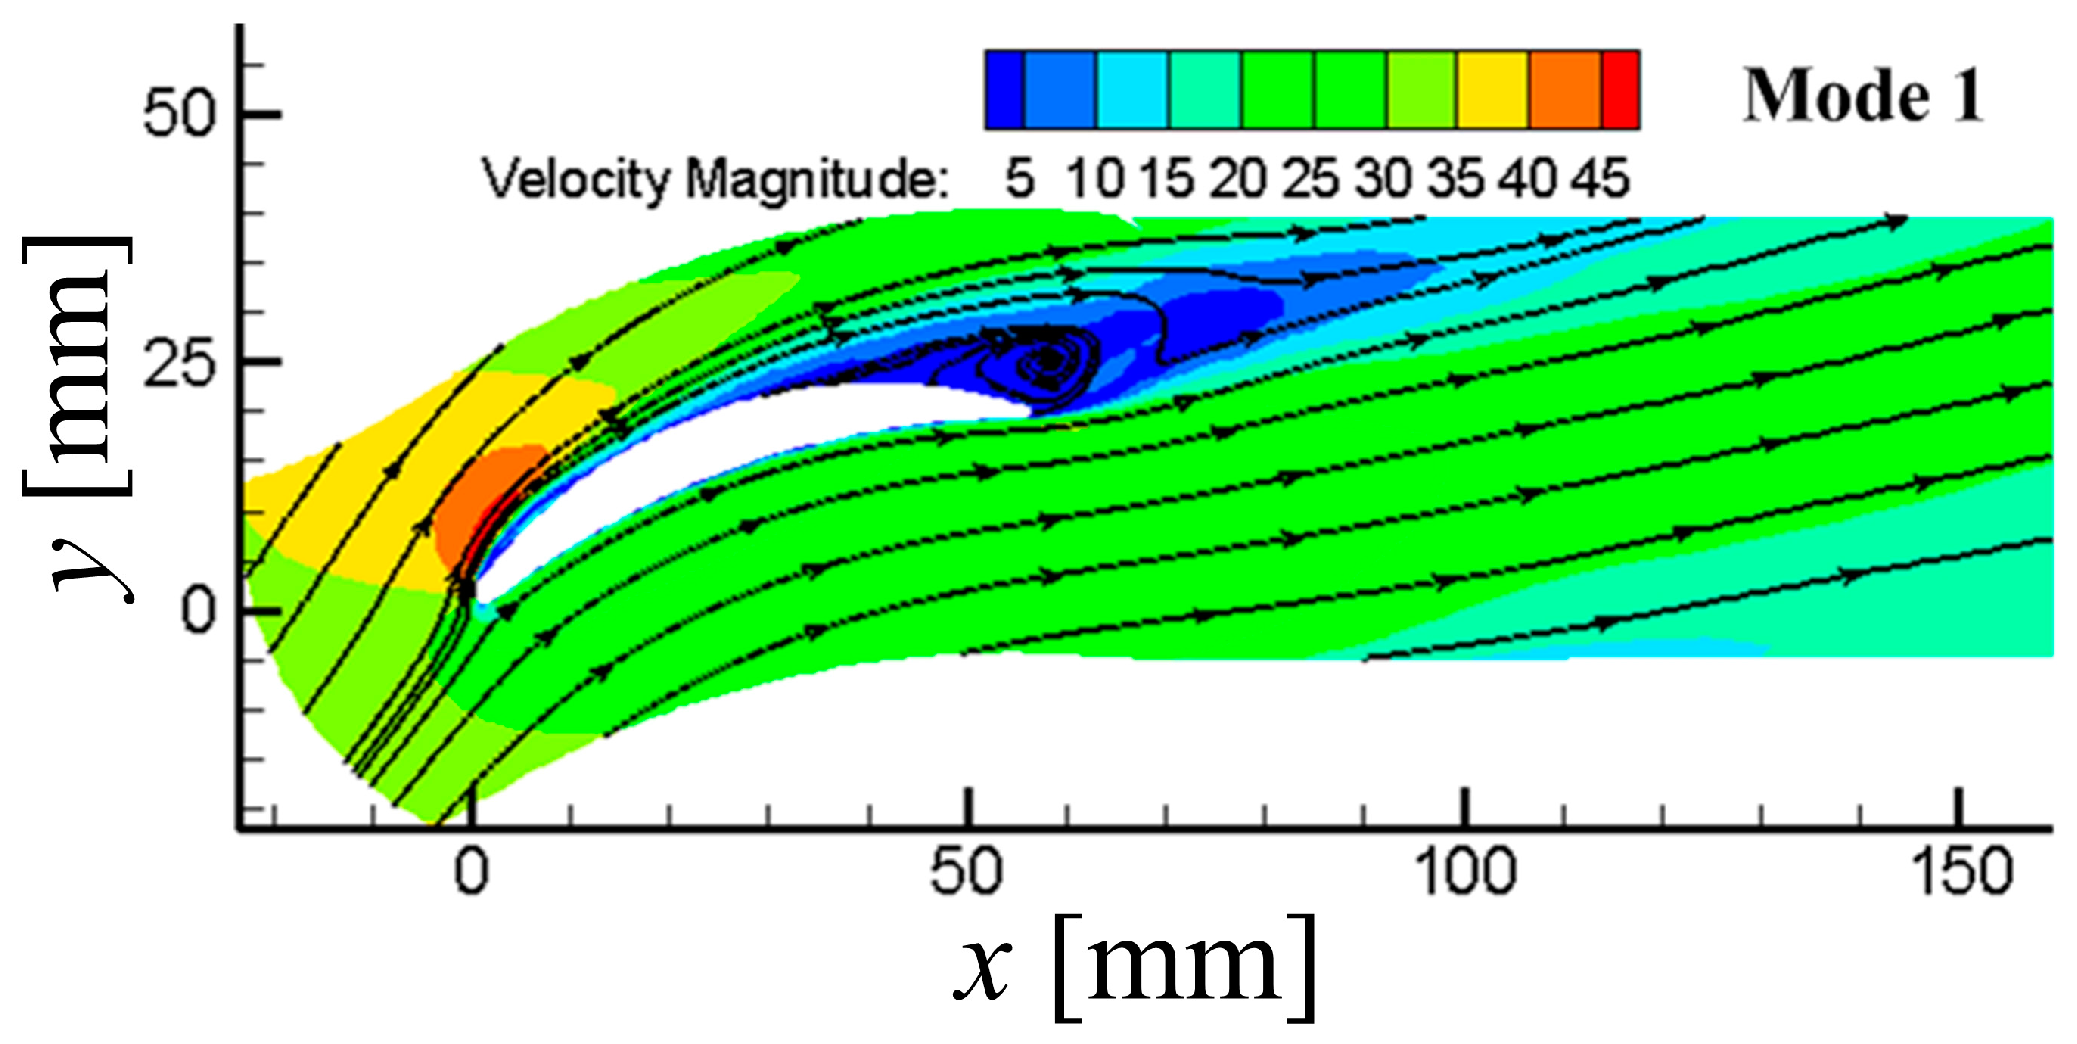
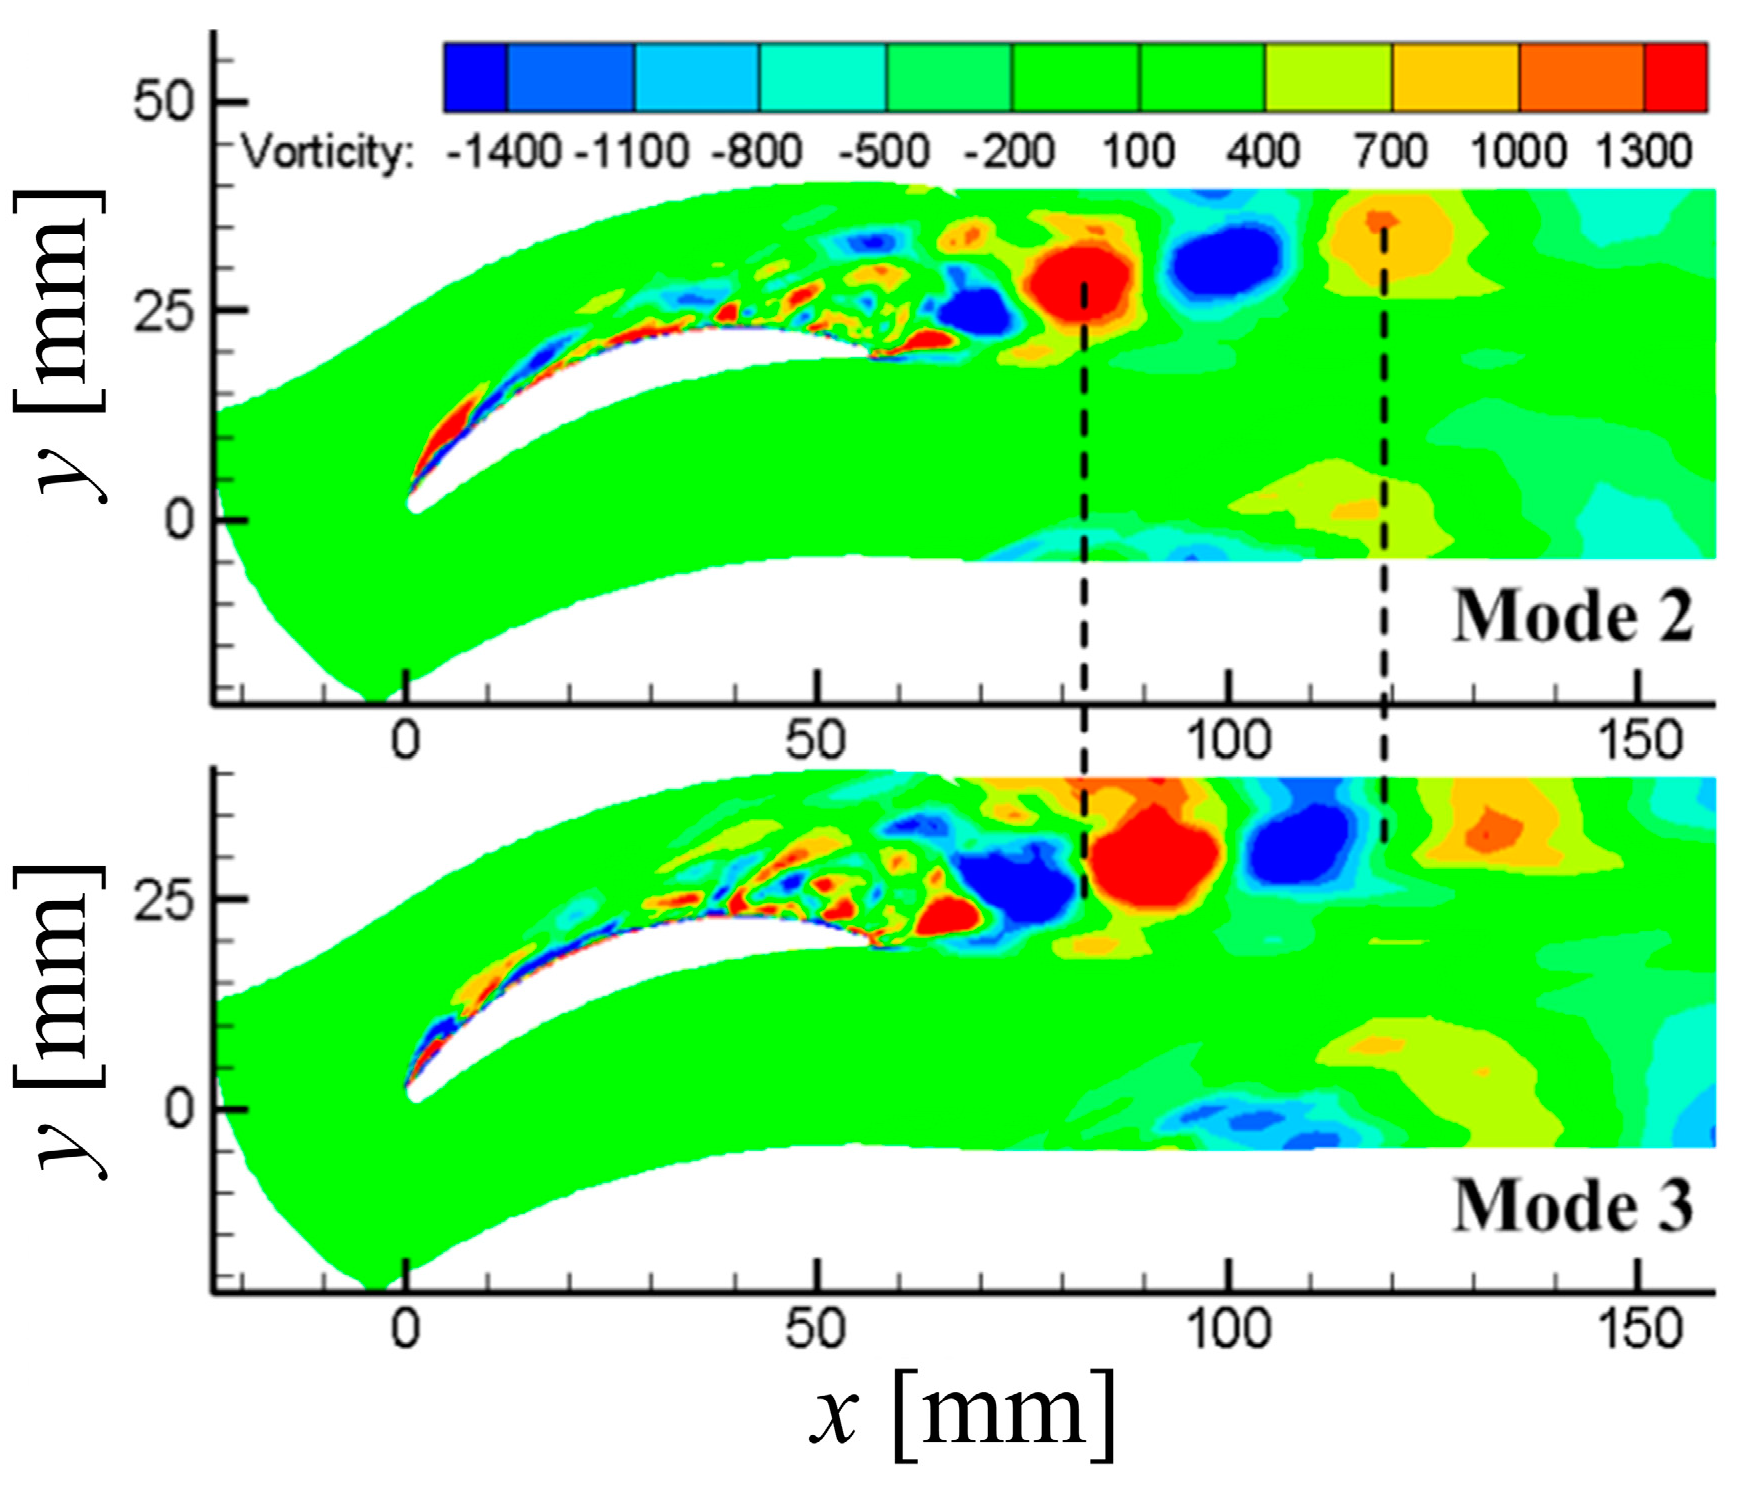
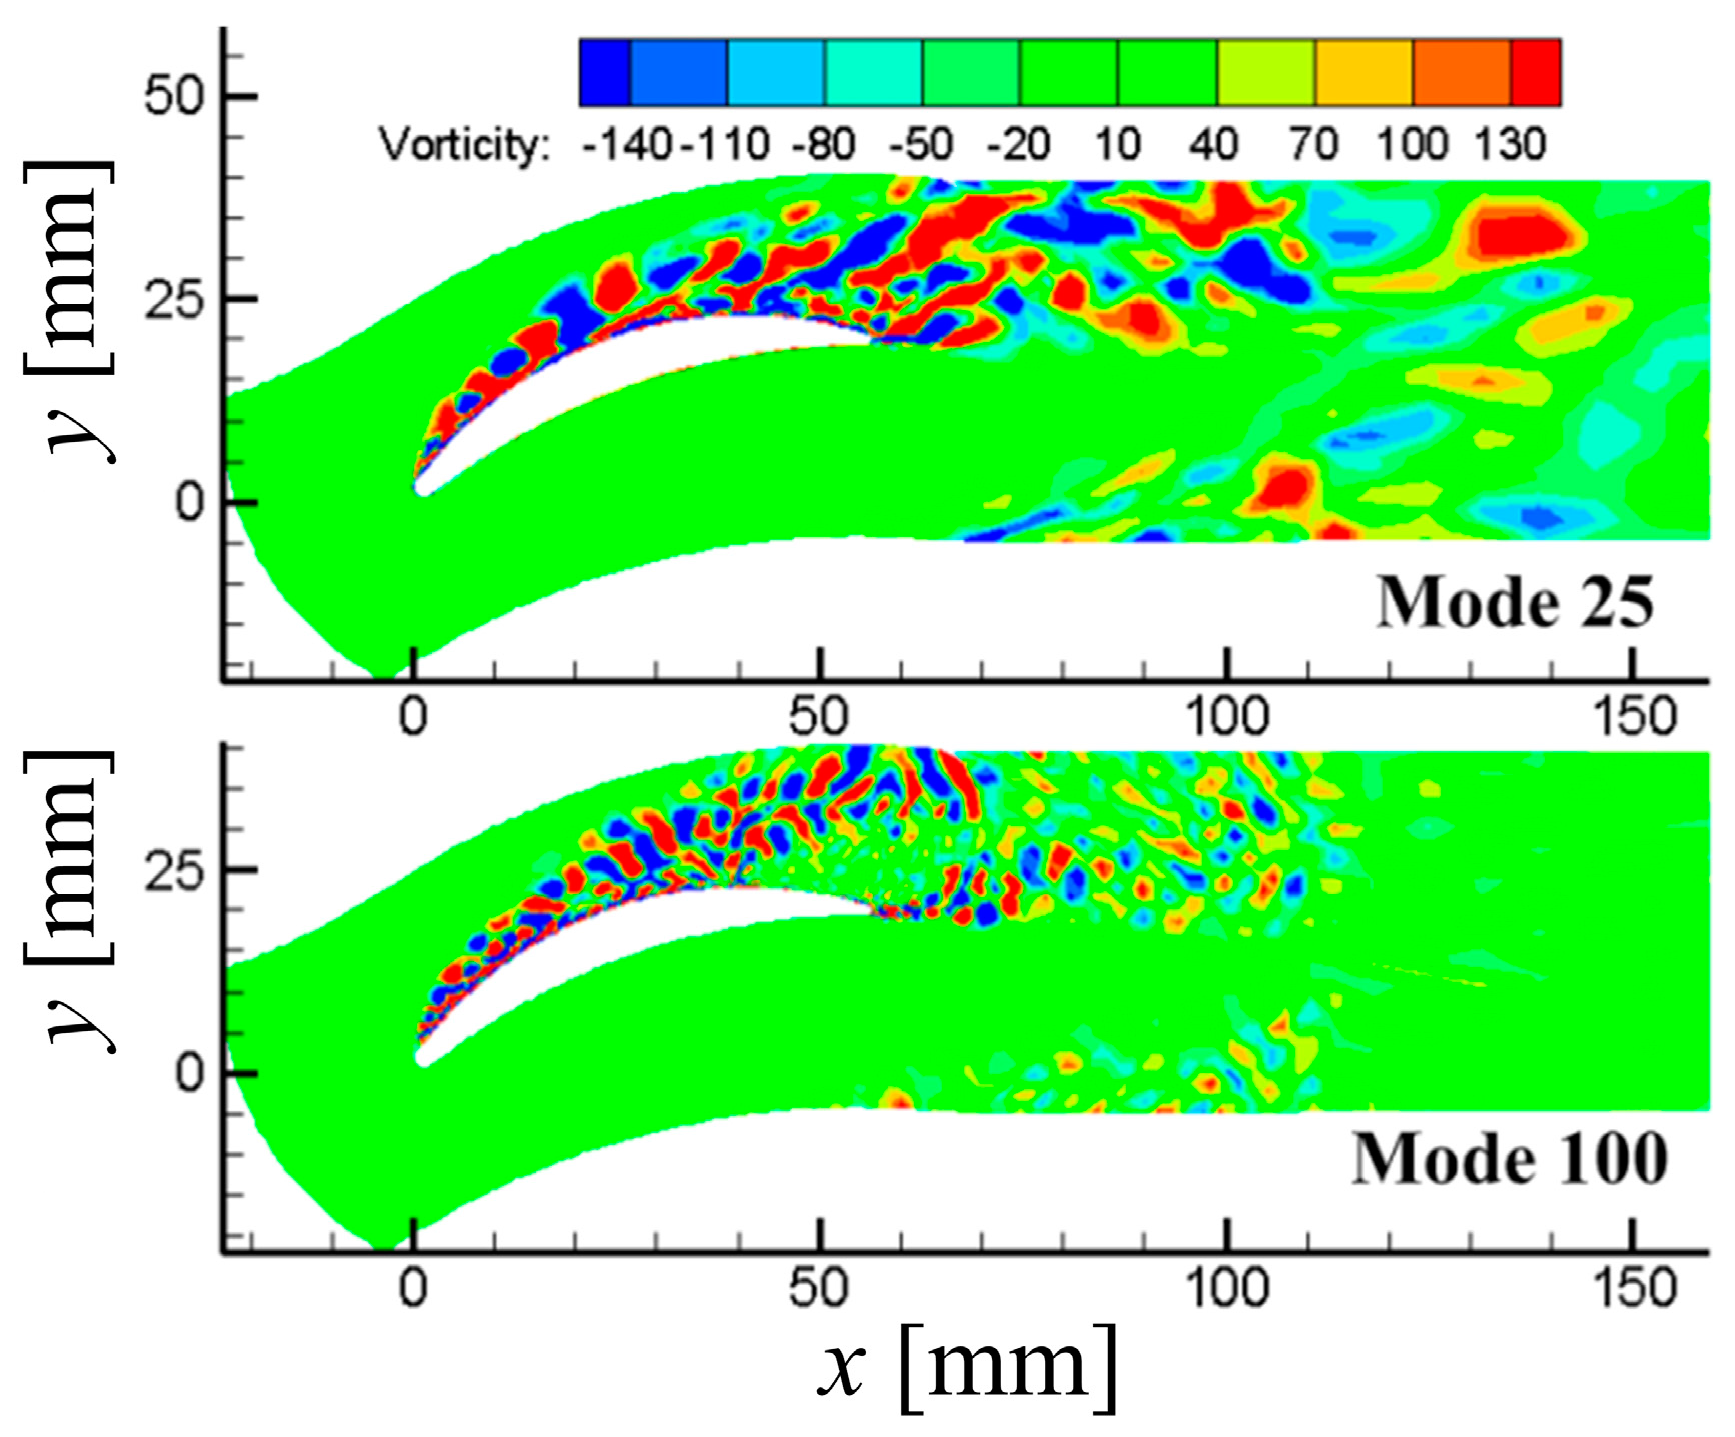
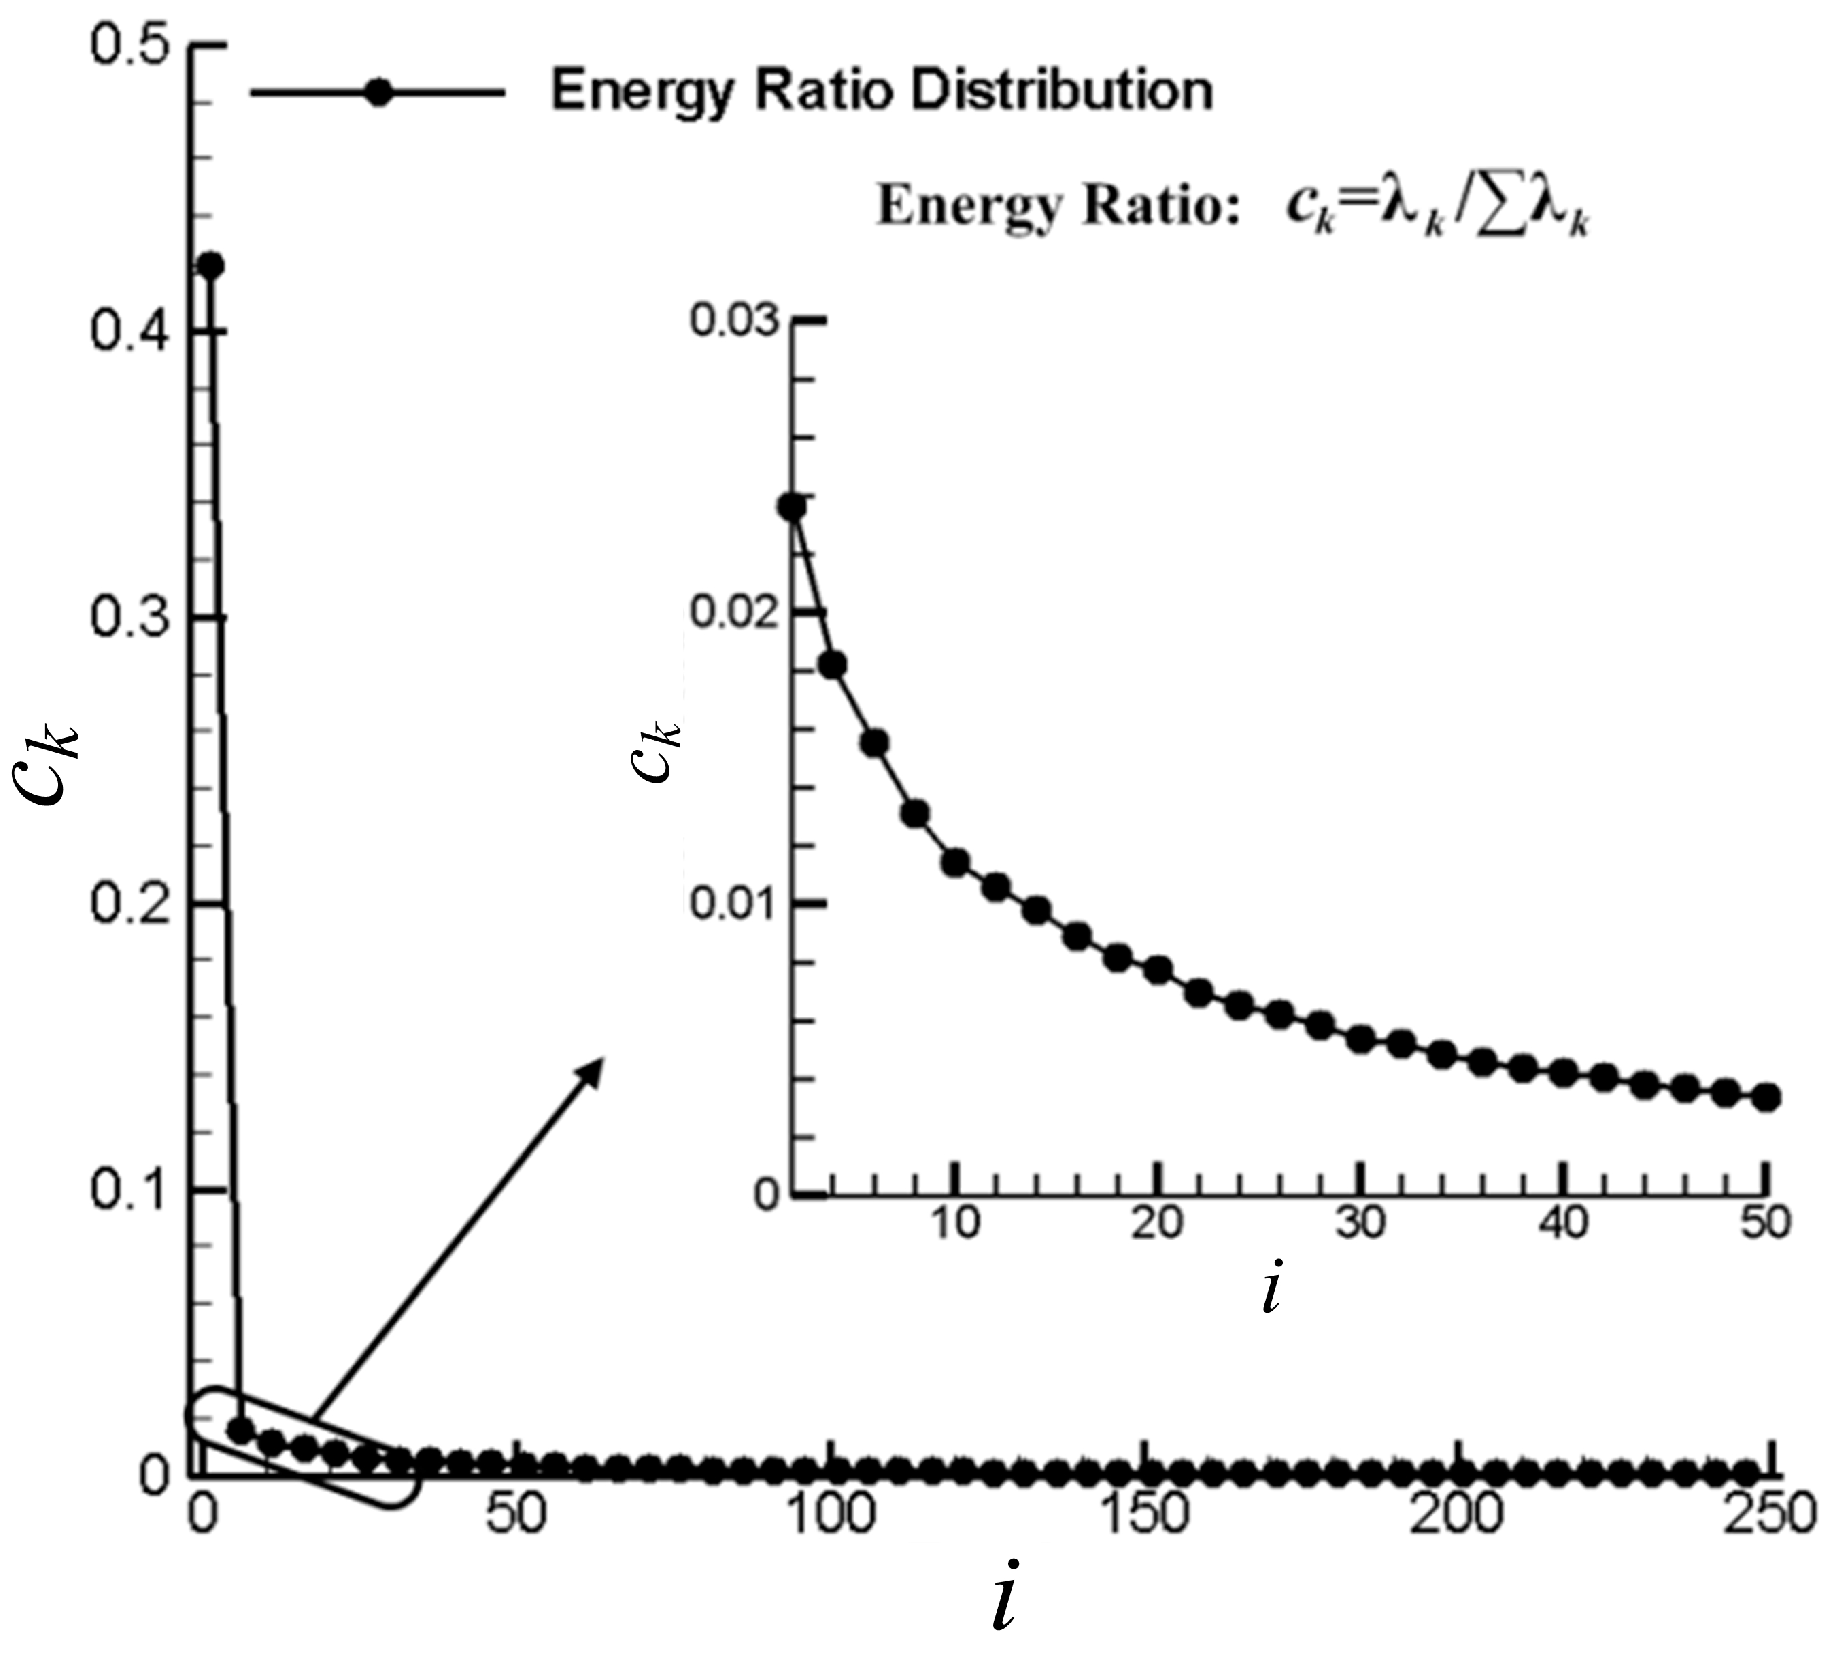
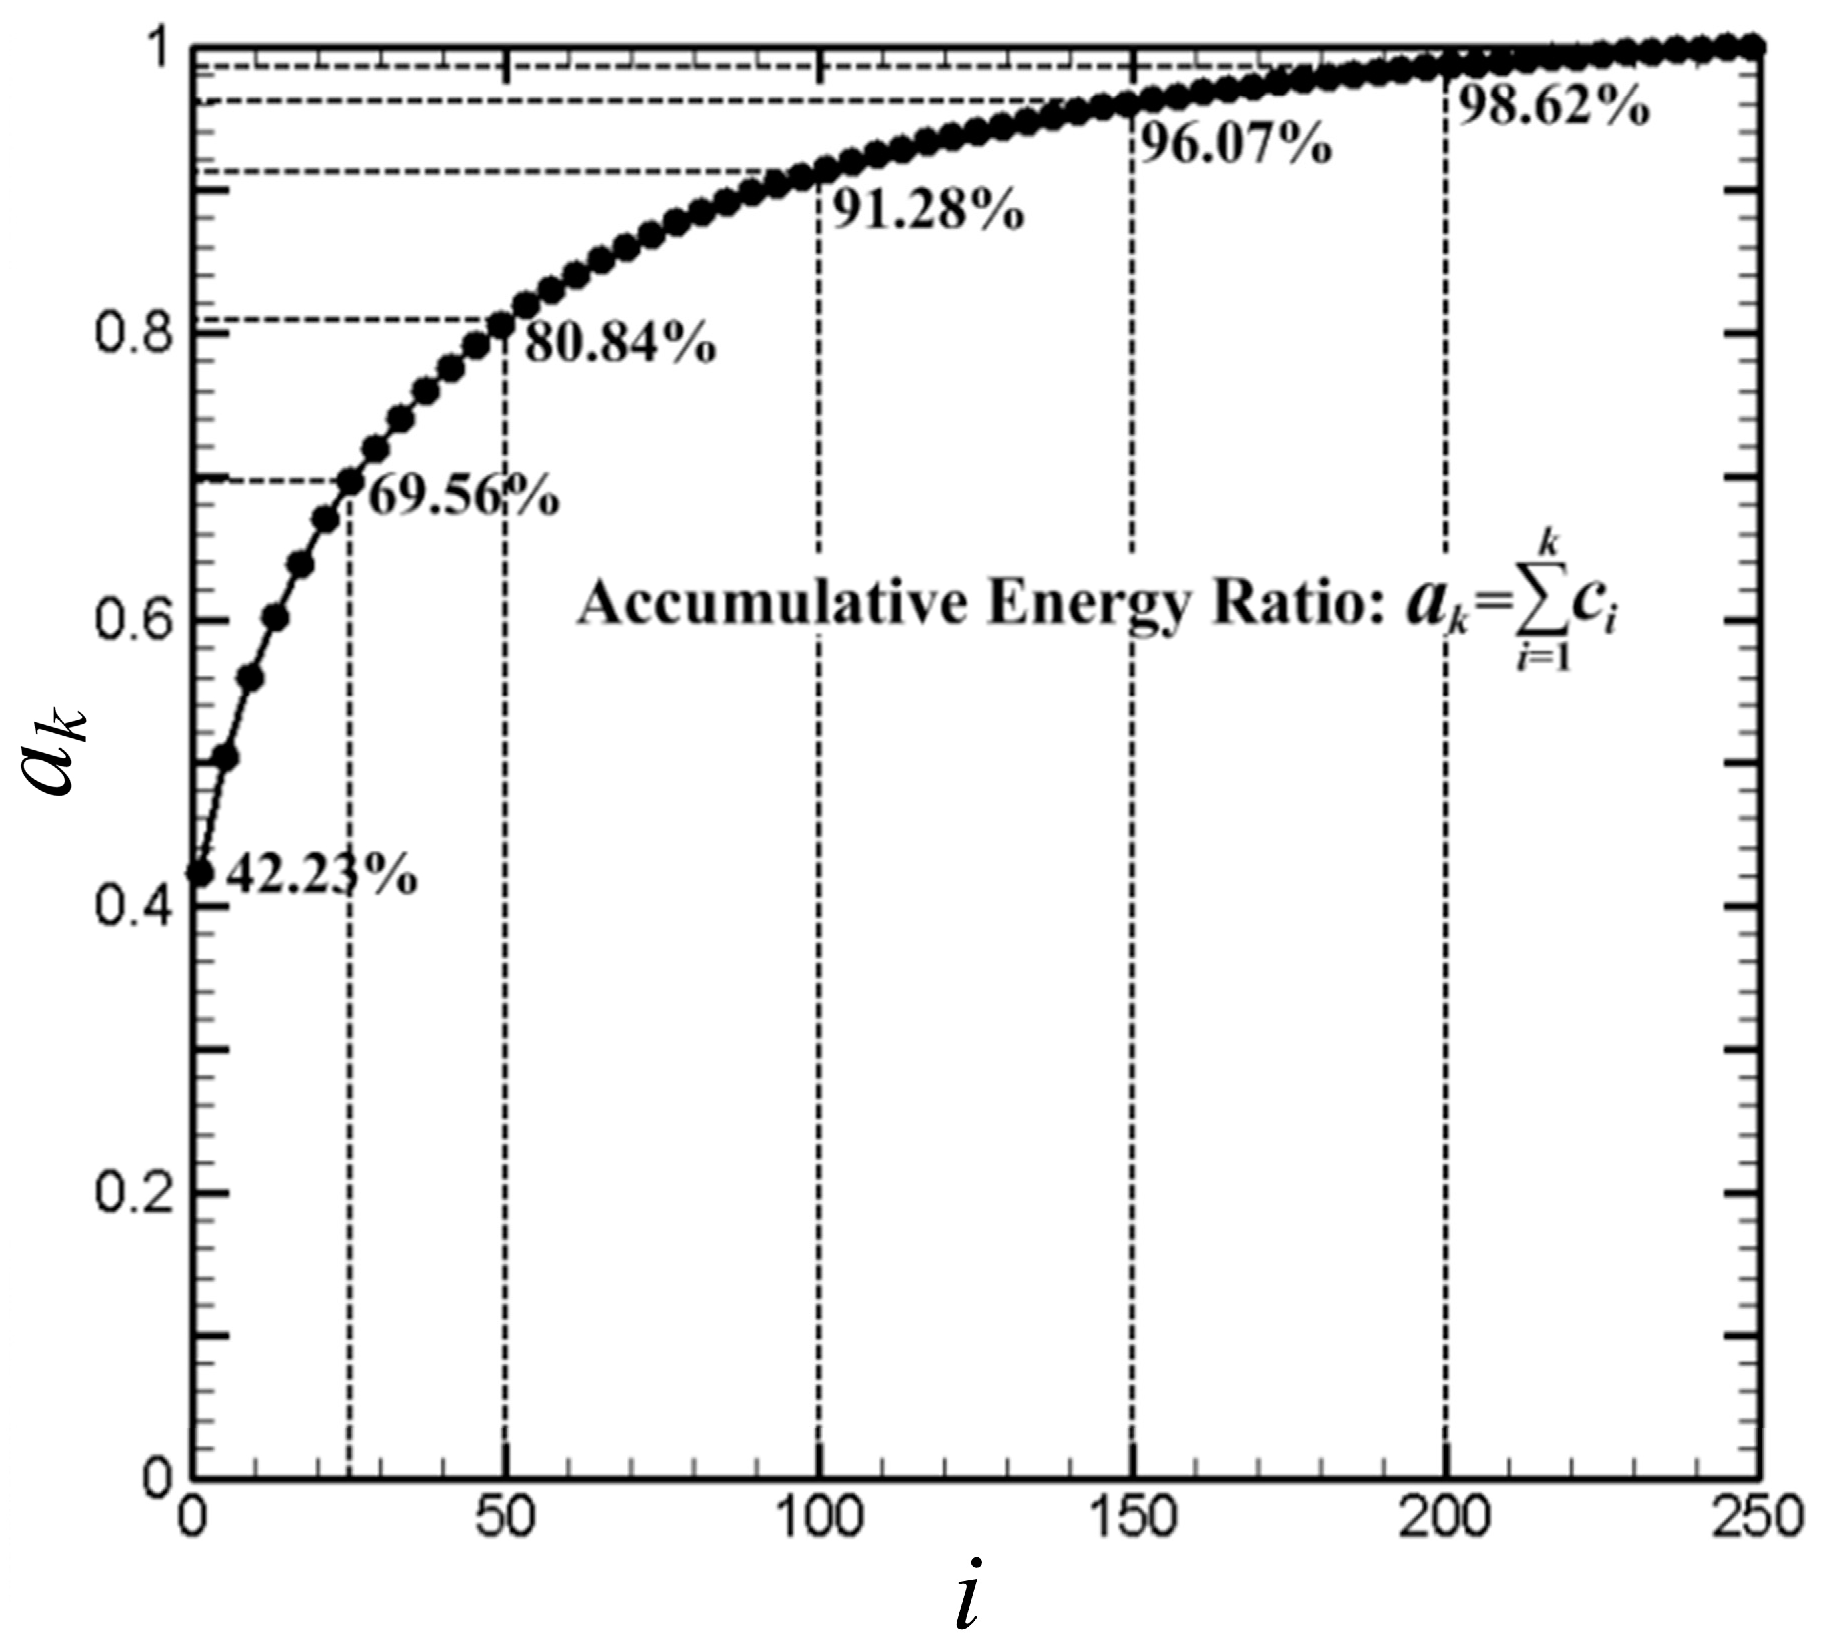
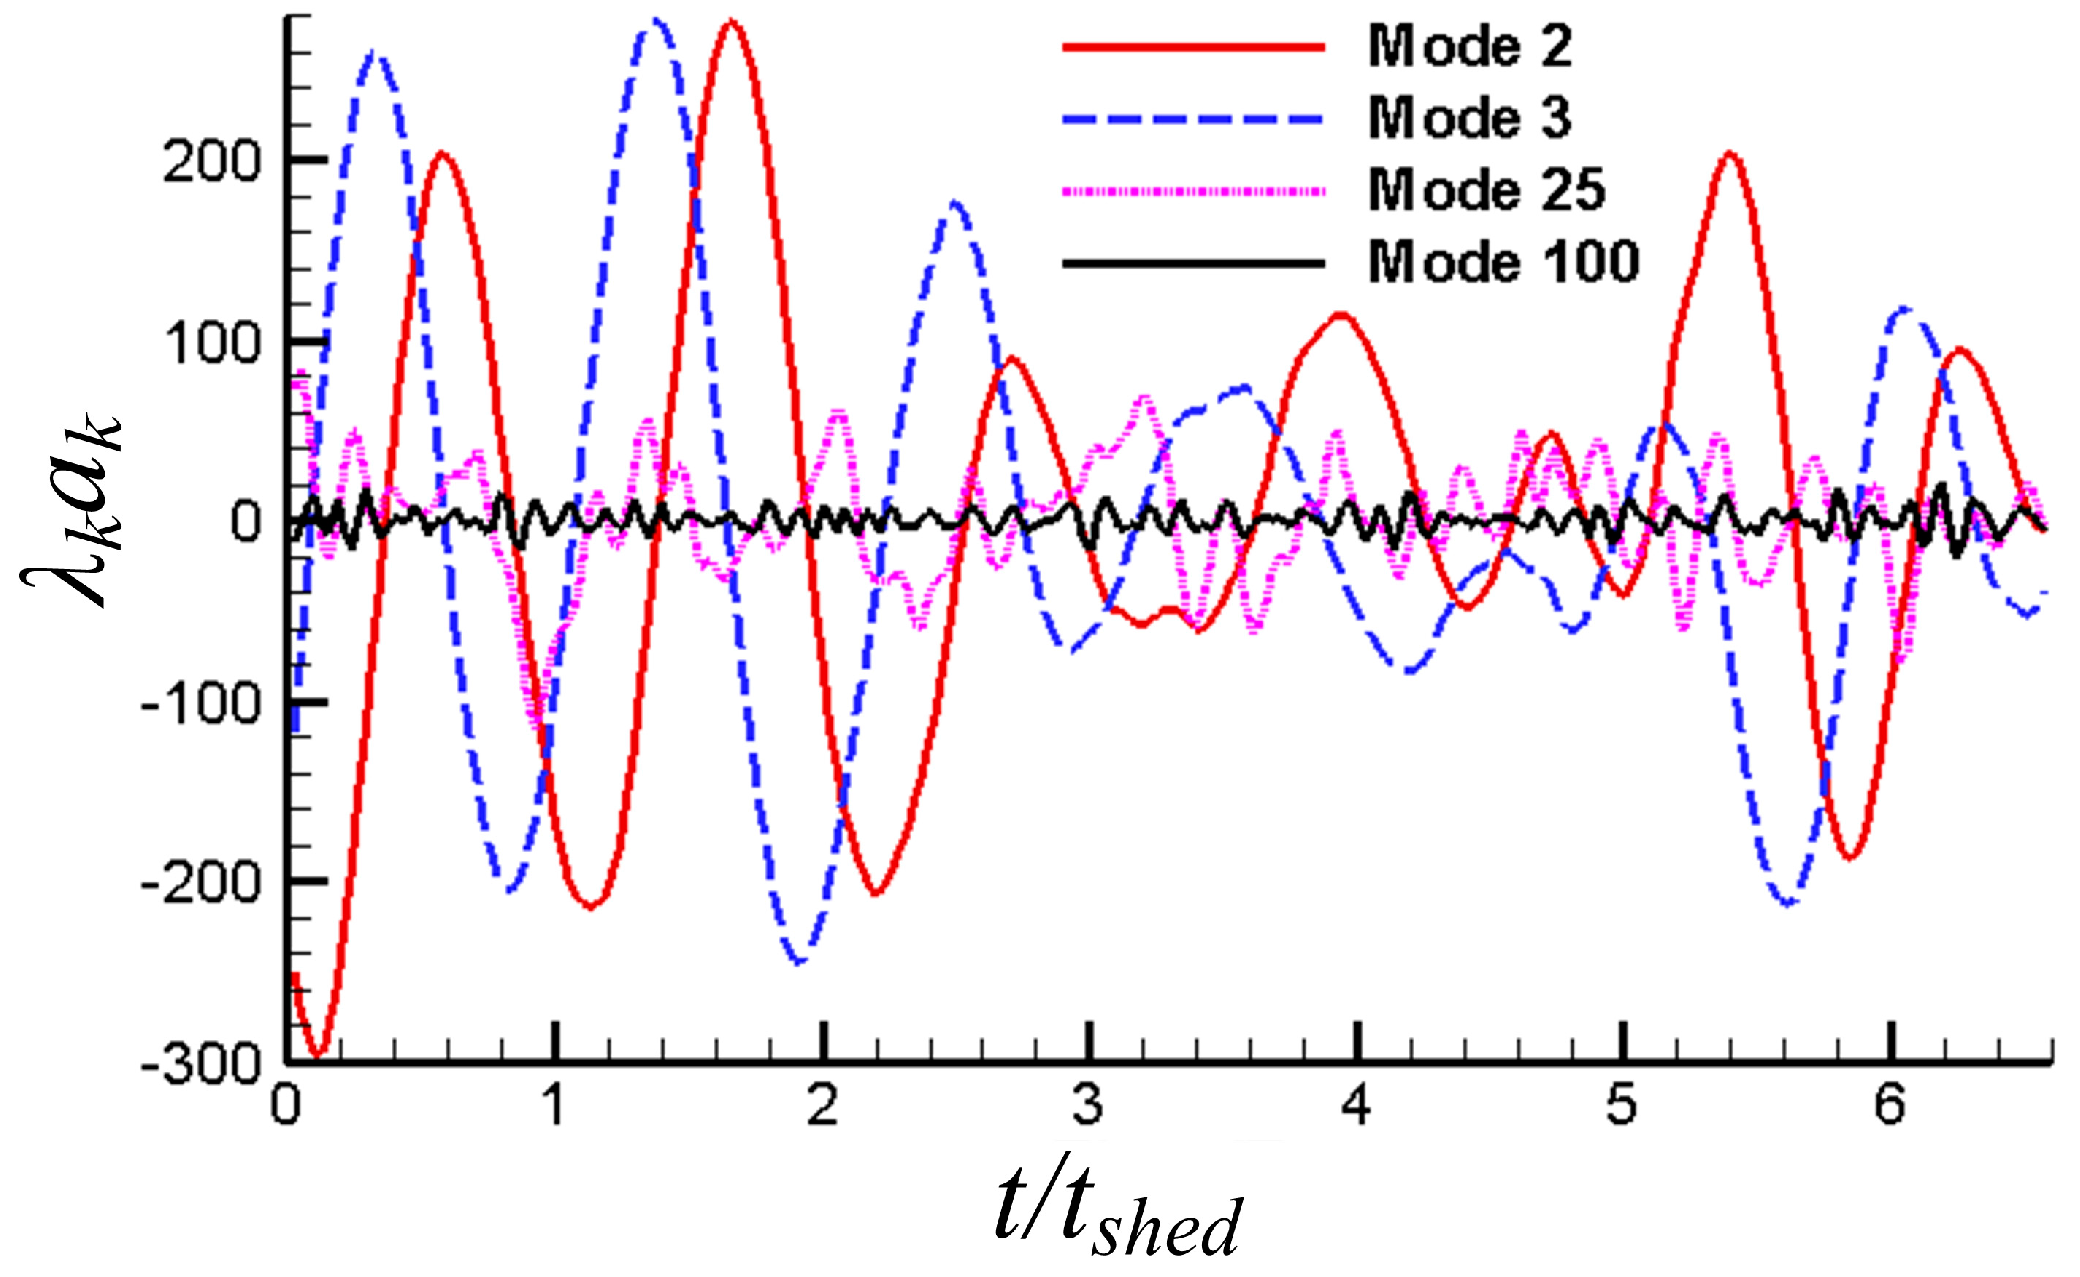
The POD method is used to analyze the complex unsteady flow field. The different POD modes represent the different scale flow structures. Based on conducted research, the first mode represents the structure of time-averaged flow, and the second and third modes together represent the separation vortices. Other modes represent other more small-scale and complex vortex structures.
(4)
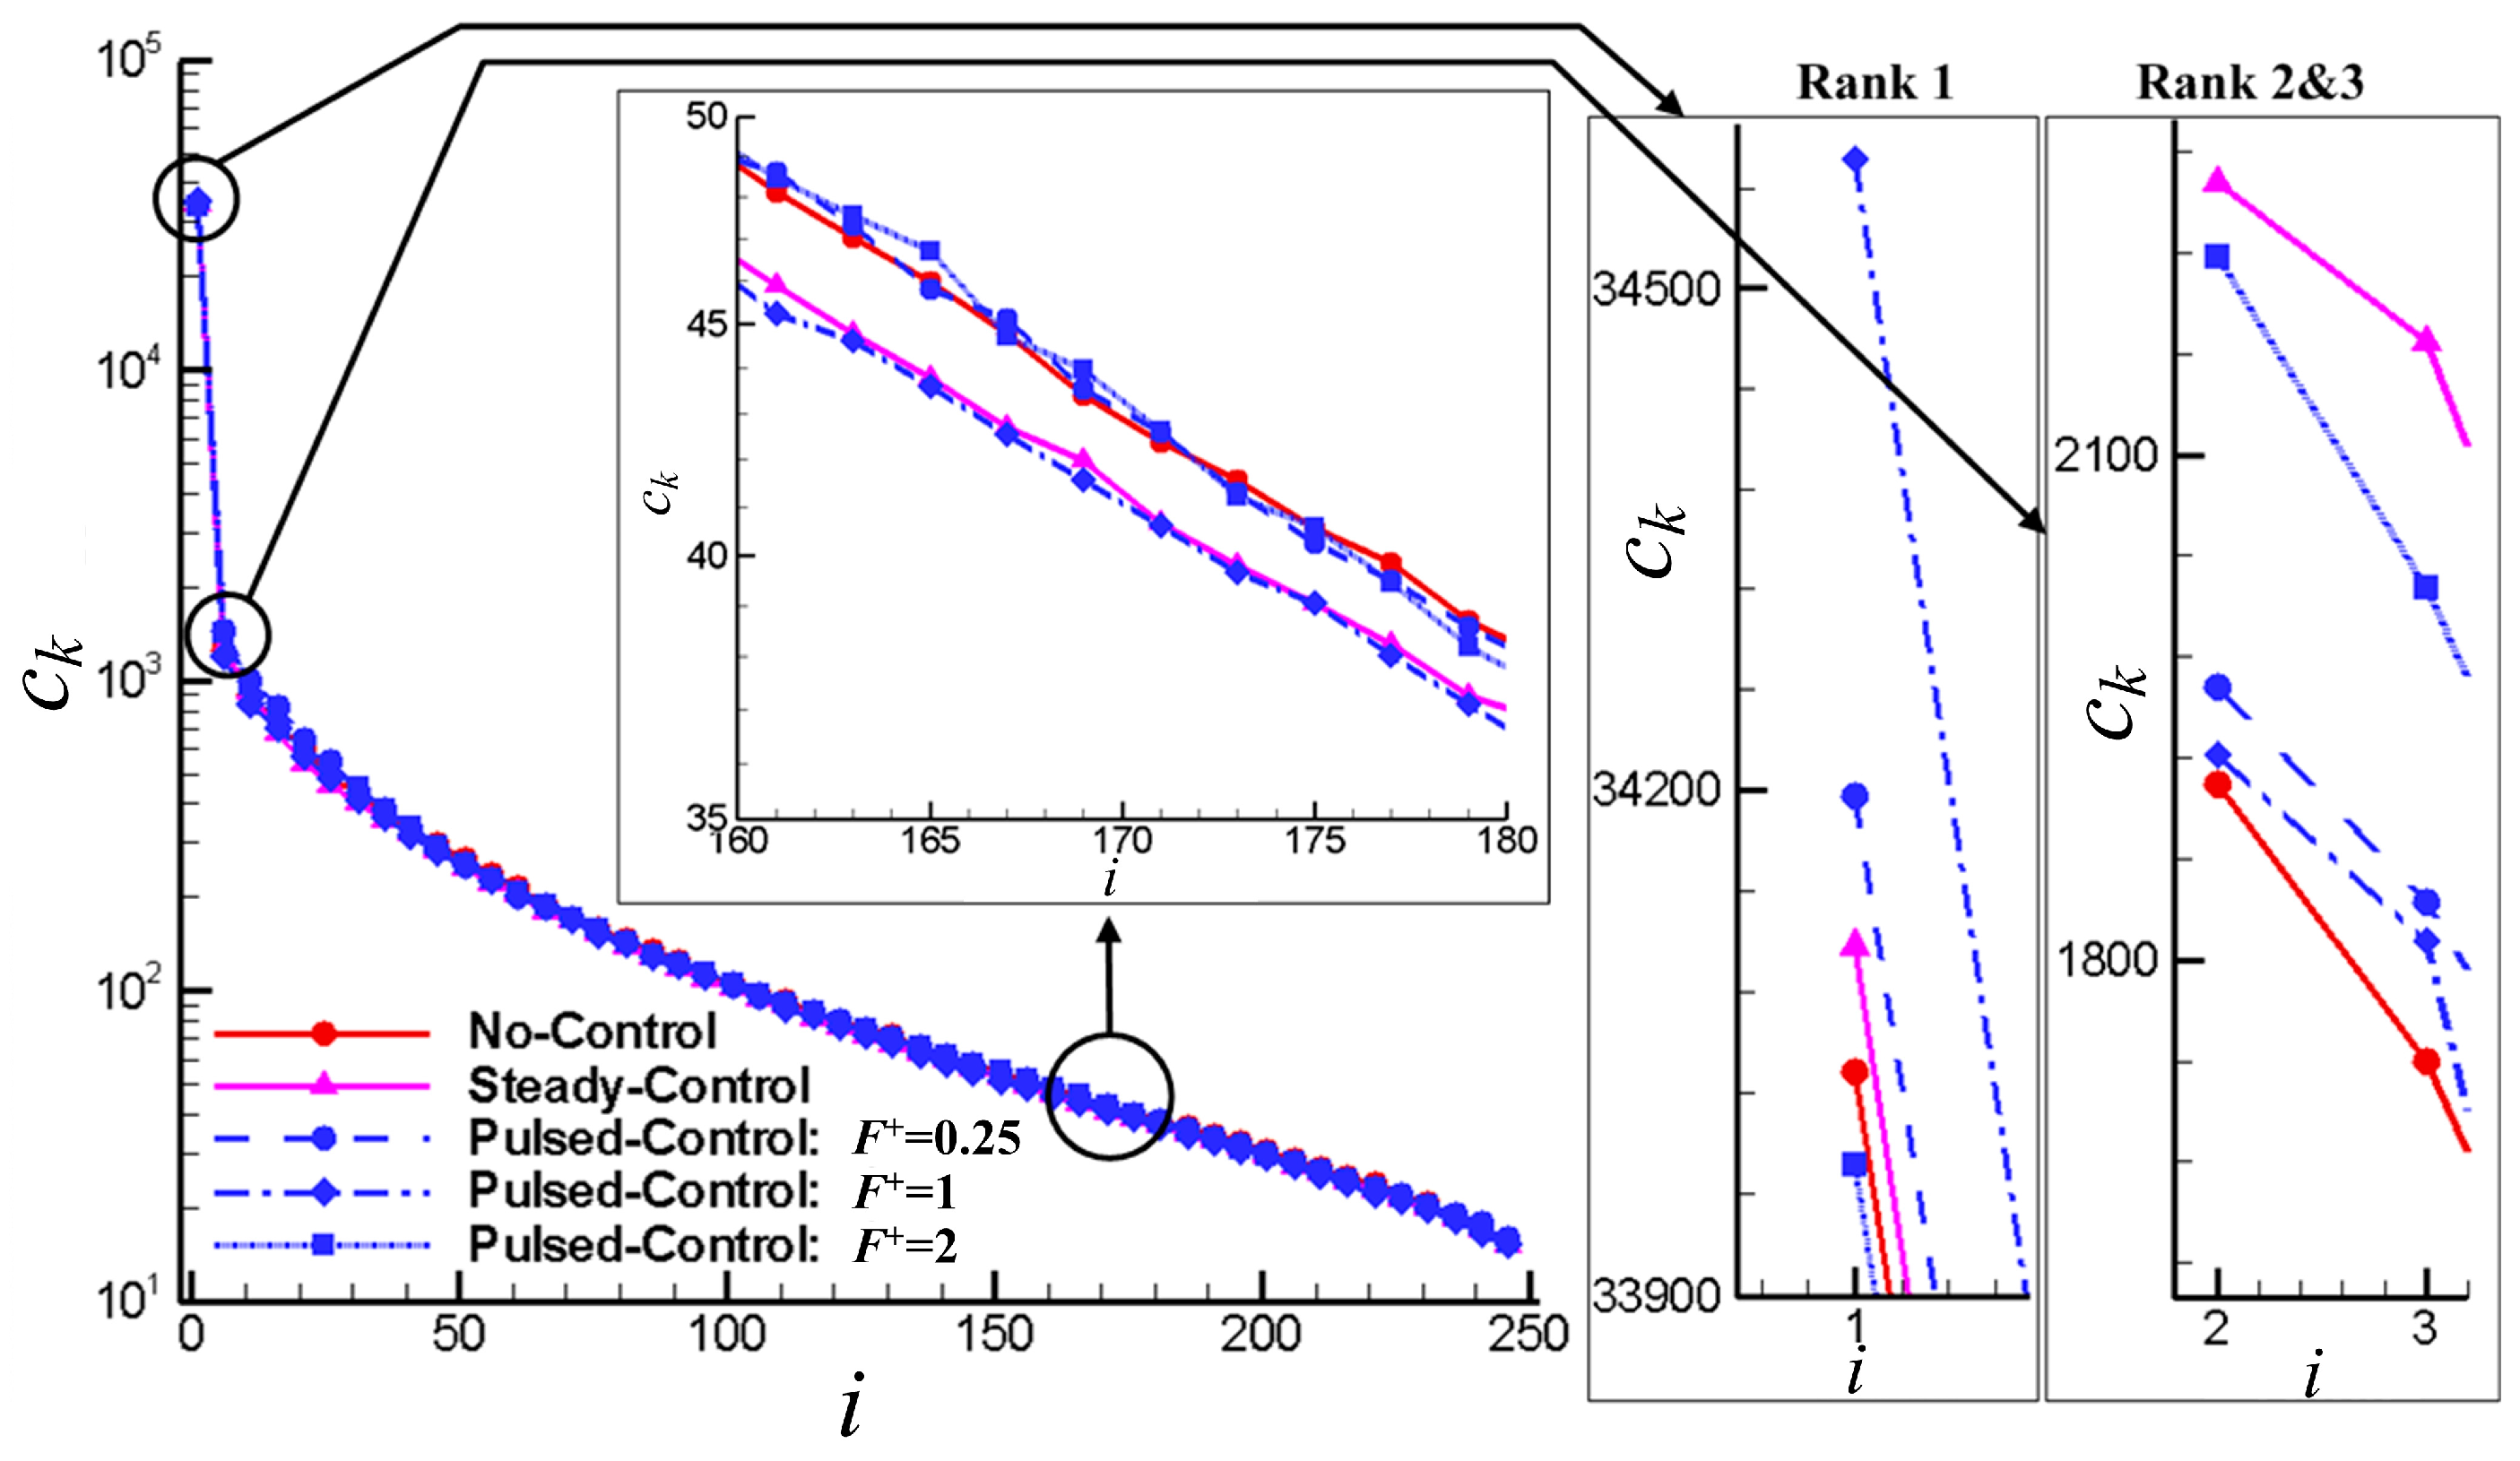
Through the POD method, the main function of the unsteady pulsed jet control is seen to reallocate the kinetic energy of each mode, and enhancing or weakening certain modes. Based on the valid parameters of the pulsed jet, the kinetic energy of the higher modes will be transferred to first mode (time-averaged flow), using second and third modes (separation vortices), making flow field more simple and orderly.
(5)
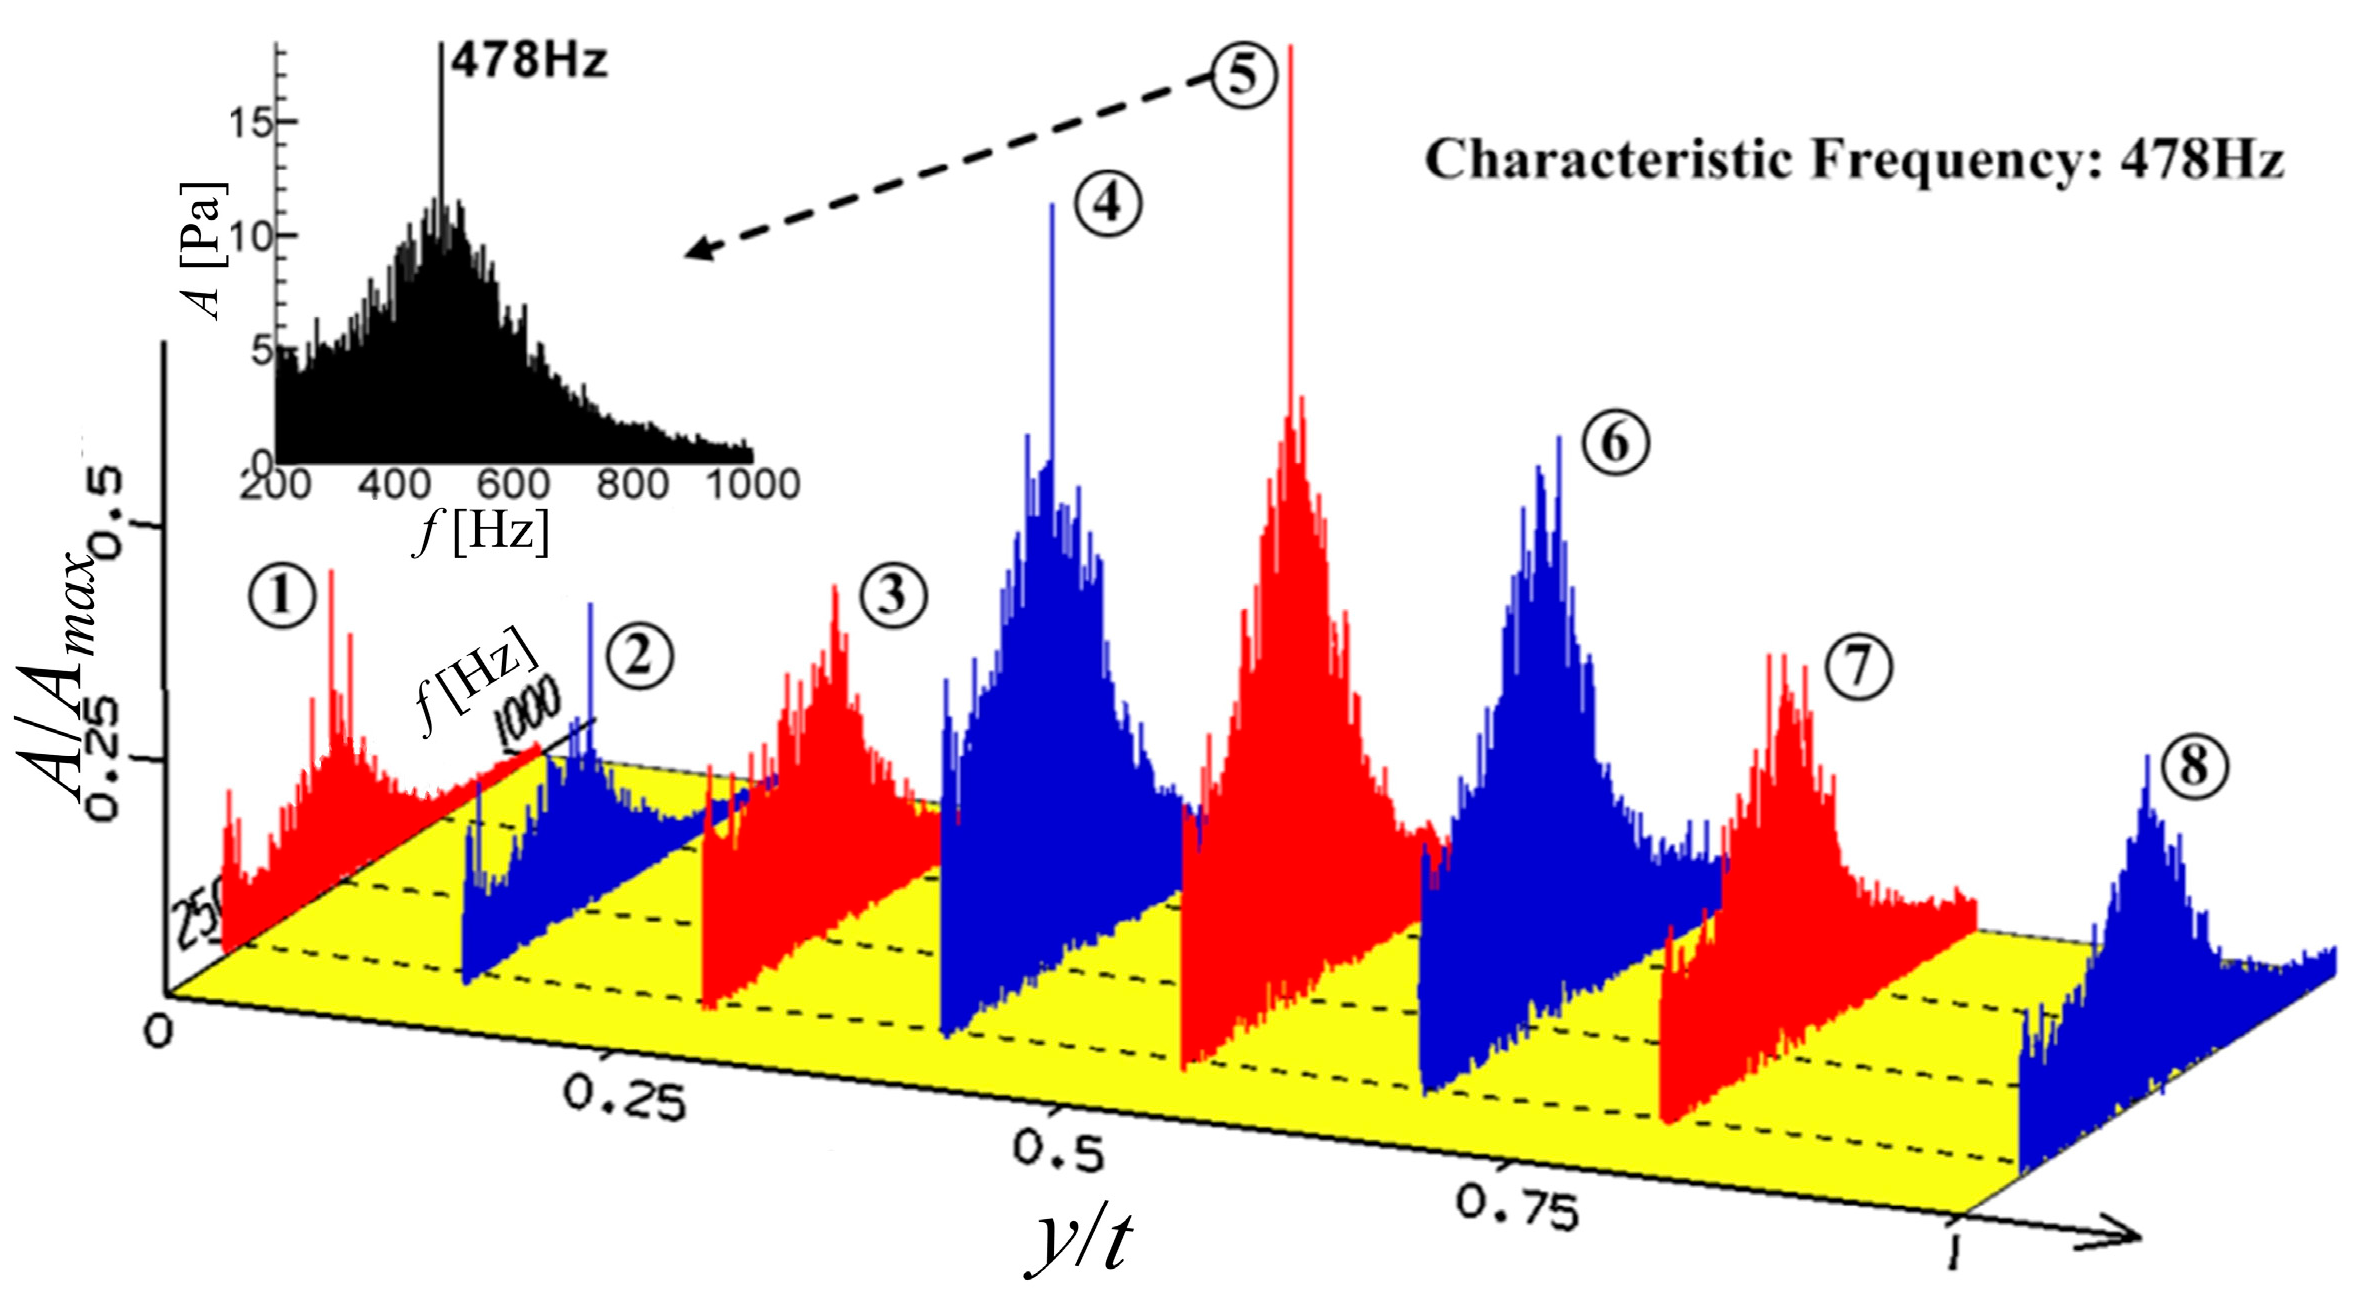
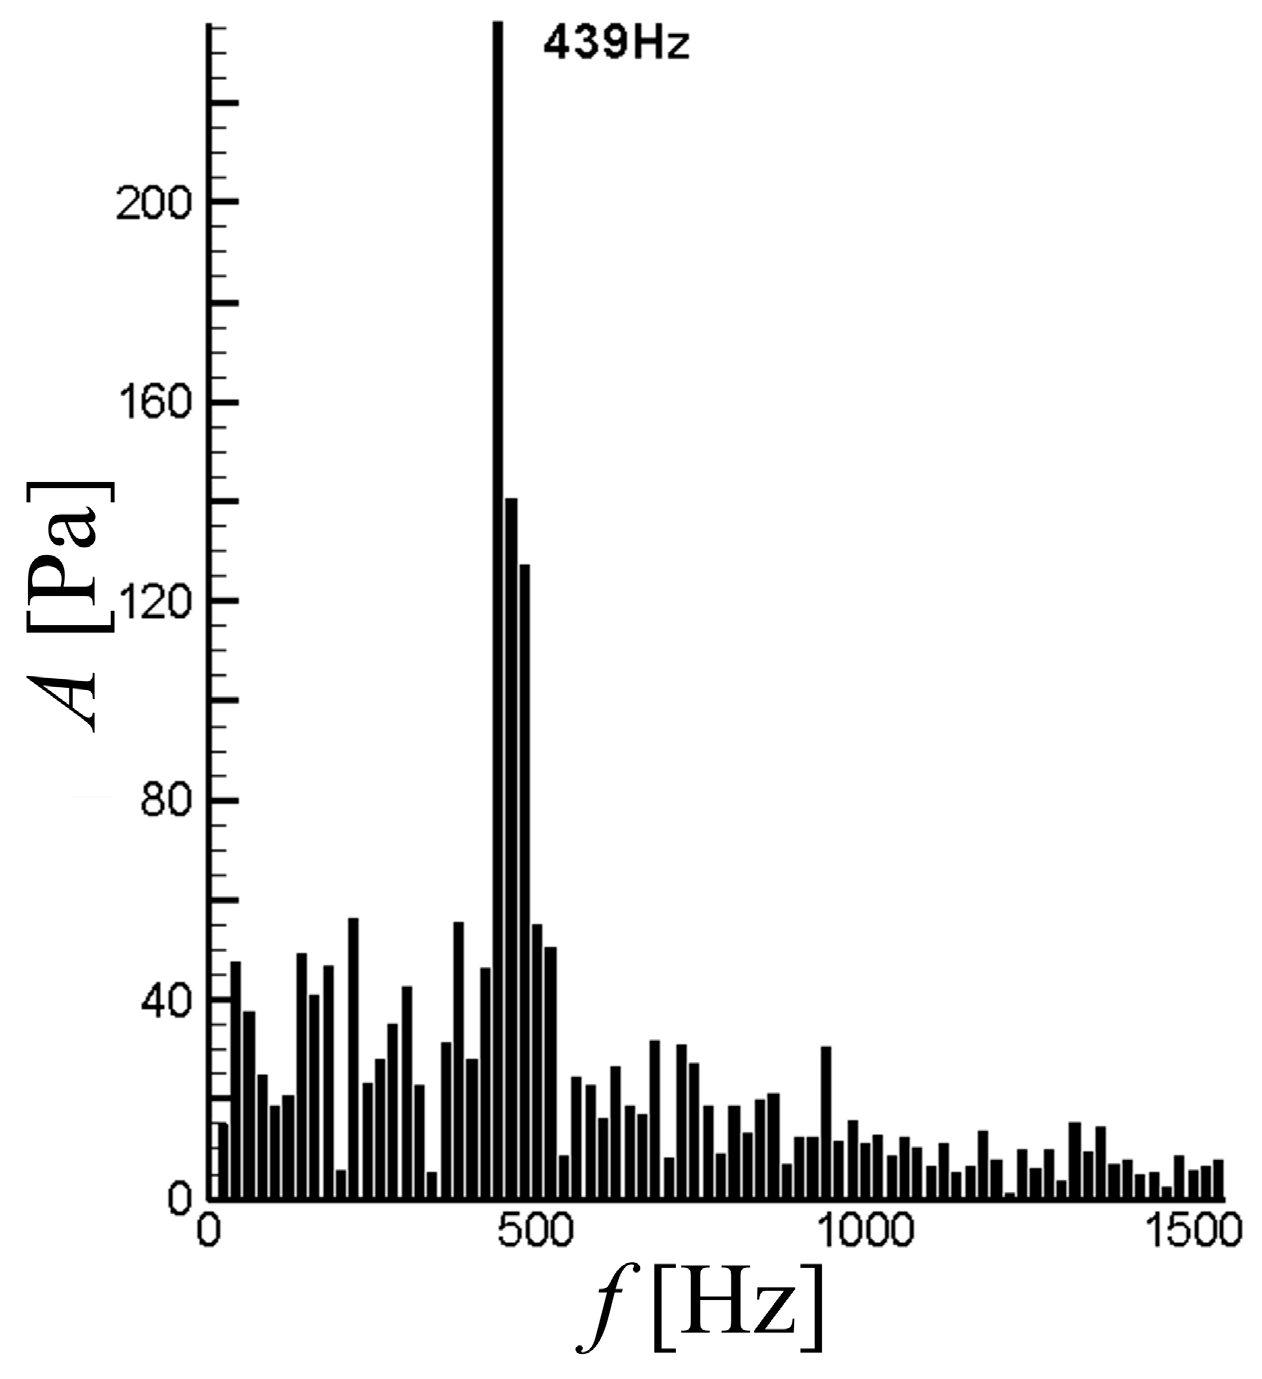
The corresponding experiment results show that when the frequency of the pulsed jet is approximate to that of separation vortex, the loss coefficient of the average total pressure decreases to a minimum (about 5.5% in the experiment). This verifies the numerical simulation and the feasibility of this novel pulsed jet control without external energy injection.

Acknowledgments

This work was supported by the National Basic Research Program of China (No. 2014CB239602) and National Natural Science Foundations of China (No. 51206078 and No. 51176072).

Author Contributions

Guoping Huang proprosed the concept of pulsed jet flow control without external energy; Jie Chen applied this to blade cascades and designed the experiment. Jianfeng Zhu performed the simulations and experiments; Weiyu Lu and Jinchun Wang analyzed the data, including using POD; Weiyu Lu and Jie Chen together wrote the paper.

Conflicts of Interest

The authors declare no conflict of interest.

References

  1. Rivir, R.B.; Bons, J.P.; Lake, J.P. Passive and Active Control of Separation in Gas Turbines; AIAA Paper 2000-2235; AIAA: Reston, VA, USA, 2000. [Google Scholar]
  2. Kerrebrock, J.L.; Reijnen, D.P.; Zimimsky, W.S.; Smilg, L.M. Aspirate Compressor; ASME 97-T-525; ASME: New York, NY, USA, 1997. [Google Scholar]
  3. Kirtley, K.R.; Graziosi, P.P.; Wood, P.P.; Beacher, B.B.; Shin, H.W. Design and Test of an Ultralow Solidity Flow-Controlled Compressor Stator. ASME J. Turbomach. 2004, 127, 689–698. [Google Scholar] [CrossRef]
  4. Greenblatt, D.; Wygnanski, I.J. The Control of Flow Separation by Periodic Excitation. Prog. Aerosp. Sci. 2000, 36, 487–545. [Google Scholar] [CrossRef]
  5. You, D.; Moin, P. Active control of flow separation over an airfoil using synthetic jets. J. Fluids Struct. 2008, 24, 1349–1357. [Google Scholar] [CrossRef]
  6. Collis, S.S.; Joslin, R.D.; Seifert, A.; Theofilis, V. Issues in active flow control: Theory, control, simulation, and experiment. Prog. Aerosp. Sci. 2004, 40, 237–289. [Google Scholar] [CrossRef]
  7. Gmelin, C.; Zander, V.; Hecklau, M.; Thiele, F.; Nitsche, W.; Huppertz, A.; Swoboda, M. Active Flow Control Concepts on a Highly Loaded Subsonic Compressor Cascade Resume of Experimental and Numerical Results; ASME GT2011-46468; ASME: New York, NY, USA, 2011. [Google Scholar]
  8. Zheng, X.Q.; Zhou, X.B.; Zhou, S. Control of Unsteady Separated Flows inside Axial Compressors by Synthetic Jet; AIAA Paper 2005-870; AIAA: Reston, VA, USA, 2005. [Google Scholar]
  9. Matejka, M.; Safarik, P.; Popelka, L.; Nozicka, J. Influence of Active Methods of Flow Control on Compressor Blade Cascade Flow; ASME GT2008-51109; ASME: New York, NY, USA, 2008. [Google Scholar]
  10. Culley, D.E.; Bright, M.M.; Prahst, P.S.; Strazisar, A.J. Active Flow Separation Control of a Stator Vane Using Embedded Injection in a Multistage Compressor Experiment. J. Turbomach. 2004, 126, 24–34. [Google Scholar] [CrossRef]
  11. Hecklau, M.; Wiederhold, O.; Zander, V.; King, R.; Nitsche, W.; Huppertz, A.; Swoboda, M. Active Separation Control with Pulsed Jets in a Critically Loaded Compressor Cascade. AIAA J. 2011, 49, 1729–1739. [Google Scholar] [CrossRef]
  12. Luca, L.D.; Girfoglio, M.; Chiatto, M.; Coppola, G. Scaling properties of resonant cavities driven by piezo-electric actuators. Sens. Actuators A Phys. 2016, 247, 465–474. [Google Scholar] [CrossRef]
  13. Chiatto, M.; Capuano, F.; Coppola, G.; De Luca, L. Lem characterization of synthetic jet actuators driven by piezoelectric element: A review. Sensors 2017, 17, 1216. [Google Scholar] [CrossRef] [PubMed]
  14. Schuler, B.J.; Kerrebrock, J.L.; Merchant, A.A.; Drela, M.; Adamczyk, J. Design, Analysis, Fabrication and Test of an Aspirated Fan Stage. In Proceedings of the ASME Turbo Expo 2000: Power for Land, Sea, and Air, Munich, Germany, 8–11 May 2000. [Google Scholar]
  15. Larosiliere, L.M.; Wood, J.R.; Hathaway, M.D.; Medd, A.J.; Dang, T.Q. Aerodynamic Design Study of Advanced Multistage Axial Compressor; National Aeronautics and Space Administration, Langley Research Center: Hampton, VA, USA, 2002.
  16. Schuler, B.J.; Kerrebrock, J.L.; Merchant, A. Experimental Investigation of a Transonic Aspirated Compressor. J. Turbomach. 2005, 127, 340–348. [Google Scholar] [CrossRef]
  17. Culley, D.E.; Braunscheidel, E.P.; Bright, M.M. Impulsive Injection for Compressor Stator Separation Control; AIAA Paper 2005-3633; AIAA: Reston, VA, USA, 2005. [Google Scholar]
  18. Wygnanski, I. The Variables Affecting the Control of Separation by Periodic Excitation. In Proceedings of the 2rd AIAA Flow Control Conference, Portland, OR, USA, 28 June–1 July 2004. [Google Scholar]
  19. Zheng, X.Q.; Zhou, X.B.; Zhou, S. Investigation on a Type of Flow Control to Weaken Unsteady Separated Flows by Unsteady Excitation in Axial Flow Compressors. J. Turbomach. 2005, 127, 489–496. [Google Scholar] [CrossRef]
  20. Huang, G.P.; Lu, W.Y.; Zhu, J.F.; Fu, X.; Wang, J.C. A nonlinear dynamic model for unsteady separated flow control and its mechanism analysis. J. Fluid Mech. 2017, 826, 942–974. [Google Scholar] [CrossRef]
  21. Rowley, C.W.; Dawson, S.T.M. Model reduction for flow analysis and control. Annu. Rev. Fluid Mech. 2017, 49, 387–417. [Google Scholar] [CrossRef]
  22. Lumley, J.L. The structure of inhomogeneous turbulent flows. In Atmospheric Turbulence and Wave Propagation; Publishing House Nauka: Moscow, Russia, 1967; pp. 166–178. [Google Scholar]
  23. Aubry, N.; Holmes, P.; Lumley, J.L. The dynamic of coherent structures in the wall region of a turbulent boundary layer. J. Fluid Mech. 1988, 192, 115–173. [Google Scholar] [CrossRef]
  24. Ma, X.; Karniadakis, G. A low-dimensional model for simulating three-dimensional cylinder flow. J. Fluid Mech. 2002, 458, 181–190. [Google Scholar] [CrossRef]
  25. Cizmas, P.; Palacios, A. Proper orthogonal decomposition of turbine rotor–stator interaction. J. Propuls. Power 2003, 19, 268–281. [Google Scholar] [CrossRef]
  26. Fan, C.L.; Li, X.W. Proper orthogonal decomposition method for flow analysis of multi-element airfoil. J. Shanghai Univ. 2012, 18, 76–82. [Google Scholar]
  27. Feng, L.H.; Wang, J.J.; Pan, C. Proper orthogonal decomposition analysis of vortex dynamics of a circular cylinder under synthetic jet control. Phys. Fluids 2011, 23, 014106. [Google Scholar] [CrossRef]
  28. Chatterjee, A. An introduction to the proper orthogonal decomposition. Curr. Sci. Comput. Sci. 2000, 78, 809–817. [Google Scholar]
Figure 1. Schematic diagram of typical unsteady flow control schemes (a. synthetic jet; b. unsteady aspiration; c. pulsed jet; and, d. the combination of unsteady aspiration and pulsed jet).
Energies 10 02004 g001
Figure 2. Schematic diagram of micro pulsed jet concept.
Energies 10 02004 g002
Figure 3. Schematic diagram of electromagnetic pulsed jet.
Energies 10 02004 g003
Figure 4. Measurement system of pulsed jet.
Energies 10 02004 g004
Figure 5. Three-dimensional (3D) grid and computation information of the cascade.
Energies 10 02004 g005
Figure 6. Steady and transient flow structures in the cascade.
Energies 10 02004 g006
Figure 7. Frequency spectrum of static pressure by Fast Fourier Transform (FFT) analysis.
Energies 10 02004 g007
Figure 8. The proper orthogonal decomposition (POD) analytic region of the cascade.
Energies 10 02004 g008
Figure 9. First mode of flow field by POD method.
Energies 10 02004 g009
Figure 10. Second and third modes of flow field by POD method.
Energies 10 02004 g010
Figure 11. 25th and 100th modes of flow field by POD method.
Energies 10 02004 g011
Figure 12. Energy ratio spectrum (energy ratio vs. rank).
Energies 10 02004 g012
Figure 13. Accumulative energy ratio spectrum (accumulative energy ratio vs. rank).
Energies 10 02004 g013
Figure 14. Time-evolution of several typical modal coefficients (modal coefficients vs. normalized time, tshed is the period of the separation vortices without control).
Energies 10 02004 g014
Figure 15. Relative loss coefficient vs. reduced jet frequency (numerical and experimental results).
Energies 10 02004 g015
Figure 16. Energy ratio spectra without flow control, with steady and different frequency pulsed jet controls.
Energies 10 02004 g016
Figure 17. Evolution of the second modal coefficient with different pulsed jet frequencies.
Energies 10 02004 g017
Figure 18. Schematic diagram of the test system.
Energies 10 02004 g018
Figure 19. Schematic diagram of locations of measuring points in the cascade.
Energies 10 02004 g019
Figure 20. Experimental system and blades with slots.
Energies 10 02004 g020
Figure 21. Static pressure distribution on the cascade blade surface.
Energies 10 02004 g021
Figure 22. Total pressure of the sensors in the cascade.
Energies 10 02004 g022
Figure 23. Standard deviation of pressure of the sensors in the cascade.
Energies 10 02004 g023
Figure 24. Frequency spectrum distribution in width direction.
Energies 10 02004 g024
Figure 25. Total pressure loss coefficient distribution at the outlet of the cascade (experimental results).
Energies 10 02004 g025
Table 1. Main parameters of the adopted cascasde.
Chord Length c/mmHeight/mmSolidity
60801.333
inlet blade angle/°outlet blade angle/°angle of attack/°
46−10+9
inlet mach numberinlet Reynolds number-
0.11.36 × 105-
positon of jet x/cwidth of jet/mmangle of jet/°
69%0.220

