Energy Poverty in China: A Dynamic Analysis Based on a Hybrid Panel Data Decision Model


Abstract
1. Introduction
- (1)
- How does the framework of energy poverty assessment evolve with assessment at regional level?
- (2)
- What are regional differences of energy poverty in China, and what are the trends for energy poverty situation in different areas?
- (3)
- What are the influencing factors for energy poverty alleviation? Or what is the solution for energy poverty alleviation in China?
2. Methodologies
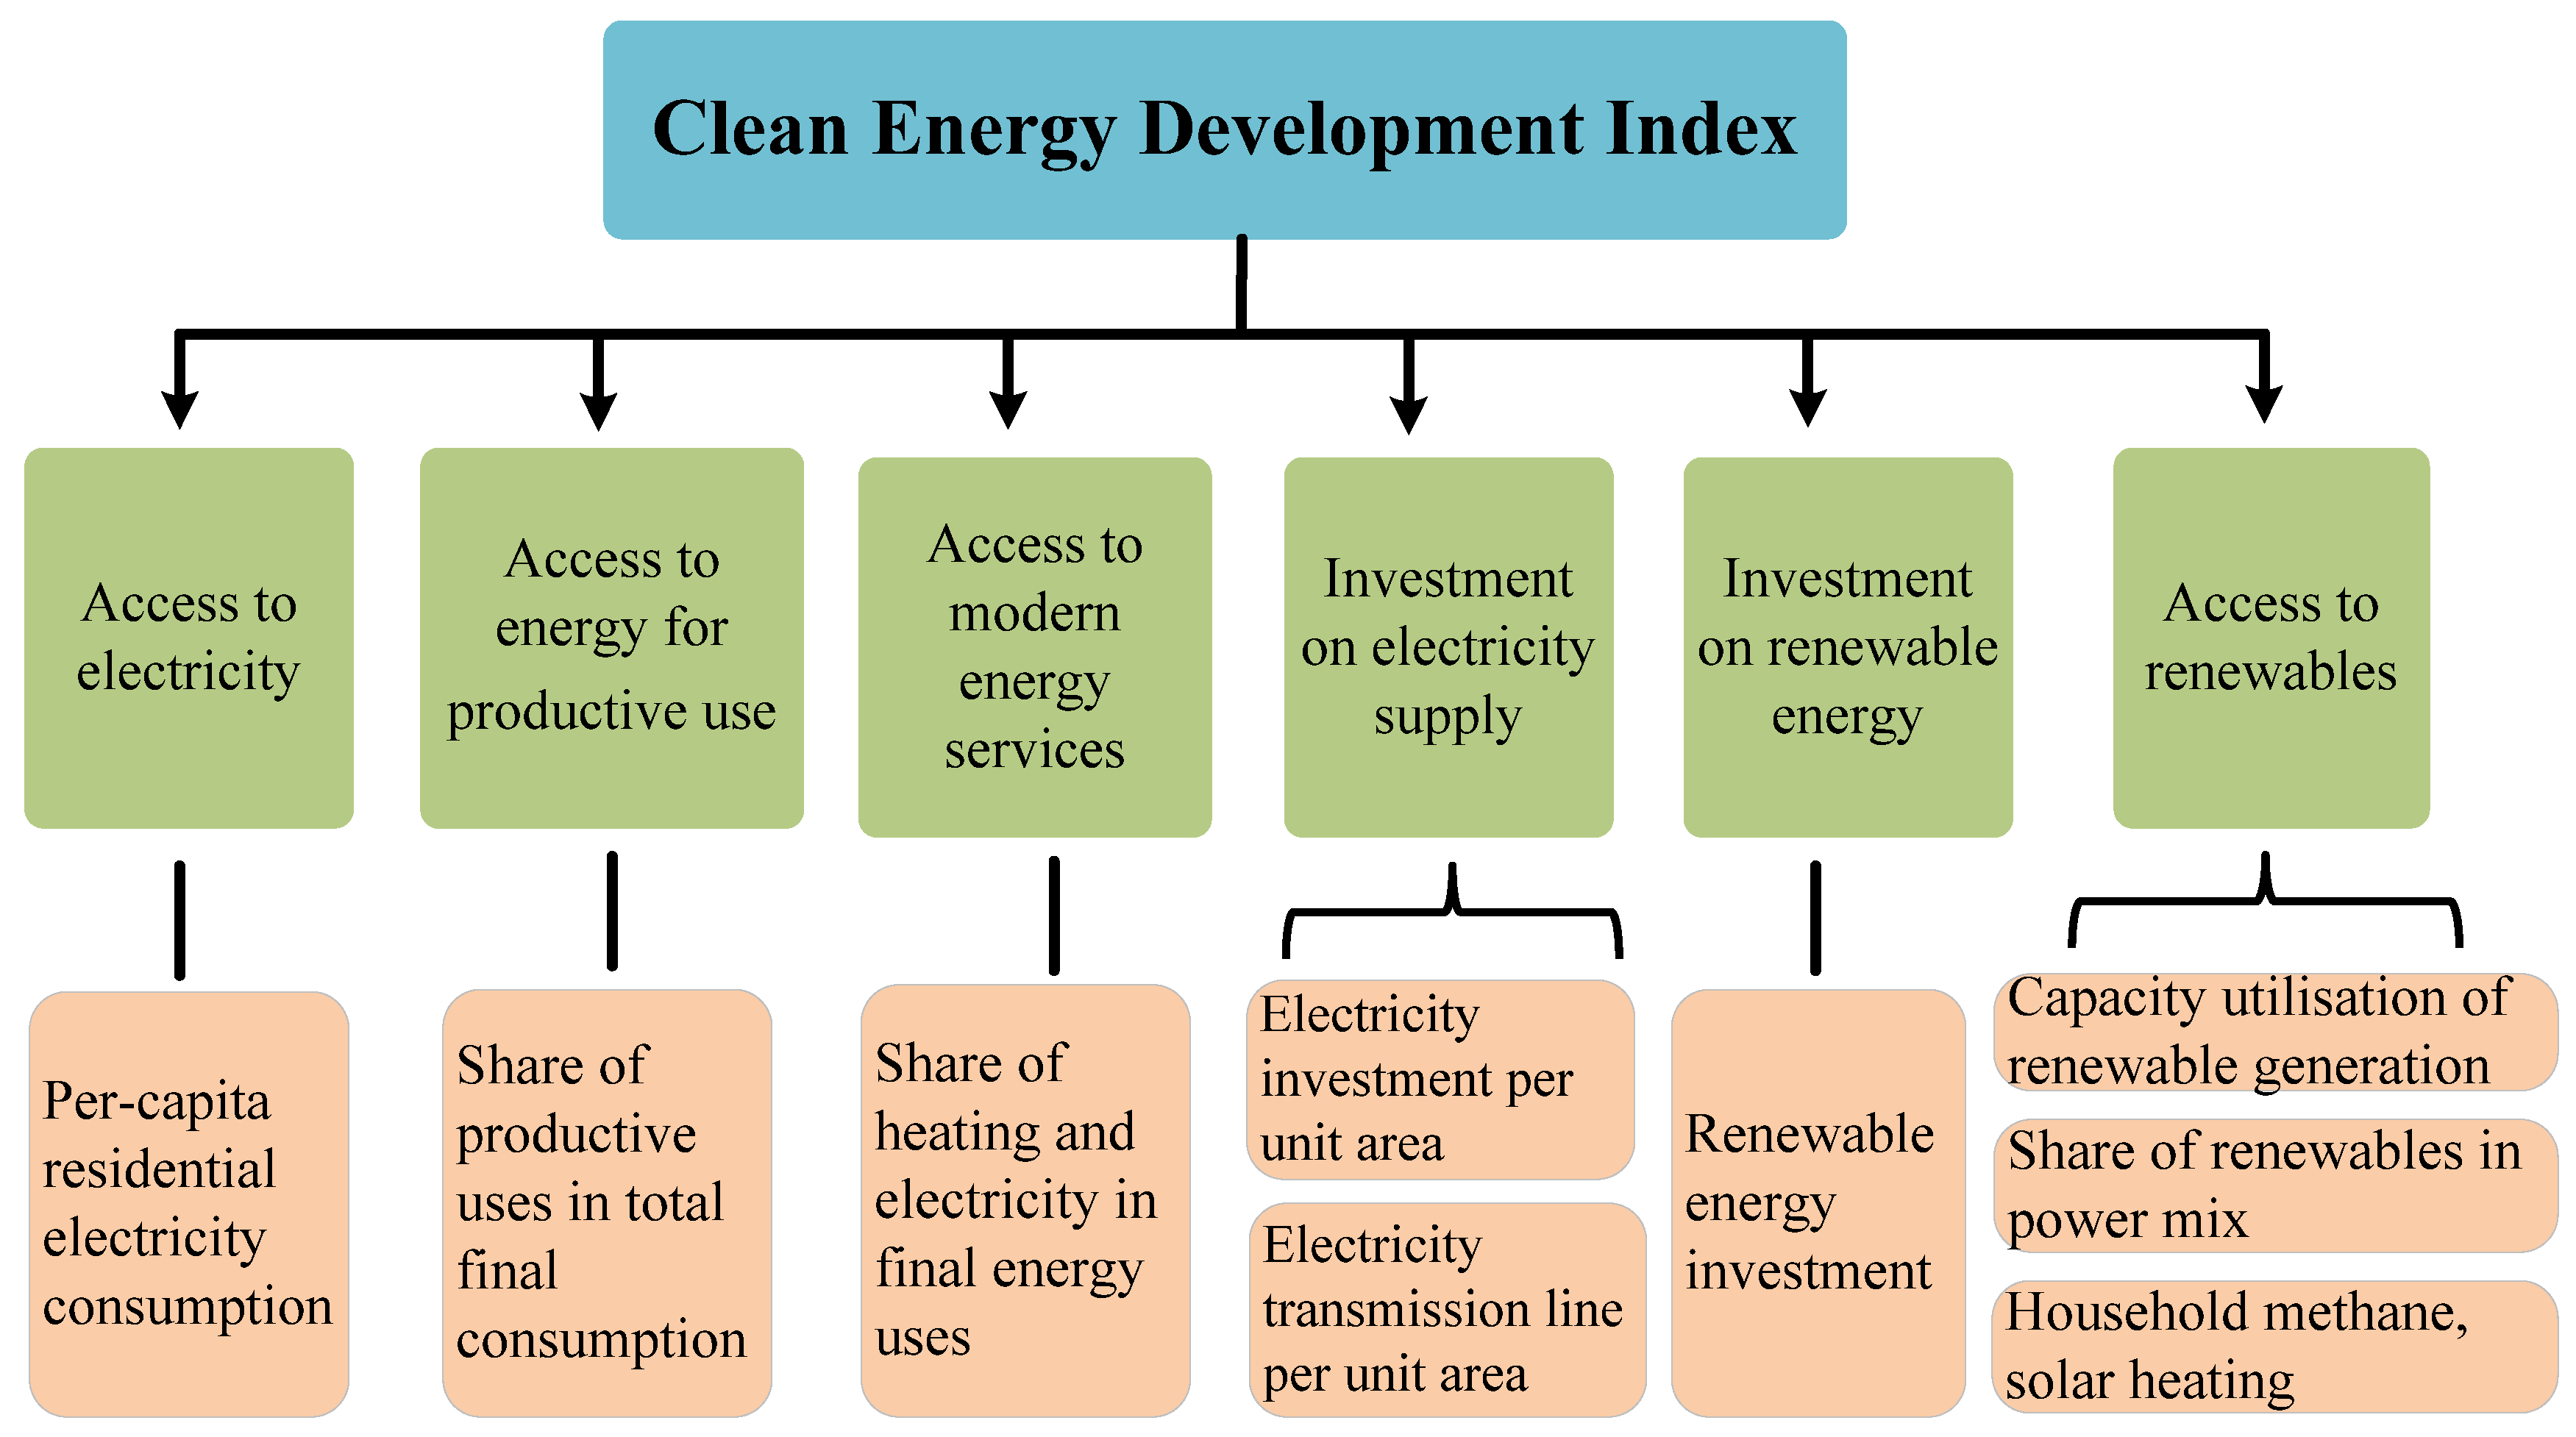
2.1. Conceptual Framework for Regional Clean Energy Development Analysis
2.2. Grey Incidence Decision Analysis for Regional Energy Poverty Assessment
- (1)
- Supposing that data series for each province are collected, is the initial data series of province , and (Equation (1)) are the initial annihilation image of , between which is the initial annihilation operator (Equation (2)). Thus, the concept could be obtained for step 2.
- (2)
- Provided that the data series of two provinces are displayed as , , they have the initial annihilation image of and , namely and , respectively.
2.3. Panel Data Model for Influence Factors of Energy Poverty
2.4. Data Resources
3. Results Analysis and Discussion
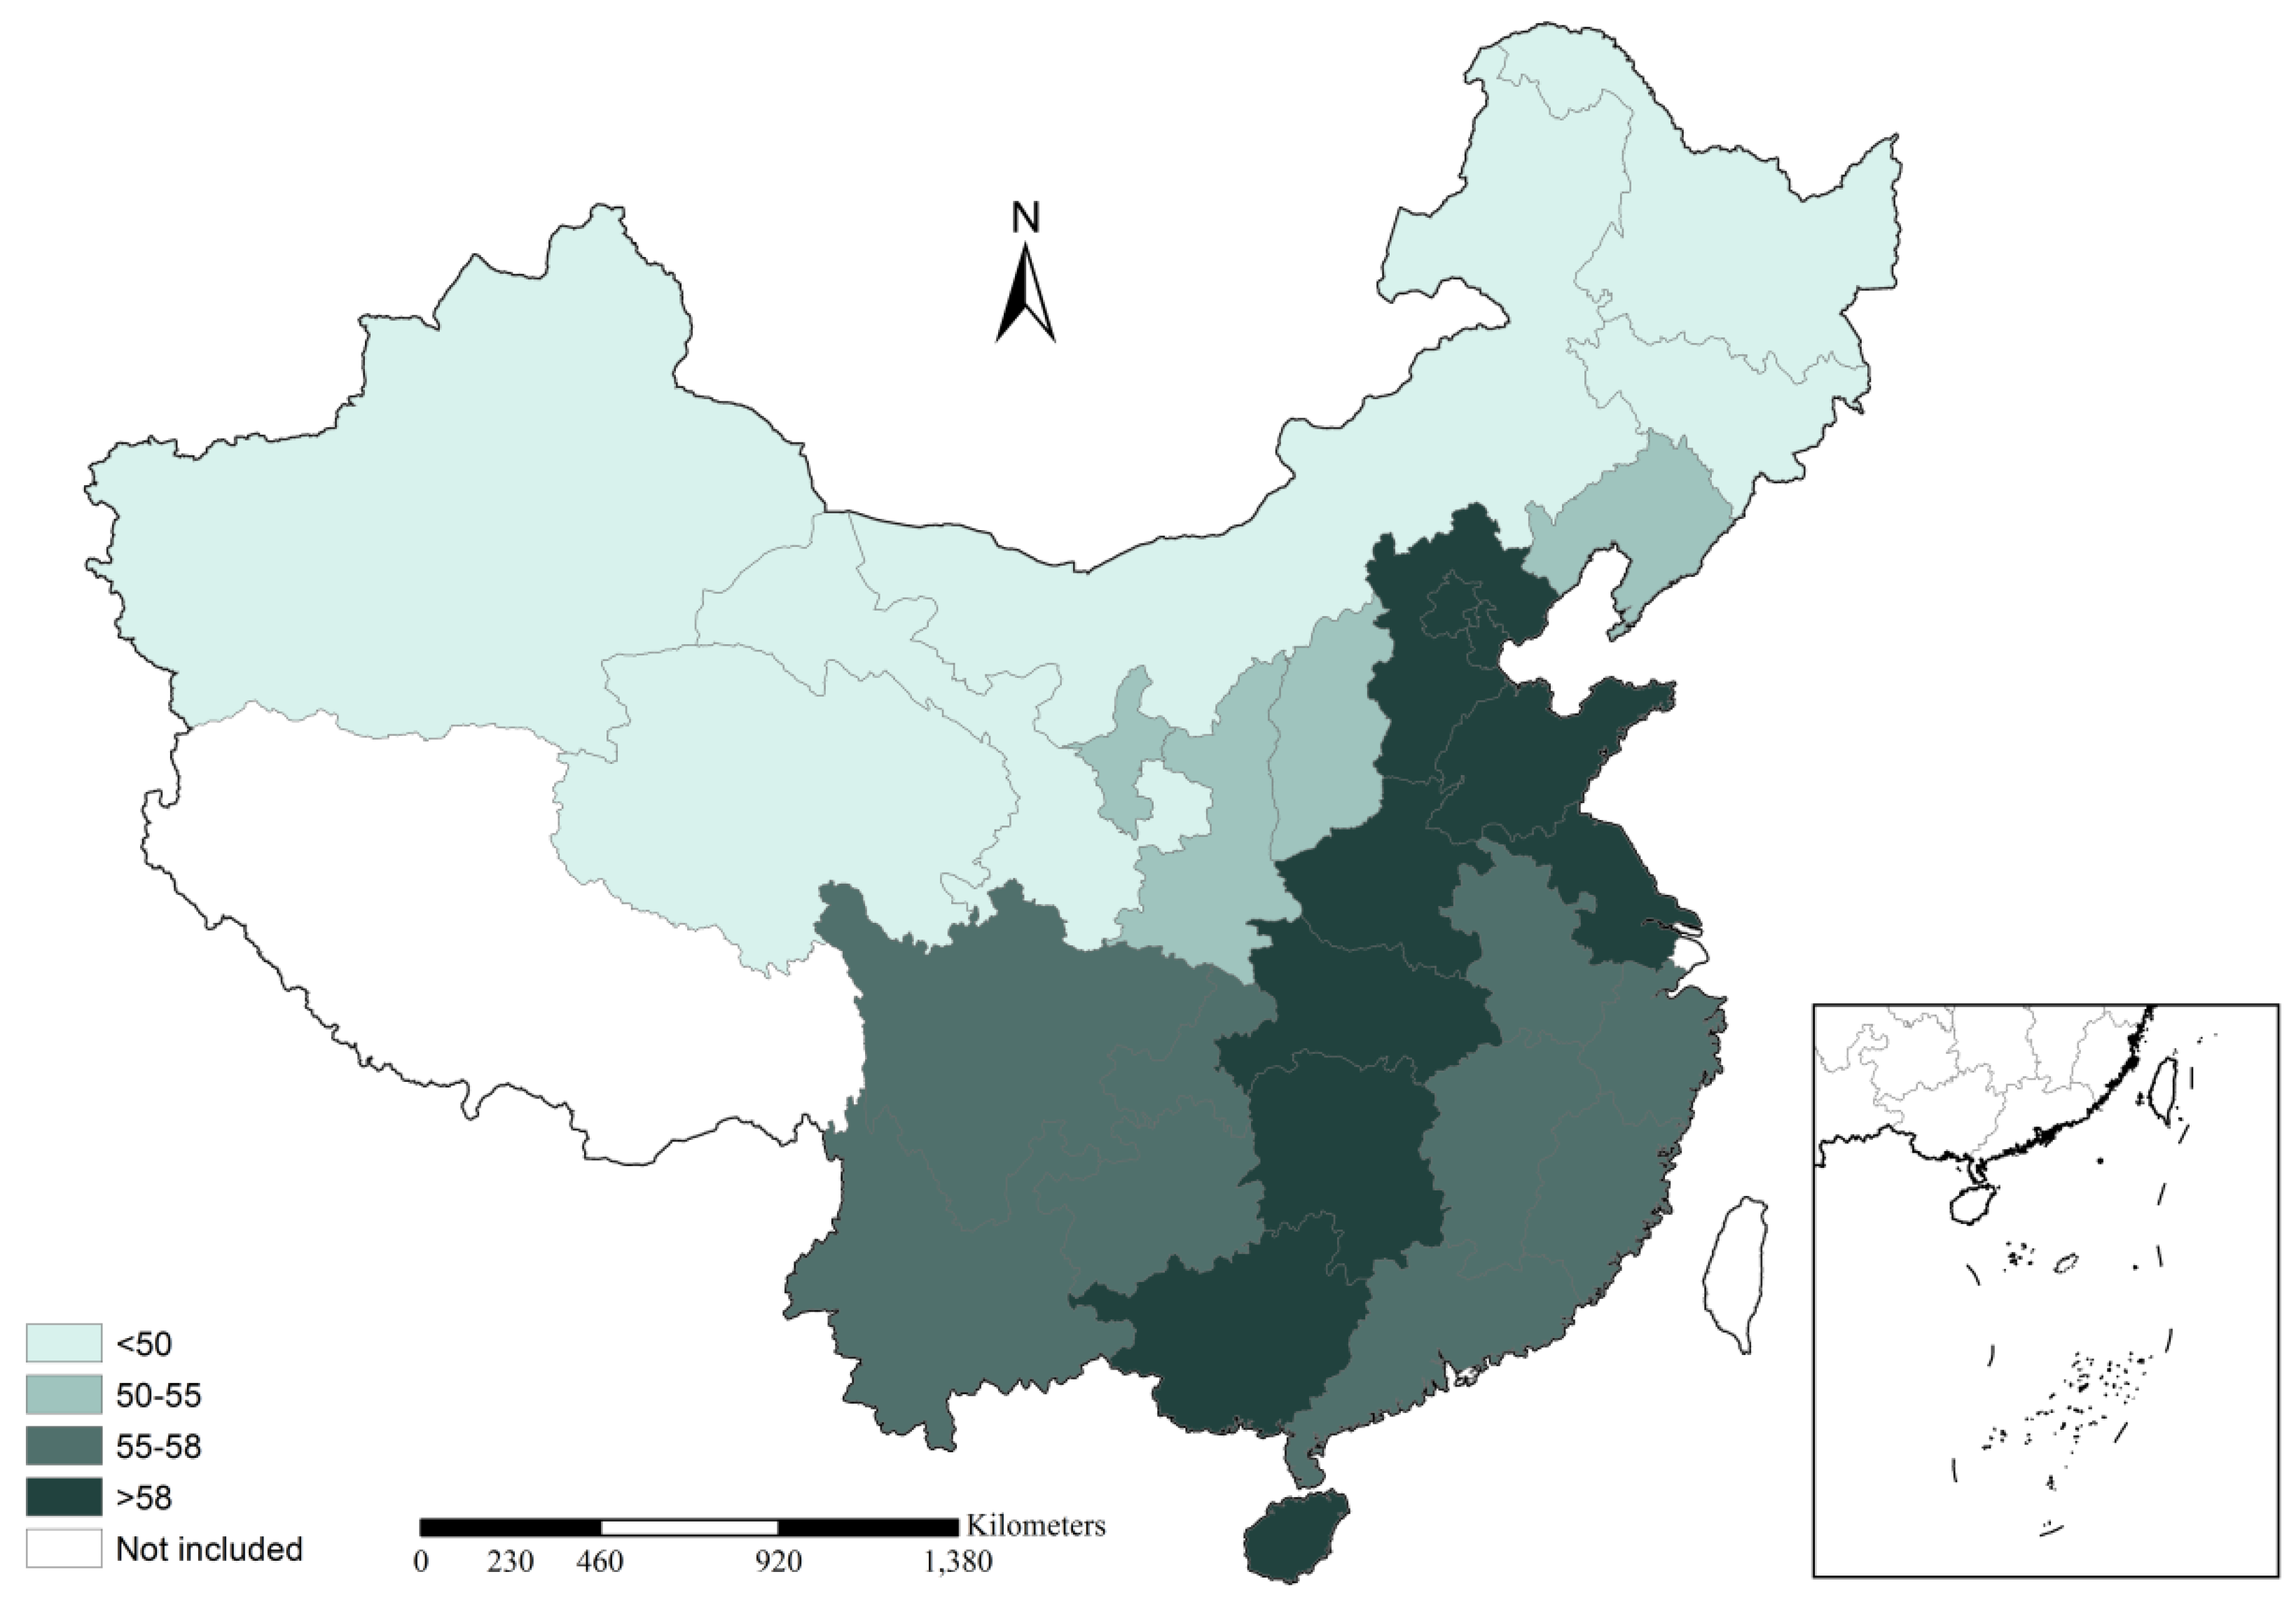
3.1. Regional Differences of Energy Poverty in China
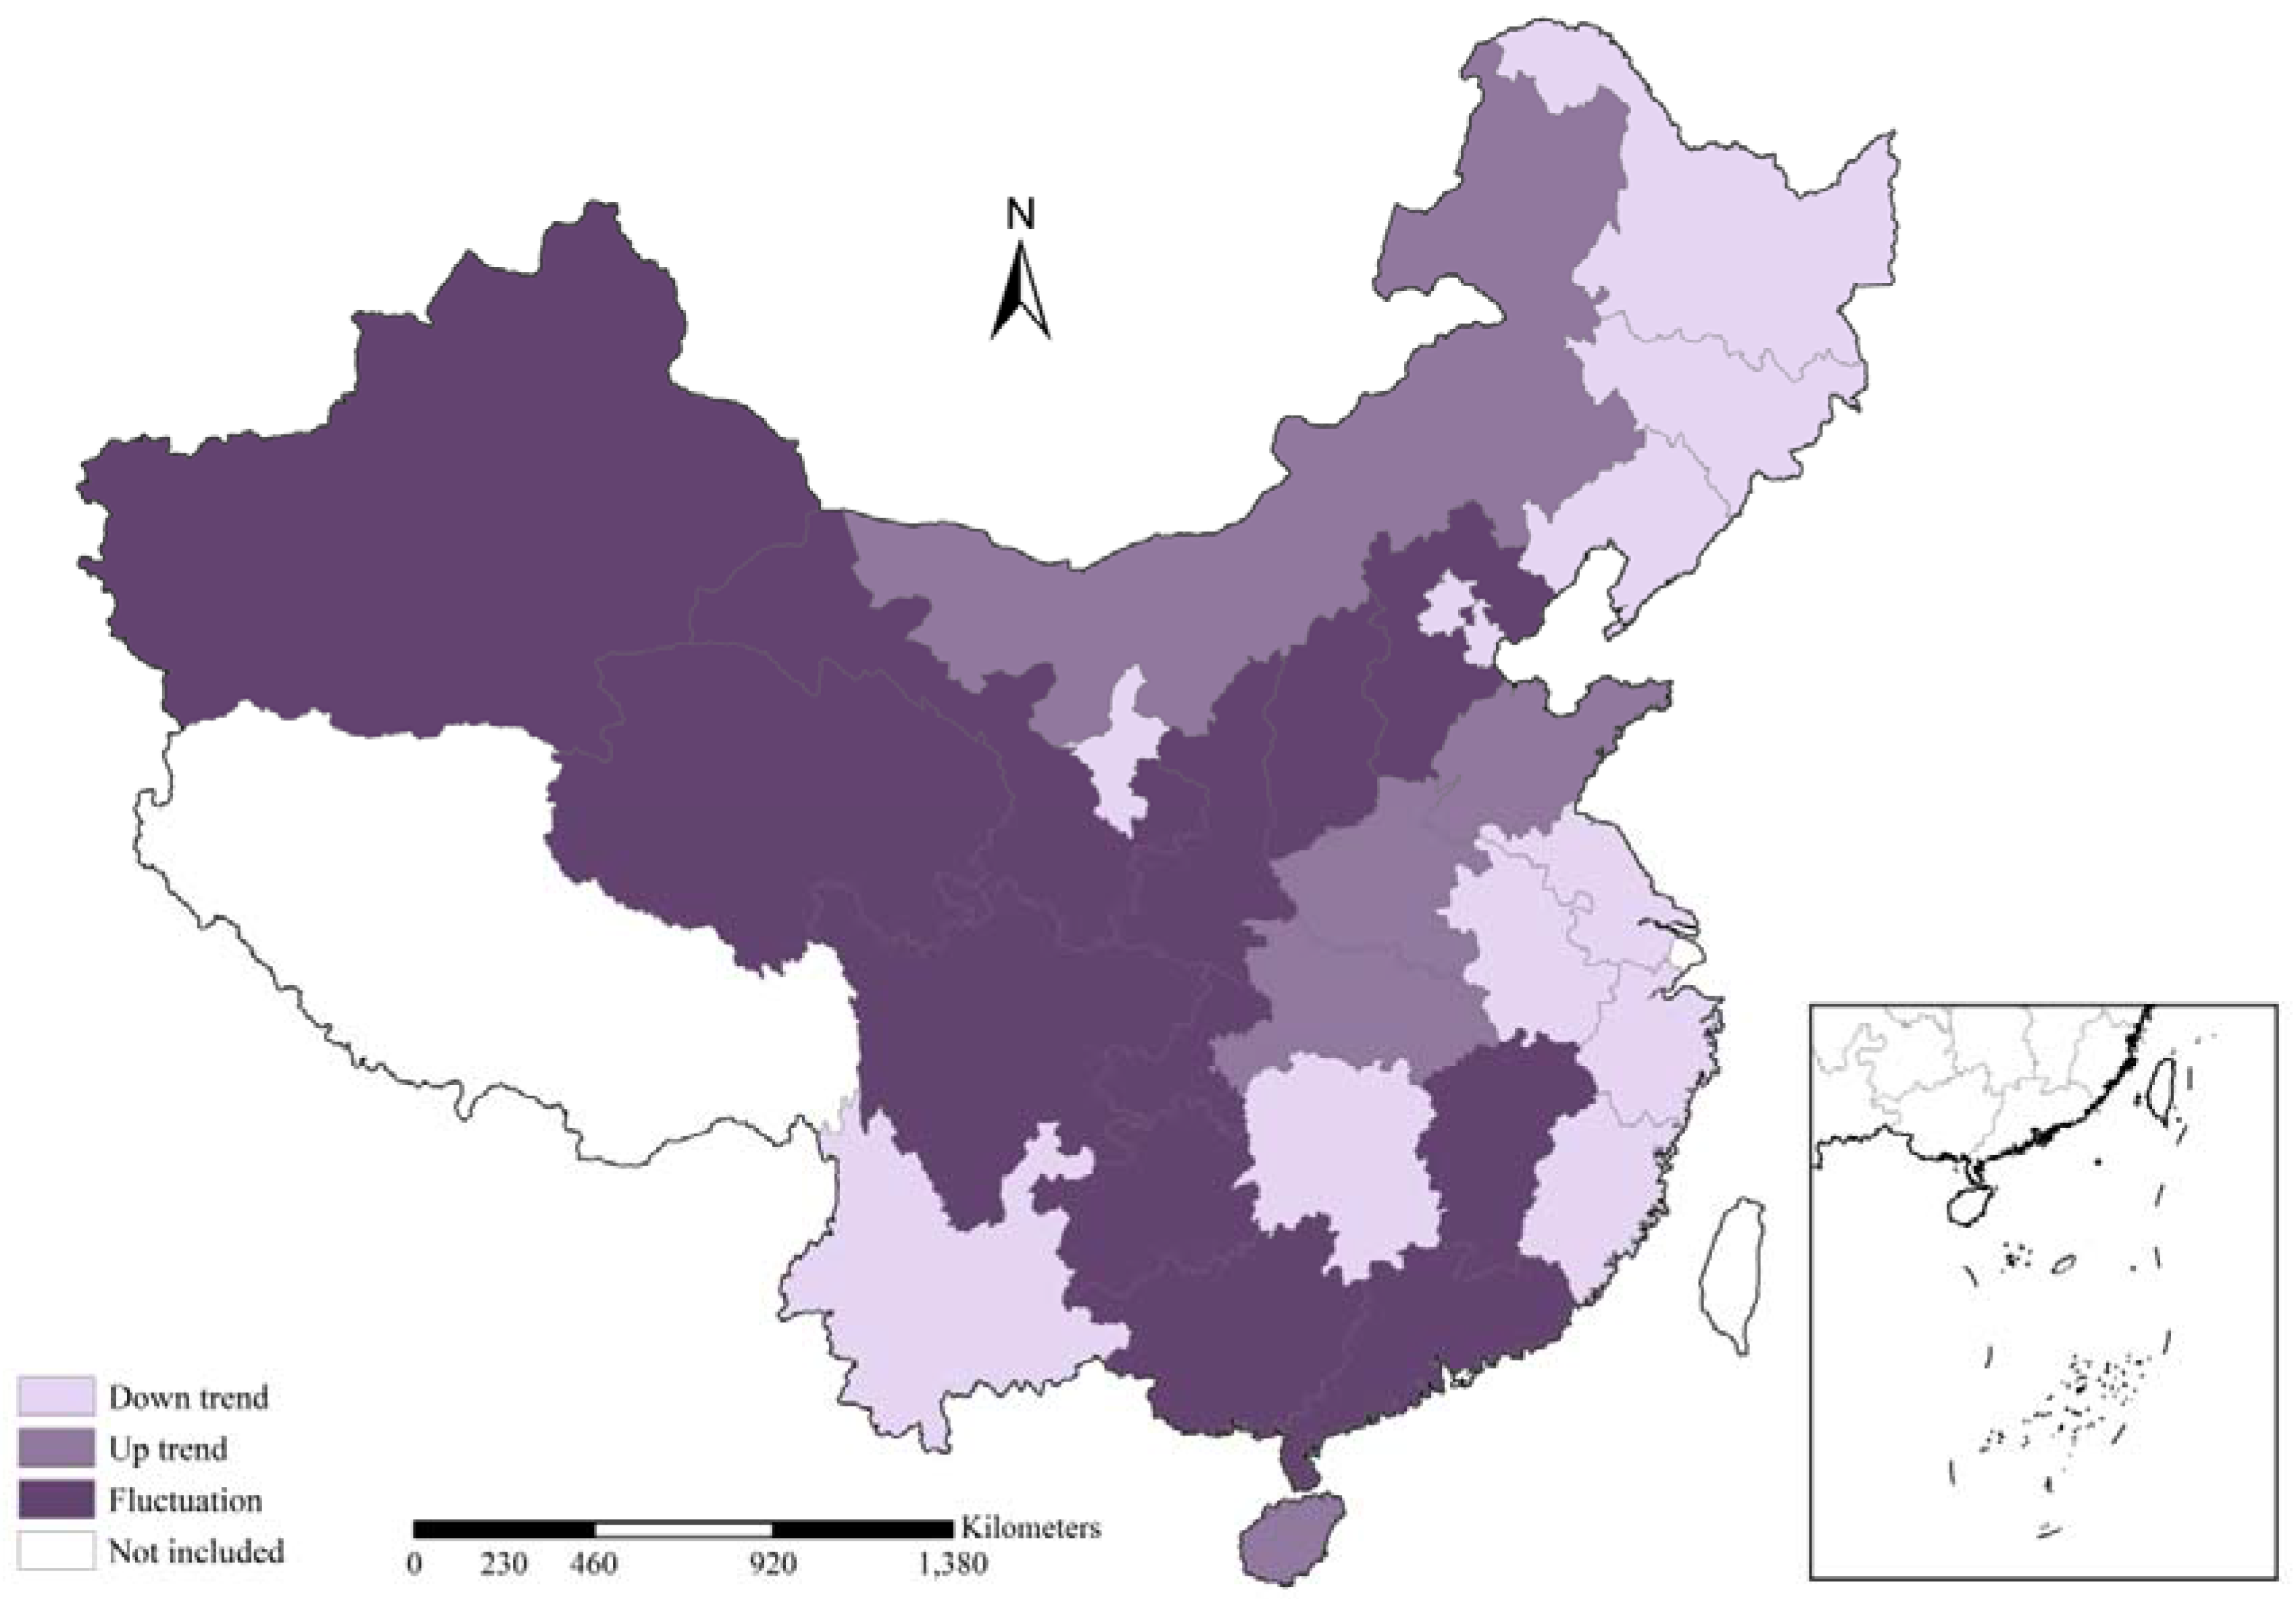
3.2. Trends of Energy Poverty Situation in China
3.3. Influencing Factors for Energy Poverty Alleviation
4. Conclusions and Policy Implications
4.1. Conclusions
- (1)
- Economic development benefits energy infrastructure construction and promotes energy development. To some extent, economic factors determine the investment for energy development, making progress in the construction of power grids and providing financial support for the popularity of energy services. Tianjin city is a typical case. Its renewable energy endowment is limited, but economic supports for energy development contribute to its high clean energy development index because of its regulations on energy conservation in buildings and the high popularity of modern energy services [41]. Furthermore, these results for regional energy poverty assessment in Figure 2 verify the significant role of economic development in energy poverty alleviation. The Central and Southeast part of China have a higher average score than other parts of China. Panel data analysis also points out the positive role of affordability in energy poverty alleviation.
- (2)
- Renewable energy endowments conditionally boost the role of renewable energy in addressing energy poverty. Since the endowment of renewable energy creates the preconditions for regional clean energy production, it reflects the potential for clean energy production in regional energy development. Even though resource endowments determine its available space and the resource foundation, the use of renewable energy also needs the support of economic investment and policy orientation. The Southwest China is a typical case, whose hydropower ranks among the highest in China. Renewable energy utilization can provide electricity services for regional clean energy access in these regions. While there is a huge wind energy base in the “Three North” region (northeast, north, and northwest), wind energy does not take its role in the popularity of modern energy services and energy poverty mitigation. As for the hydropower generation in Southwest China, its negative environmental and social consequences should be simultaneously considered in its deployment.
- (3)
- The framework for regional energy poverty assessment is adequate for clean energy development. Renewable energy development is of great significance in solving the problem of energy poverty, which should be considered in energy poverty studies. On the one hand, the large-scale use of renewables can effectively solve the problem of insufficient energy supply and provide cleaner energy. On the other hand, small-scale distributed renewable energy systems can help to meet electricity needs in rural and remote areas, which suffer the shortfall of power grid construction and inefficient power supply. Thus, the development of renewable energy is closely related to energy poverty mitigation. Due to data availability at the global level, the research framework of EDI of IEA is universal and suitable for comparative studies worldwide. While China’s electricity access rate is close to 100%, the quality of electricity service needs to be further considered. It has become another key point in energy poverty issues, apart from traditional biomass use. Therefore, the framework in this study reflects the characteristics of “adaptation to local condition” in energy poverty assessment by improving the EDI of IEA, which is more sustainable to the evaluation of energy development in China.
4.2. Policy Implications
- (1)
- Energy development in rural areas should be facilitated in national energy policy. Even though urbanization has a positive effect on energy poverty alleviation, enhancing the urbanization rate in a short term will be very difficult. In addition, the urbanization process emerges numerous urban problems, such as heavy traffic, air pollution, and the large proportion of migrant workers in urban areas. Thus, one available choice is to promote the energy infrastructure in rural areas and to advocate the use of clean cooking facilities with higher energy efficiency. The building of Smart Grid will be another wise choice for the access to modern energy services in rural areas, which helps to reduce the inefficiency of electricity supply by traditional power networks.
- (2)
- The energy development plan should pay attention to the energy poverty issues in the Northeast and Northwest part of China duo to their poor situation regarding clean energy development. Southwest part of China experienced a down trend in energy poverty scores. The role of wind power in Northwest and Inner Mongolia should be boosted to address the clean energy development in these regions. The clean production of traditional biomass and the improvement of household living standard could be wise alternatives for energy development in Southwest China. Energy poverty alleviation is a balanced mix of economic development and policy support.
Acknowledgments
Author Contributions
Conflicts of Interest
References
- International Energy Agency (IEA). World Energy Outlook 2012; IEA: Paris, France, 2012. [Google Scholar]
- United Nations (UN). Transforming Our World: The 2030 Agenda for Sustainable Development; UN Secretary General: New York, NY, USA, 2015. [Google Scholar]
- International Energy Agency (IEA). World Energy Outlook 2004; IEA: Paris, France, 2004. [Google Scholar]
- Wei, Y.M.; Liao, H.; Wang, K.; Liang, Q.M. China Energy Report (2014): Energy Poverty Research; Science Press: Beijing, China, 2014. (In Chinese) [Google Scholar]
- State Council of China. No. 1 Central Document on Deepening Supply-Side Structural Reform in Agriculture to Cultivate New Development Engines. Available online: http://www.gov.cn/zhengce/2017–02/05/content_5165626.htm (accessed on 16 September 2017).
- National Energy Administration. Announcement on the Photovoltaic Development Plan for Poverty Alleviation Program. Available online: http://zfxxgk.nea.gov.cn/auto87/201708/t20170808_2839.htm (accessed on 16 September 2017).
- Parajuli, R. Access to energy in Mid/Far west region-Nepal from the perspective of energy poverty. Renew. Energy 2011, 36, 2299–2304. [Google Scholar] [CrossRef]
- Nussbaumer, P.; Bazilian, M.; Modi, V. Measuring energy poverty: Focusing on what matters. Renew. Sustain. Energy Rev. 2012, 16, 231–243. [Google Scholar] [CrossRef]
- Barnes, D.F.; Khandker, S.R.; Samad, H.A. Energy poverty in rural Bangladesh. Energy Policy 2011, 39, 894–904. [Google Scholar] [CrossRef]
- Spagnoletti, B.; O’Callaghan, T. Let there be light: A multi-actor approach to alleviating energy poverty in Asia. Energy Policy 2013, 63, 738–746. [Google Scholar] [CrossRef]
- Andadari, R.K.; Mulder, P.; Rietveld, P. Energy poverty reduction by fuel switching. Impact evaluation of the LPG conversion program in Indonesia. Energy Policy 2014, 66, 436–449. [Google Scholar] [CrossRef]
- Li, K.; Liu, C.F.; Wei, Y.M. Energy poverty in China. Energy China 2011, 33, 31–35. [Google Scholar]
- Li, K.; Bob, L.; Liang, X.J.; Wei, Y.M. Energy poor or fuel poor: What are the differences? Energy Policy 2014, 68, 476–481. [Google Scholar] [CrossRef]
- Tang, X.; Liao, H. Energy poverty and solid fuels use in rural China: Analysis based on national population census. Energy Sustain. Dev. 2014, 23, 122–129. [Google Scholar] [CrossRef]
- Wang, K.; Wang, Y.X.; Li, K.; Wei, Y.M. Energy poverty in China: An index based comprehensive evaluation. Renew. Sustain. Energy Rev. 2015, 47, 308–323. [Google Scholar] [CrossRef]
- REN21. Renewables 2017 Global Status Report; REN21 Secretariat: Paris, France, 2017. [Google Scholar]
- GEA. Global Energy Assessment—Toward a Sustainable Future; Cambridge University Press: Cambridge, UK; New York, NY, USA; The International Institute for Applied Systems Analysis: Laxenburg, Austria, 2012. [Google Scholar]
- Reeves, A. Exploring Local and Community Capacity to Reduce Fuel Poverty: The Case of Home Energy Advice Visits in the UK. Energies 2016, 9, 276. [Google Scholar] [CrossRef]
- Borhanazad, H.; Mekhilef, S.; Saidur, R. Potential application of renewable energy for rural electrification in Malaysia. Renew. Energy 2013, 59, 210–219. [Google Scholar] [CrossRef]
- Thomson, H.; Snell, C. Quantifying the prevalence of fuel poverty across the European Union. Energy Policy 2013, 52, 563–572. [Google Scholar] [CrossRef]
- Thomson, H.; Bouzarovski, S.; Snell, C. Rethinking the measurement of energy poverty in Europe: A critical analysis of indicators and data. Indoor Built Environ. 2017, 26, 879–901. [Google Scholar] [CrossRef] [PubMed]
- Deng, J.L. A Course on Grey Systems Theory; HUST Press: Wuhan, China, 1990. [Google Scholar]
- Wang, B.; Liang, X.J.; Zhang, H.; Wang, L.; Wei, Y.M. Vulnerability of hydropower generation to climate change in China: Results based on Grey forecasting model. Energy Policy 2014, 65, 701–707. [Google Scholar] [CrossRef]
- Feng, Z.H.; Zou, L.L.; Wei, Y.M. The impact of household consumption on energy use and CO2 emissions in China. Energy 2011, 36, 656–670. [Google Scholar] [CrossRef]
- Wang, B.; Nistor, I.; Murty, T.; Wei, Y.M. Efficiency assessment of hydroelectric power plants in Canada: A multi criteria decision making approach. Energy Econ. 2014, 46, 112–121. [Google Scholar] [CrossRef]
- Mi, Z.F.; Wei, Y.M.; He, C.Q.; Li, H.N.; Yuan, X.C.; Liao, H. Regional efforts to mitigate climate change in China: A multi-criteria assessment approach. Mitig. Adapt. Strateg. Glob. Chang. 2015, 22, 1–22. [Google Scholar] [CrossRef]
- Liu, S.F.; Lin, Y. Grey Systems: Theory and Applications; Springer: Berlin, Germany, 2011. [Google Scholar]
- Marques, A.C.; Fuinhas, J.A.; Manso, J.R.P. Motivation driving renewable energy in European countries: A panel data approach. Energy Policy 2010, 38, 6877–6885. [Google Scholar] [CrossRef]
- Marques, A.C.; Fuinhas, J.A. Drivers promoting renewable energy: A dynamic panel approach. Renew. Sustain. Energy Rev. 2011, 15, 1601–1608. [Google Scholar] [CrossRef]
- Practical Action. Poor People’s Energy Outlook 2016; Practical Action: Warwickshire, UK, 2016. [Google Scholar]
- Hills, J. Fuel Poverty: The Problem and Its Measurement; CASE Reports, CASE Report 69; Department for Energy and Climate Change: London, UK. Available online: http://sticerd.lse.ac.uk/dps/case/cr/CASEreport69.pdf (accessed on 18 September 2017).
- Johansson, T.B.; Kelly, H.; Amulya, K.; Reddy, N.; Williams, R.H. Renewable Energy: Sources for Fuels and Electricity; Island Press: Washington, DC, USA, 1993. [Google Scholar]
- Moore, R. Definitions of fuel poverty: Implications for policy. Energy Policy 2012, 49, 19–26. [Google Scholar] [CrossRef]
- Middlemiss, L. A critical analysis of the new politics of fuel poverty in England. Crit. Soc. Policy 2017, 37, 425–443. [Google Scholar] [CrossRef]
- Bouzarovski, S.; Petrova, S. A global perspective on domestic energy deprivation: Overcoming the energy poverty-fuel poverty binary. Energy Res. Soc. Sci. 2015, 10, 31–40. [Google Scholar] [CrossRef]
- Snape, J. Spatial and Temporal Characteristics of PV Adoption in the UK and Their Implications for the Smart Grid. Energies 2016, 9, 210. [Google Scholar] [CrossRef]
- Editor Committee of China Power Yearbook. China Electric Power Yearbook 2006–2012; China Electric Power Press: Beijing, China, 2006–2012. (In Chinese) [Google Scholar]
- China National Bureau of Statistics. China Energy Statistical Yearbook 2006–2012; China Statistics Press: Beijing, China, 2006–2012; (In Chinese).
- China National Bureau of Statistics; Ministry of Environmental Protection. China Statistical Yearbook on Environment 2006–2012; China Statistics Press: Beijing, China, 2006–2012; (In Chinese).
- China National Bureau of Statistics. China Statistical Yearbook 2006–2012; China Statistics Press: Beijing, China, 2006–2012; (In Chinese).
- Tianjin Municipal People’s Government. Tianjin Building Energy Efficiency Regulations. 2007. Available online: http://www.tj.gov.cn/zwgk/wjgz/szfl/200710/t20071006_27392.htm (accessed on 8 May 2014).
- Menegaki, A. Growth and renewable energy in Europe: Benchmarking with data envelopment analysis. Renew. Energy 2013, 60, 363–369. [Google Scholar] [CrossRef]
- Mi, Z.; Meng, J.; Guan, D.; Shan, Y.; Liu, Z.; Wang, Y.T.; Feng, K.S.; Wei, Y.M. Pattern changes in determinants of Chinese emissions. Environ. Res. Lett. 2017, 12, 7. [Google Scholar] [CrossRef]
- Wang, B.; Pan, S.Y.; Ke, R.Y.; Wang, K.; Wei, Y.M. An overview of climate change vulnerability: a bibliometric analysis based on Web of Science database. Nat. Hazards 2014, 74, 1649–1666. [Google Scholar] [CrossRef]
- Maheshwari, Z.; Ramakumar, R. Smart Integrated Renewable Energy Systems (SIRES): A Novel Approach for Sustainable Development. Energies 2017, 10, 1145. [Google Scholar] [CrossRef]
- Wang, B.; Ke, R.Y.; Yuan, X.C.; Wei, Y.M. China’s regional assessment of renewable energy vulnerability to climate change. Renew. Sustain. Energy Rev. 2014, 40, 185–195. [Google Scholar] [CrossRef]


| Indicator | Definition | Unit | Data Resource |
|---|---|---|---|
| Access to electricity | per capita electricity consumption | kWh per capita | China Electric Power Yearbook (2006–2012) [37]; China Statistical Yearbook (2006–2012) [40] |
| Energy consumption for productive use | Proportion of energy consumption for productive use in the final energy consumption * | % | China Energy Statistical Yearbook (2006–2012) [38] |
| Access to modern energy services | Proportion of heating and electricity consumption in the final heating and electricity consumption | % | China Energy Statistical Yearbook (2006–2012) [38] |
| Investment on electricity supply | Length of power transmission lines (35kV above) per unit area | kM per m2 | China Electric Power Yearbook (2006–2012) [37]; China Statistical Yearbook (2006–2012) [40] |
| Electricity investment per unit area | Million | China Energy Statistical Yearbook (2006–2012) [38] | |
| Investment on renewable energy | Investment of renewable energy | Million | China Energy Statistical Yearbook (2006–2012) [38] |
| Access to renewable energy | Proportion of renewable energy generation in power mix | % | China Electric Power Yearbook (2006–2012) [37] |
| Annual utilization hours of renewable energy equipment | Hour | China Electric Power Yearbook (2006–2012) [37] | |
| Development level of household methane | m3 | China Statistical Yearbook on Environment (2006–2012) [39] | |
| Utilization level of solar energy ** | m2 | China Statistical Yearbook on Environment (2006–2012) [39] |
| Abbreviation | 2005 | 2006 | 2007 | 2008 | 2009 | 2010 | 2011 | |
|---|---|---|---|---|---|---|---|---|
| Beijing | BJ | 59.304 | 58.713 | 58.592 | 58.525 | 57.744 | 57.514 | 56.878 |
| Tianjin | TJ | 61.967 | 61.009 | 60.851 | 60.546 | 60.585 | 60.281 | 59.780 |
| Hebei | HeB | 58.501 | 60.133 | 60.026 | 59.834 | 59.507 | 59.431 | 59.139 |
| Shanxi | SX | 53.872 | 54.166 | 54.357 | 54.387 | 54.226 | 54.087 | 53.937 |
| Inner Mongolia | NMG | 37.173 | 36.172 | 37.748 | 40.679 | 41.683 | 42.752 | 42.458 |
| Liaoning | LN | 55.185 | 55.063 | 54.259 | 53.870 | 53.627 | 54.075 | 53.551 |
| Jilin | JL | 51.395 | 50.884 | 49.493 | 49.041 | 48.637 | 48.814 | 48.453 |
| Heilongjiang | HLJ | 49.502 | 48.848 | 46.968 | 46.783 | 45.934 | 46.185 | 46.101 |
| Jiangsu | JS | 61.057 | 60.626 | 60.201 | 59.794 | 59.572 | 59.855 | 59.806 |
| Zhejiang | ZJ | 57.511 | 57.578 | 57.296 | 57.067 | 56.613 | 56.679 | 56.637 |
| Anhui | AH | 56.258 | 55.515 | 55.436 | 55.058 | 54.860 | 55.111 | 54.886 |
| Fujian | FJ | 56.517 | 56.618 | 56.286 | 55.944 | 55.379 | 55.139 | 55.491 |
| Jiangxi | JX | 57.203 | 57.036 | 55.997 | 55.413 | 55.336 | 55.344 | 55.354 |
| Shandong | SD | 58.109 | 58.505 | 58.954 | 59.563 | 59.975 | 60.512 | 60.150 |
| Henan | HeN | 60.982 | 61.200 | 61.597 | 61.813 | 61.420 | 61.659 | 60.672 |
| Hubei | HuB | 57.712 | 58.235 | 58.806 | 58.790 | 58.897 | 59.292 | 58.502 |
| Hunan | HuN | 59.541 | 59.376 | 59.134 | 58.716 | 57.452 | 57.471 | 57.218 |
| Guangdong | GD | 55.080 | 55.247 | 55.243 | 55.094 | 54.680 | 54.920 | 54.751 |
| Guangxi | GX | 60.445 | 60.320 | 60.005 | 59.505 | 58.019 | 58.098 | 59.524 |
| Hainan | HN | 60.050 | 60.035 | 59.399 | 60.226 | 60.993 | 61.248 | 61.793 |
| Chongqing | CQ | 57.787 | 57.877 | 57.768 | 57.555 | 57.889 | 58.438 | 58.281 |
| Sichuan | SC | 56.140 | 56.527 | 56.297 | 56.001 | 55.779 | 56.028 | 55.969 |
| Guizhou | GZ | 55.742 | 56.471 | 57.530 | 57.591 | 57.169 | 56.672 | 56.100 |
| Yunnan | YN | 56.396 | 56.542 | 55.889 | 55.437 | 55.281 | 55.170 | 55.125 |
| Shaanxi | ShX | 52.410 | 52.740 | 52.159 | 52.508 | 52.564 | 52.411 | 52.309 |
| Gansu | GS | 49.958 | 49.466 | 48.111 | 48.056 | 48.848 | 49.313 | 49.030 |
| Qinghai | QH | 44.474 | 43.552 | 39.273 | 38.899 | 39.001 | 38.577 | 39.607 |
| Ningxia | NX | 52.490 | 52.284 | 51.539 | 51.004 | 50.626 | 50.890 | 50.674 |
| Xinjiang | XJ | 42.072 | 41.073 | 37.865 | 38.268 | 38.196 | 39.338 | 39.503 |
| Max | - | 61.967 | 61.200 | 61.597 | 61.813 | 61.420 | 61.659 | 61.793 |
| Min | - | 37.173 | 36.172 | 37.748 | 38.268 | 38.196 | 38.577 | 39.503 |
| Mean | - | 54.994 | 54.890 | 54.382 | 54.344 | 54.155 | 54.321 | 54.196 |
| Definition | Calculation | |
|---|---|---|
| Energy poverty scores | Energy poverty assessment scores | |
| Urbanization | Percentage of population in urban areas | |
| Affordability | Percentage of electricity expenditure in income | |
| Income | Increase rate of Per capita GDP | |
| Industrialization | Percentage of the Secondary Industry in GDP | |
| Rural Household Consumption Expenditure | Increase rate of Rural Household Consumption Expenditure | |
| Renewable energy utilization | Percentage of hydropower, wind power, solar energy utilization in power generation |
| Model 1 | Model 2 | |||
|---|---|---|---|---|
| POLS | FE | POLS | FE | |
| Constant | 26.915 *** | 29.101 *** | 37.735 ** | −12.481 |
| 0.159 *** | 0.150 *** | 0.888 ** | 0.904 ** | |
| −0.371 ** | −0.361 ** | −0.156 *** | −0.368 * | |
| 0.054 | −0.020 | 0.139 | −0.015 | |
| −0.099 | −0.099 | −0.375 | −0.804 ** | |
| −0.122 * | −0.154 * | −0.609* | −0.428 ** | |
| 0.231 *** | 0.231 *** | |||
| Observations | 203 | 203 | 203 | 203 |
| F-statistic | 18.692 *** | 9.310 *** | 12.426 *** | 16.157 *** |
| Adj. R square | 0.344 | 0.331 | 0.289 | 0.253 |
© 2017 by the authors. Licensee MDPI, Basel, Switzerland. This article is an open access article distributed under the terms and conditions of the Creative Commons Attribution (CC BY) license (http://creativecommons.org/licenses/by/4.0/).
Share and Cite
Wang, B.; Li, H.-N.; Yuan, X.-C.; Sun, Z.-M. Energy Poverty in China: A Dynamic Analysis Based on a Hybrid Panel Data Decision Model. Energies 2017, 10, 1942. https://doi.org/10.3390/en10121942
Wang B, Li H-N, Yuan X-C, Sun Z-M. Energy Poverty in China: A Dynamic Analysis Based on a Hybrid Panel Data Decision Model. Energies. 2017; 10(12):1942. https://doi.org/10.3390/en10121942
Chicago/Turabian StyleWang, Bing, Hua-Nan Li, Xiao-Chen Yuan, and Zhen-Ming Sun. 2017. "Energy Poverty in China: A Dynamic Analysis Based on a Hybrid Panel Data Decision Model" Energies 10, no. 12: 1942. https://doi.org/10.3390/en10121942
APA StyleWang, B., Li, H.-N., Yuan, X.-C., & Sun, Z.-M. (2017). Energy Poverty in China: A Dynamic Analysis Based on a Hybrid Panel Data Decision Model. Energies, 10(12), 1942. https://doi.org/10.3390/en10121942