Article

Resilient Prosumer Scenario in a Changing Regulatory Environment—The UniRCon Solution

1
Faculty of Power Engineering, Politehnica University of Bucharest, 060042 Bucharest, Romania
2
Faculty of Electrical Engineering, Politehnica University of Bucharest, 060042 Bucharest, Romania
3
Faculty of Sciences and Technology, Universidade NOVA de Lisboa, 2829-516 Caparica, Portugal
*
Author to whom correspondence should be addressed.
Energies 2017, 10(12), 1941; https://doi.org/10.3390/en10121941
Submission received: 15 August 2017 / Revised: 30 October 2017 / Accepted: 10 November 2017 / Published: 23 November 2017
(This article belongs to the Special Issue Resilience of Energy Systems 2017)

Abstract

:
Technological developments are pushing for new solutions based upon massive integration of renewable electricity generation in networks already facing many challenges. This paper presents a novel approach to managing the energy transfer towards prosumers making use of smart management of local energy storage. The proposed design (including storage dimensioning) is based on several operating scenarios in which the prosumer might operate as: (i) a “load only” entity (from a grid perspective), thus exhibiting investment resiliency against regulatory changes and high energy efficiency; or (ii) a prosumer, in case regulatory opportunistic profit might be available. This can be realized within a newly proposed Uni-directional Resilient Consumer (UniRCon) architecture. The major aim of the proposed architecture is to achieve optimal self-consumption while avoiding curtailment even in a changing regulatory environment like, for example, the total lack of incentives for generation based on renewable energy sources (RES). One of the major advantages of the proposed architecture consists in the adaptability to changes in the regulatory and market environment. The term resilience is used with multiple meanings: (a) the prosumer’s financial resilience against regulatory changes when investment calculations assume no-grid injections; (b) the prosumer’s technical resilience, with electrical design based on standalone operation; (c) the resilience of clusters of interconnected end-user installations with enabled community-level electricity exchange, independent of the existing main grid supply; (d) the contribution to grid resilience, by enabling AC microgrid (MG) operation in island mode when large portions of the grid are formed by clusters of UniRCon prosumers (the ease of islanding segmentation of the local grid in case of emergencies). For proof of concept, three use-cases are detailed: (i) photovoltaic (PV) installations connected behind the meter; (ii) PV and storage available and controllable behind the meter; and (iii) the UniRCon architecture. The three use-cases are then compared and assessed for four near-future timelines as starting points for the investment. Numerical simulations show the attractiveness of the UniRCon solution in what concerns both system operation costs and supply resilience. Savings are expressed as opportunity savings arising from difference in tariffs while charging and discharging the storage unit and due to the avoidance of curtailment, as well as special taxes for the connection of PV (depending on regulatory environment). An extension of the UniRCon concept is presented also at community scale, with neighbourhood energy exchange inside a resilient cluster.

1. Background

Nowadays, electricity grids are facing multiple challenges following growth in the share of renewable-based electricity simultaneously promoted with the dynamic evolution of the energy markets, including energy services. Valuable support is given by novel information and communication technology (ICT) enabled solutions, which are expected to improve the reliability, security and efficiency of the power system through information exchange, distributed generation (DG, for example, a control center of renewable energies), storage sources, and the active participation of the end user. However, a silent player is technological advancement with an impact on all system levels. If not appropriately supported by the regulatory environment, de facto decisions will hinder the large-scale deployment of such solutions.
One fast-developing technology with high potential to be deployed by energy end users is storage [1]. National regulations consider it in a traditional way, either as load (in charging mode) or generator (in discharging mode). This requires the storage systems to fulfil all demanding conditions for grid connection, reflected in the network codes [2], thus making the solutions more complex and expensive. An attempt to reduce these costs is a close interplay with photovoltaic (PV) based generation, usage and storage. The potential of PV electricity production has been already studied in scenarios considering its massive deployment, and the duck chart of California is one of the well-known case studies [3]. A simplified view of such a duck chart is provided in Figure 1.
The studies show that, besides stability problems, a high penetration of PV-based systems during daytime may lead to abnormal operating conditions (e.g., high down-ramping and low load of operation, suboptimal operation point) for all load following units committed for the specific day. Thus, systems need to follow a net demand (load demand minus production from PVs) in the form of a duck shape with steep ramping needs. The example given in Figure 1 shows an increase by 220% for the interval between 20:00 and 21:00 (peak hours) compared with the interval 12:00–16:00, when solar production was the highest in the day. Therefore, there is a need for an excessive ramp of 13 GW in only 3–4 h. This situation is far from the normal operation of most traditional power plants. The study identifies storage as an economically viable and efficient solution to this problem, which is expected to occur in systems with high PV penetration. For this reason, the easiest and most commonly applied solution by a DSO (distribution system operator) or a TSO (transmission and system operator) is the curtailment of PV power generation, with figures raising up to 50% from the PV peak power [4,5]. Other approaches consider controlling local energy storage as a virtual, controllable load and a generator balancing facility [6]. Utilities and other stakeholders have to evaluate these solutions and their potential synergetic effects. Long-duration energy storage opportunities [3] show great potential for high rates of return on investment when based on a combination of actions such as renewable energy self-consumption, storing energy that otherwise would be lost due to grid constraints, back-up power in the event of grid failure, etc.
In a growing number of countries, residential consumers have installed renewable energy sources (RES), especially due to government incentives. The European Commission gives some insight into lessons learned from national schemes on self-consumption from RES and illustrates best practice in this relatively new policy area [7]. The practices and characteristics of regulation that enable the cost-effective development of distributed generation to the benefit of prosumers and other customers alike are addressed by EURELECTRIC (The Union of the Electricity Industry in Europe), based on information collected from 17 European countries [8]. The vision of the European Consumer Organization focuses on the citizen and the quality of life in smart communities, to use the benefit of the new technologies in order to reduce bills, while participating actively in the market to stimulate competition and support energy efficiency [9]. Some studies have indicated the interest of communities in increasing their collaboration in order to improve the resilience of their energy ecosystems [10], or in building a prosumer community group [11,12,13,14].
Various economic and technical concepts have been proposed in literature to allow integrating the new actor (i.e., the prosumer) in the electricity industry in terms of both design and real-time control strategies. Integration of a consumer into various grid concepts, such as the management of the electricity costs as proposed in [15], may require appropriate communication and automatic control [16] or metering systems [17]. Incentives can, thus, be proposed to encourage prosumers to balance local production and consumption by adapting their needs to actual energy generation as, for example, by connecting or disconnecting some of their loads (flexible loads).
Small-sized PV and energy storage systems (ESS) have been developed for achieving energy independence in the context of smart grids [18,19]. An approach in this regard is also proposed in [20], where a model is formulated that explicitly considers varying electricity prices in a multi-objective optimization problem. In [21] it is demonstrated that increasing penetration of solar power will require both short- and long-term forecasts to assist in balancing energy generation from renewables and fossil-fuel based sources. The forecasts need to be readily available to grid operators for an optimal benefit to the grid operation.
Another option for coping with energy control locally rather than at the wider power-system level are microgrids, where energy exchange is evaluated at the neighbourhood level and usually more than one energy vector is considered [2,22]. Together with methodologies of engaging the community in microgrid operation and maintenance, a long-run benefit is envisioned [14]. Besides optimal operation techniques for a single home or microgrid, various control strategies have been proposed in the literature that consider several characteristics of the microgrid operation [23,24]. In [25] it is shown that in order to overcome the uncertainty of PV generation, demand response (DR) and battery energy storage systems (BESS) need to be introduced simultaneously in an optimal scheduling algorithm. In [13], an iterative method for the optimal planning of multi-microgrid interconnection is proposed that is able to cope with given reliability constraints while satisfying limited capital cost.
The major aspects we surveyed in the literature are summarized in Table 1, below. They are in line with the objectives of the proposed work.
In this paper, we propose also to address the issue of a changing, unpredictable regulatory environment with additional constraints upon local-generation scenarios. Regulatory constraints and their impact upon adoption of BESS on a large scale were previously studied in [26]. However, a techno-economic assessment of the impact of a volatile regulatory environment on prosumer investment is still missing. The latter is important because curtailment policy is driven by system and network operators, whereas support schemes are driven by political decisions, both being uncontrollable factors for an investor in renewables, thus making investments prone to a regulatory risk. Thus, we propose an analysis from the viewpoint of a “load only” prosumer, with several key features: It offers better customer resilience, an improvement in stability and predictability relevant for low-voltage level (LV) network operators, and less expensive grid connection, because it transforms a prosumer in an all-time consumer. We show that this solution, named hereon as UniRCon, addresses the load-generation gap described in Figure 1 by including the costs and benefits of technical and investment resilience. This solution is independent of any future constraints (technical or regulatory) applied to the local-generation units, thus remaining compatible with the classic design of a network tailored for unidirectional energy flow. Furthermore, this architecture can be extended to a number of energy prosumers, which can increase efficiency and resilience through the proposed UniRCon architecture at prosumer level or in a UniRCon cluster.

2. Optimal Integration of Renewables in a Changing Regulatory Environment

2.1. Introduction

Presently there are three different deployments of possible architectures for prosumers, which are presented below with pros and cons (see Figure 2):
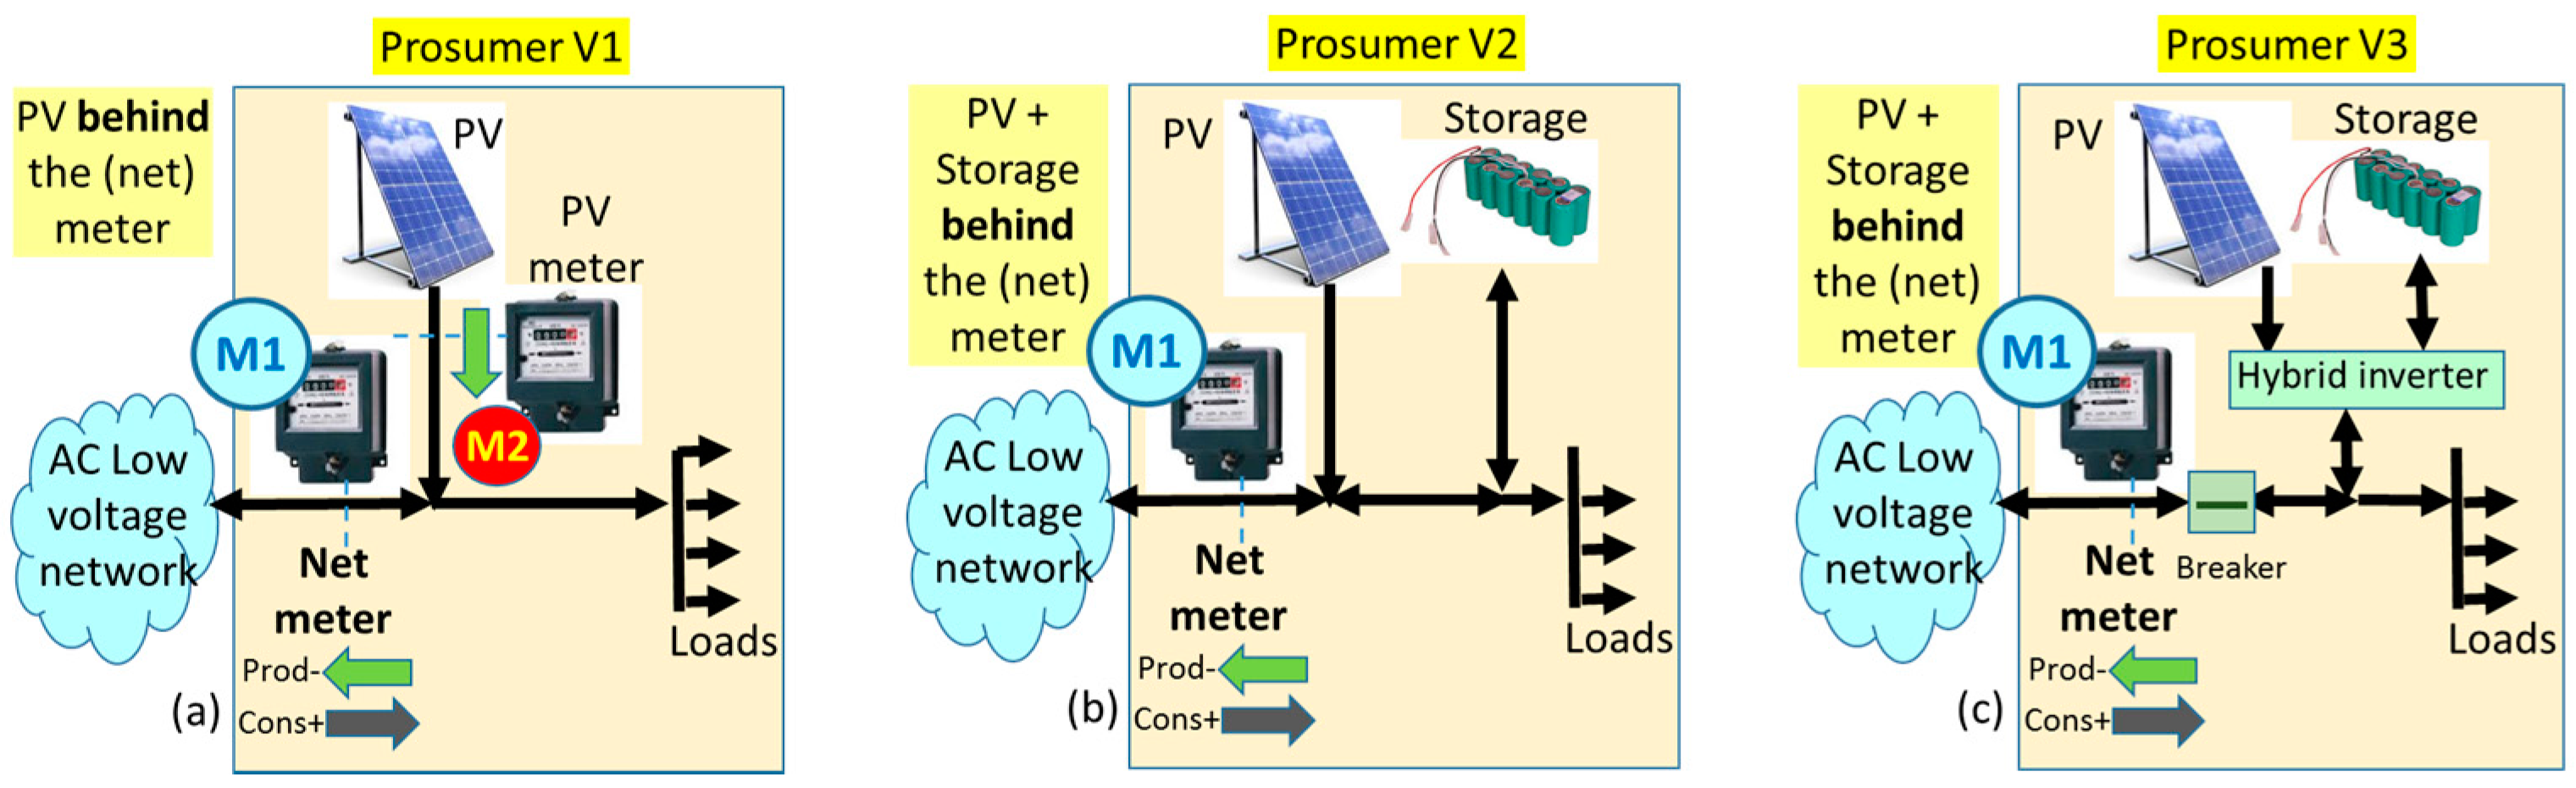
  • Prosumer V1 (Figure 2a) has PV (or other intermittent, RES-based) generation behind the meter, connected to both the AC internal network and the DSO grid; depending on secondary legislation, available support scheme such as feed-in tariff (FiT) or green certificates (GC) might apply either for the excess energy measured by the net meter M1, or for the energy measured by the PV meter M2;
    Advantages: Support schemes apply; installed PV capacity could be greater than the local need (instant power terms), which is an advantage if good support schemes apply.
    Disadvantages: Income from support schemes is exposed to regulatory changes; curtailment asked by the relevant operator may apply, especially in a high-RES penetration situation.
  • Prosumer V2 (Figure 2b) has PV and local storage connected to the AC grid directly operated by the DSO, for example for addressing local power-quality issues.
    Advantages: Electricity harvested during the day can be stored and used during the evening, thus increasing self-consumption.
    Disadvantages: Each piece of equipment is connected to the grid as a generation unit, thus being subjected to network requirements and regulatory changes, such as curtailment; according to EU regulation, the generators’ operation is monitored without considering prosumer behaviour.
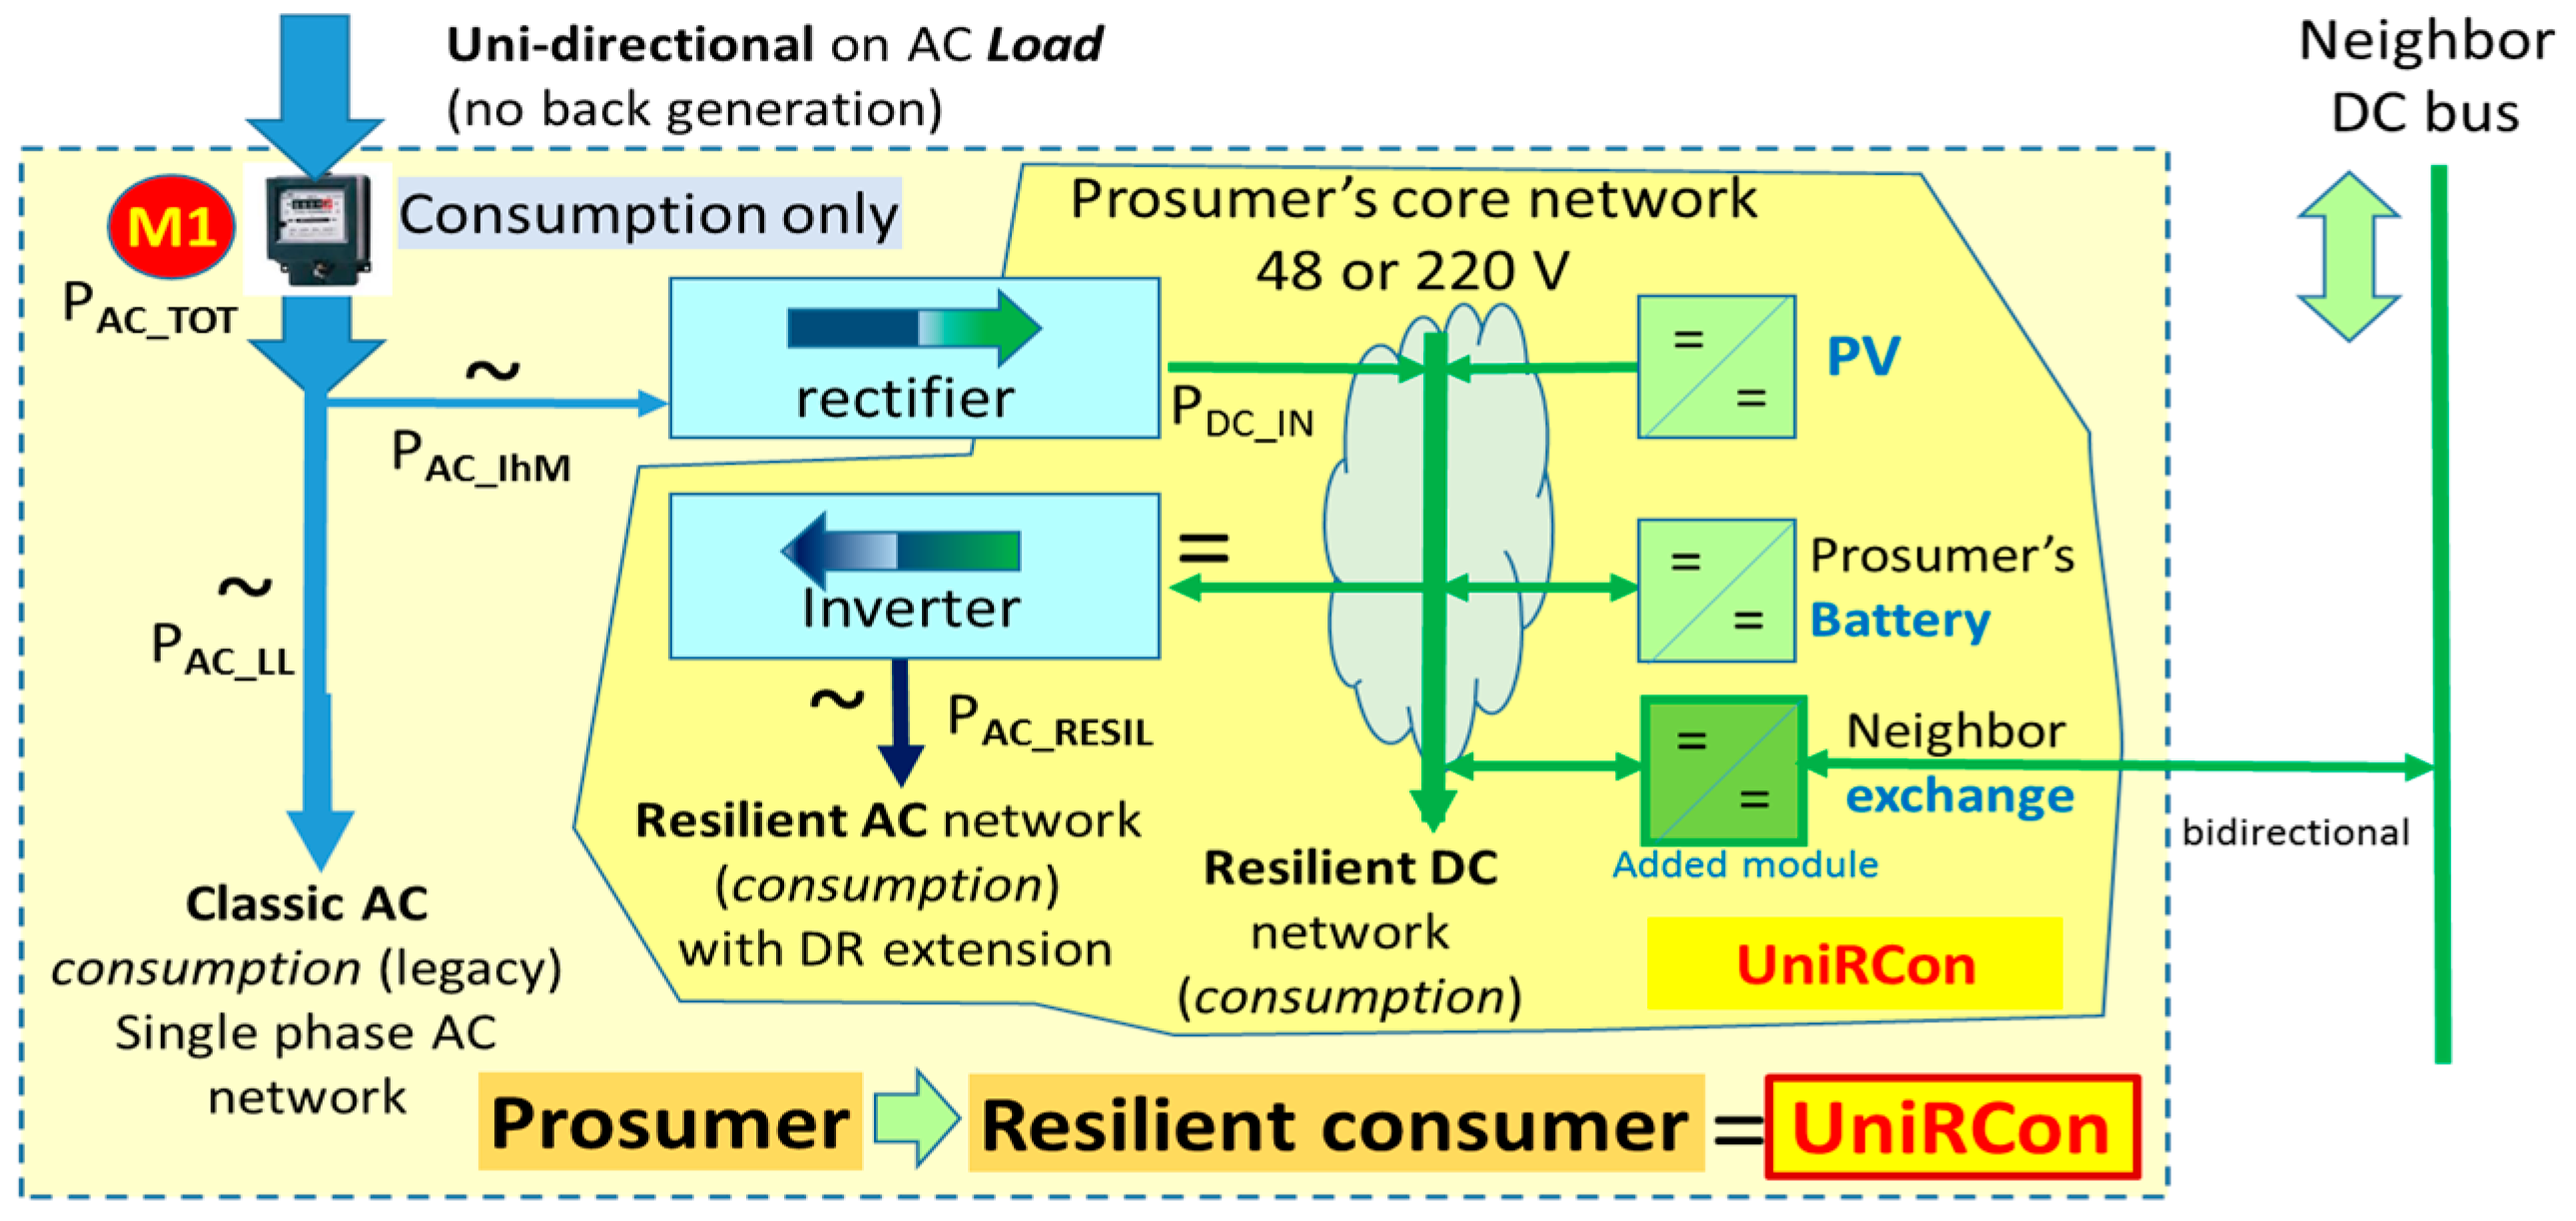
  • Prosumer V3 (Figure 2c) has a device—named a generically hybrid inverter—which connects PV and storage to the AC network; it brings resilience to the loads in the islanding mode of operation.
    Advantages: One piece of equipment (the hybrid inverter) is optimising the PV and storage energy transfer, which allows better operation of both units; good dimensioning can increase the self-consumption of locally produced energy;
    Disadvantages: In the islanding mode of operation, loads can be supplied only after breaker disconnection; the hybrid inverter needs to comply with network codes and possible curtailment orders still apply. Thus, this architecture is still prone to regulatory changes. Furthermore, the overall efficiency of a PV-storage system can be improved, as DC resources such as PV and storage are still used through the AC network (lower overall efficiency due to unnecessary AC–DC–AC conversion stages).
None of the solutions presented above include access to a DC internal bus or allow neighbourhood energy exchange other than using the existing DSO network.

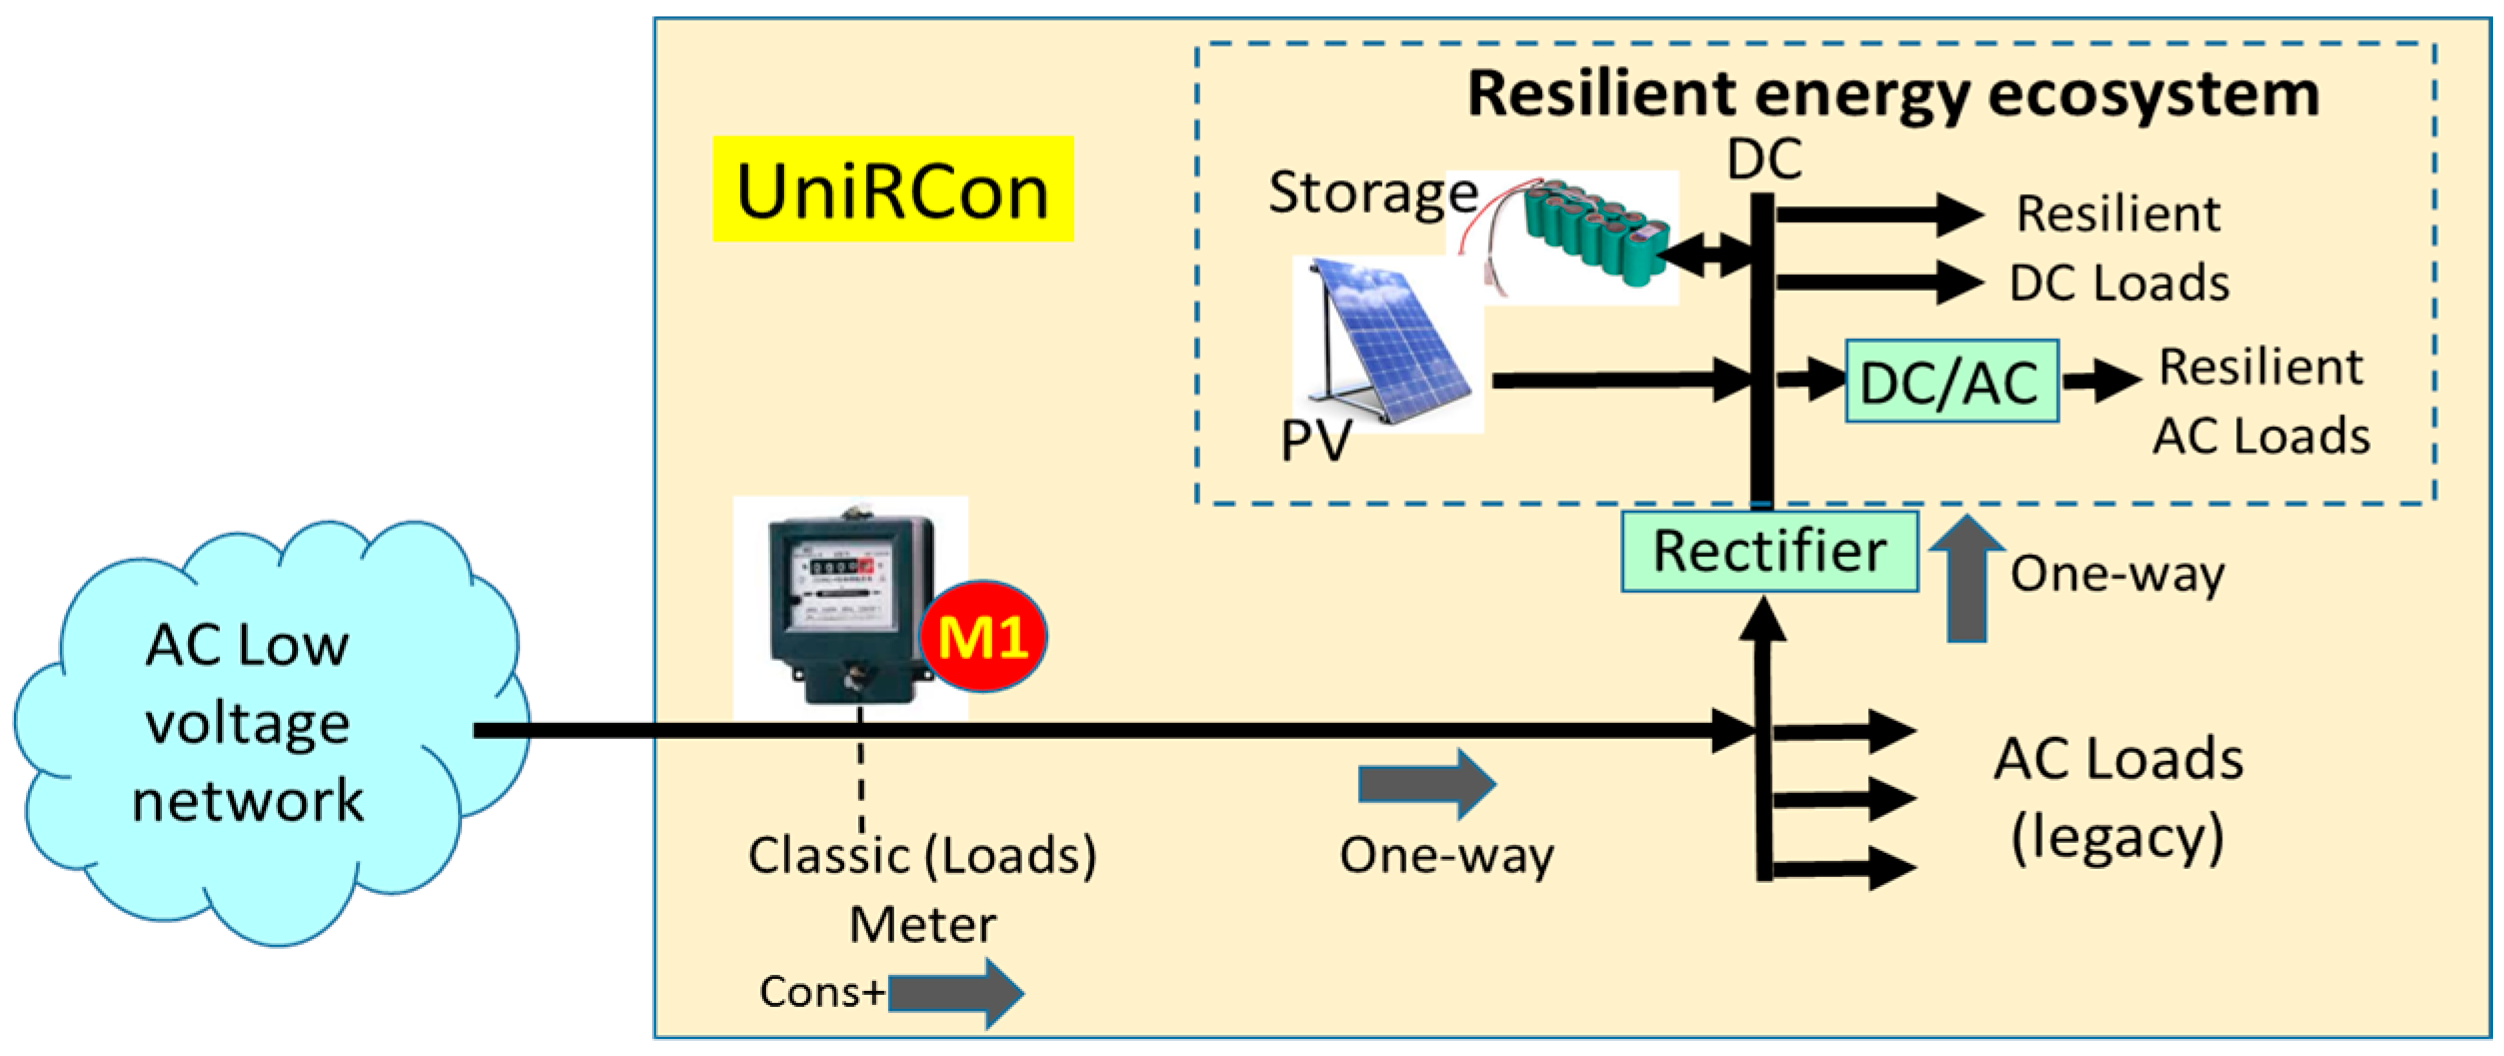
2.2. Resilient Architecture for Prosumers with Integrated Storage

To use as much as possible self-produced energy, a different approach is necessary. We propose a simple battery-size selection solution, together with simple decision logic for scheduling battery operation. The rationale is to focus on keeping the proposed architecture as simple as possible, with little sacrifice to the accuracy of the model, instead of a proper optimization model for capacity planning. Sensitivity analysis is also carried out to prove the integrity of the results.
Most rooftop PV installations currently in use within Europe are in a range of 4–10 kW peak power (kWp) as a consequence of governmental incentives [30,31]. Such a PV facility can generate on sunny days much higher energy per day than the household load of self-consumption, the balance being injected into the distribution grid. However, due to a rapid decrease of incentives (e.g., feed-in tariff (FiT) premiums decreased more than 10 times in the past 5–7 years) the initial over-dimensioning of the PV facility could only partially be compensated by local storage, if the stored energy is to be delivered to the grid. Furthermore, energy delivered to the grid could be curtailed, while the associated duck chart problem may remain unsolved. Selecting a higher percentage of energy from the total generated energy to be stored by local storage does not solve the need to send back energy to the network, as excess energy exists by design. The cause of this situation is in the initial goal of investment in distributed generation, unmatched with local load but following energy-harvesting for profit instead of optimal operation.
Our objective is, on the contrary, to achieve optimal self-consumption and avoid curtailment even in changing regulatory approaches like, for example, a total lack of incentives for RES-based generation. In the proposed UniRCon paradigm (as it is summarized in Table 2), PV-system selection and dimensioning is based on achieving, on a daily basis, a higher energy consumption E l o a d than the local generation E P V measured by a sub-unitary factor, K P V 2 l o a d [ 0 , 1 ] .
In this approach, the UniRCon solution brings advantages to several energy actors:
  • DSOs will perceive no disruptive operational changes, beyond decreased load profile: an incremental RES-based DG deployment keeps business-as-usual (BAU) load-equivalent behaviour for all new PV owners, thus keeping the grid compatible with its initial design; the proposed prosumer’s grid coupling is more predictable and more flexible, to help the grid in critical situations, and thus enhances options for the DSO to increase its resiliency.
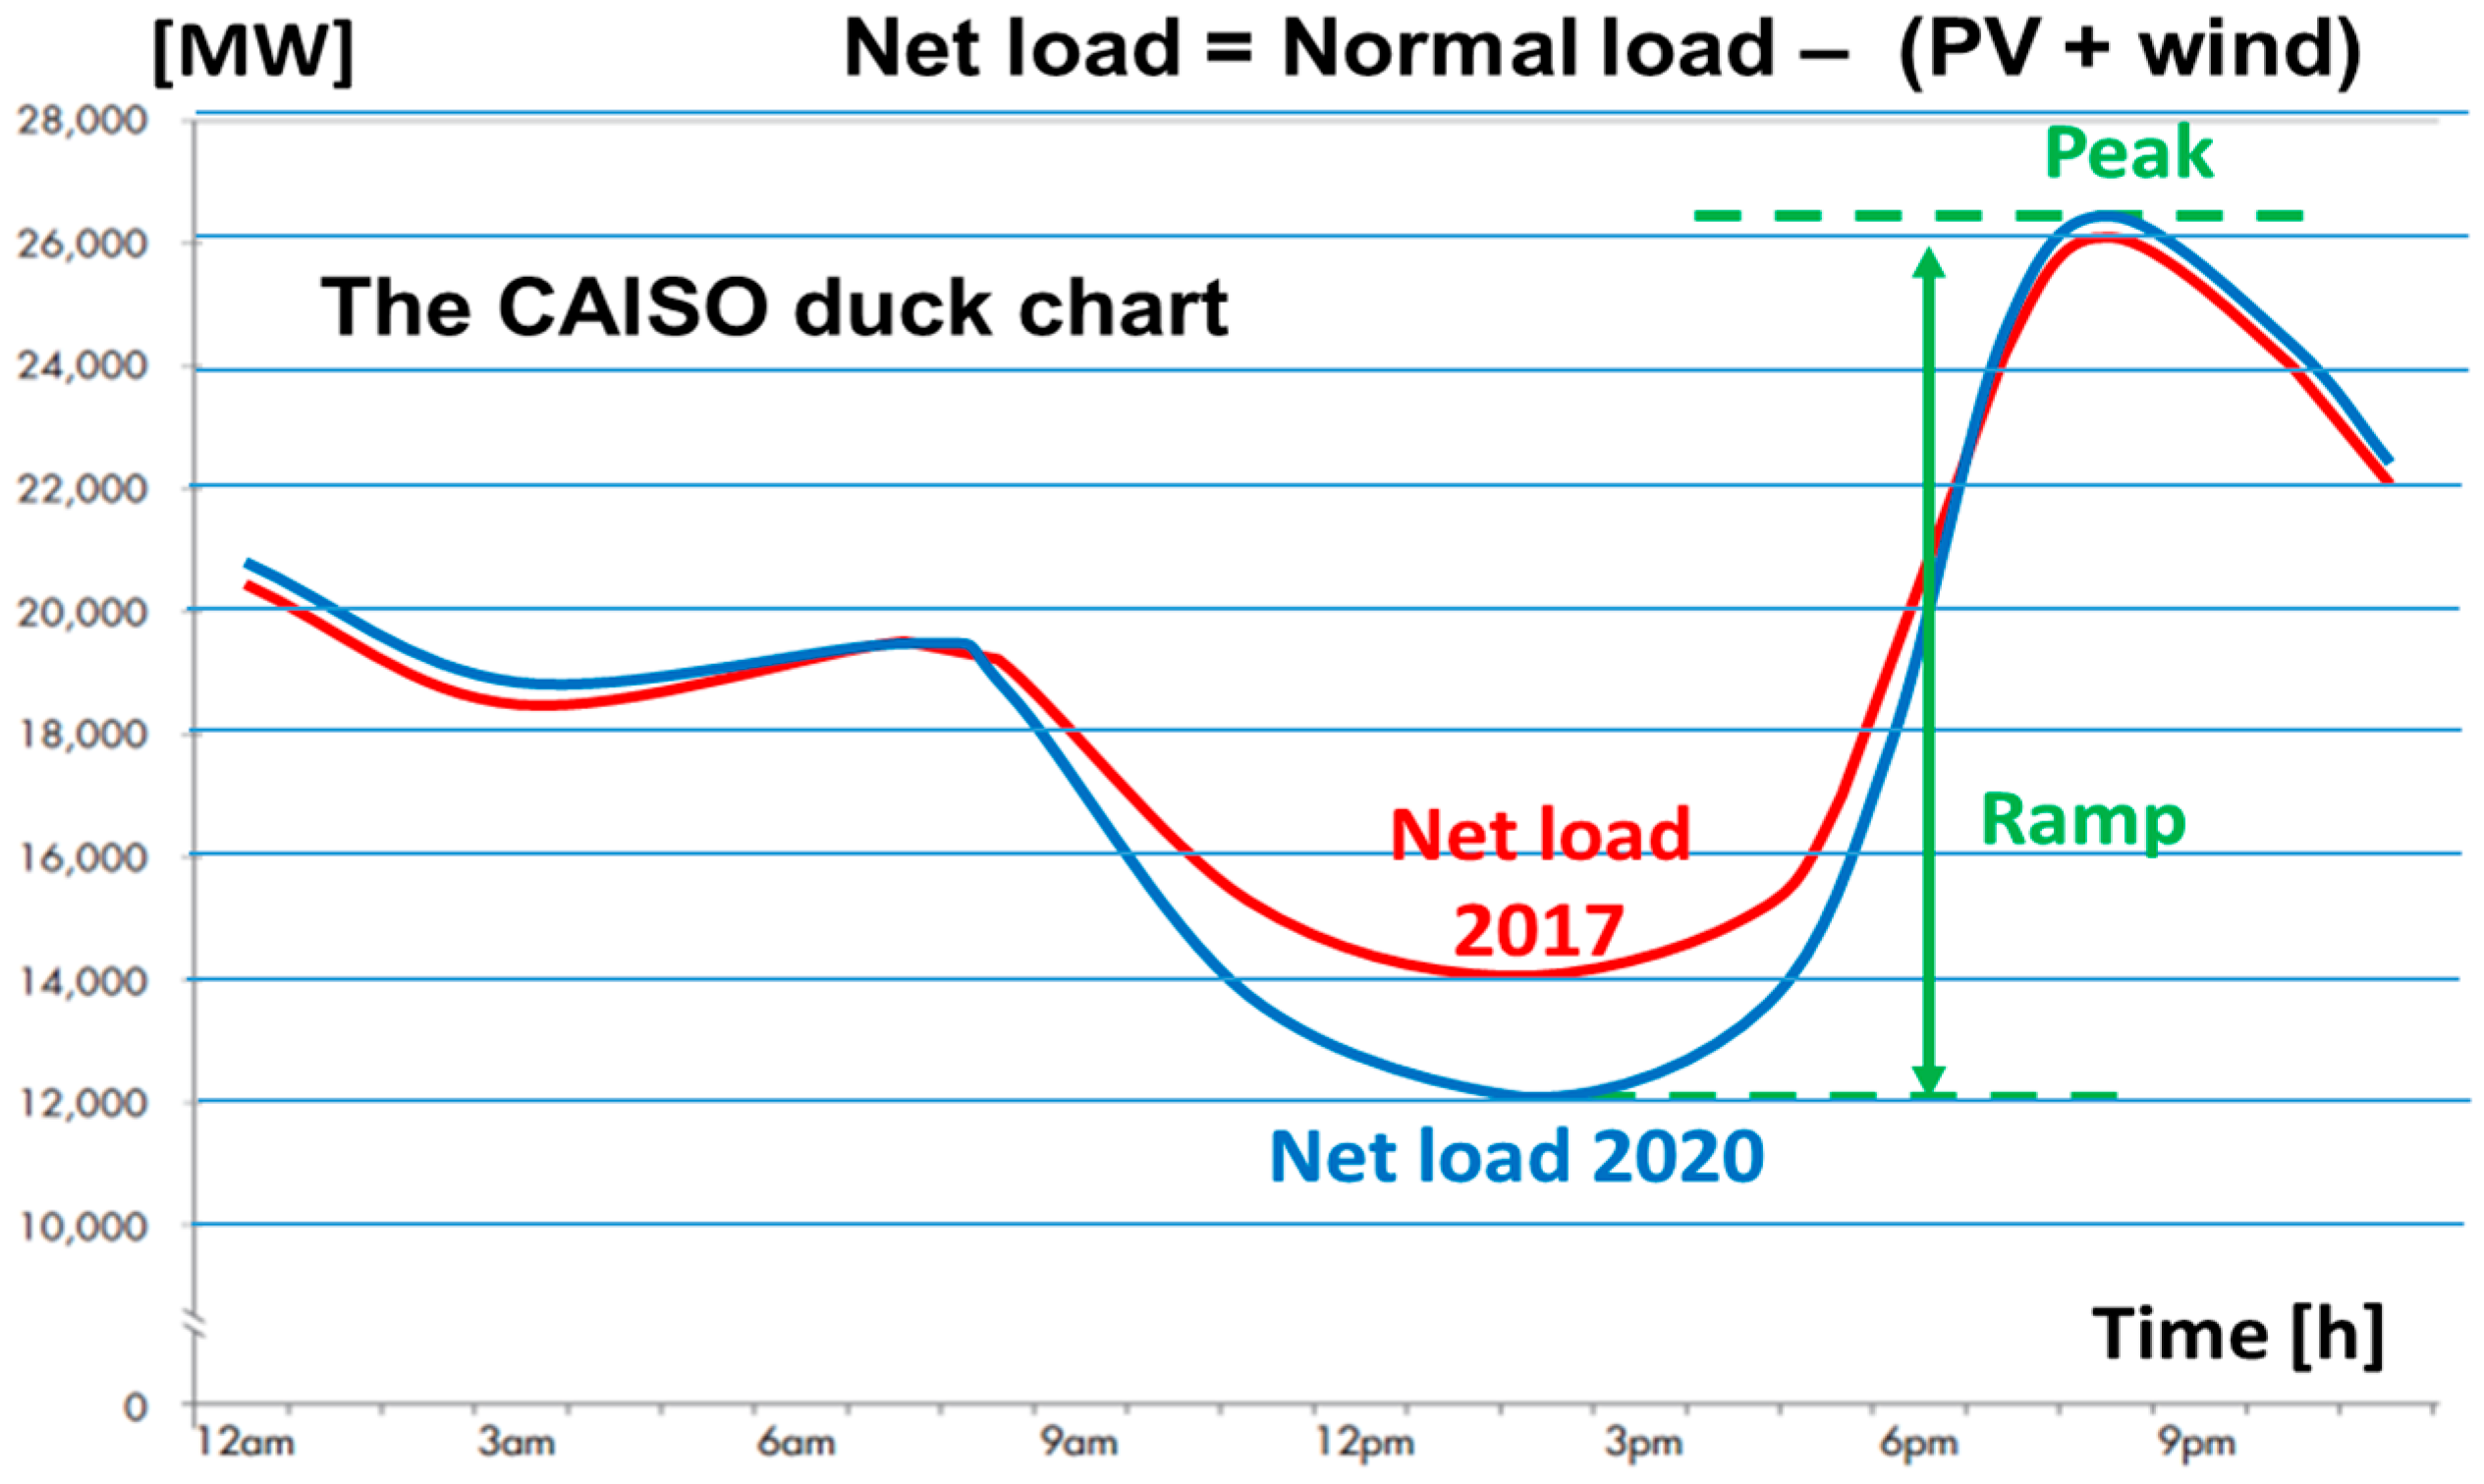
  • TSOs will maintain the classic control approach, reducing effects such as duck-chart ramp problem (with the UniRCon grid coupling, there is no un-dispatchable energy production on the TSO side);
  • The prosumer will experience:
    resilience against network outages, due to the prosumer’s internal busbar, which provides by design an independent and adaptable energy and power control algorithm that allows a short- to medium-term islanding operation. Thus, for increasing local resilience, the prosumer may apply scheduling and prioritize consumption based on the available local resources (PV, storage, available energy from neighbourhood connections);
    stability and predictability in the benefits brought by the RES and storage investment, thus being protected from regulatory changes related to FiT or to curtailment policies (financial resilience);
    increased self-consumption during summer as well as a high use of market opportunities during winter, when bulk energy can be purchased at low prices; moreover, in winter, storage has higher availability of the capacity due to reduced PV production;
    higher efficiency of the used energy, as important elements such as PV and storage are naturally functioning in DC and even many of today’s AC loads are also directly pluggable in appropriate DC local grids;
    lower costs of grid-connection if consumers have the historical right to access electrical energy (a 20th-century electrification paradigm).
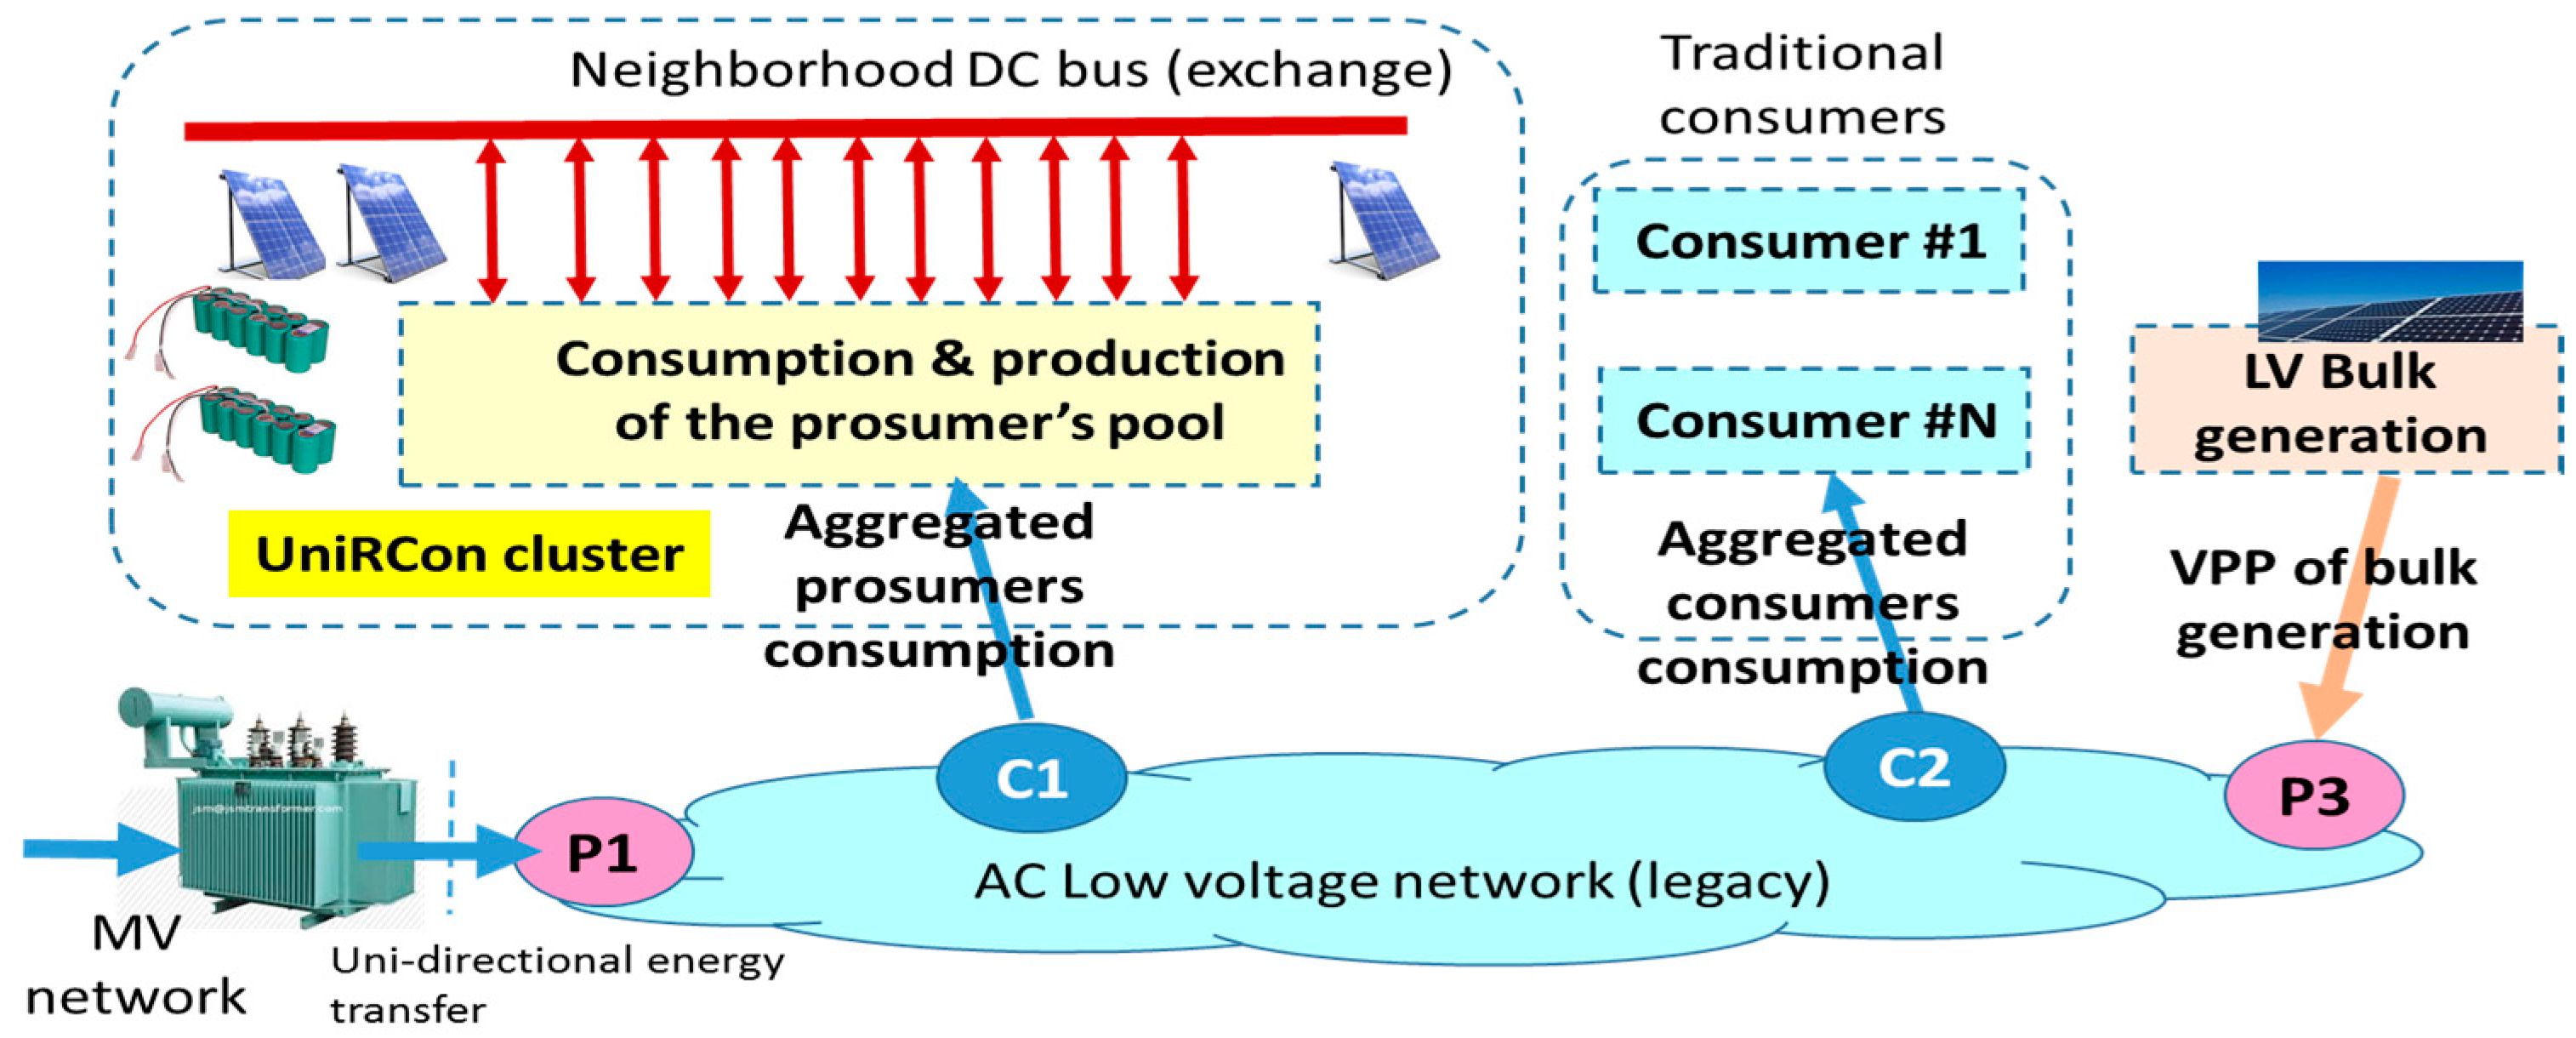
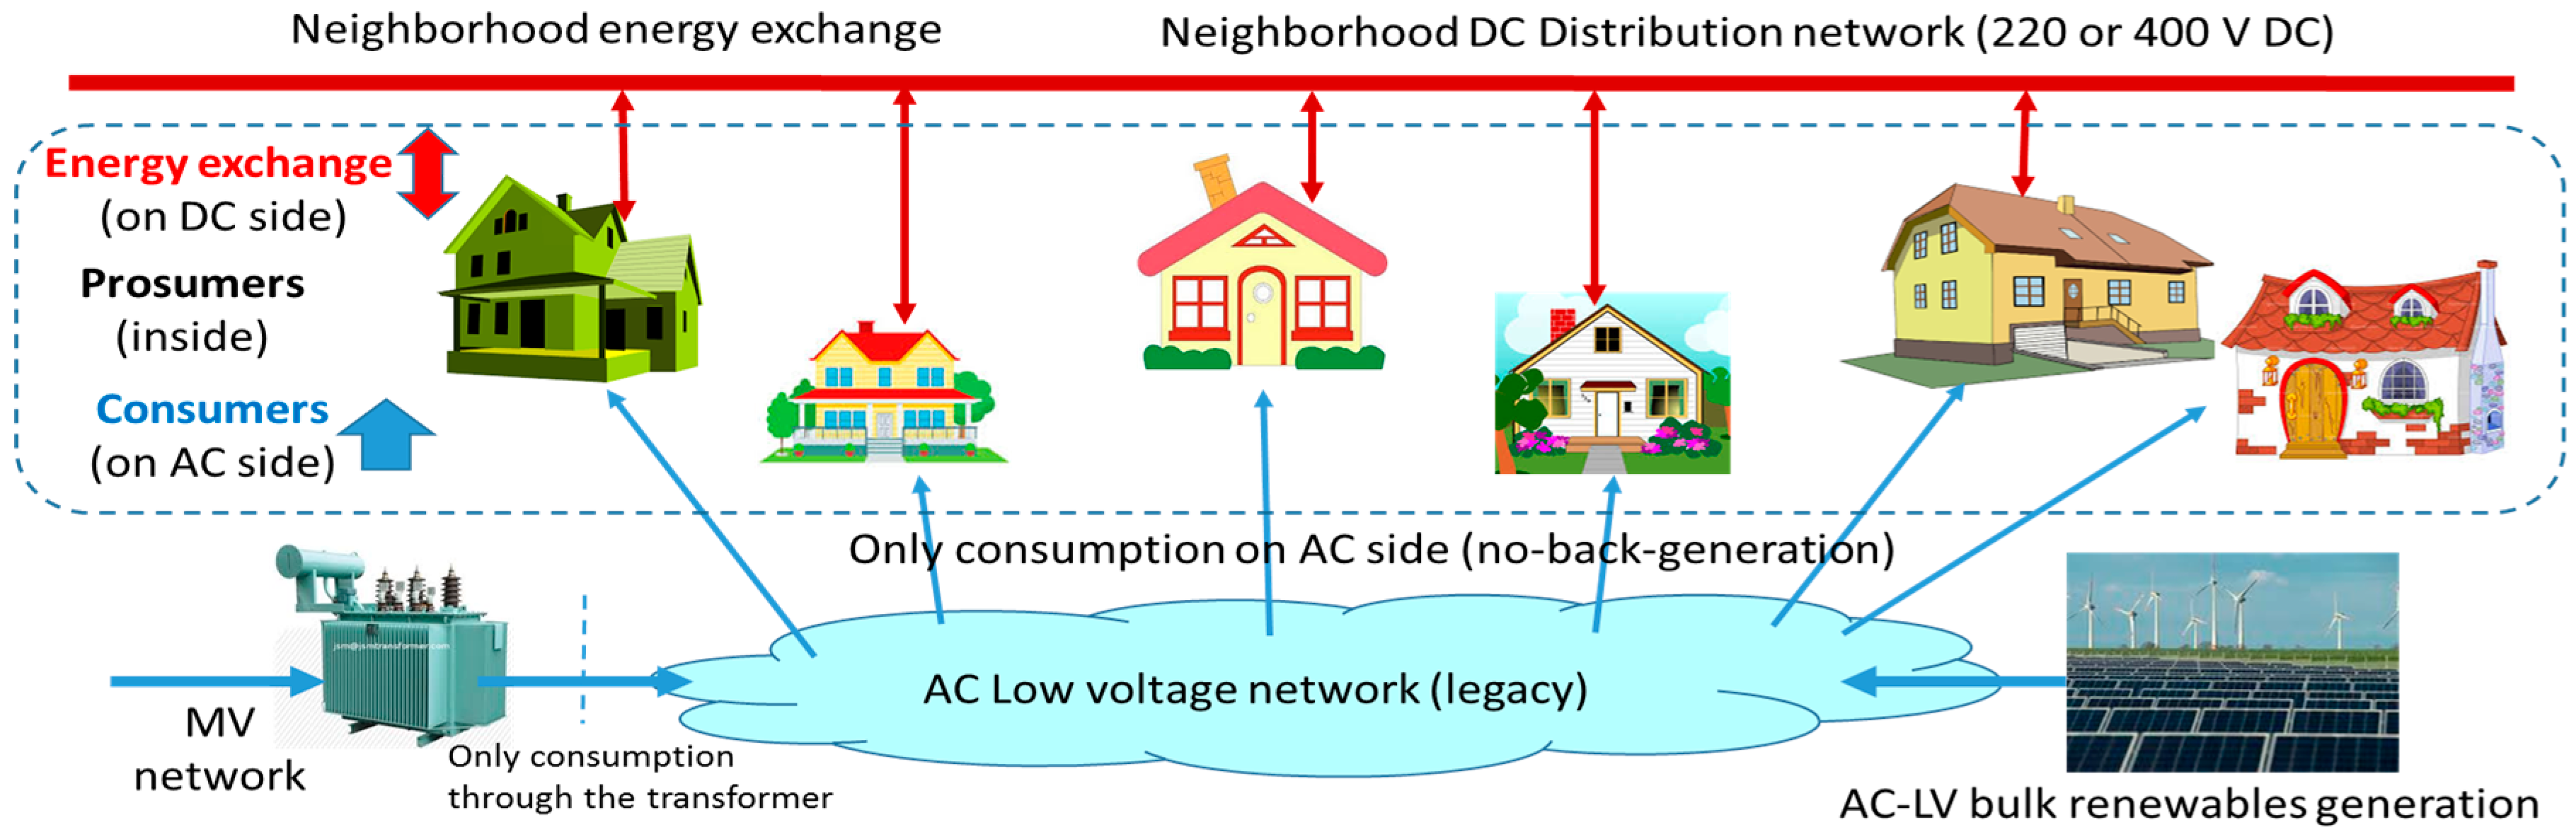
  • Energy communities in particular will benefit from:
    higher resiliency, achieved by design due to an additional “backyard DC” network; in addition, higher efficiency of energy use could be achieved by boosting a local energy market, an embryonic model for the new smart cities design;
  • Society will benefit from:
    improved efficiency as a result of energy harvesting and the local use of electricity; this feature was invoked also on the prosumer side, but it has a societal impact as well;
    preserving participation in a wide-area market like the unified European electricity market, where a significant share (40–60%) can be purchased from the main grid; in this respect, the architecture provides a balanced solution between business as usual—full dependence on the main grid, providing energy supply only when local resources are insufficient on a long-term basis or when the energy price is low due to external factors, and the opposite tendency of full defection—which may require expensive and high storage needs.
    paving the road to 100% renewables (already endorsed by California and Hawaii for 2045) or towards 100% CO2-free energy systems (endorsed by European Union for 2050), without jeopardising the stability of electricity systems;
    minimising the cyber-security threat arising from system-level control, because the end-level of UniRCon is only locally controllable.
The term resilience has been associated with the UniRCon operation according to a definition derived from two resiliency features: (a) resilience to the changing regulatory environment, which means the capability to adapt system behaviour such that external threats such as curtailment or a reduction of renewables incentives can be managed by the internal system, which is stable in terms of functionalities; and (b) resilience against outages and blackouts, which means the capacity to keep the prosumer operation completely unaltered by selecting its source of energy from available local resources, grid-based resources, and neighbourhood resources.
In our proposed methodology, this case would bring additional, opportunistic profit on top of the basic scheme we described in the calculations. In the next sections we present two numerical calculations for the UniRCon architecture: (i) an example of dimensioning (capacity-planning) of a PV and storage installation, which is compared with a base-case of consumption in a standalone operation mode for the prosumer; and (ii) the opening of a neighbourhood energy exchange that could further increase the benefits at community level. The numerical examples ignore special periods of the year, such as summer/winter holidays, where the load might be very low or even zero, due to their limited relevance in the annual context. We may assume auto-curtailment for this situation or export to neighbours if appropriate (e.g., with a UniRCon cluster acting as a UniRCon community, a concept that will be detailed in Section 3).
At the community level of integration, as well as at the prosumer level, for the UniRCon to be smoothly adopted in the near future there is still a need for several institutional precursors to be aligned. Among them are the following: regulation facilitating storage adoption for anyone increasing self-consumption of RES; differentiated grid-code compliance in a large window of power injections with proportional fees; and liberalization of a local ad-hoc neighbourhood market able to decide for its local, proprietary distribution grid.

2.3. Resilient Architecture for Advanced Prosumers

The business-as-usual scenario is described next. Let us consider a roof-mounted PV installation (1 kWp) that can produce, with variation due to latitude and season, up to 4 kWh/day during summertime, and only 1 kWh/day during winter. For a 10 kWp installation this amounts to up to 40 kWh energy during a summer day, significantly higher than the average daily energy consumption of about 20 kWh. In this scenario, there is by design an excess of electricity produced locally during a major part of the year. This excess energy, if injected into the network, might lead to curtailment orders (in case of voltage limits and grid capacity violation, or even in case of stability constraints) or penalties. This scenario also includes the case when subsidies for RES and a priority on renewables dispatch are cancelled. Moreover, the scenario considers an increase in self-consumption, which becomes a viable approach enforced by the situation of reaching or approaching the grid parity price in many European countries (e.g., already reached in countries like Cyprus and Greece), thus meaning collecting FiT or GC becomes less profitable. Therefore, sizing the generation units becomes a techno-economic problem, since the profitability and internal rate of return are decisive for choosing a solution [27].
In the following we analyse the scenario of complete self-consumption, with a grid behaviour in which no locally generated electricity is injected back into the network. We label this as a “no back-generation” solution, which means that even with local production, there is no AC network behaviour to show this, thus the prosumer behaves as a pure consumer on the LV-network side. To achieve all-time load only behaviour, we consider three different modes of network operation. The first and second situations are traditional ways of integrating PV, either directly to the grid (PV connected directly to grid through its own meter) or “behind the meter” (PV is connected to the internal busbar on the prosumer premises). The one we propose has an additional feature, called “resilience behind the meter” and labelled UniRCon, presented in Figure 3 and detailed below.
One essential aspect is that UniRCon is by design unidirectional towards the resilient-energy ecosystem, which is an energy system operating independent of DSO control, to be described in more detail below. The all-time load only behaviour of UniRCon can be achieved with an implementation different from solutions using “zeroing-out” automation. This concept can be further extended to a cluster of prosumers, which is also suggested in [29].
Electricity generators connected to a local network synchronously connected to the DSO grid are separately addressed by specific network codes [2] entailing complex requirements. The UniRCon solution is, however, placed on the consumer’s premises and has no back generation by design. Therefore, less demanding conditions apply for connection and operation. The need to customize the prosumer’s behaviour to allow the deployment of demand-response algorithms is also addressed in [28] as a solution for sharing resources in order to avoid an energy crisis (excessive prices). The load-only behaviour is already implemented in some market solutions where inverters [32] are designed for microgrids operating in island mode with an architecture integrating diesel generators (gen-set) to provide the missing energy when needed by the local energy ecosystem. This gen-set can be further emulated by a network connection with load-only behaviour. In [33] a “non-export” DC microgrid is presented for industrial and commercial sectors, pointing also to a reduction of interconnection fees and easier operation.
In UniRCon architecture we are focusing on the residential sector and its neighbourhood, and consider this uni-directional behaviour as a concept for developing resilient systems, both for energy supply and regulatory changes. The role of the common DC busbar for PV and storage connection, and extensions of the concept for neighbourhood resiliency, will be presented below. The UniRCon architecture offers enhanced cyber-security features, mainly due to the local relevance of the load-only behaviour of the considered system. The resilience is obtained in several ways: (a) resilience of the prosumer against regulatory changes, because investment assumes an independent ecosystem combining advantages of total self-consumption of locally produced energy while allowing acquisition of energy from the grid when local production is low or when the price of the energy from the grid is low; (b) resilience by design of the prosumer loads being supplied by an independent grid in cases of main grid failures; (c) on the grid side, the potential of increased resilience by reducing or even eliminating injections of stochastic generation in a scenario where all current and future prosumers adopt a design and operation similar to the UniRCon architecture. It is a win–win solution between the two parts—consumer/prosumer on the one side and the grid operator on the other side—having both the potential for implementing resilient behaviour, even if each of them may require opposing measures. This win–win situation is facilitated by the flexible, non-synchronous coupling between the main power system and the prosumer’s local system, compared with the rigid coupling specific to traditional systems.
The proposed prosumer architecture is presented in more detail in Figure 4, while introducing also a possible resilient AC network supplied by the DC network. We introduce the following notations in Figure 4, for describing the energy transfer on the AC-side of the prosumer’s network: PAC_TOT: AC power transferred from the DSO network to the prosumer; PAC_LL: AC power to supply existing (classical) loads on prosumer’ premises (internal microgrid); and PAC_IHM: AC power supplied from DSO grid to the UniRCon network.
Within UniRCon, the prosumer installations are acting on the principle of energy balance able to address resilience to the prosumer; therefore, we define PDC_IN: DC available power generated at the output of the AC/DC converter; and PAC_RESIL: AC power available at the output of the inverter which supplies the AC subnetwork of the UniRCon.

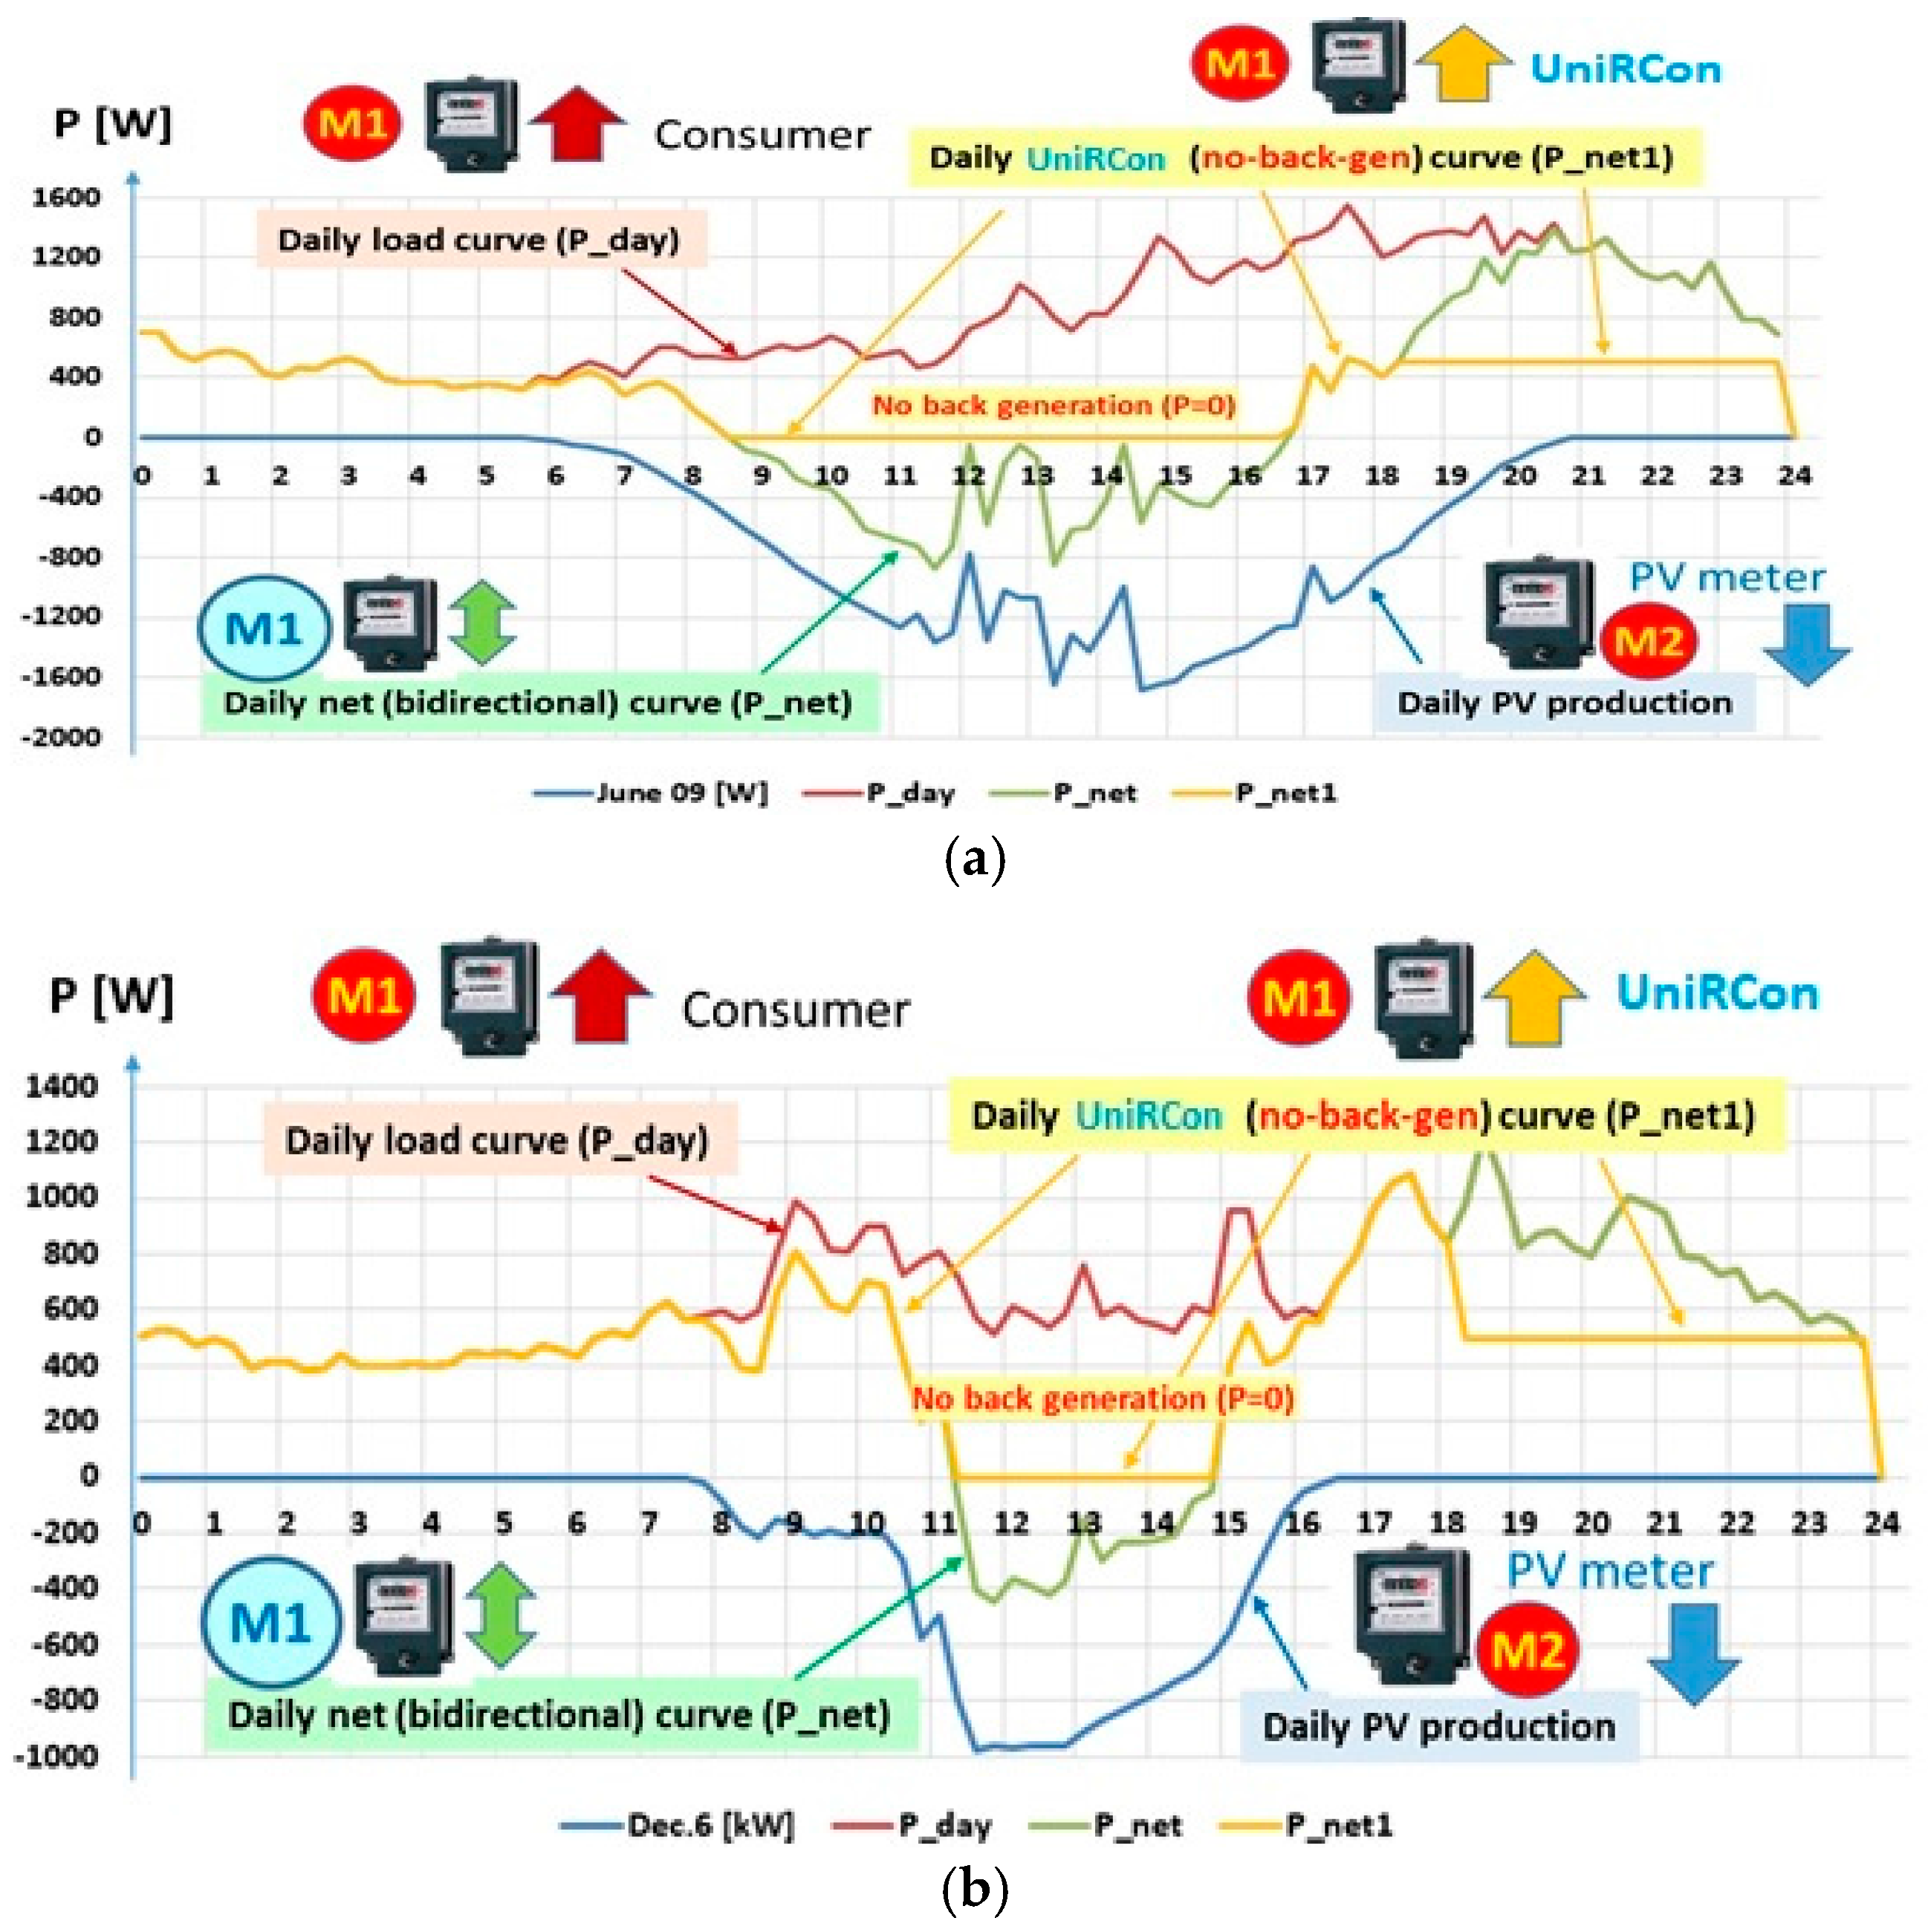
2.4. Numerical Simulation
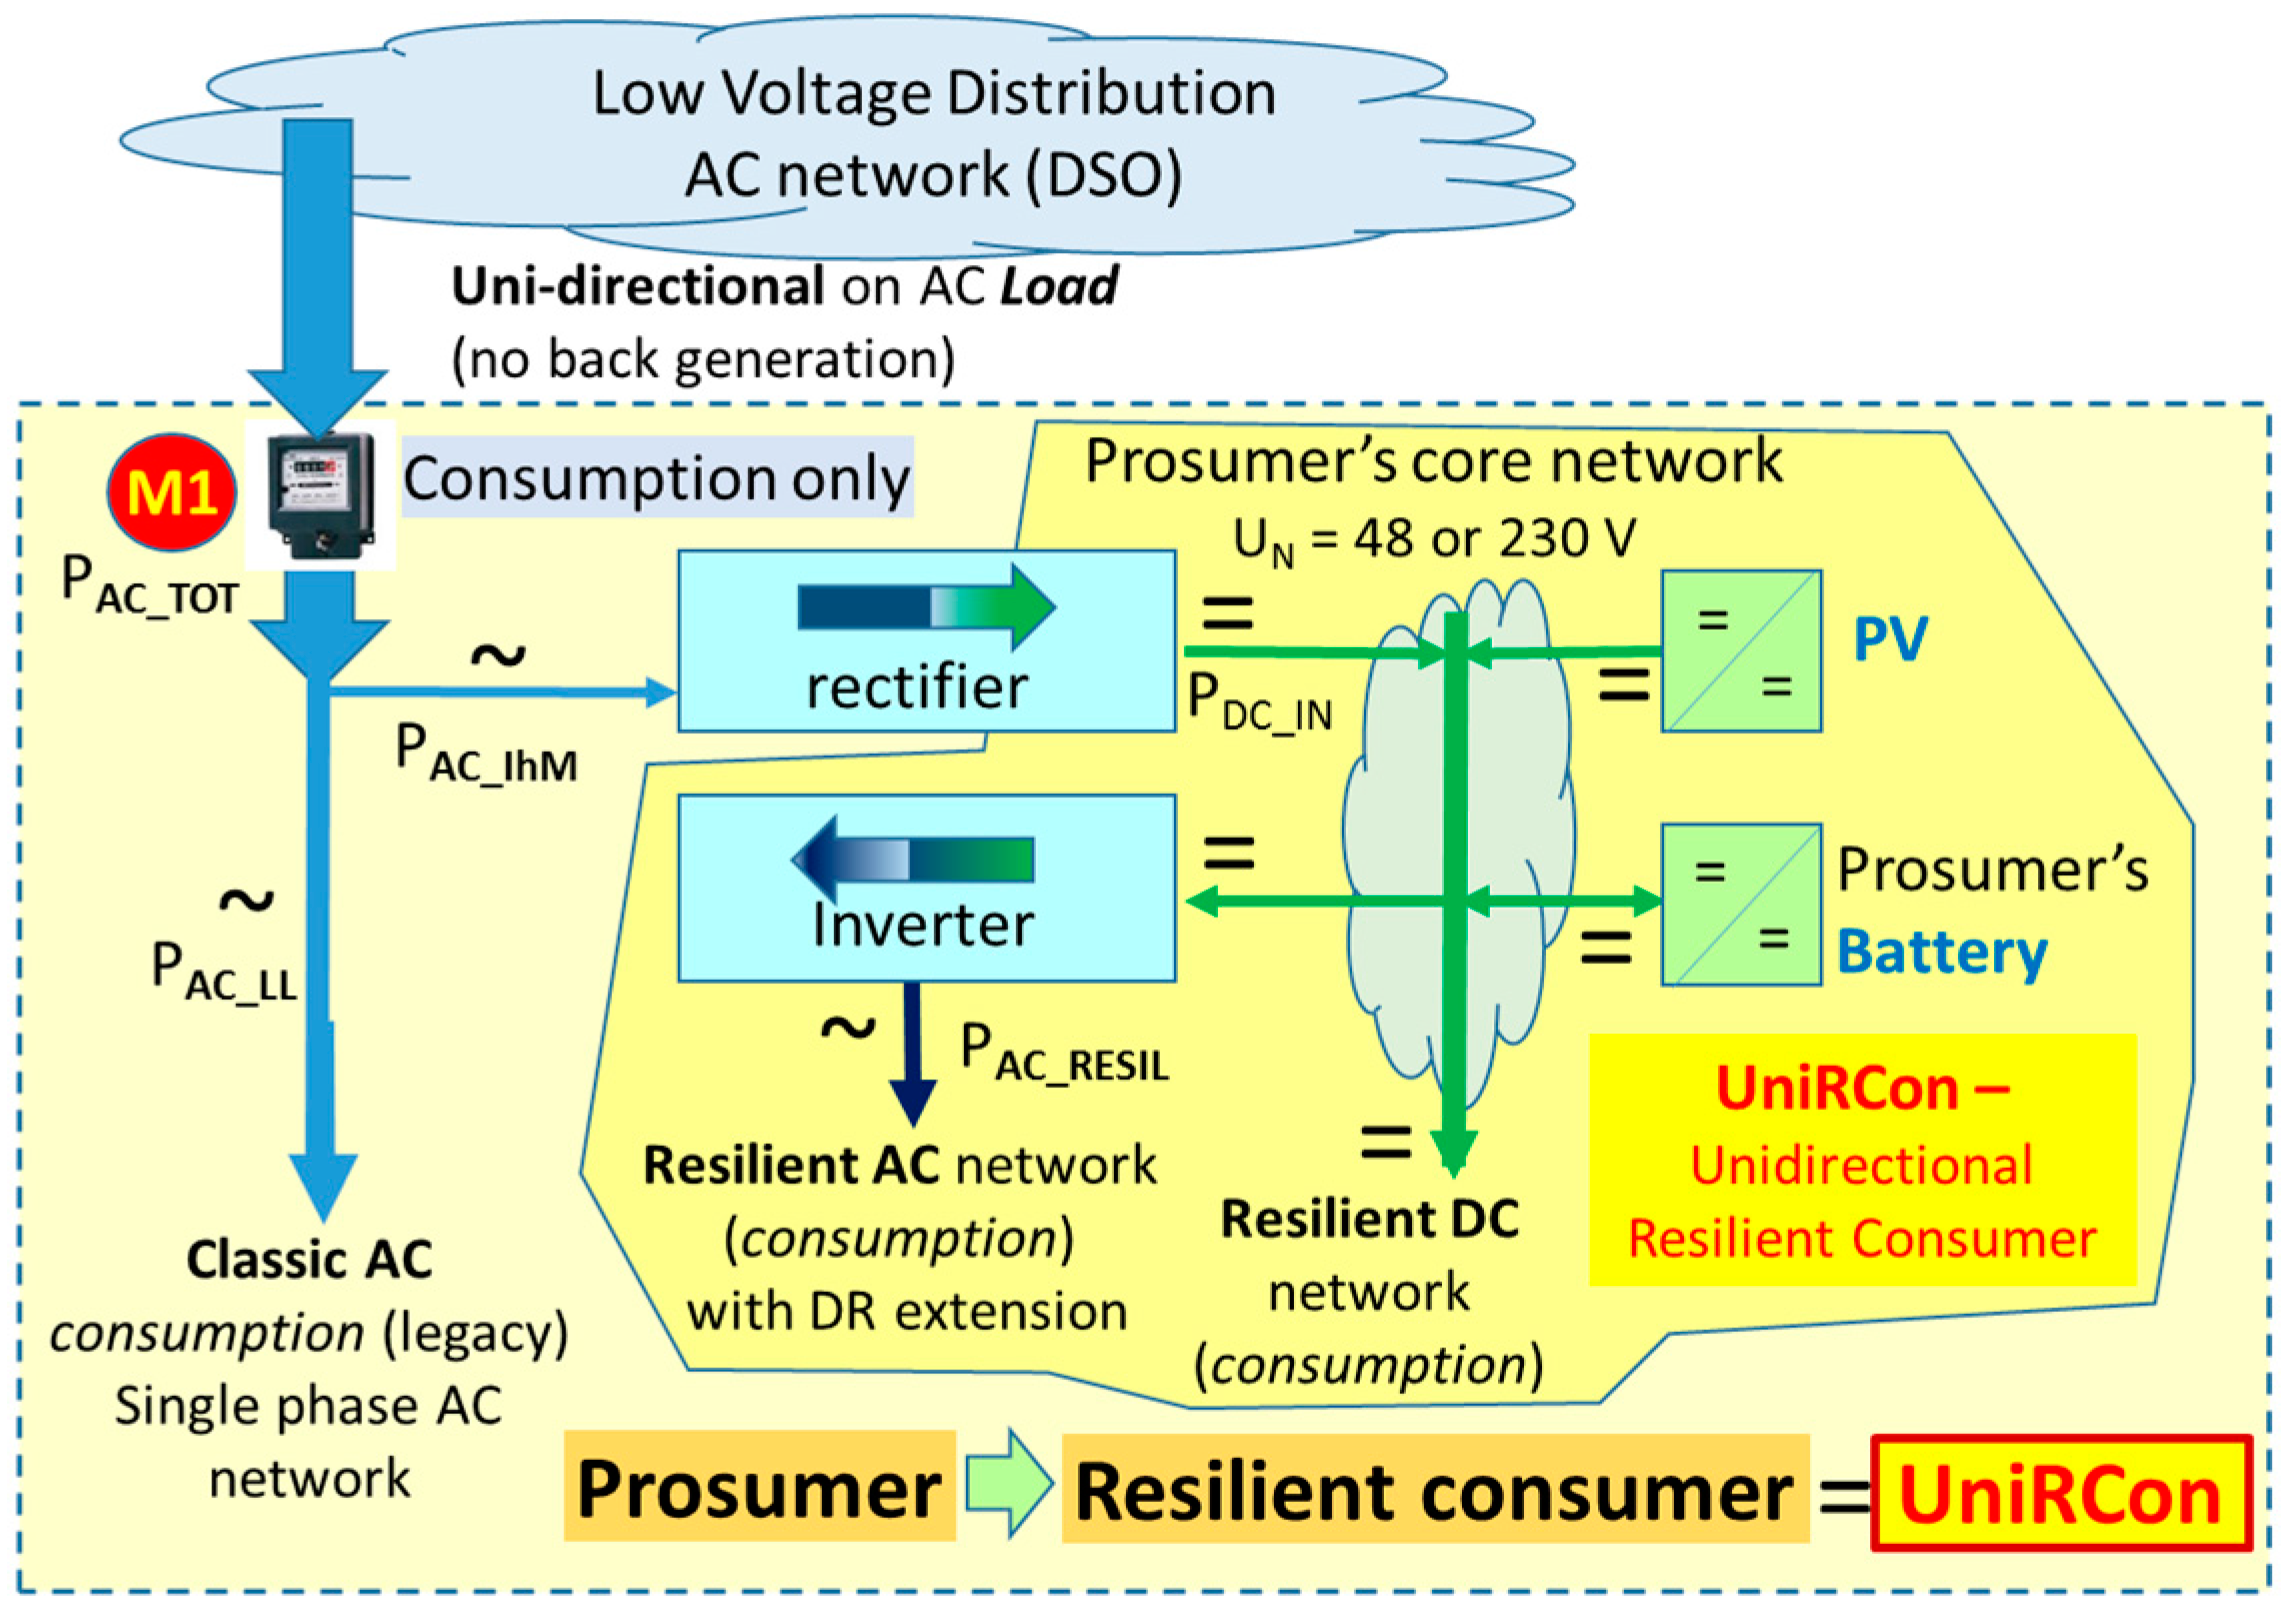
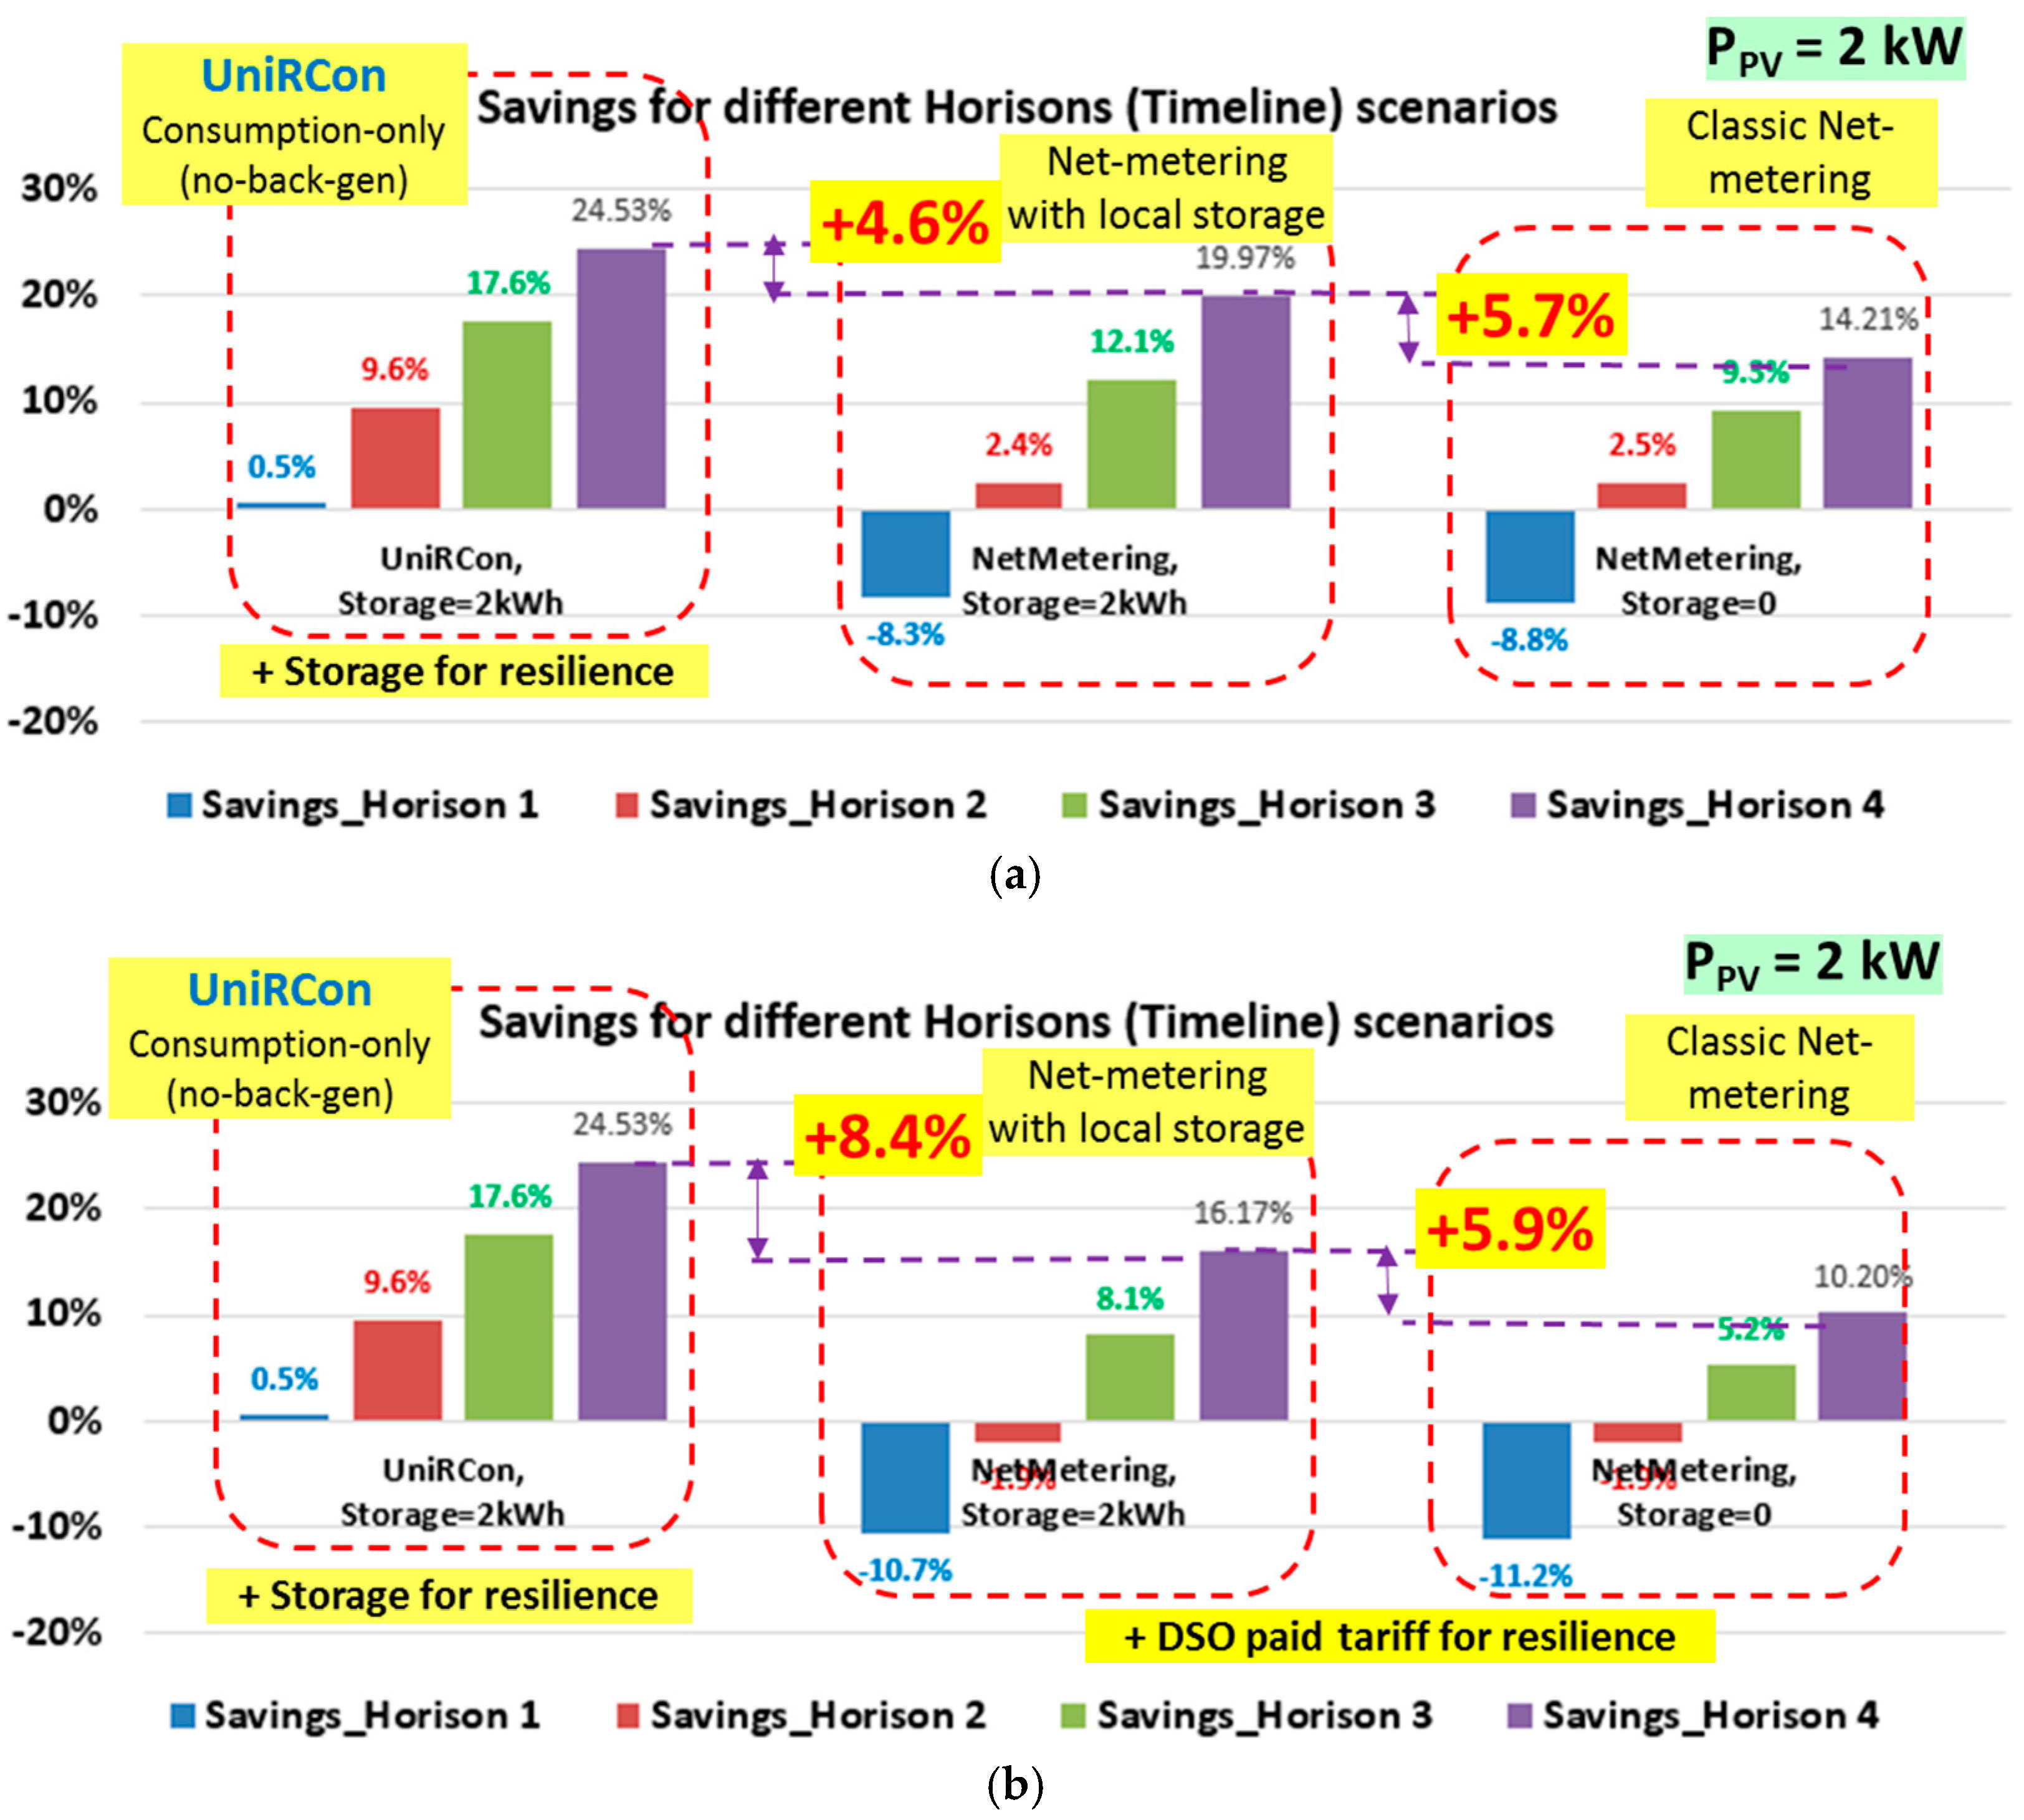
To analyse the UniRCon architecture, we use historical recorded data corresponding to typical days of PV generation coupled with a typical load curve. In the following examples, we consider data associated with the load characteristics of households in Romania and San Diego, California; For the Romanian case, the averaged profile on 14 days in October 2016 results in a daily energy consumptions of EDAY1 = 15.77 kWh. Based on measurements of PV production in southern Romania [34], we found typical days of electricity production with 6.32 kWh/day/kWp installed in one of the best summer days of 2016 (9 June 2016). Assuming a linear relationship between PV installed capacity and energy production, a 2 kWp PV installation will deliver twice as much power, i.e., 12.62 kWh/day, which is approximately 80% of the average daily consumption.
For selection of the storage capacity, we consider typical days in various seasons, where the daily time series of PV power production was derived from real measurements recorded every second and averaged to 15 min time intervals. The data comes from two locations from Europe and the USA in order to capture diverse climate conditions: (a) a rural site in southern Romania and (b) a metropolitan area in California. All the measurements were scaled to a PV system of 2 kWp. Prosumer identity is anonymized. Figure 5 shows five typical daily PV profiles, selected so as to span weather variations during an entire year: A totally sunny day (August 14) down to very low production during a cold period (29 November in Figure 5), also partially cloudy in different seasons.
The specific production on different days has been used to simulate the entire year of 2016 by combining production in such a way that an average of 1200 kWh/kW installed PV is reached, which is usually the yearly performance for this region.
Figure 6 shows the load curve of a typical household in SE Europe with a total of 19.5 kWh daily consumption (P_day) in summer (Figure 6a is the average in summer period) and 15.8 kWh daily consumption in winter (Figure 6b is the average for winter period, superimposed over the daily PV generated energy curve of 2 kWp PV-units, during two selected days from Figure 5: June 2016, Romania, in Figure 6a; and December 2016, Romania, in Figure 6b). Note that the summer typical consumption (19.5 kWh) was higher than the winter typical consumption (15.8 kWh), due to refrigerators and moderate air-conditioner use, even if during wintertime there is more use of lighting. The studied cases do not include electrical energy use for heating, such as gas heating, that is available. This can be considered a typical situation for southern Europe, and especially for SE Europe. Figure 6 shows also the daily net power exchanged with the distribution network ( P n e t and P n e t 1 ,   respectivelly ) in each typical day of summer and winter, for two different situations:
  • The net power, P n e t , defined as 15-min average power, corresponds to the net meter M1; this is a classic net metering associated with FiT schemes; the net metering performed by M1 indicates total energy transferred from the grid to the end-user;
  • The net power, P n e t 1 , is defined similarly and measured with the same net meter, however with the constraint that it describes uniquely the energy exchange between the grid and the end user, i.e., seen always as a load from the grid side. The excess power produced by the PV during the day is managed by the UniRCon architecture, able to control energy transfer to and from the battery or deploying demand-response algorithms.
In our test scenario, the peak-hour ramp in the evening is set with an excursion from zero to 500 W, compared to that from −800 W to +800 W (i.e., spanning 1600 W) in the net-metering situation; this means a significant reduction of the power excursion, with a positive impact on mitigation of the Californian duck-chart situation. Similar curves have been synthetically derived and analysed for a number of representative days and have been assessed in terms of savings and resilience under different scenarios, which correspond to near future timelines of the years 2018, 2020, 2022 and 2025.
To assess the four scenarios, market environment has been modelled by highlighting and valuing cost dynamics and technology trends for PV and storage-related equipment and curtailment.
Assumptions and constraints for the proposed model are summarized below:
  • A bottom-up approach is used, with a decision-logic subroutine for the daily scheduling of the battery (time of charge and discharge and amount of energy to be charged/discharged). This scheduling module is based on estimated average from past recorded data for PV and load demand. Thus, it is implemented as a deterministic model with perfect knowledge information. Note, however, that this approach does not affect the economic/technical calculations below. They indeed may influence a real-time operation of the system. The decision logic used for scheduling the battery is give in Figure 7.
  • For the simplicity of calculations, we have limited the number of daily cycles of the battery to 1, where the cycle is counted as a full charge and discharge. This approach helps to relate all cost calculations to a daily-basis approach. Note that partial charges and discharges are allowed within the day if their cumulative effect does not exceed a full cycle. This constraint is reflected in the fixed cost associated with the aging effect on the battery due to its utilization. It is estimated as a specified ratio for each kWh of stored energy, as it is defined in Equation (11) from Table 3 below. This cost may also reflect the operation or wear-out cost of a battery due to operation. Calendar aging of the battery was ignored. We differentiate the types of storage technologies according to the number of guaranteed cycles (full charge and discharge).
  • The inverter efficiency is considered in the proposed methodology by averaging the operation points and is taken as a constant for the rest of the calculations (European efficiency was used). The efficiency curve of an inverter is a highly non-linear curve with respect to their operation point. There is a lot of research underway where such curves are estimated and taken into account in the daily scheduling of a PV-battery system. Modelling the efficiency in such a form is, however, beyond the scope of this study, which looks at a long-term investment perspective rather than a daily scheduling method.
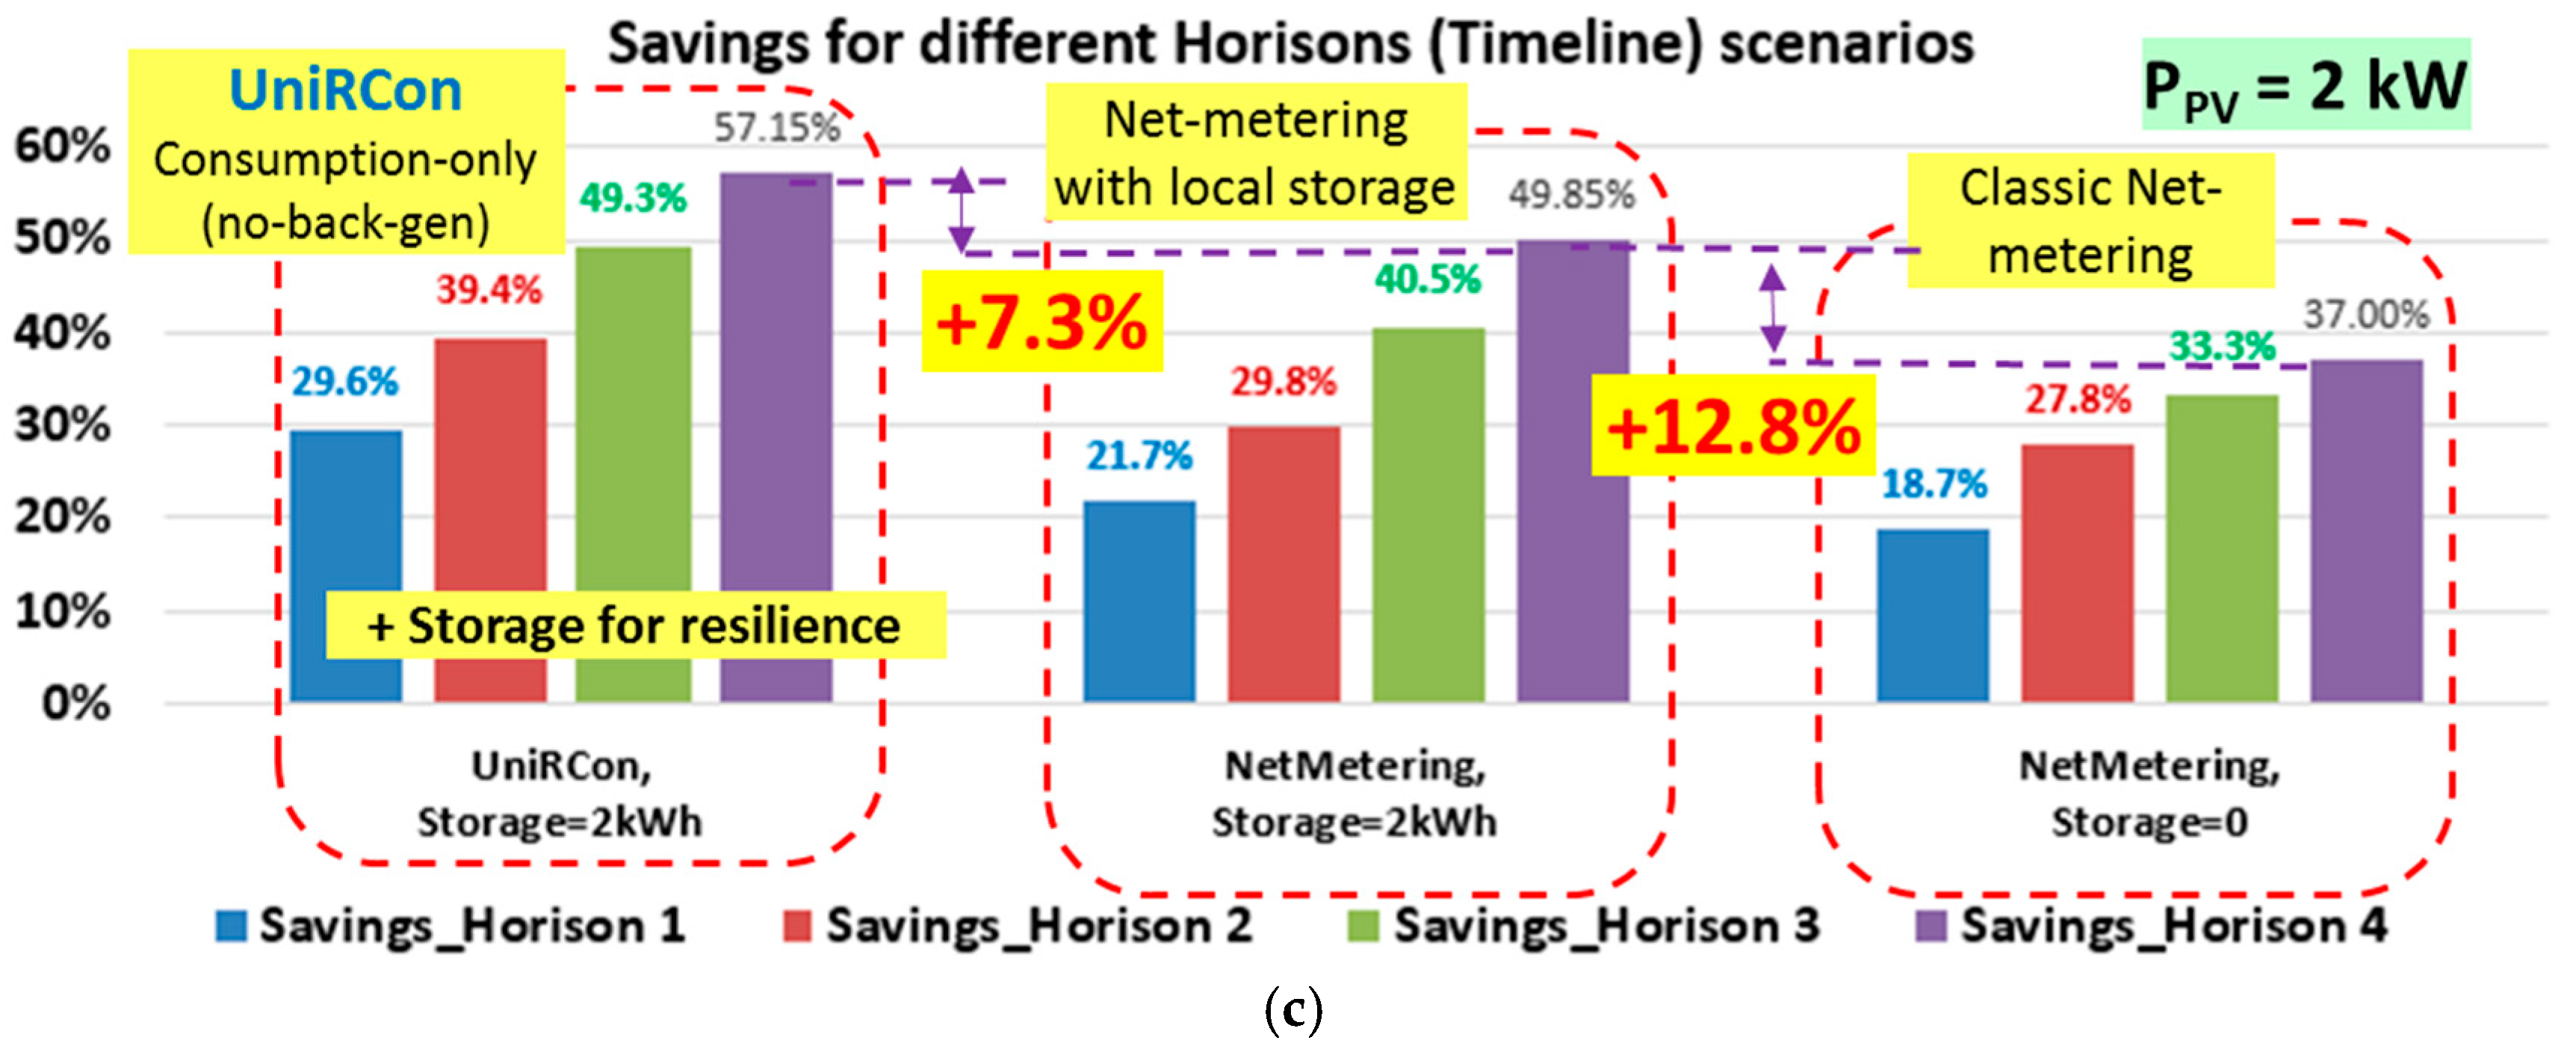
The rest of the calculations are based on a daily reference and they are summarized in Table 3.
In Equations (1)–(16), the daily consumed energy, ( E l o a d ) and the PV-produced energy ( E P V ) are calculated based on constant average powers at a certain interval ( Δ t ) , which in our case is of 15 min. The power at the level of utility net meter ( P n e t ) is calculated with (3). For our no-back-generation solution, we consider that the necessary energy for a battery is the time integral of active power which may be injected back into the network if no storage is present behind the meter ( E n e c b a t ). However, if a behind-the-meter battery with the capacity of S o C M A X is available, then the energy which may be effectively sent back into the grid is E P V 2 g r i d , shown in (5). Due to conversion efficiencies, we simplify the formula in (6), describing the PV energy used locally as being affected by the efficiency of inverters and DC–DC converters, which is higher in hybrid networks than in pure AC networks (ηTECHNx, with x = 1 for hybrid inverters and 2 for the internal DC bus in the hybrid micro-grid). The need for remaining energy to be purchased through a DSO grid is E u s e d D S O from (7).
The cost–benefit analysis derived from the quantities above is described by C E l o a d D S O , the cost of energy supplied through the external (DSO) network in case of classic consumer behaviour (scenario 1). All costs consider also VAT. Daily costs for using the PV and battery are presented in (10) and (11) and are based on a simplified approach related to return of investment, in Nyears for PV and Ncycles for battery.
Numerical simulation considers revenues (or savings) obtained from buying cheap energy from the energy market using a DSO network, by engaging unused PV battery capacity (12) with a market opportunity factor KM, and for the feed-in tariff of the PV energy sent back into the grid S a v s o l d e n , quantities that are both affected by curtailment factors (13). Finally, daily costs for a prosumer can be summed up with (14); this considers the energy losses in batteries and the cost of buying cheap energy during low PV-generation (e.g., in winter), and using the same storage set-up (batteries) as for the case above, now partially or totally unused. The daily savings are given by the difference between the cost of energy supplied only from a DSO, without any local investment (the user of which is not a prosumer at all, but just a regular consumer) and the daily costs of a prosumer. Relation (16) gives relative values of these savings, compared with the traditional costs of energy obtained from a DSO. Negative values show an unprofitable investment and positive ones show the level of profitability for a number of years. This saving key performance indicator (KPI) is employed to compare use-cases in different timelines (horizons).
Table 4 includes the input conditions that have been chosen for calculating the economic technical-economic analysis that enables comparison between the three use-cases. The horizons 1, 2, 3, and 4 correspond to expectations in the years 2018, 2020, 2022 and 2025 under the assumed variables and parameters presented in Table 4. The cost of energy ( C o s t D S O ) in line 4 includes VAT (this value may vary between countries, and the used values have been considered for Romania, and USA (California) where energy today is still cheap). Line 5 gives the input values for cheaper energy obtained from the AC grid based on opportunities ( C o s t D S O Δ C o s t D S O ). A mix between e.g., a night tariff and near real-time opportunities is considered, e.g., so called negative prices when renewable energy is in excess for short periods such as one to two hours.
Line 6 suggests modelling of the evolution of energy markets, which initially does not fully consider the opportunities for cheap energy because mechanisms on exploiting such opportunities need historic records; for example, situations with very low or negative prices due to excess renewables need near real-time ICT chains and proper market functionality. Also, multi-tariff solutions need smart metering rollout and this is also a matter of penetration over time. For addressing the evolution of the ability to use all of the energy market, cost-reduction opportunities (including flexible tariffs) are described by a “market opportunity factor”, which evolves in our model of calculation from a small use of opportunities (20%) to a high use of opportunities (80%).
Line 7 models the reduction in time of the feed-in tariff or green certificates, the reasons for considering new solutions with storage behind the meter. Lines 10 and 11 represent assumptions about the price of equipment in an AC-connected, grid-code compliant situation, and in standalone DC-grid operation; as it is difficult to input real prices even in today’s situation (different estimations or market prices being in a range from 1 to 2, we took two scenarios, one of which is more optimistic (a) and one of which is more classic (b), which may include also variations from country to country for accommodating the equipment, including the cost of installation. We show later that for both assumptions we obtain a similar ranking for the use-cases of the numerical simulations. Line 12 assumes an equivalent of 1200 h of maximum power of the PV installation, which is usual for Romanian territory (usually 1200 to 1350 h over the country) and which can be even bigger for southern Europe (Greece and Spain have places with 1300–1600 h equivalent). The number has been considered the same for all horizons (2018, 2020, 2022, 2025), but may increase if the PV technology is improved. Line 13 is the time for financial analysis, which has been simplified in this model for all use-cases, without interest or other aspects of a levelized cost of energy (LCOE) calculation, considering e.g., that the financing is eventually free, due to a support scheme. A real LCOE calculation may show lower benefits for all compared use-cases, but it does not affect the ranking. The scope of this work is mainly focused on the technical architectures that do not change a financial ranking of project financing. Line 18 gives an indication of the resilience factor, showing how much of a full day the prosumer can continue their activity without a grid connection. Lines 19 and 20 give estimated efficiencies for AC-connected PV and storage resources (line 19) and for the DC-connected resources and loads (line 20), as a simplified way to consider the total efficiency in both cases. Line 21 gives the starting point of the financial analysis. Line 22 proposes a daily tariff charged by a DSO in order to increase the resilience of the supply of the prosumer, in traditional situations, without the UniRCon solution; the value has been chosen at low-level (maximum €0.1/day in the last horizons, meaning only €3 /month), but this aspect makes the comparison with the UniRCon solutions fairer.
The assessment shows that, for each of the scenarios, there are three different use-cases:
(1)
The use-case labelled UC1-NM considers the net-metering operation in the existing way, with PV installations behind the meter and no storage on the prosumer’s grid side;
(2)
The use-case labelled UC2-NM+Stor deals with the same case of a net-metering operation, with PV behind the meter but additionally 2 kWh of energy storage in the prosumer installations (behind the meter), in order to enable local use of the PV-produced energy;
(3)
The use-case labelled UC3-UniRCon corresponds to a so-called no back-generation situation, where the prosumer has only consumption on the grid side, but uses PV production and internal storage to enable local energy use together with a resilience feature; the use-case considers 2 kWh of local energy storage, in order to compare with the second use-case (3 kWh and 4 kWh of storage have also been analysed, but they are relevant in future work).
Figure 8 presents the results from the example considered, showing the cost savings from each of the use-cases for all four timelines. Figure 8a is a simplified comparison among the costs of investment and energy costs in three use-cases and four horizons. The “negative savings” show that on a total-life basis (in Line 13 of the table above we selected 15 years), the investments are not covered during this time period and bring, in fact, losses (energy cost savings are lower than investment and operational costs). The positive values show that the simplified calculation demonstrates savings in energy use (energy-cost savings are higher than investment and operational costs). In the figure, in the model with no subsidies, only the UniRCon solution does not bring negative results in the 2018 horizon. The classic net-metering with or without storage suggests the need for subsidies if the investment is made in horizon 1 (2018, bars in blue) and only the Table 4 conditions of horizons 2 to 4 (2020, 2022, 2015, bars in red, green and magenta) give savings in the investment.
Figure 8b shows the cost savings from each of the use-cases for all four timelines by taking into consideration also a DSO tariff for increased resilience (€0.1 /day in horizon 2–4, as per Table 4). The savings of the UniRCon solution are, in this situation, 8.4% compared with 4.6% in the previous solution, thus making the UniRCon highly attractive compared with resilience measures taken by the DSO in its grid and compensated by a resilience small monthly tariff (or fee) of only €3, that being 4–5% of the bill for energy taken from the grid. Note that the increased resilience that can be provided by the DSO is still in terms of increased supply time and decreased number of interruptions, but does not fully comply with UniRCon immunity and resilience.
Note that in the UniRCon no-back-generation situation, additional storage is considered for supporting resilience during power outages, which increases from the year 2018 up to the year 2025 timelines, with corresponding additional costs. The storage used for resilience is chosen in such a way that it brings for the 2018 horizon an average of 5 min of resilience—sufficient to pass a short time, and up to 30 min of resilience in year 2025, when storage technology is expected to be much cheaper than today. Cheaper storage may improve the resilient behaviour even more.
The scenario described above is derived from daily average consumption of a selected residential point having ECONS(day) = 15.8 kWh, with PPV = 2 kWp, and by treating the consumption and production versus storage in all use-cases for typical days from Figure 5, with daily electricity production of 12.6 kWh, 7.54 kWh, 4.36 kWh and 0.26 kWh, respectively (covering all seasons’ production expectancy); this corresponds to an operation of 1200 h/year at rated PV peak power.
In the specific case studied, we have higher cost savings in the no-back-generation situation (use-case UC3-UniRCon) compared with the classic net-metering of PV with or without storage behind the meter (+4.6% compared with UC2-NM+Stor, which also yields 5.7% higher savings compared with classic net-metering without storage, UC1-NM). The percentage values correspond to the cost of installation related to PV and storage, as presented in Table 4, showing that even on a different cost scenario, UniRCon remains a slightly better savings option, while the advantages related to resilience to grid outages as well as to changes in regulations are better than the classic use-cases (PV and PV+Storage behind the meter).
If the DSO introduces a tariff for increasing resilience (longer period of delivery, smaller number of interruptions), the difference in UniRCon savings compared with storage behind the meter increases to 4.8%, suggesting that it is better to invest in local immunity/resilience to mitigate DSO interruptions; it is also possible that €0.1/day for increasing DSO resilience (which is only around 4–5% of the energy bill if this is purchased from the DSO grid) may not bring similar results at the DSO level, because of the legacy AC design of the grid, which may need more complicated and expensive measures such as microgrid technologies, including grid-based storage.
In order to verify the positive results in another environmental situation, a similar analysis has been made for a house with a roof PV in San Diego, California. The conditions are different, with latitude around 32.5 degrees and sunny weather almost all the time (by comparison, Bucharest has latitude 44.2 degrees and much lower PV production during the wintertime, as seen in Figure 5). The house has a 6 kWp PV, which has been downscaled to 2 kWp, in order to satisfy the design characteristics of UniRCon, meaning that the production on the best sunny days does not exceed consumption in the same period. The price for energy is USD$0.19 and the feed-in tariff only $0.04, which offers a good opportunity for storage, because of the big gap between the tariffs. Moreover, nearly all days are sunny, even in winter, and the difference in production from winter to summer is not very high.
The comparison of savings between the use-cases is presented in Figure 8c. A small increase of price is considered over the four horizons, from $0.19 to $0.22 /kWh and also the FiT decreases from $0.04 to zero /kWh till 2025 (no back-generation is encouraged). It can be seen that the savings are high in any situation, due to the gap between the energy and feed-in tariffs, but also due to the fact that there is good PV production over the whole year. However, there is still a big difference between net metering and storage behind the meter (12.8% in the studied case) and there are still additional savings with the UniRCon solution versus storage behind the meter (7.3% more savings for UniRCon).
For both latitudes and for both environments’ very different conditions, the UniRCon architecture gave positive results in terms of additional savings (4.6–8.4% in Figure 8 above), which are also achieved with a small supply immunity/resilience of more than 30 min without DSO supply, even without considering additional optimisation of consumption for critical loads only. The analysis also suggests that resilience by design may also reduce in the future the constraints for DSO power quality in terms of KPIs such as the system average interruption duration index (SAIDI) or system average interruption frequency index (SAIFI), thus creating room for a new approach by the distribution-supplying resilient entities.

3. Expanding the Architecture towards Community-Level Energy Exchange

In the previous section, it has been shown that the UniRCon solution has several advantages over the traditional integration of renewables, and also when electricity storage is considered. In the individual solution shaped in Section 2, the UniRCon operation as always-a-load (from the DSO side) is enabled by considering PV production (or other specific distributed energy resources (DER)) as always the source of the excess energy production versus consumption including storage and as such always ensuring a no-back-generation mode.
However, in energy communities, either neighbours within buildings or small districts or in villages, some energy actors may be not in the position to have their own production. Therefore, one can build on local collaboration strategies, still keeping no back-generation to the traditional AC grid. By exchanging energy in the neighbourhoods with resilience against power outages as main goal, the UniRCon architecture can be expanded. Figure 9 introduces the added module for exchanging DC-based energy through a common DC bus at the neighbourhood level. The DC–DC module, which is depicted in dark green, allows the exchange of energy between the local resilient bus and the neighbourhood common DC bus. It is expected that UniRCon extension will bring all the advantages already presented for the single prosumer architecture: high resilience and increased efficiency, and business as usual on the AC-distribution network.
Figure 10 extends the view into the neighbourhood and shows the exchange between neighbours as resilient prosumers or consumers. Figure 11 shows the UniRCon cluster obtained by aggregating all UniRCons with an equivalent consumption C1—without any generator connected to the grid—and all the other consumers can be aggregated in C2. With adequate implementation, the UniRCon equivalent can be introduced, allowing a significant reduction of model complexity which further enables improvement of grid operation and appropriate plans for increasing resilience.
A good design in dimensioning UniRCon internal generation + storage resources allows keeping it as an equivalent consumer—which is a good situation for a DSO claiming “business as usual” for their distribution grid. Moreover, if the DSO allowances for connecting bulk generation are well balanced with LV-network consumption, the MV (medium voltage)/LV (low voltage) transformer may also be kept in a uni-directional flow of energy. Such strategies are relevant for win–win situations, as the network operation enables stability and the prosumers are more resilient and can handle more efficiently the energy transfer, with citizens being empowered. The solution may apply in small and larger communities, being as such a good starting point for designing the resilient Smart Cities of tomorrow as well.

4. Conclusions

The paper introduces the UniRCon architecture whereby prosumers owning local electricity generation capacity such as PV can use an adequate storage control to transform their operation in a way that emulates the always-a-consumer from the perspective of the DSO, with several advantages. On the utility side: reverse flow is avoided; the traditional load behaviour, for which the network has been designed, is maintained; production stochastic behaviour is not present in the grid and the load behaviour can be more predictable; finally, the grid has the potential for increasing its resilience. On the prosumer’s side: full control of local electricity inflow and energy balance, with the prospect of achieving better grid stability due to a reduction of effective grid-connected generators. Moreover, the operation in this load-only mode—labelled as UniRCon—allows the deployment of new optimization strategies. The prosumer’s resilience to regulatory changes and unexpected grid outages are the main targets of the paper. We have proved that the proposed architecture might be economically viable given specific assumptions and that it also allows for measures to increase grid resilience. The paper compares three use-cases: classic net-metering, net metering with additional storage, and resilient prosumer with a load-only pattern. The analysis was undertaken for four time horizons, (2018, 2020, 2022 and 2025). The results have shown that for the three use-cases (a specific point in the city of Bucharest, Romania), net metering with storage is superior in terms of prosumer savings (5.7% savings in classic net-metering with storage, and an additional 4.6% in the UniRCon architecture), when compared with classic net-metering; this is achieved because storage enables more auto-consumption when compared with feed-in based back injection. Moreover, by considering also in classic solutions a small tariff for DSO-based increased resilience, the UniRCon solution increases the savings even more (8.6% when compared with the classic storage behind the meter), while providing increased resilience to the prosumer. The results are similar for the second prosumer case (a location near San Diego, California), for which the UniRCon concept resulted in 7.3% savings as compared with storage behind the meter.
The UniRCon solution allows the integration of a DC bus on the prosumer premises, suitable for PV panels and storage. This architecture is even more attractive than storage-based net metering, and it results in additional savings (4.3% versus 6.7%). This can be explained by the higher efficiency of conversion and local energy use, a less-sophisticated connection of loads, and the capacity to achieve a local optimum energy use. We conclude that the UniRCon set-up, ensuring a load-only pattern on the distribution grid side, is superior to classic net-metering—with or without storage behind the meter—in both aspects: savings and resilience (e.g., the 2025 horizon results in higher savings and allows 30 min of resilience, making the UniRCon more tolerant to most grid outages).
For the end-customer, UniRCon is a balanced solution between business as usual, full dependence on the synchronous main grid, by taking advantage of supply from the main grid when renewable energy is missing for long periods or when grid energy is very cheap, and full defection, which may require expensive and high storage needs. It enhances how prosumer immunity and resilience take full advantage of energy decentralisation, and opens the path for network hybridisation with a coexistence of AC and DC networks by using emerging DC-grid technologies.
Future work will also consider equivalent costs on the grid side in order to increase resilience and/or decrease outages, as these grid-related costs lead to higher gaps between the savings of the two solutions.

Acknowledgments

This work has been undertaken within the framework of the European Union’s Horizon 2020 research and innovation programme under the Storage4Grid project grant agreement No. 731155, by Portugal national funds through FCT—Fundação para a Ciência e a Tecnologia, under project UID/EEA/00066/2013 and by DCNextEve project grant agreement No. 708844.

Author Contributions

Mihai Sanduleac proposed, design and implemented major parts of the proposed architecture, and the methodology approach. He designed the structure of the manuscript and wrote the major parts. Irina Ciornei contributed to the overall writing of the text, especially the mathematical formulation, proposed several adjustments in the methodology and designed the rule-based scheduling mechanism for the battery scheduling in the UniRCon architecture. Mihaela Albu contributed to the design of the architecture, and to the methodology proposed together with the main author, revised several versions of the manuscript, and contributed to the interpretation of results and conclusions. Lucian Toma contributed to revision, writing and formatting of the manuscript. Marta Sturzeanu helped at the implementation of the methodology, writing of the manuscript and analysis of the results. João F. Martins helped in shaping the methodology, revised several versions of the manuscript, and contributed to the analysis of results and conclusions.

Conflicts of Interest

The authors declare no conflicts of interest.

References

  1. Lott, M.C.; Kim, S.-I.; Tam, C.; Houssin, D.; Gagné, J.-F. Technology Roadmap EnergyStorage; Energy Technology Perspective; IEA: Paris, France, 2014; pp. 1–60. [Google Scholar]
  2. ENTSO-E Network Code on Requirements for Grid Connection Applicable to All Generators RfG), ENTSO-E: 17 May 2016. Available online: http://eur-lex.europa.eu/legal-content/EN/TXT/?uri=OJ%3AJOL_2016_112_R_0001 (accessed on 2 August 2017).
  3. Denholm, P.; O’Connell, M.; Brinkman, G.; Jorgenson, J. Overgeneration from Solar Energy in California. A Field Guide to the Duck Chart; NREL: Denver, CO, USA, 2015; pp. 1–46. [Google Scholar]
  4. Kies, A.; Schyska, B.U.; von Bremen, L. Curtailment in a highly renewable power system and its effect on capacity factors. Energies 2016, 9, 510. [Google Scholar] [CrossRef]
  5. Golden, R.; Paulos, B. Curtailment of renewable energy in California and beyond. Electr. J. 2015, 28, 36–50. [Google Scholar] [CrossRef]
  6. Kies, A.; Schyska, B.U.; von Bremen, L. The demand side management potential to balance a highly renewable European power system. Energies 2016, 9, 955. [Google Scholar] [CrossRef]
  7. European Commission. Best Practices on Renewable Energy Self-Consumption; Working Document; European Commission: Brussels, Belgium, 2015. [Google Scholar]
  8. EURELECTRIC. Prosumers—An Integral Part of the Power System and the Market; Eurelectric Paper; EURELECTRIC: Brussels, Belgium, 2015. [Google Scholar]
  9. European Consumer Organization. Building a Consumer-Centric Energy Union; Position Paper; European Consumer Organization: Brussels, Belgium, 2015. [Google Scholar]
  10. Bourazeri, A.; Pitt, J.; Almajano, P.; Rodriguez, I.; Lopez-Sanchez, M. Meet the meter: Visualising smartgrids using self-organising electronic institutions and serious games. In Proceedings of the 2012 IEEE Sixth International Conference on Self-Adaptive and Self-Organizing Systems Workshops, Lyon, France, 10–14 September 2012; pp. 145–150. [Google Scholar]
  11. Rathnayaka, A.D.; Potdar, V.M.; Dillon, T.S.; Hussain, O.K.; Chang, E. A methodology to find influential prosumers in prosumer community groups. IEEE Trans. Ind. Inform. 2014, 10, 706–713. [Google Scholar] [CrossRef]
  12. Rathnayaka, A.J.D.; Potdar, V.M.; Dillon, T.; Hussain, O.; Kuruppu, S. Goal-oriented prosumer community groups for the smart grid. IEEE Technol. Soc. Mag. 2014, 33, 41–48. [Google Scholar] [CrossRef]
  13. Che, L.; Zhang, X.; Shahidehpour, M.; Alabdulwahab, A.; Abusorrah, A. Optimal interconnection planning of community microgrids with renewable energy sources. IEEE Trans. Smart Grid 2017, 8, 1054–1063. [Google Scholar] [CrossRef]
  14. Ubilla, K.; Jiménez-Estévez, G.A.; Hernádez, R.; Reyes-Chamorro, L.; Irigoyen, C.H.; Severino, B.; Palma-Behnke, R. Smart microgrids as a solution for rural electrification: Ensuring long-term sustainability through Cadastre and business models. IEEE Trans. Sustain. Energy 2014, 5, 1310–1318. [Google Scholar] [CrossRef]
  15. Ottesen, S.Ø.; Tomasgard, A.; Fleten, S.-E. Prosumer bidding and scheduling in electricity markets. Energy 2016, 94, 828–843. [Google Scholar] [CrossRef]
  16. Paunescu, C.I.; Zabava, T.; Toma, L.; Bulac, C.; Eremia, M. Hardware home energy management system for monitoring the quality of energy service at small consumers. In Proceedings of the 2014 16th International Conference on Harmonics and Quality of Power (ICHQP), Bucharest, Romania, 25–28 May 2014; pp. 24–28. [Google Scholar]
  17. Gautier, A.; Jacqmin, J.; Poudou, J.C. The prosumer and the grid. In Proceedings of the 65th Annual Meeting of the French Economic Association, Nancy, France, 27–29 June 2016. [Google Scholar]
  18. Hesse, H.C.; Martins, R.; Musilek, P.; Naumann, M.; Truong, C.N.; Jossen, A. Economic optimization of component sizing for residential battery storage systems. Energies 2017, 10, 835. [Google Scholar] [CrossRef]
  19. Chen, S.X.; Gooi, H.B.; Wang, M.Q. Sizing of energy storage for microgrids. IEEE Trans. Smart Grid 2012, 3, 142–151. [Google Scholar] [CrossRef]
  20. Jung, S.; Kim, D. Pareto-efficient capacity planning for residential photovoltaic generation and energy storage with demand-side load management. Energies 2017, 10, 426. [Google Scholar] [CrossRef]
  21. Nobre, A.M.; Severiano, C.A.; Karthik, S.; Kubis, M.; Zhao, L.; Martins, F.R.; Pereira, E.B.; Rüther, R.; Reindl, T. PV power conversion and short-term forecasting in a tropical, densely-built environment in Singapore. Renew. Energy 2016, 94, 496–509. [Google Scholar] [CrossRef]
  22. Li, Z.; Zang, C.; Zeng, P.; Yu, H. Combined two-stage stochastic programming and receding horizon control strategy for microgrid energy management considering uncertainty. Energies 2016, 9, 499. [Google Scholar] [CrossRef]
  23. Olivares, D.E.; Mehrizi-Sani, A.; Etemadi, A.H.; Cañizares, C.A.; Iravani, R.; Kazerani, M.; Hajimiragha, A.H.; Gomis-Bellmunt, O.; Saeedifard, M.; Palma-Behnke, R.; et al. Trends in microgrid control. IEEE Trans. Smart Grid 2014, 5, 1905–1919. [Google Scholar] [CrossRef]
  24. Verschae, R.; Kato, T.; Matsuyama, T. Energy management in prosumer communities: A coordinated approach. Energies 2016, 9, 562. [Google Scholar] [CrossRef]
  25. Zhou, N.; Liu, N.; Zhang, J.; Lei, J. Multi-objective optimal sizing for battery storage of PV-based microgrid with demand response. Energies 2016, 9, 591. [Google Scholar] [CrossRef]
  26. Wade, N.S.; Taylor, P.C.; Lang, P.D.; Jones, P.R. Evaluating the benefits of an electrical energy storage system in a future smart grid. Energy Policy 2010, 38, 7180–7188. [Google Scholar] [CrossRef] [Green Version]
  27. Christoforidis, C.G.; Panapakidis, P.I.; Papadopoulos, A.T.; Papagiannis, K.G.; Koumparou, I.; Hadjipanayi, M.; Georghiou, E.G. A model for the assessment of different net-metering policies. Energies 2016, 9, 262. [Google Scholar] [CrossRef]
  28. Razzaq, S.; Zafar, R.; Khan, A.N.; Butt, R.A.; Mahmood, A. A novel prosumer-based energy sharing and management (PESM) approach for cooperative demand side management (DSM) in smart grid. Appl. Sci. 2016, 6, 275. [Google Scholar] [CrossRef]
  29. Sha, A.; Aiello, M. A novel strategy for optimising decentralised energy exchange for prosumers. Energies 2016, 9, 554. [Google Scholar] [CrossRef]
  30. Truong, N.C.; Naumann, M.; Karl, C.R.; Müller, M.; Jossen, A.; Hesse, C.H. Economics of residential photovoltaic battery systems in Germany: The case of Tesla’s Powerwall. Batteries 2016, 2, 14. [Google Scholar] [CrossRef]
  31. Weniger, J.; Tjaden, T.; Quaschning, V. Sizing of residential PV battery systems. Energy Procedia 2014, 46, 78–87. [Google Scholar] [CrossRef]
  32. EFFEKTA Regeltechnik GmbH AX-Series, Hybrid, Solar Inverter, PV Inverter, UPS. Available online: http://www.effekta.com.de/AX-Series (accessed on 14 August 2017).
  33. California Public Utilities Commission. Bosch DC Microgrid Project; California Public Utilities Commission: San Francisco, CA, USA, 2015.
  34. Sistem Fotovoltaic off Grid/Cu Stocare—Alaska Fotovoltaice (in Romanian). Available online: http://www.alaska-energies.ro/sisteme-fotovoltaice-rezidential/sistem-fotovoltaic-off-grid/ (accessed on 1 March 2017).
Figure 1. Californian duck curve, specific to high solar penetration. Simplified view from [3].
Energies 10 01941 g001
Figure 2. Usual architectures for today’s prosumers: (a) PV behind the meter connected on the AC internal network and directly connected to the distribution system operator (DSO) grid; (b) PV and storage behind the (net) meter connected to the AC grid operated by DSO; (c) PV and storage behind the (net) meter connected through a hybrid inverter that allows supply of the loads in the islanding mode of operation.
Energies 10 01941 g002
Figure 3. Renewables connected in an architecture allowing a resilient consumer behind the meter, labelled UniRCon (Uni-directional Resilient Consumer), with all-time load only behaviour on an AC low-voltage network.
Energies 10 01941 g003
Figure 4. Proposed resilient architecture of the advanced prosumer (UniRCon).
Energies 10 01941 g004
Figure 5. Electricity generation from a 2 kWp PV installation on representative days across the year.
Energies 10 01941 g005
Figure 6. (a) Typical household electricity consumption, production and net-metered energy curves for one specific day in June 2016; (b) typical household electricity consumption, production and net-metered energy curves for one specific day in December 2016.
Energies 10 01941 g006
Figure 7. Decision logic for scheduling the battery operation under a predefined capacity of the battery.
Energies 10 01941 g007
Figure 8. (a) Cost-savings (example) comparison for the three use-cases: net metering with or without storage and UniRCon (no-back-generation) solution—investment costs based on Table 4; (b) cost savings (example) comparison for the three use-cases: net metering with or without storage and UniRCon (no-back-generation) solution—investment costs based on Table 4 and DSO tariff for resilience; (c) cost savings (example) comparison for the three use-cases: net metering with or without storage and UniRCon (no-back-generation) solution for a house in San Diego, California.
Energies 10 01941 g008aEnergies 10 01941 g008b
Figure 9. Extension of the resilient architecture of the prosumer.
Energies 10 01941 g009
Figure 10. Extension in the neighbourhood (community-level) energy exchange.
Energies 10 01941 g010
Figure 11. An operation with increased network security, by having a reduced number of energy injection points in the network and with the potential of increasing main-grid resilience through “friendly” connected UniRCon clusters.
Energies 10 01941 g011
Table 1. Summary of the literature surveyed.
Regulatory AspectsEconomic Evaluation of Photovoltaic–Battery Energy Storage (PV–BESS) SystemsSingle Microgrid (MG) ApproachCommunity of MGs and/or Energy-Hubs
[2,3,4,5,7,8,9,26][13,18,19,20,27,28][23,24][11,12,13,14,22,29]
Table 2. Mathematical explanation of the proposed Uni-directional Resilient Consumer (UniRCon) paradigm.
(i) K P V 2 l o a d [ 0 , 1 ] K P V 2 l o a d is a sub-unitary factor
(ii) E P V E l o a d E P V is the total energy produced by the PV installation during the day, in (kWh)
(iii) E P V = K P V 2 l o a d · E l o a d E l o a d is the total energy consumed during the day, in (kWh)
Table 3. Mathematical model for the comparative calculations.
(1) E l o a d =   Σ t = 0 T P t l o a d · Δ t t { 0 T } E l o a d   is the total energy needed during the day to supply the total aggregated loads, in (kWh);
P t l o a d , is the average measured power consumption within the time step, in (kW);
t is the time index used in the discretization of the time horizon into 15 min time-interval recordings;
Δ t =   0.25 is a ratio equivalent with 15 min recordings;
T = 24 (h) is the time interval for a day in hours.
(2) E P V =   Σ t = 0 T P t P V · Δ t t { 0 T } E P V is the total energy produced by the PV installation during the day, in (kWh).
(3) P t n e t = ( P t l o a d P t P V ) t { 0 T } P t n e t is the net-metering power balance (for each time interval δ t = 15   min ), in (kW).
(4) E n e c b a t = Σ t = 0 T P t n e t · Δ t E n e c b a t is the estimated value of daily energy that needs to be stored by the battery energy storage systems (BESS) in UniRCon architecture, in (kWh).
(5) E P V 2 g r i d = {   E n e c b a t ,   i f   E n n e c b a t < S o C M A X S o C M A X ,   i f   E n n e c b a t > S o C M A X E P V 2 g r i d is the energy sent back to the grid, (kWh);
S o C M A X is the maximum allowable state of charge of the BESS, in (kWh).
(6) E s e l f P V = ( E P V E P V 2 g r i d ) · η TECHNx (kWh) E s e l f P V is the portion of PV power that is used locally (self-consumption), in (kWh);
η TECHNx is the average efficiency of the inverter.
(7) E u s e d D S O = E l o a d E s e l f P V Energy coming from the DSO, in (kWh).
(8) C E l o a d D S O = C o s t D S O · E l o a d Total daily cost of the energy if all loads are supplied with energy from the DSO, in (€);
C o s t D S O is the unit cost of energy purchased from the DSO, in (€/kWh).
(9) C E u s e d D S O = C o s t D S O · E u s e d D S O Total daily cost of the energy purchased from the DSO, in (€).
(10) C d a y P V = P n o m i n a l P V · C p e r I n s t a l l e d k W p P V N H y e a r · N y e a r s · 24 C d a y P V is the estimated fixed daily cost for the PV system, in (€);
P n o m i n a l P V (kW) is the installed PV capacity;
C p e r I n s t a l l e d k W p P V is the fixed cost per unit of kWh of PV produced energy (€/kWh);
N H y e a r is the total number of hours within a year (h/year);
N y e a r s total number of simulated years (years).
(11) C d a y b a t = ( E n e c 4 P V b a t + E r e s i l b a t ) · C p e r I n s t a l l e d k W h b a t N c y l c e s C d a y b a t is the fixed daily cost for the BESS, in (€).
E n e c 4 P V b a t is the battery-installed energy necessary for increasing PV self-consumption, in (kWh);
E r e s i l b a t is the installed energy required for resilience, in (kWh);
C p e r I n s t a l l e d k W h b a t is the fixed cost per unit of kWh of battery storage, in (€/kWh);
N c y l c e s total number of guaranteed cycles for the respective BESS technology, in (p.u.).
(12) S a v c h e a p e n = E b u y c h e a p b a t · Δ Cost D S O · k M S a v c h e a p e n are opportunity savings when using the battery to buy energy from the grid when it is cheap and use it when it is expensive, in (€);
E b u y c h e a p b a t amount of energy purchased at low prices from DSO and stored in the battery for later use, in (kWh);
Δ Cost D S O difference in tariffs (e.g., day-night or real-market prices), in (€/kWh);
k M coefficient capturing the market opening for opportunities (p.u).
(13) S a v s o l d e n = E P V 2 g r i d · ( 1 k c u r t a i l ) · Cost s o l d DSO S a v s o l d e n are the savings for sold energy, in (€);
k c u r t a i l curtailment factor for PV excess energy (not accepted into the grid), in (p.u.);
Cost s o l d DSO is the price at which the energy coming from PV is sold to the grid (it is assumed different than the price of purchasing energy from the grid), in (€/kWh).
(14) C e n p r o s u m e r = C E u s e d D S O + C d a y P V + C d a y b a t + C l o s s b a t + C C O M M S a v c h e a p e n S a v s o l d e n C e n p r o s u m e r is the total cost of prosumer-used energy, in (€);
C l o s s b a t are the cost for the lost energy due to charge/discharge cycles and other aging factors for the BESS, in (€);
C C O M M is the daily ratio of the cost needed for communication with TSO/DSO, in (€).
(15) R e s i l i e n c e D a y U n i R C o n = E s u p l b a t E l o a d 24 · 60 R e s i l i e n c e D a y U n i R C o n is the period, expressed in minutes, based on the supplementary energy in a battery, kept only for resilience situations.
(16) S a v i n g s k = C E l o a d D S O C e n p r o s u m e r C E l o a d D S O S a v i n g s k are the relative savings in the UniRcon architecture, in (%) from the total cost if all energy would be purchased from the grid.
Table 4. Technical and economic input data.
AbbreviationDescriptionH 1H 2H 3H 4Unit
C I n v e s t m e n t b a t Cost of battery investment700600500400€/kWh
N C y c l e s Number of battery cycles per lifetime7000700070007000Cycles
C d a y b a t Specific cost of the service to store energy in BESS—storage as a service SaaS0.1000.0800.0630.044€/kWh
C o s t D S O Electricity tariff (flat) for purchasing the energy from the grid0.1200.1300.1400.150€/kWh
C o s t D S O Δ C o s t D S O Minimum tariff used for the energy supplied to the loads0.0600.0650.0700.075€/kWh
KM The market opportunity factor for buying cheap(er) energy20%40%60%80%[%]
Cost s o l d DSO Tariff used to buy back the injected energy into the distribution network FiT0.0800.0600.0400.020€/kWh
η b a t Overall efficiency of the batteries90%91%93%95%[%]
K c u r t a i l Curtailment factor for PV excess energy to be sent into the grid0.00%10.00%15%25.00%[%]
C I n v e s t m e n t P V Cost of PV for each installed kW, UniRCon solution15001200900600€/kW
C I n v e s t m e n t C l a s s i c P V Cost/kW_PV (includes the cost of power electronics and installation)180014001100800€/kWh
N H y e a r s Number of hours per year (at PV nominal power)1200120012001200hour/year
N y e a r s Number of years for PV and Electric Power investment return15151515Years
C U n i R C o n P V Cost of kWh produced, PV with UniRCon0.0830.060.0500.0325€/kWh
C C l a s s i c P V Cost of kWh produced, PV classic0.1000.0780.0610.044€/kWh produced
E r e s i l b a t Battery energy used only for resilience0.0600.1650.2200.325kWh
ResilienceAC_Genxit Resilience [min] with UniRCon, based on EBAT_RESIL4121624min
ResilienceDay_UniRConResilience, [%] per day with UniRCon0.3%0.8%1.1%1.7%[%]
η 1 Efficiency of PV-BESS in classic option 186.0%87.0%88.0%89.0%[%]
η 2 Efficiency of PV-BESS for the UniRCon91.0%92.0%93%94.0%[%]
YearScenarios run for the respective year2018202020222025Year
C_RESIL_DayDSO daily tariff (cost) for resilience provision0.050.10.10.1€/day

