1. Introduction
The human civilization has progressed on the wheels of energy resources. Energy is the power source that drives the development of society [
1]. Based on the method of obtaining energy, the energy is divided into renewable energy, which can be duty-cycle operated (solar, wind, water), and non-renewable energy, which will be eventually used up (oil, coal, natural gas) [
2]. The use of renewable energy is in accordance with the concept of sustainable development. The problems relating to energy consumption are becoming more and more serious, especially with regard to the energy consumption of conventional air conditioning system, which rely completely on electricity energy [
3]. The solar-driven air conditioning system has gained a growing interest in recent times. The solar-driven air conditioning system presents an opportunity for the reduction of non-renewable energy consumption. In summer, the demand for electricity is substantially increased to drive air conditioning system. The concept of Solar driven air conditioning system is attractive since the indoor cooling load of the house is accordance with the availability of solar energy [
4]. Solar-driven air conditioning system potentially have a growing market with regard to both residential and commercial projects [
5].
However, solar energy has its own drawbacks, such as discontinuity and mismatch between the energy production and demand [
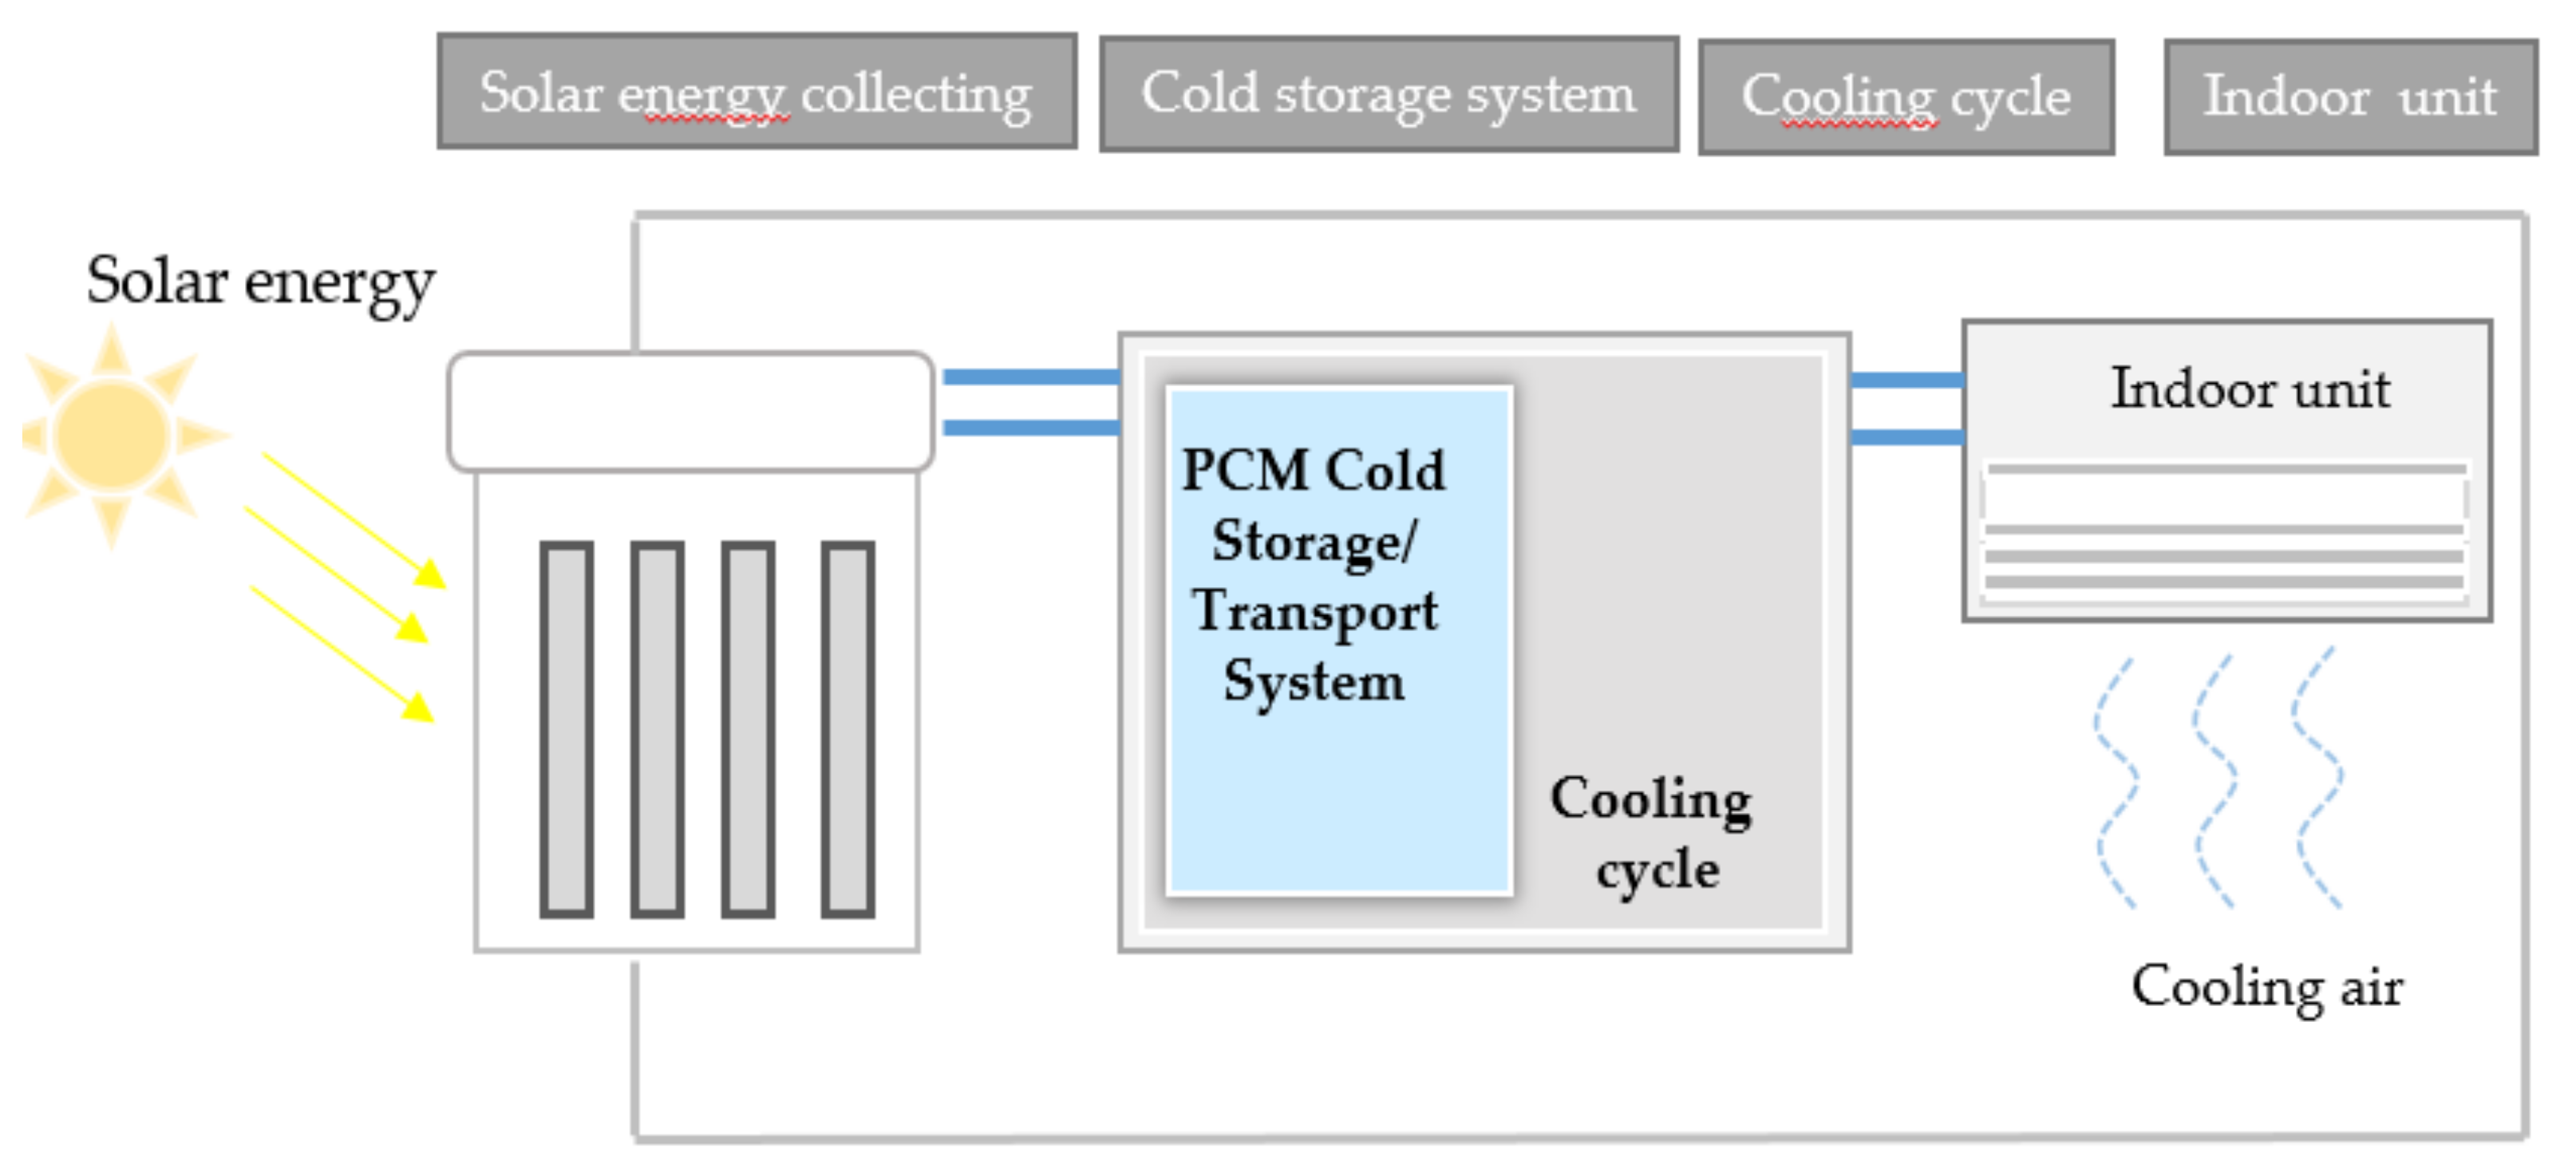
6]. Therefore, to tap into the full potential of solar energy, the solar-driven air cooling cycle with a PCM cold storage/transportation system has been proposed [
7,
8]. Phase change materials (PCM) cold storage/transportation systems is carried out by latent heat storage systems. PCMs are widely used for the storage and transportation of energy in the different energy application fields during the phase change process [
9].
PCMs can be divided into three general categories on the basis of their different melting points: organic, inorganic, and co-crystal. A novel encapsulation method, “microencapsulation”, has been proposed. Microencapsulated phase change materials (MEPCMs) are small bi-component particles consisting of a core material of the PCM and an outer shell or capsule wall [
10,
11,
12]. Both PCM and MEPCM can be mixed up with water to form a slurry. MEPCM slurry is a low-melting slurry in the temperature range of −30 °C to 55 °C that can store and release energy. The capsule wall is an inert, stable polymers. MEPCM is used for a variety of energy storage applications [
13,
14].
In this context, to select the proper cold storage/transportation medium, different thermal properties of phase change materials have been tested. The Differential Scanning Calorimeter (DSC) scanning method is applied to test MEPCM and PCM enthalpy while KD2 Pro thermal conductivity equipment is used to test the thermal conductivity of MEPCM slurry. The experiment studies the variation among the thermal conductivity, concentration, and temperature of PCM slurry. The relationship between slurry flows power and discharge rates were tested. Then, the density of MEPCM slurry with different surfactants were tested to explore the improvement effect different surfactants on slurry stability. The thermal properties of PCM and MEPCM have also been studied to find the most suitable chilling medium to optimize the design of cold storage/transportation systems in Solar driven cooling cycles.
2. PCM DSC Experiments
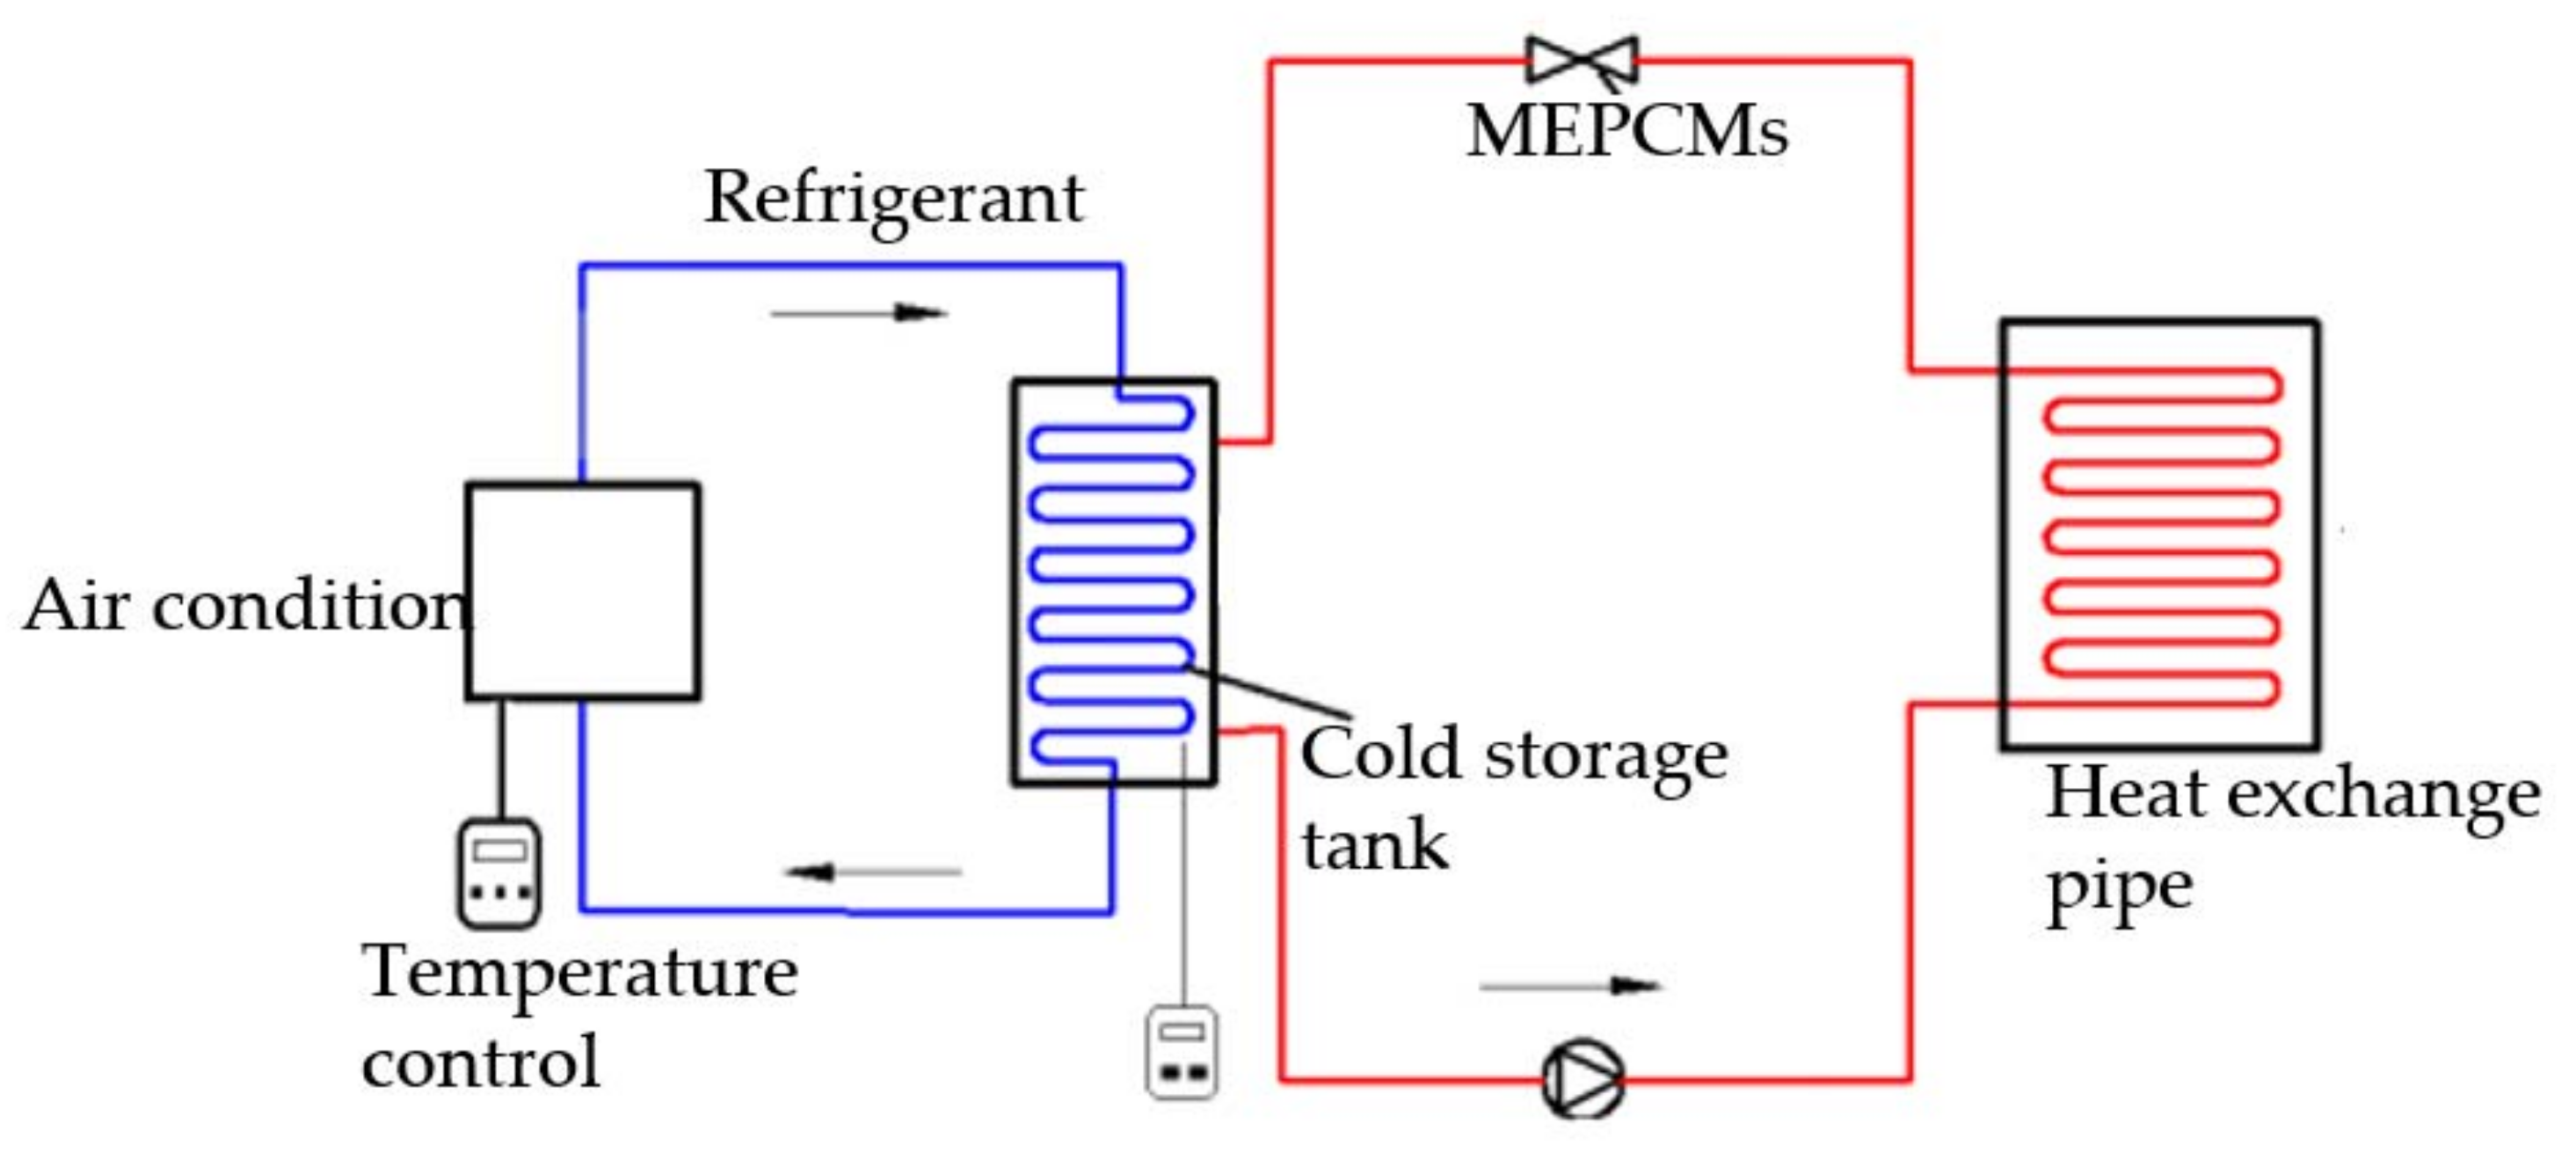
The PCM cold storage/transportation system with solar-driven cooling cycle is showed in
Figure 1.
Figure 2 is the solar-driven cooling cycle rig.
Two types of PCMs are chosen in the experiment. The PCM was produced by RUHR TECH Company in China, and the MEPCM was produced by Microtek Laboratories in the United States of America.
2.1. Experiment Process
The test equipment is the Differential Scanning Calorimeter (DSC) from Swiss METTLER TOLEDO Company. The experiment was carried out in Analytical Testing Laboratory of Sichuan University. The testing temperature range in this experiment is 0 °C to 40 °C. The temperature accuracy is 0.1 °C. The heating rate was 40 °C/min. The heat flow endo up could be obtained through the DSC test. The DSC equipment could calculate the enthalpy, melting temperature, solidification temperature, and peak temperature in accordance to the testing result [
15].
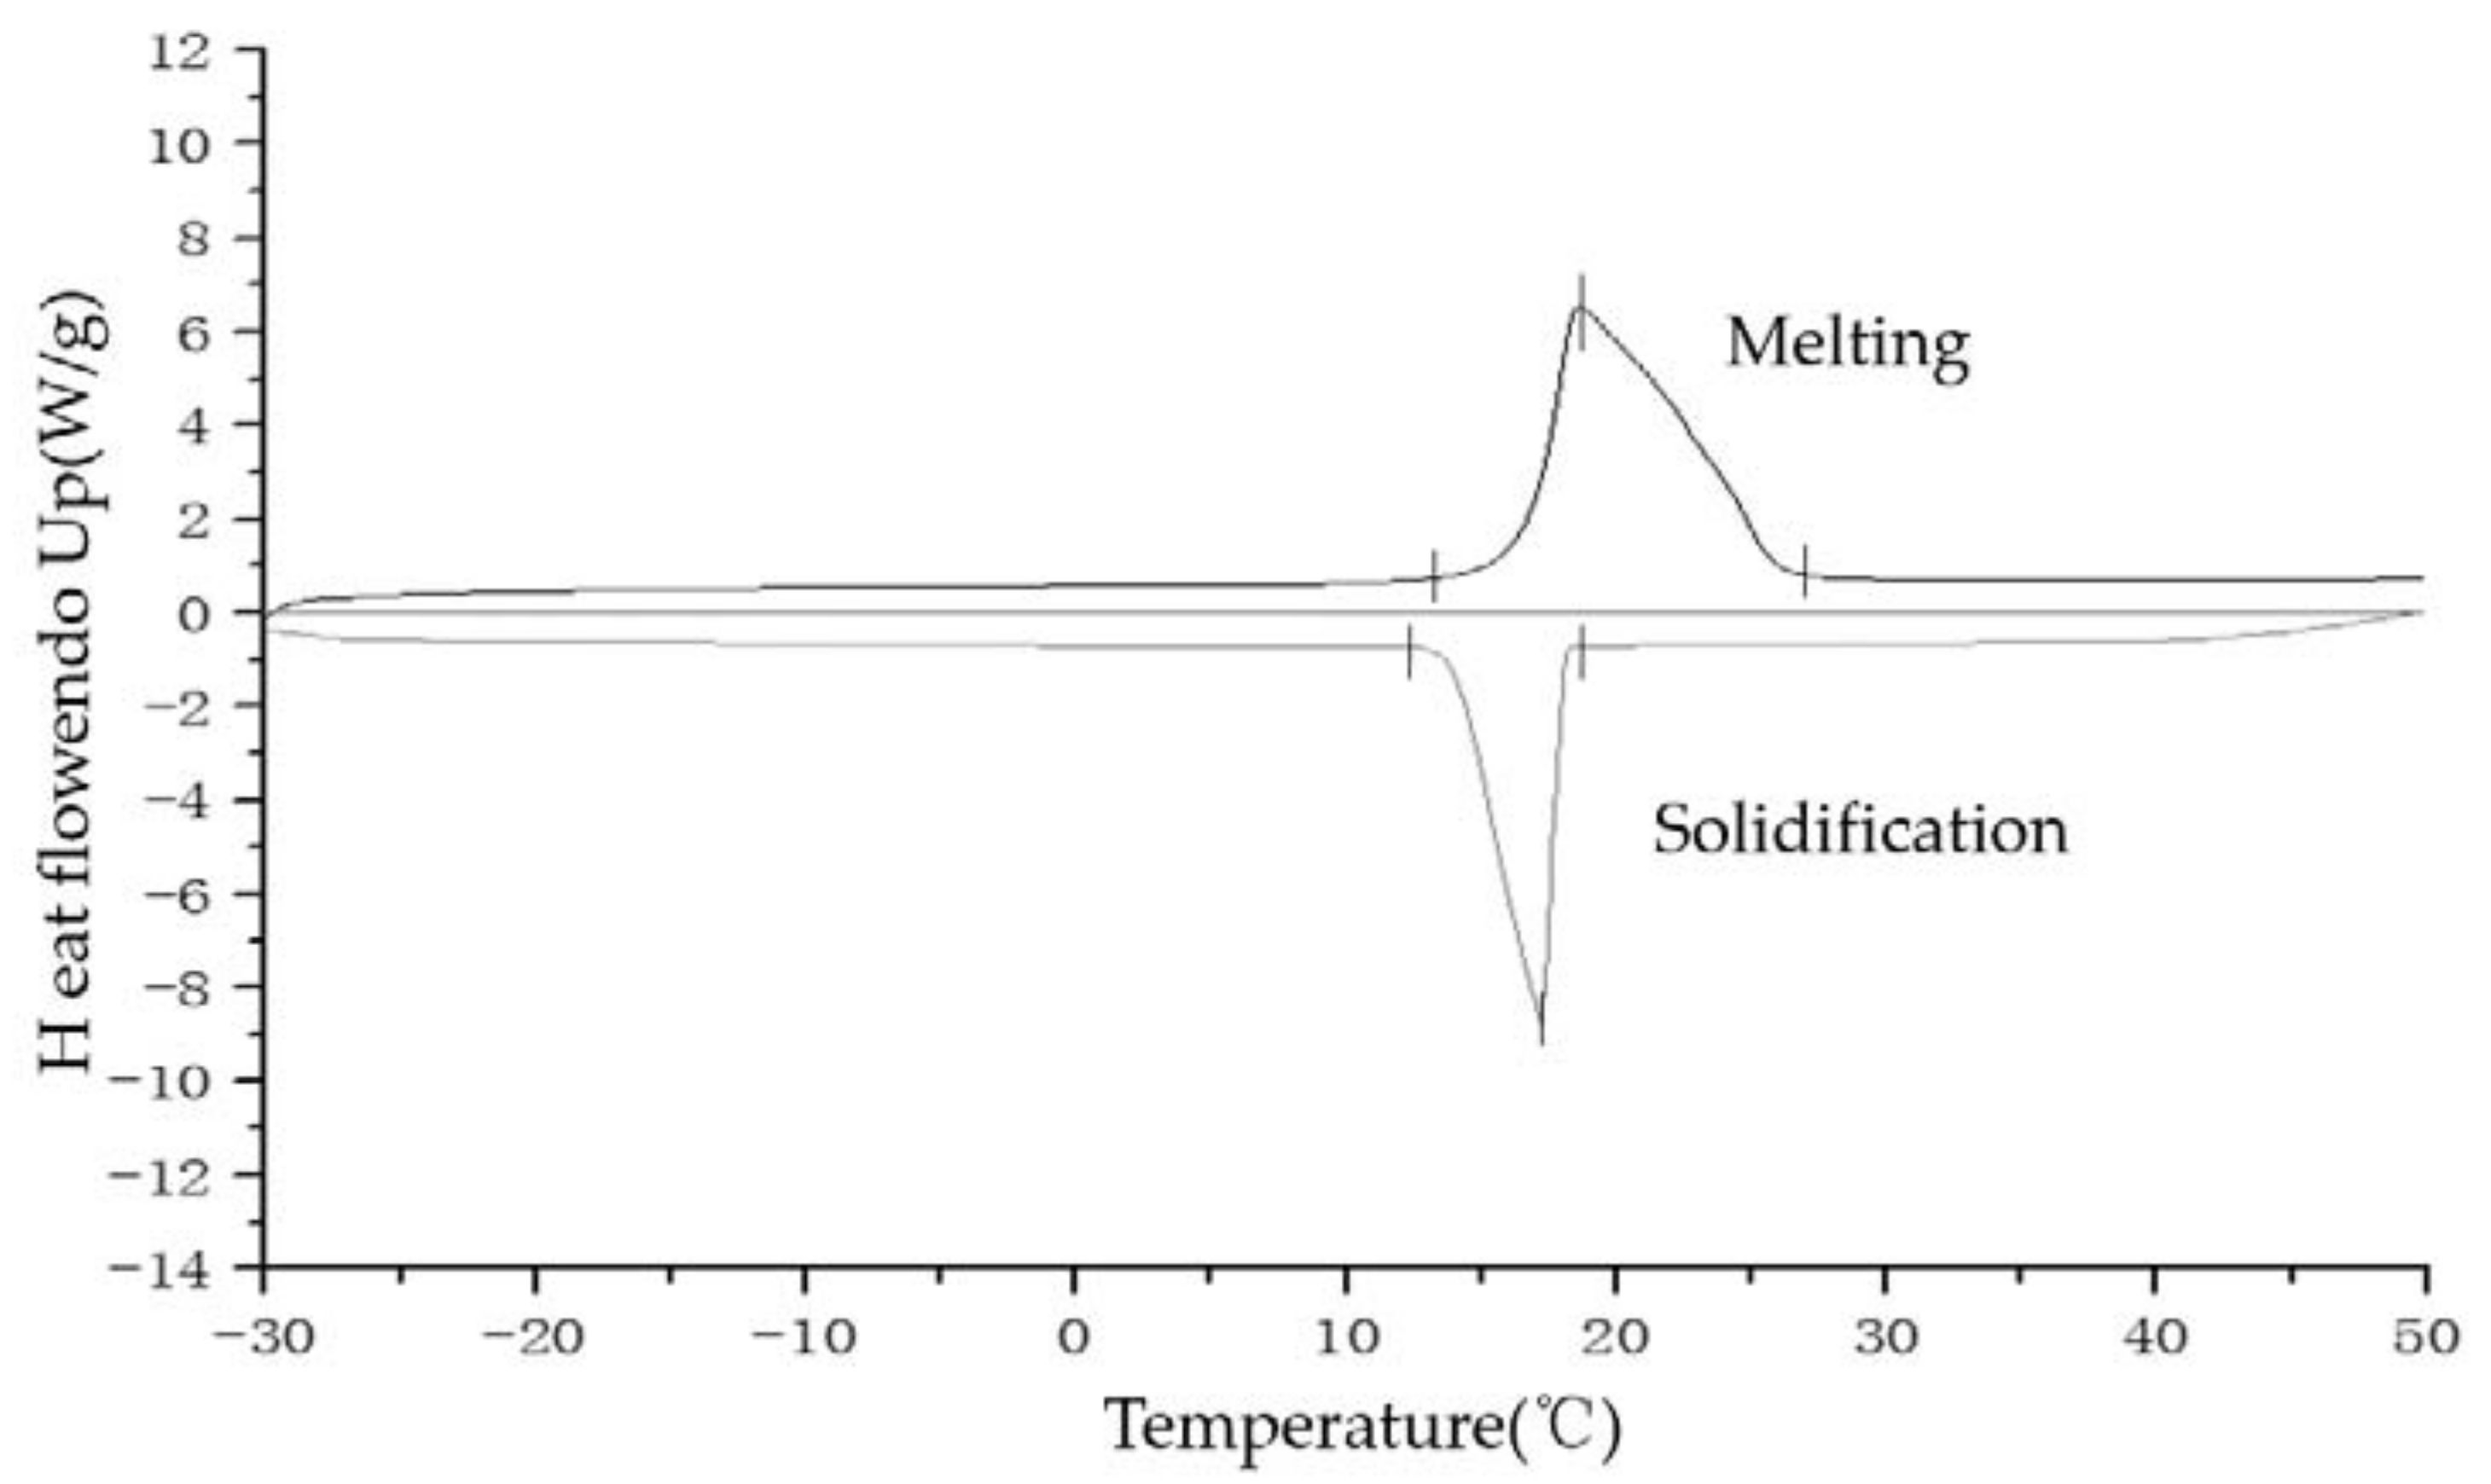
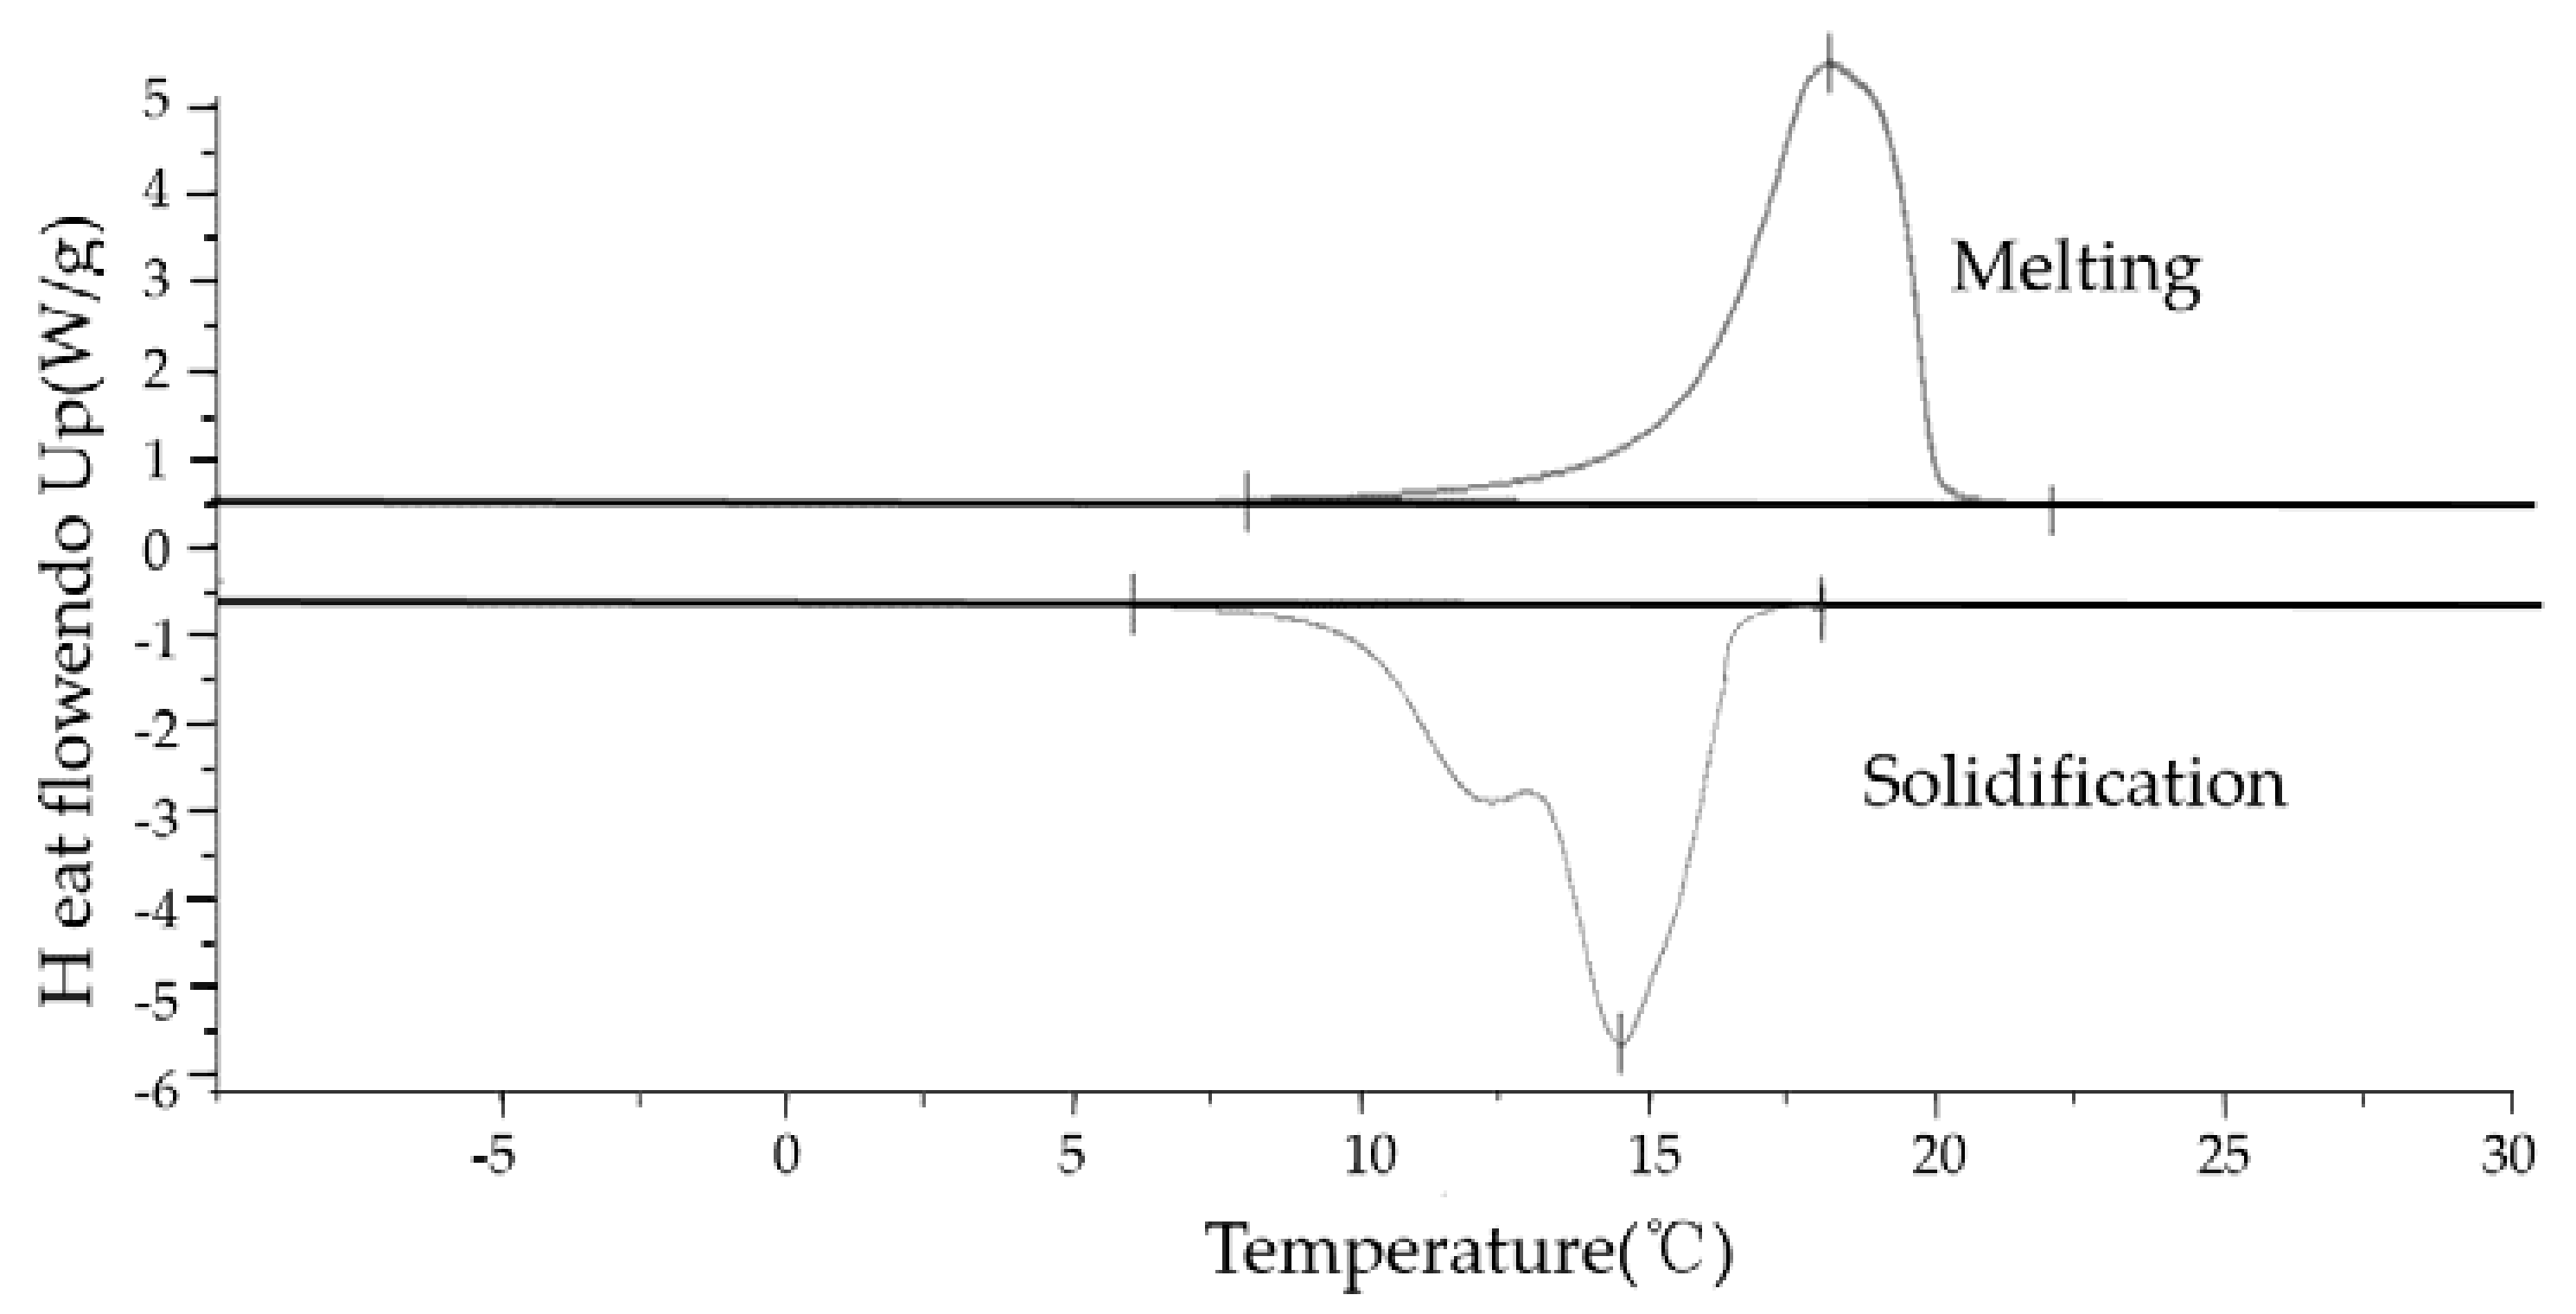
2.2. DSC Experiment Result and Analysis
The curve of materials heat flow endo up is showed in
Figure 3 and
Figure 4. According to the
Figure 3 and
Figure 4, the DSC analysis tools calculates and presents the enthalpy, melting temperature, solidification temperature and peak temperature. These properties are showed in the
Table 1.
The
Figure 3 and
Figure 4 represents the PCM and MEPCM DSC testing curves. According to the calculated results by DSC, the PCM melting temperature ranges from 14 °C to 26 °C while the solidification temperature ranges from 12 °C to 19 °C. The MEPCM melting temperature ranges from 15 °C to 21 °C the solidification temperature ranges from 14 °C to 18 °C.
According the DSC testing results, both PCM and MEPCM could be competitively employed in cold storage/transportation system with a solar-driven cooling system. It is evident that the enthalpy of PCM is similar as that of MEPCM, however, the majority of PCM melting temperatures during the phase change interval was higher than 20 °C, which is disadvantageous to cold storage/transportation systems. But, the majority of MEPCM melting temperatures during the phase change interval were lower than 20 °C, which meant such materials can be advanced into the cold storage/transportation system.
3. PCMs Thermal Conductivity
3.1. Thermal Conductivity Experiment Rig Setp
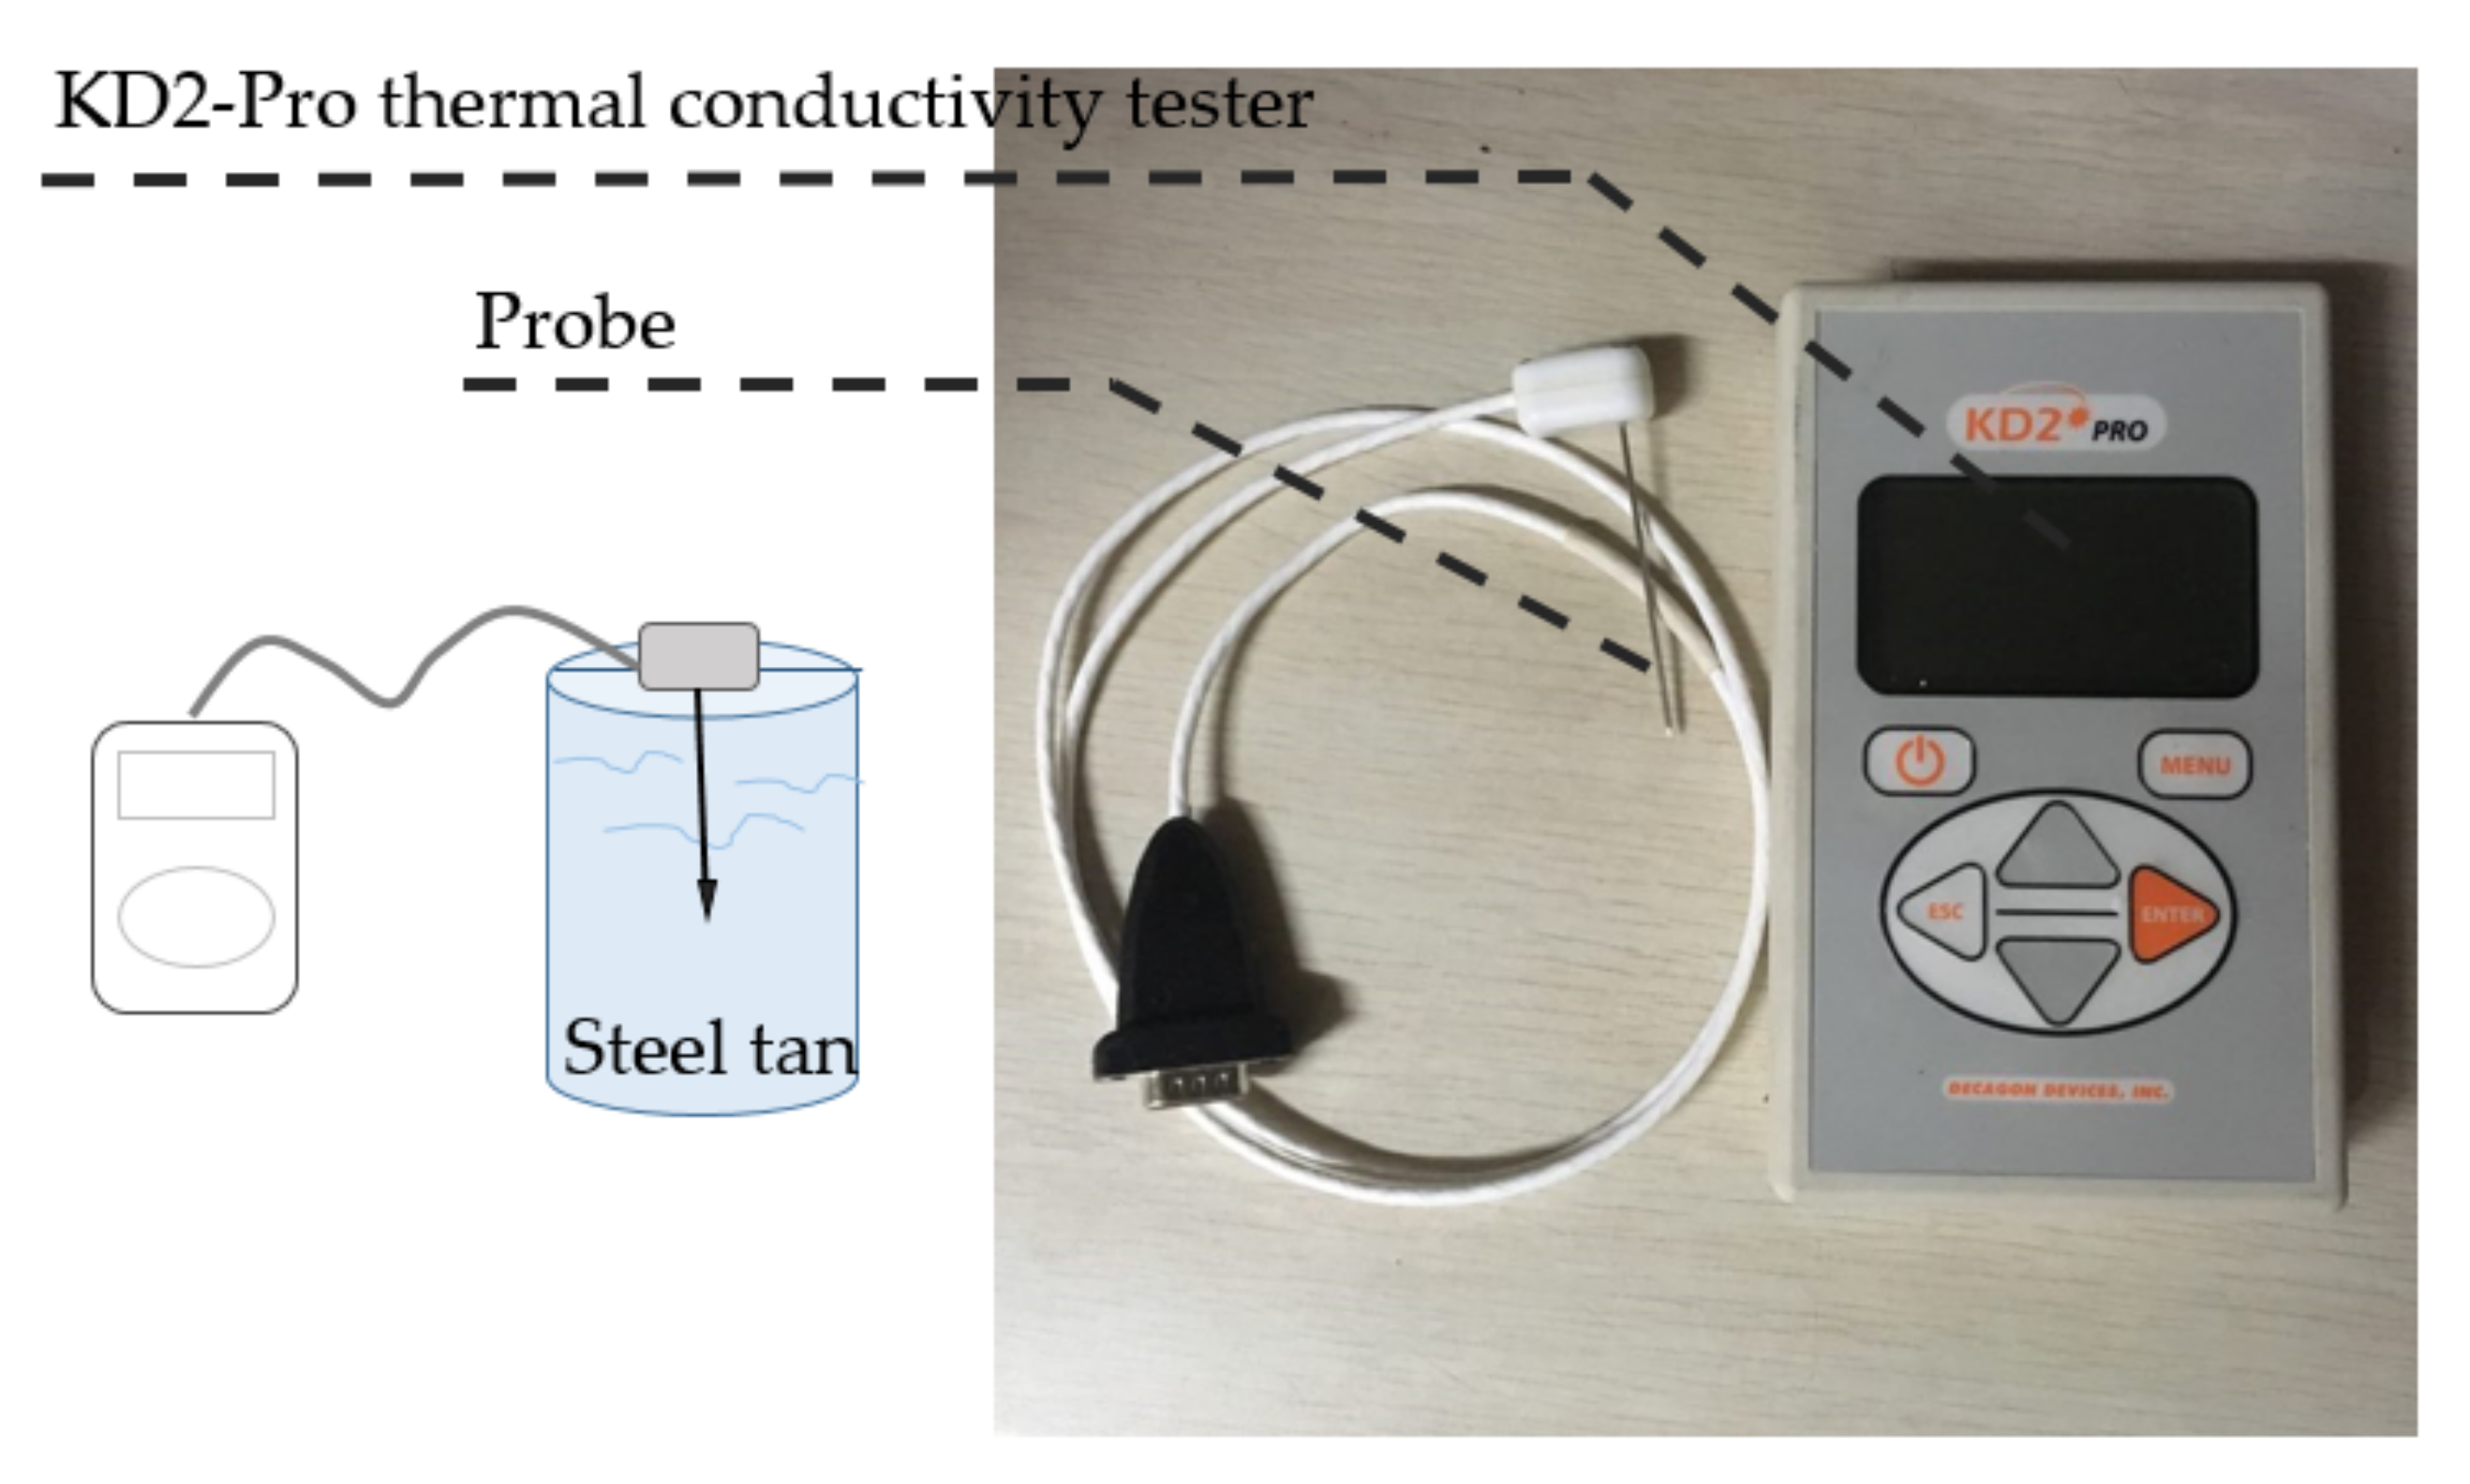
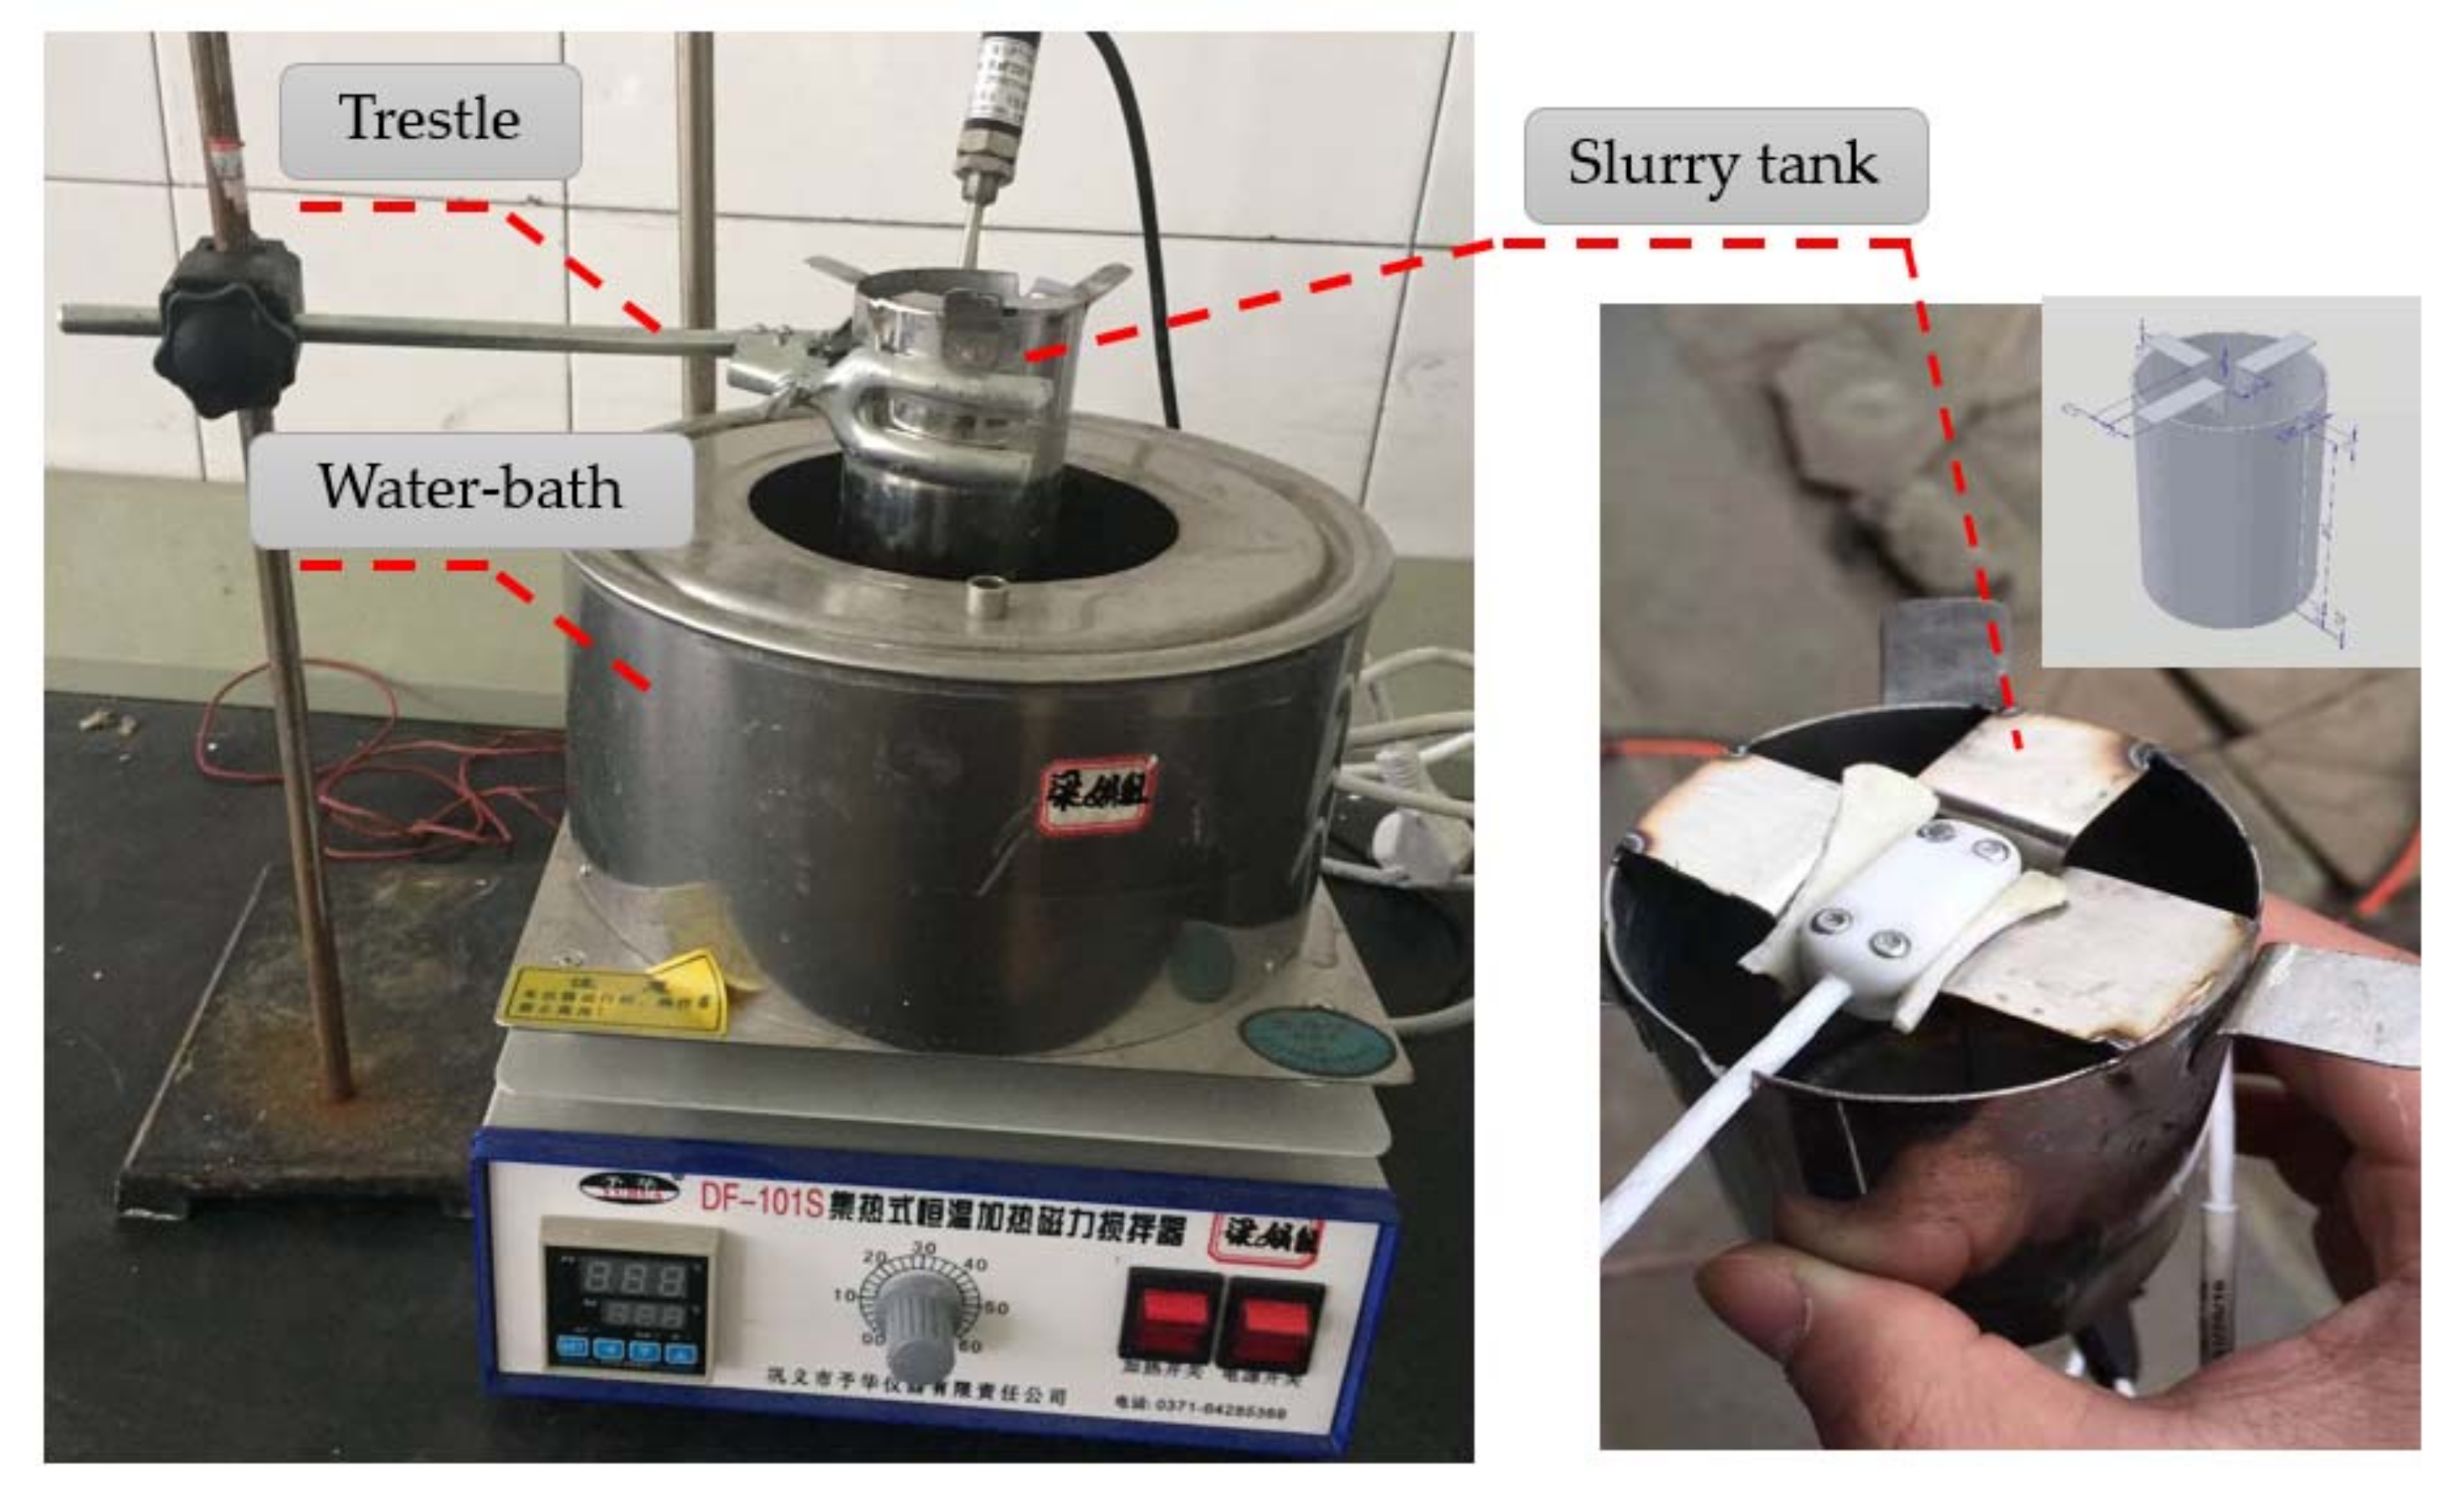
The thermal conductivity of PCM is related to design the cold storage/transportation system. It is difficult to make a full use of the system while the thermal conductivity of the chill medium is very low. The high thermal conductivity could refer to the good thermal performances. This experiment tests the thermal conductivity of PCM and MEPCM slurry at six different volume concentration ratios; 45%, 35%, 30%, 25%, 20%, and 15%. The relationship of the thermal conductivity with concentration and temperature are analyzed. A novel thermal conductivity model is used in this experiment. The KD2 Pro instrument is used to test the slurry thermal conductivity based on transient hot wire source technology. The physical model of the experiment could be simplified as an unsteady heat conduction in an infinite medium with an infinite length of uniform heating. KD2 Pro instrument and transient hot wire source probe are showed in the
Figure 5. The thermal conductivity experiment rig is showed in the
Figure 6.
The saturation of the slurry tank (Diameter 6 cm, Height 7.5 cm) is 220 mL. Slurry in tank could be heated by the electric-heated thermostatic water bath. TKD2 probe was settled by insulation. The temperature of slurry was recorded by the temperature recorder. The test time lasts 60 s. Firstly, the slurry was heated to the target temperature by warm water in a water-bath equipment, and then the slurry was stirred by the stirrer under a magnetic force. When the slurry was distributed, the KD2 Pro instrument would be started to test the thermal conductivity. The results were concluded from the average of the three sets of experiments.
3.2. The PCMs Thermal Conductivity Result and Analysis
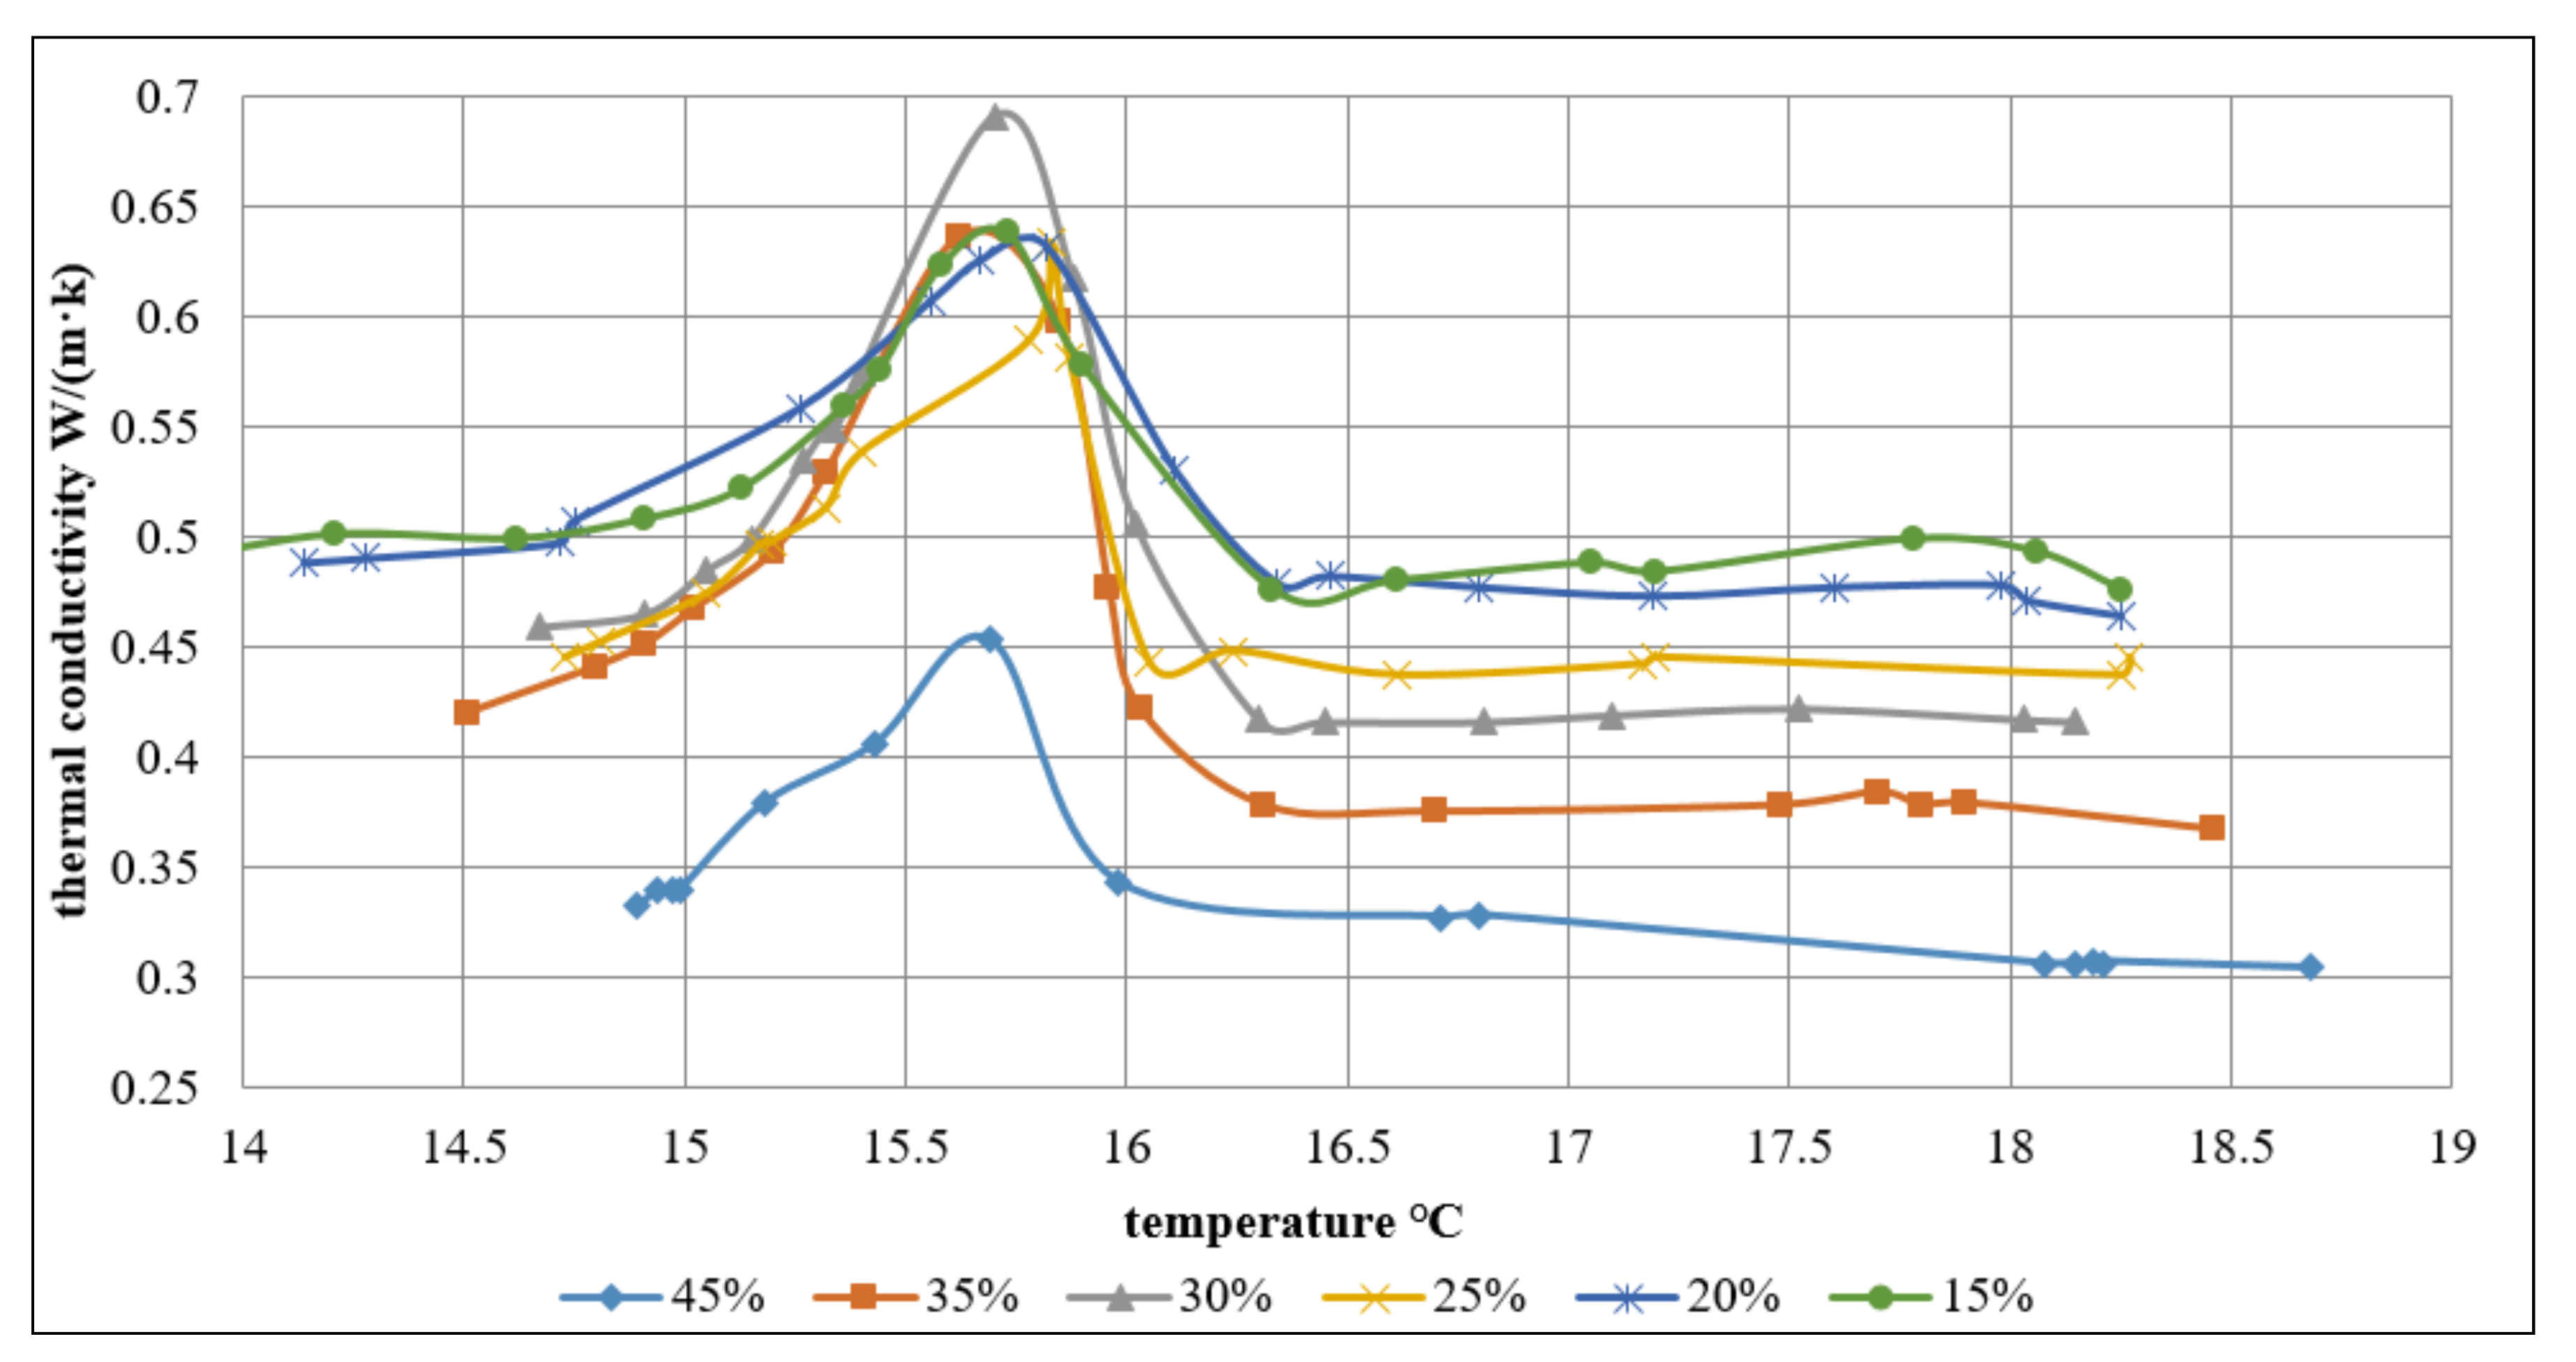
As shown in the
Figure 7, the volume concentration ratios are 45%, 35%, 30%, 25%, 20%, and 15%, and the maximum value of the thermal conductivity corresponds to 0.453 W/(m·K); 0.636 W/(m·K); 0.691 W/(m·K); 0.633 W/(m·K); 0.631 W/(m·K); 0.638 W/(m·K), respectively.
While performing the experiment, it was found that during the phase change period, the thermal conductivity gets much higher. For each temperature (within phase change period and over phase change temperature), the thermal conductivity increased linearly to the peak value with the increase of concentration, later decreased to the stable level. In the concentration range, the largest thermal conductivity was observed for different volume concentration slurries at a temperature of 15.7 °C. The largest value of thermal conductivity was 0.68, as showed in the
Figure 7.
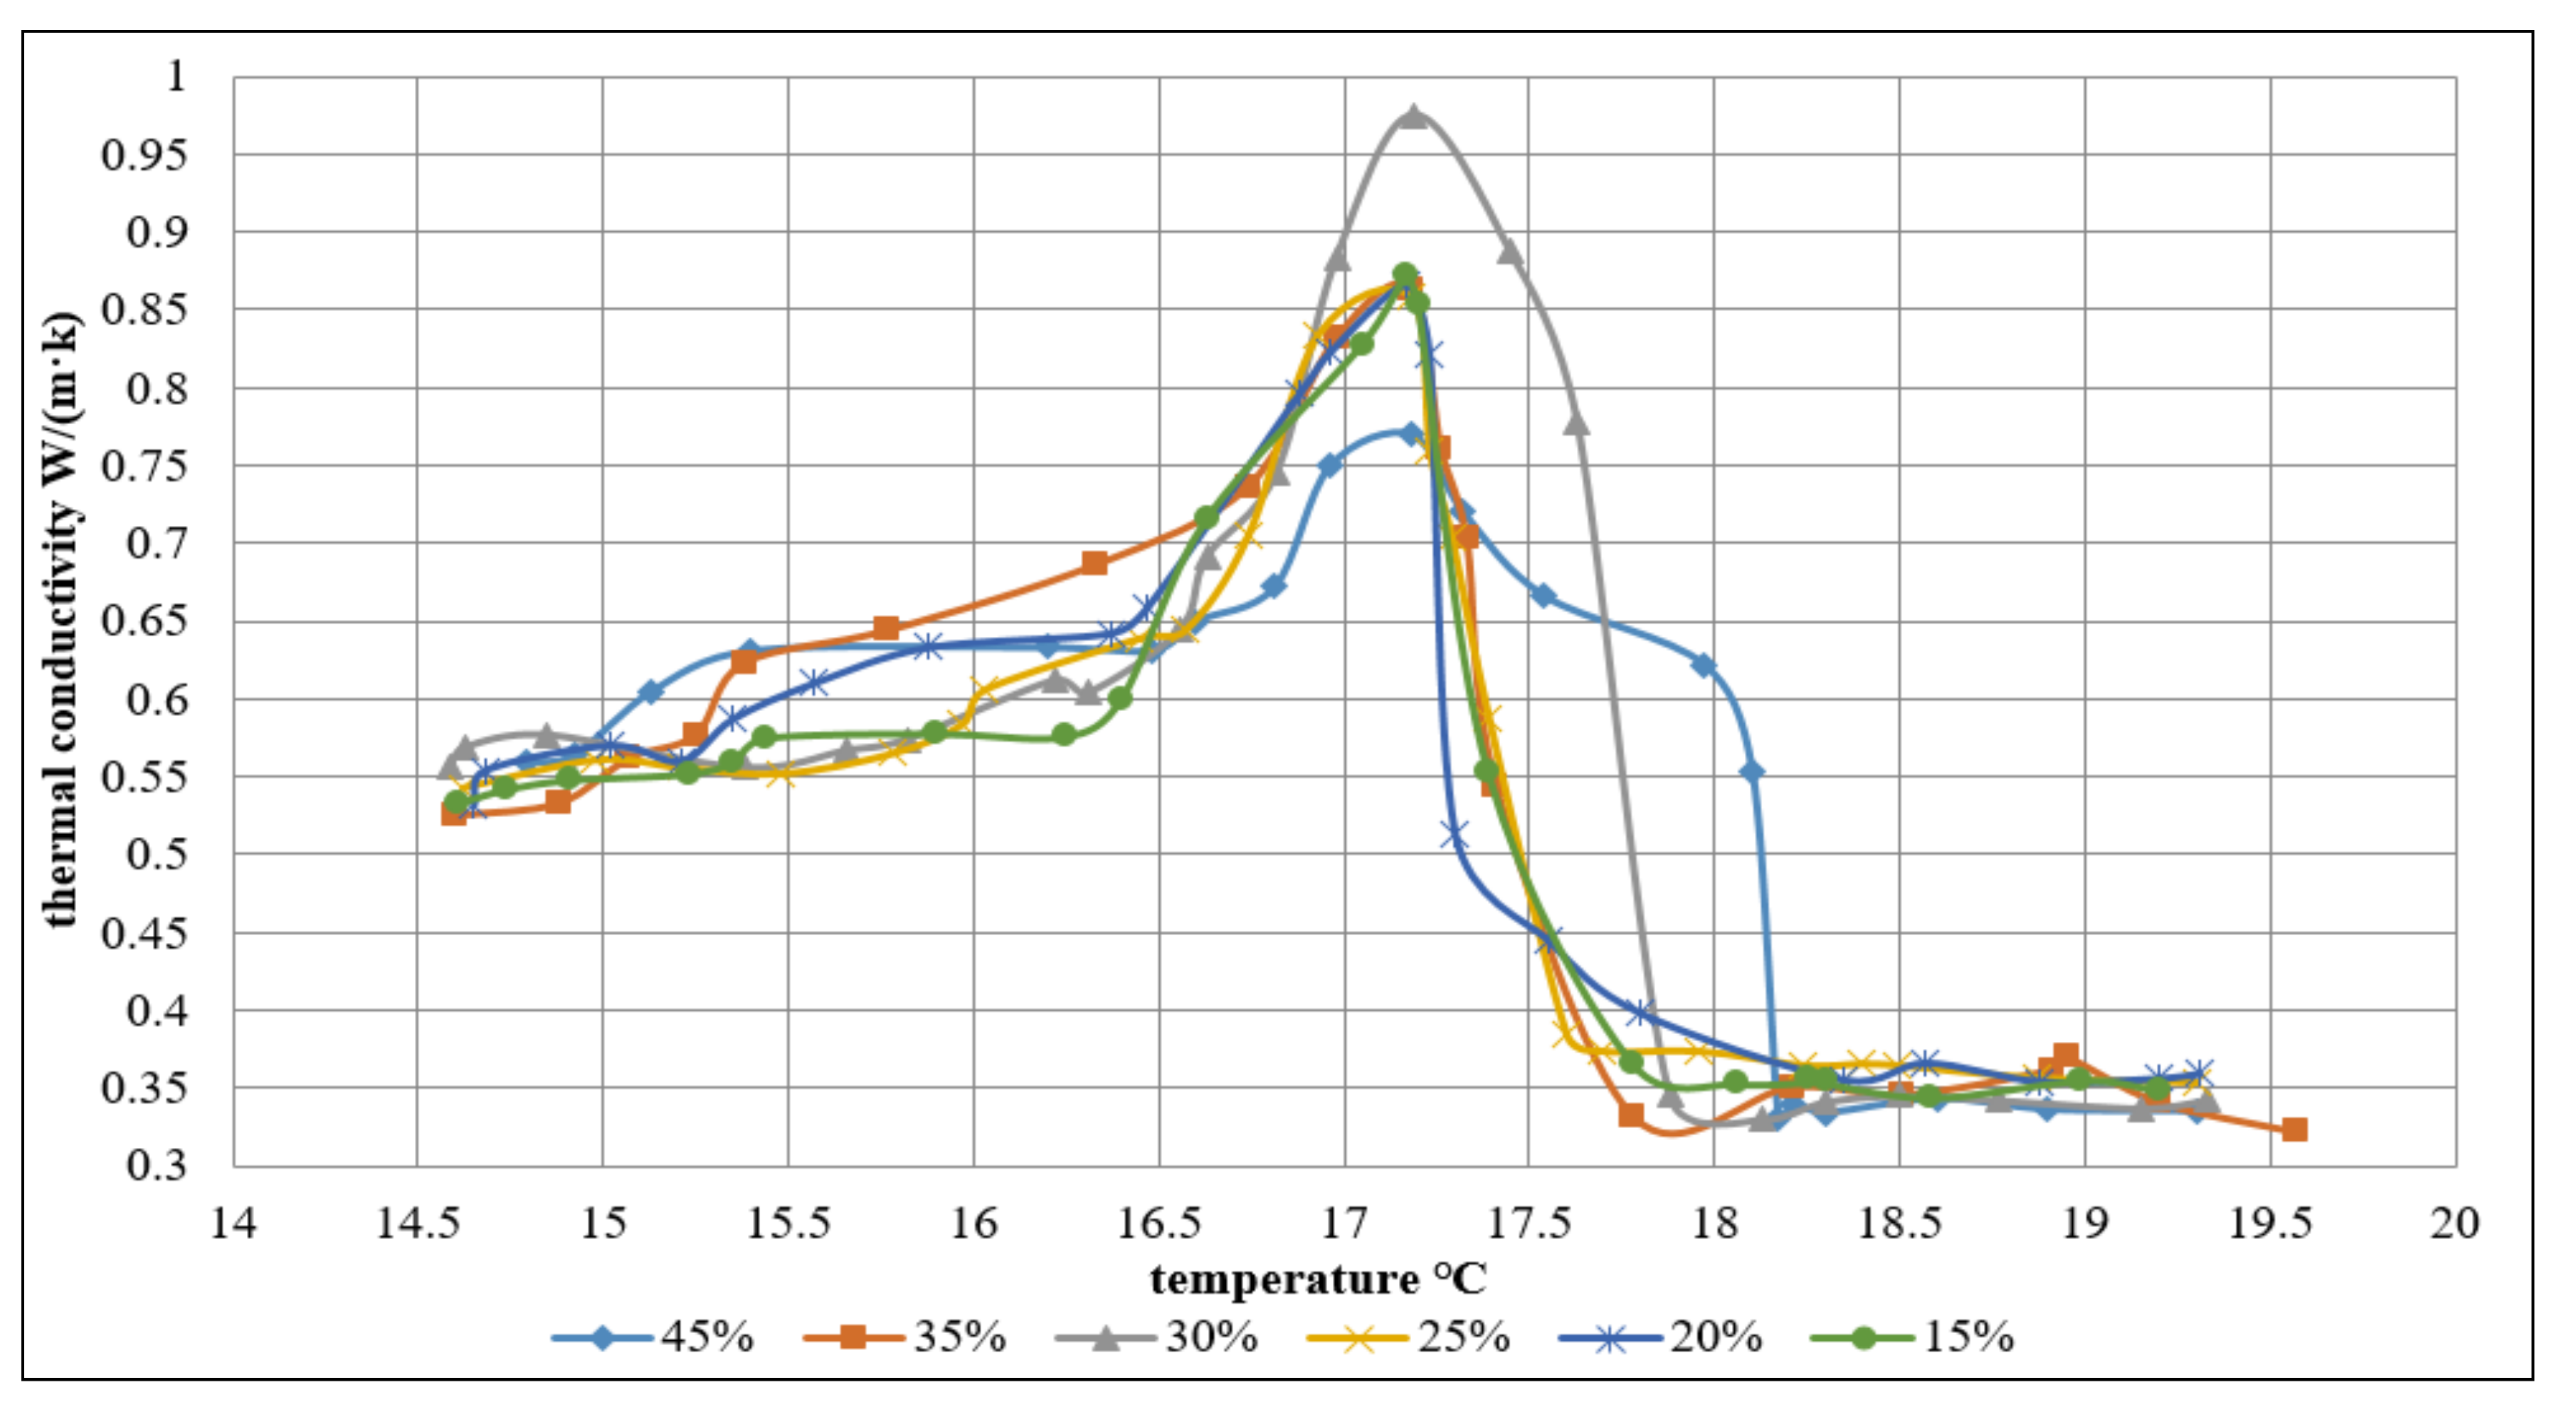
3.3. The MEPCMs Thermal Conductivity Result and Analysis
As shown in the
Figure 8, the concentration of MEPCM slurry concentration ratios are 45%, 35%, 30%, 25%, 20%, and 15%, the maximum value of the thermal conductivity corresponds to 0.77 W/(m·K); 0.863 W/(m·K); 0.975 W/(m·K); 0.858 W/(m·K); 0.866 W/(m·K); 0.872 W/(m·K), respectively. It was found that during the phase change period, the thermal conductivity gets much higher. For each temperature (within phase change period and over phase change temperature), the thermal conductivity increased linearly to the peak value with the increase of concentration, later decreased to the stable level. The result is the same as the PCM slurry. It was found that all the thermal conductivities of the MEPCM slurry are above 0.65 W/(m·K) during the phase change period, which indicated that the thermal performance of MEPCM slurry is better than PCM slurry. Based on the experimental result, the MEPCM is more suitable for the energy storage/transportation system with a solar-driven cooling cycle than PCM.
4. MEPCMs Flow Characteristic
4.1. MEPCMs Flow Characteristic Experiment Rig Setp
The flow characteristics of MEPCM slurry are tested. The schematics of the circulation system are illustrated in
Figure 9. The circulation system includes the radiator, peristaltic pump, accumulator tank, and flow-regulating valve. In this experiment, the circulation system has been powered by the peristaltic pump.
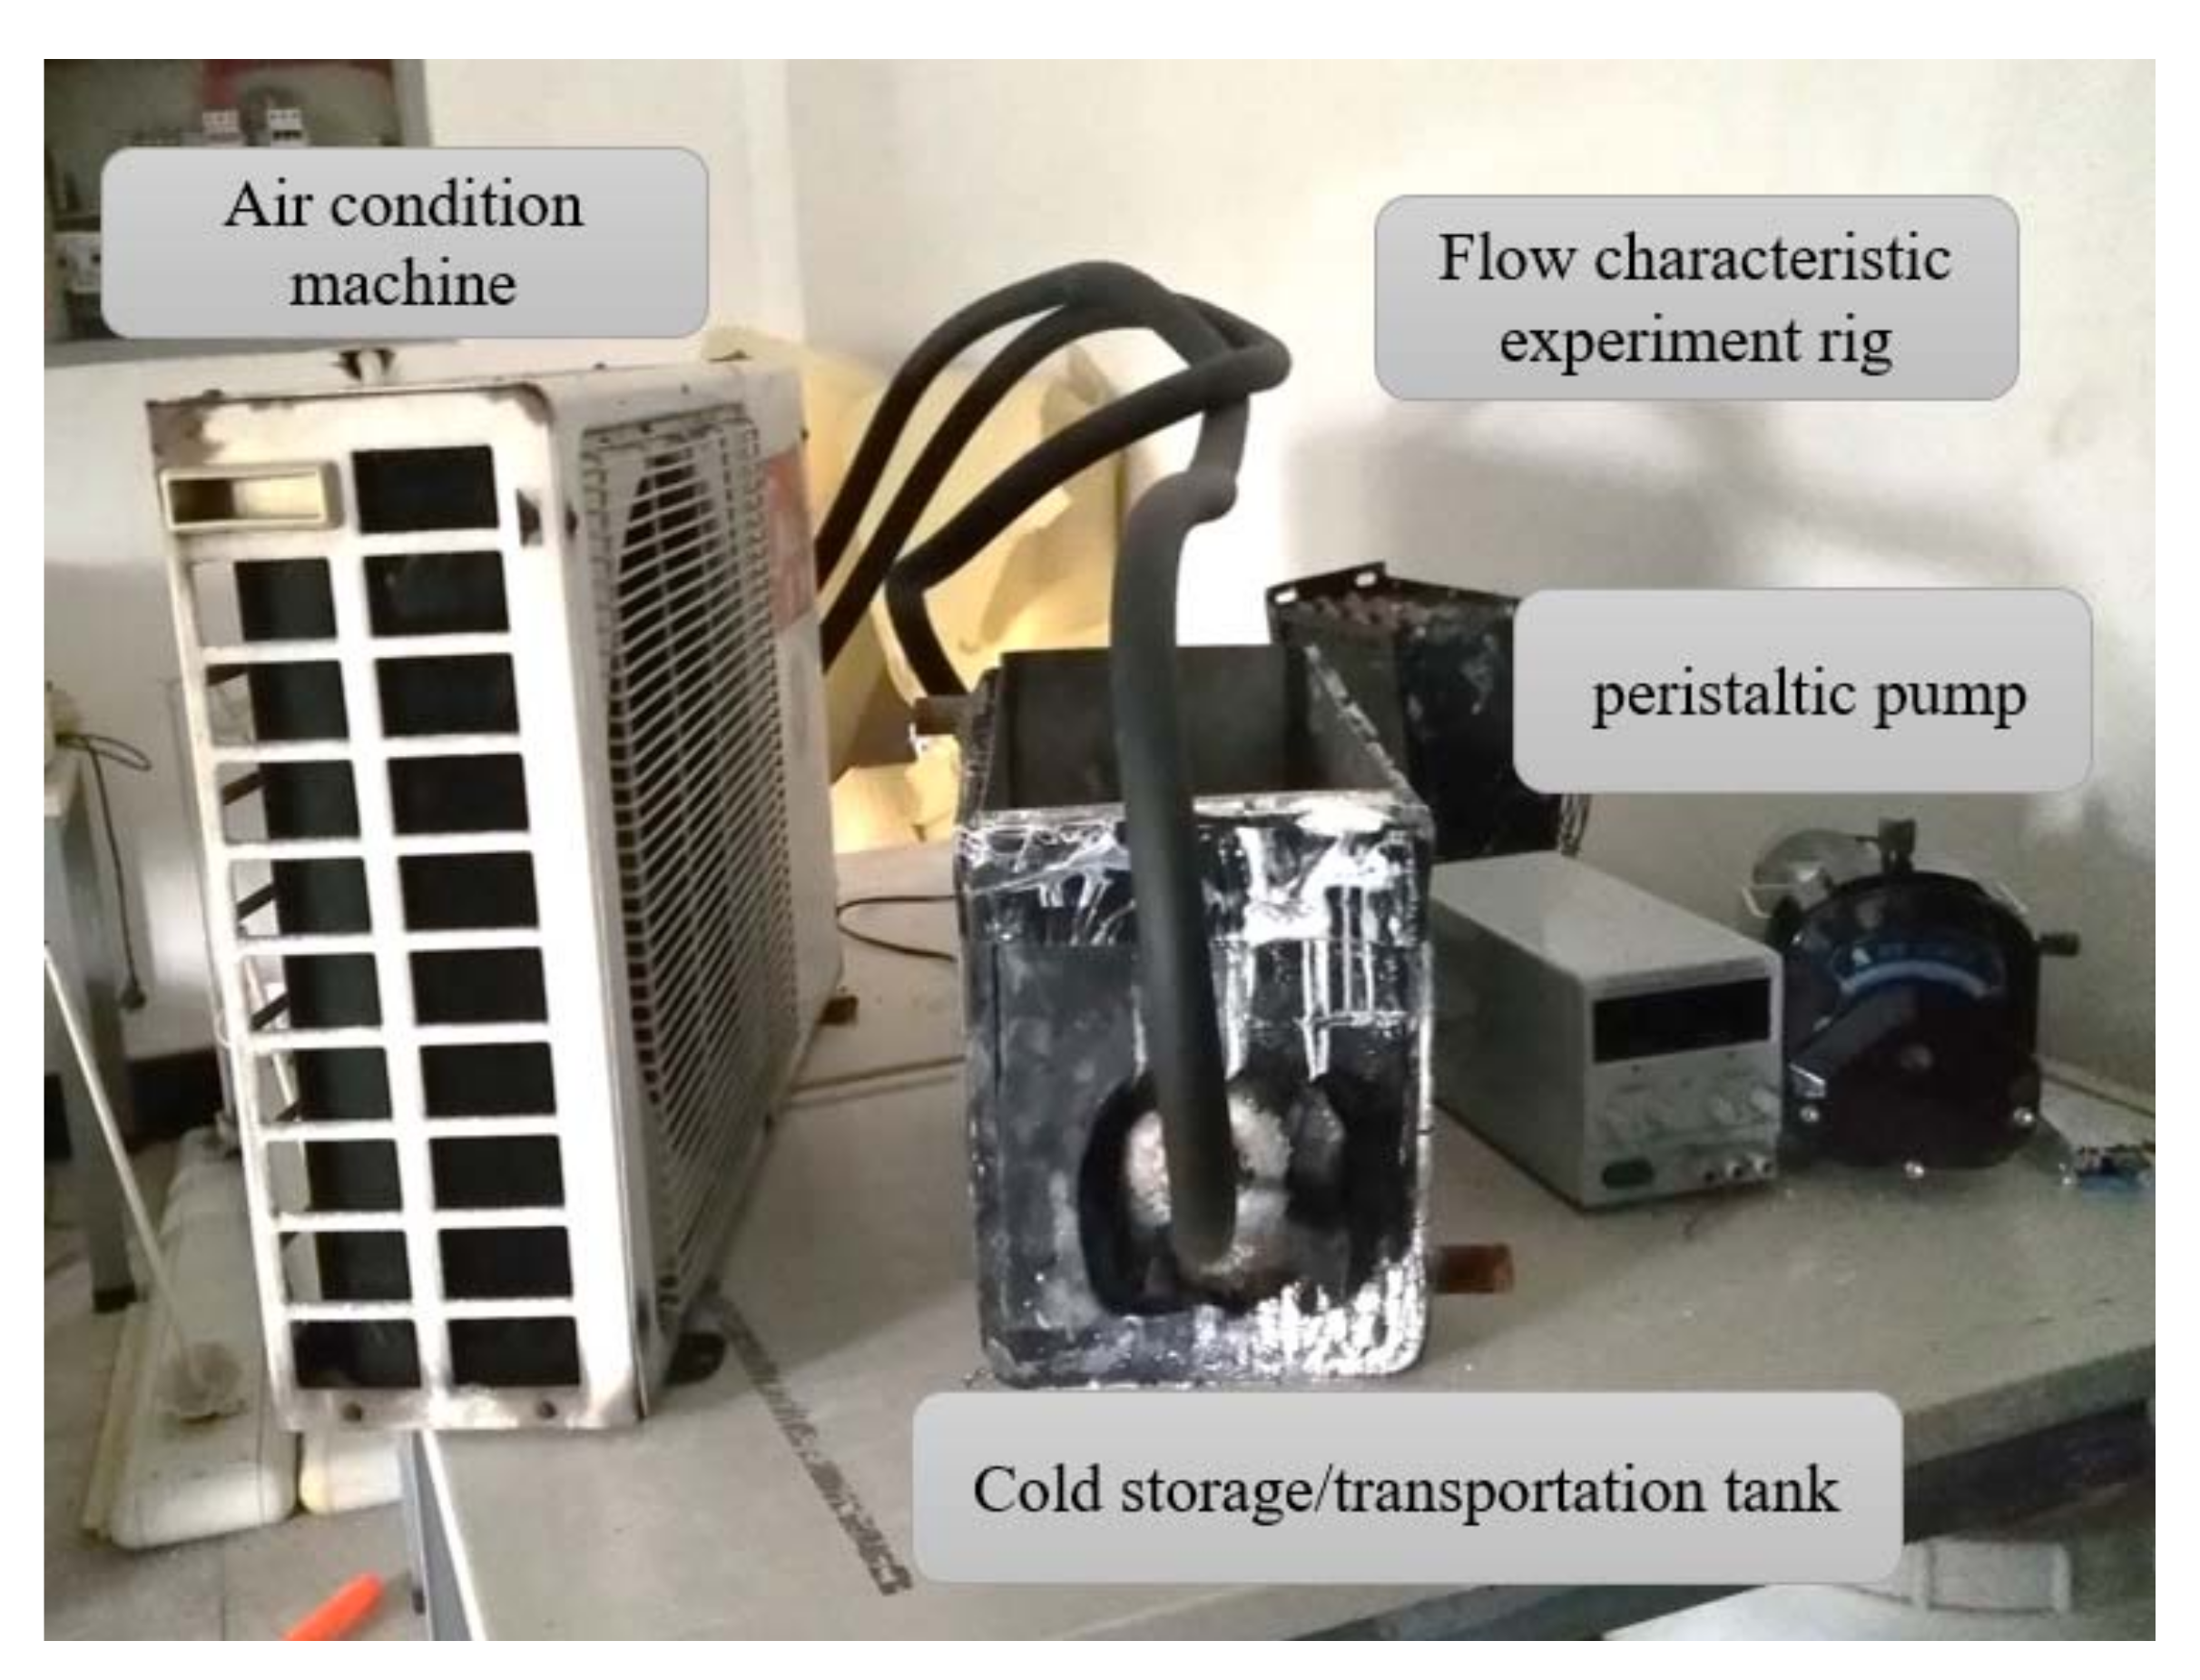
The experiment rig is showed in the
Figure 10. In the circulation system, an air conditioning machine provides the cold energy to the phase change slurry in the cold storage tank. The slurry temperature was recorded by a temperature recorder. The flow rate was controlled by the valve. The radiator coil is used to dissipate the heat. The total volume of the storage tank is 24 L. In this experiment, only 20 L slurry was contained in the tank. The spare space was left to avoid the effects of the material volume changes during the phase change process. Firstly, the temperature recorder was started up in order to monitor the temperature, then the peristaltic pump was started up to power the system.
4.2. MEPCMs Flow Characteristic Result and Analysis
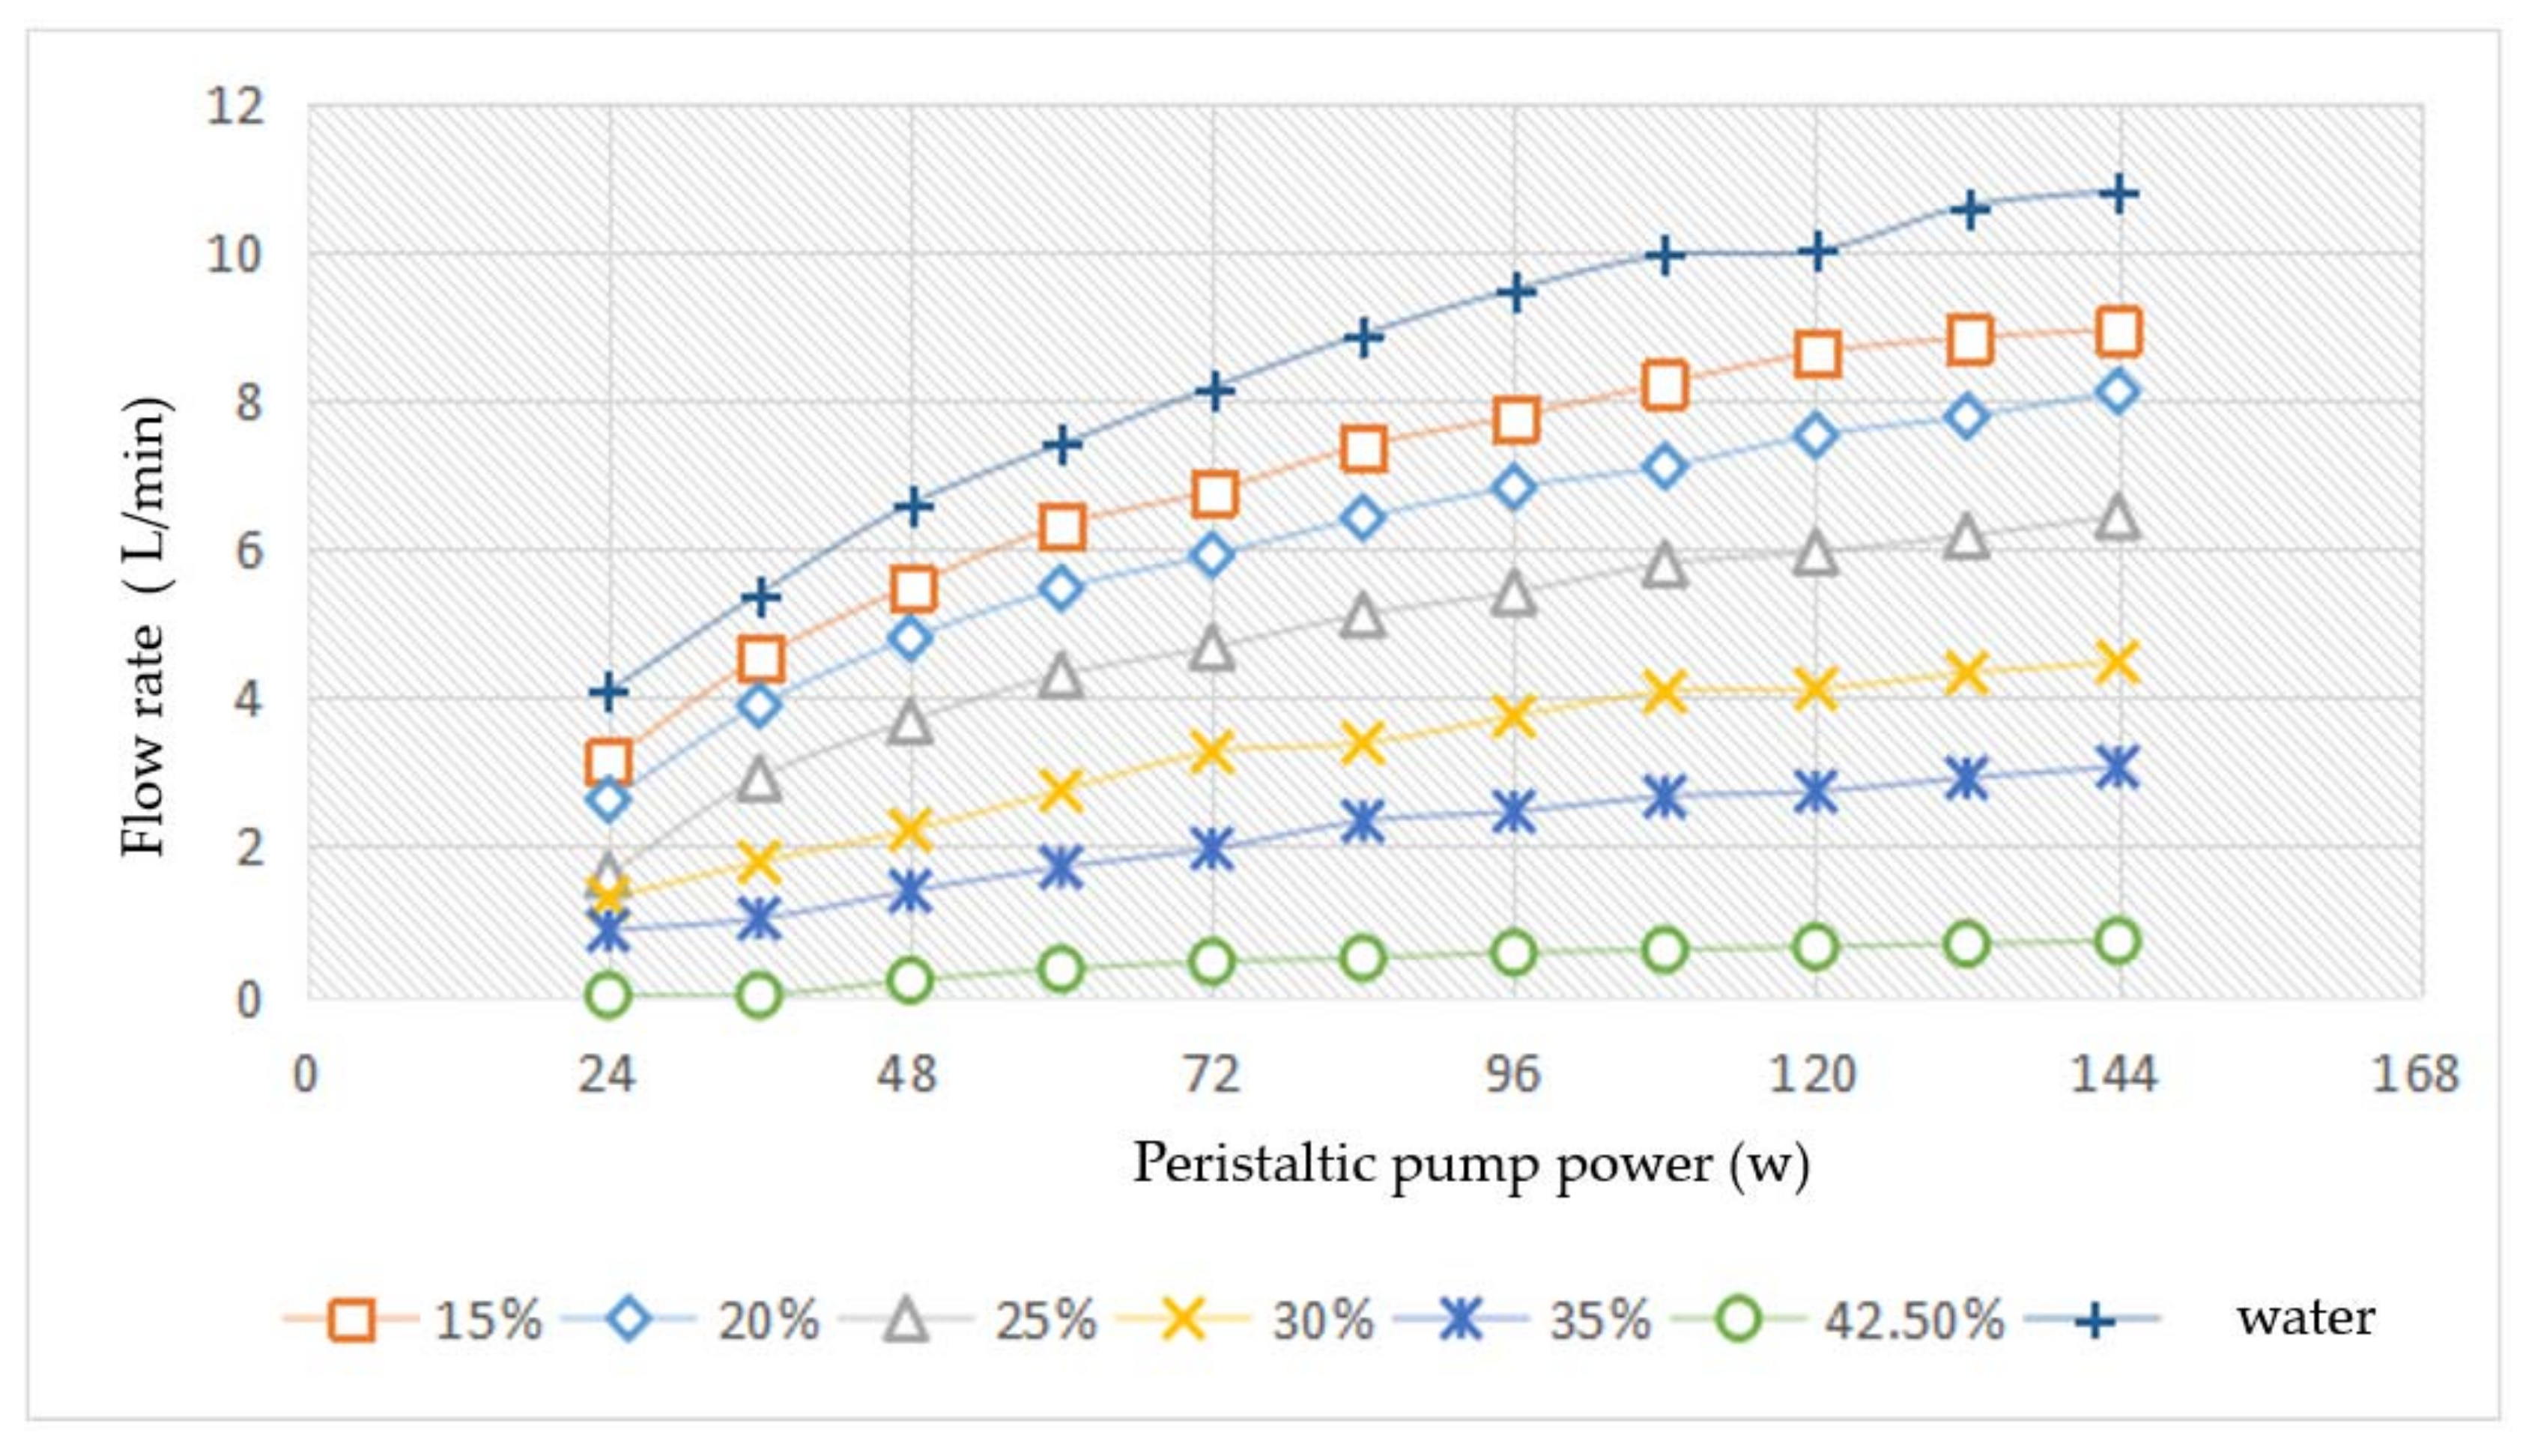
The testing results are illustrated in the
Figure 11. The flow rate increased with the increase of peristaltic pump power. This result was obvious at low concentrations of slurry. When the concentration was 42.5%, the flow rate was nearly invariant with the increase of peristaltic pump power. Under the same peristaltic pump power, the lower concentration of slurry had the higher flow rate. Because of the decline proportion of MEPCM in slurry, the proportion of water in slurry was increased. The flow characteristic of the slurry was closer to the water. The higher concentration of the slurry would make pipeline system at higher pressure.
5. MEPCMs Stability
5.1. MEPCMs Stability Experiment Rig Setp
The aim of this experiment is to research whether surfactant can improve the stability of MEPCM slurry. The turbidity method is a common method used to evaluate the property of slurry stability. Lower turbidity implies higher stability of the mixed slurry [
16]. In this experiment, the turbidity method is employed to investigate the stability of the slurry. Since the material is less dense than water, the dispersion caused by gravity will make the slurry unstable [
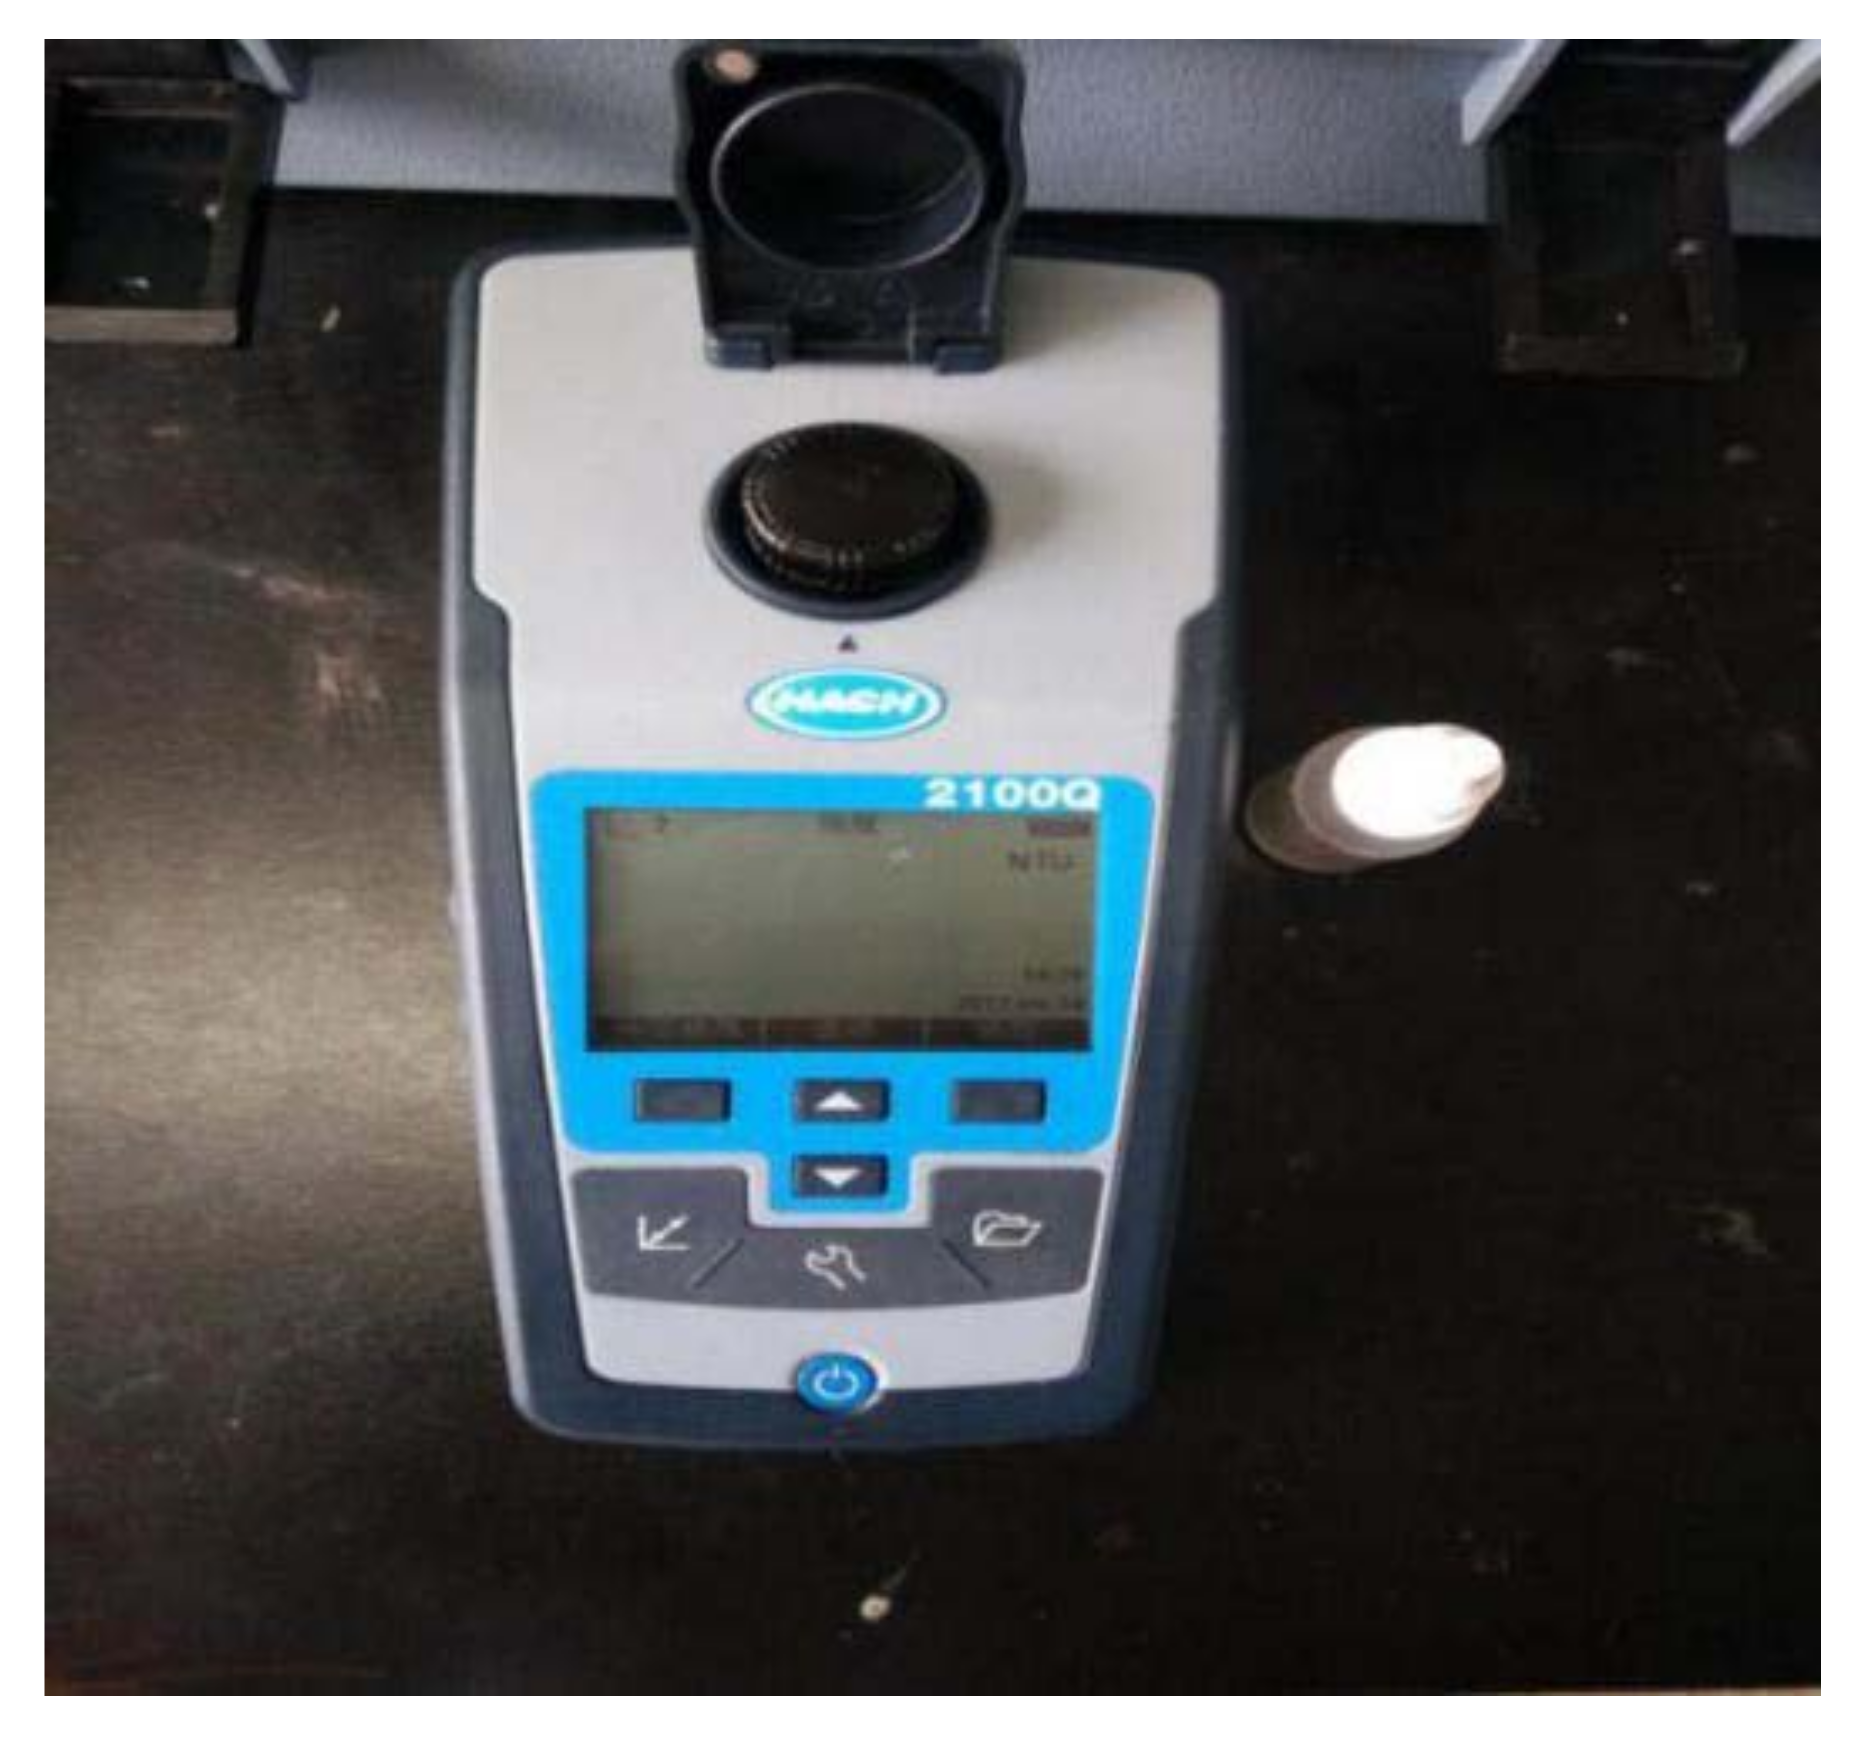
17]. The experiment tests MEPCM slurry with water and other two different surface-active agent materials, PEG400 (Polyethylene glycol 400) and SA (sodium alginate), at volume concentrations of 15%, 30%, and 40%. The materials were produced by Chang Zheng company (Chengdu, China).The measurements are tested by a US AHCH2100Q (Chang Zheng company, Chengdu, China) portable turbid meter (
Figure 12).
Sodium alginate (SA) is an anionic poly glycan electrolyte with highly hydrophilic molecules, which is insoluble in ethanol and acid liquid. PEG 400 is a water-soluble polymer carbon chain, which is widely used in the field of biomedical materials because of its good biocompatibility [
18,
19]. SA and PEG 400 are mixed with MEPCMs to obtain slurry at volume concentrations of 15%, 30%, 40%. The slurry is observed after standing for 48 h and then the US AHCH2100Q portable turbid meter is used to test the turbidity of the slurry.
5.2. MEPCMs Stability Result and Analysis
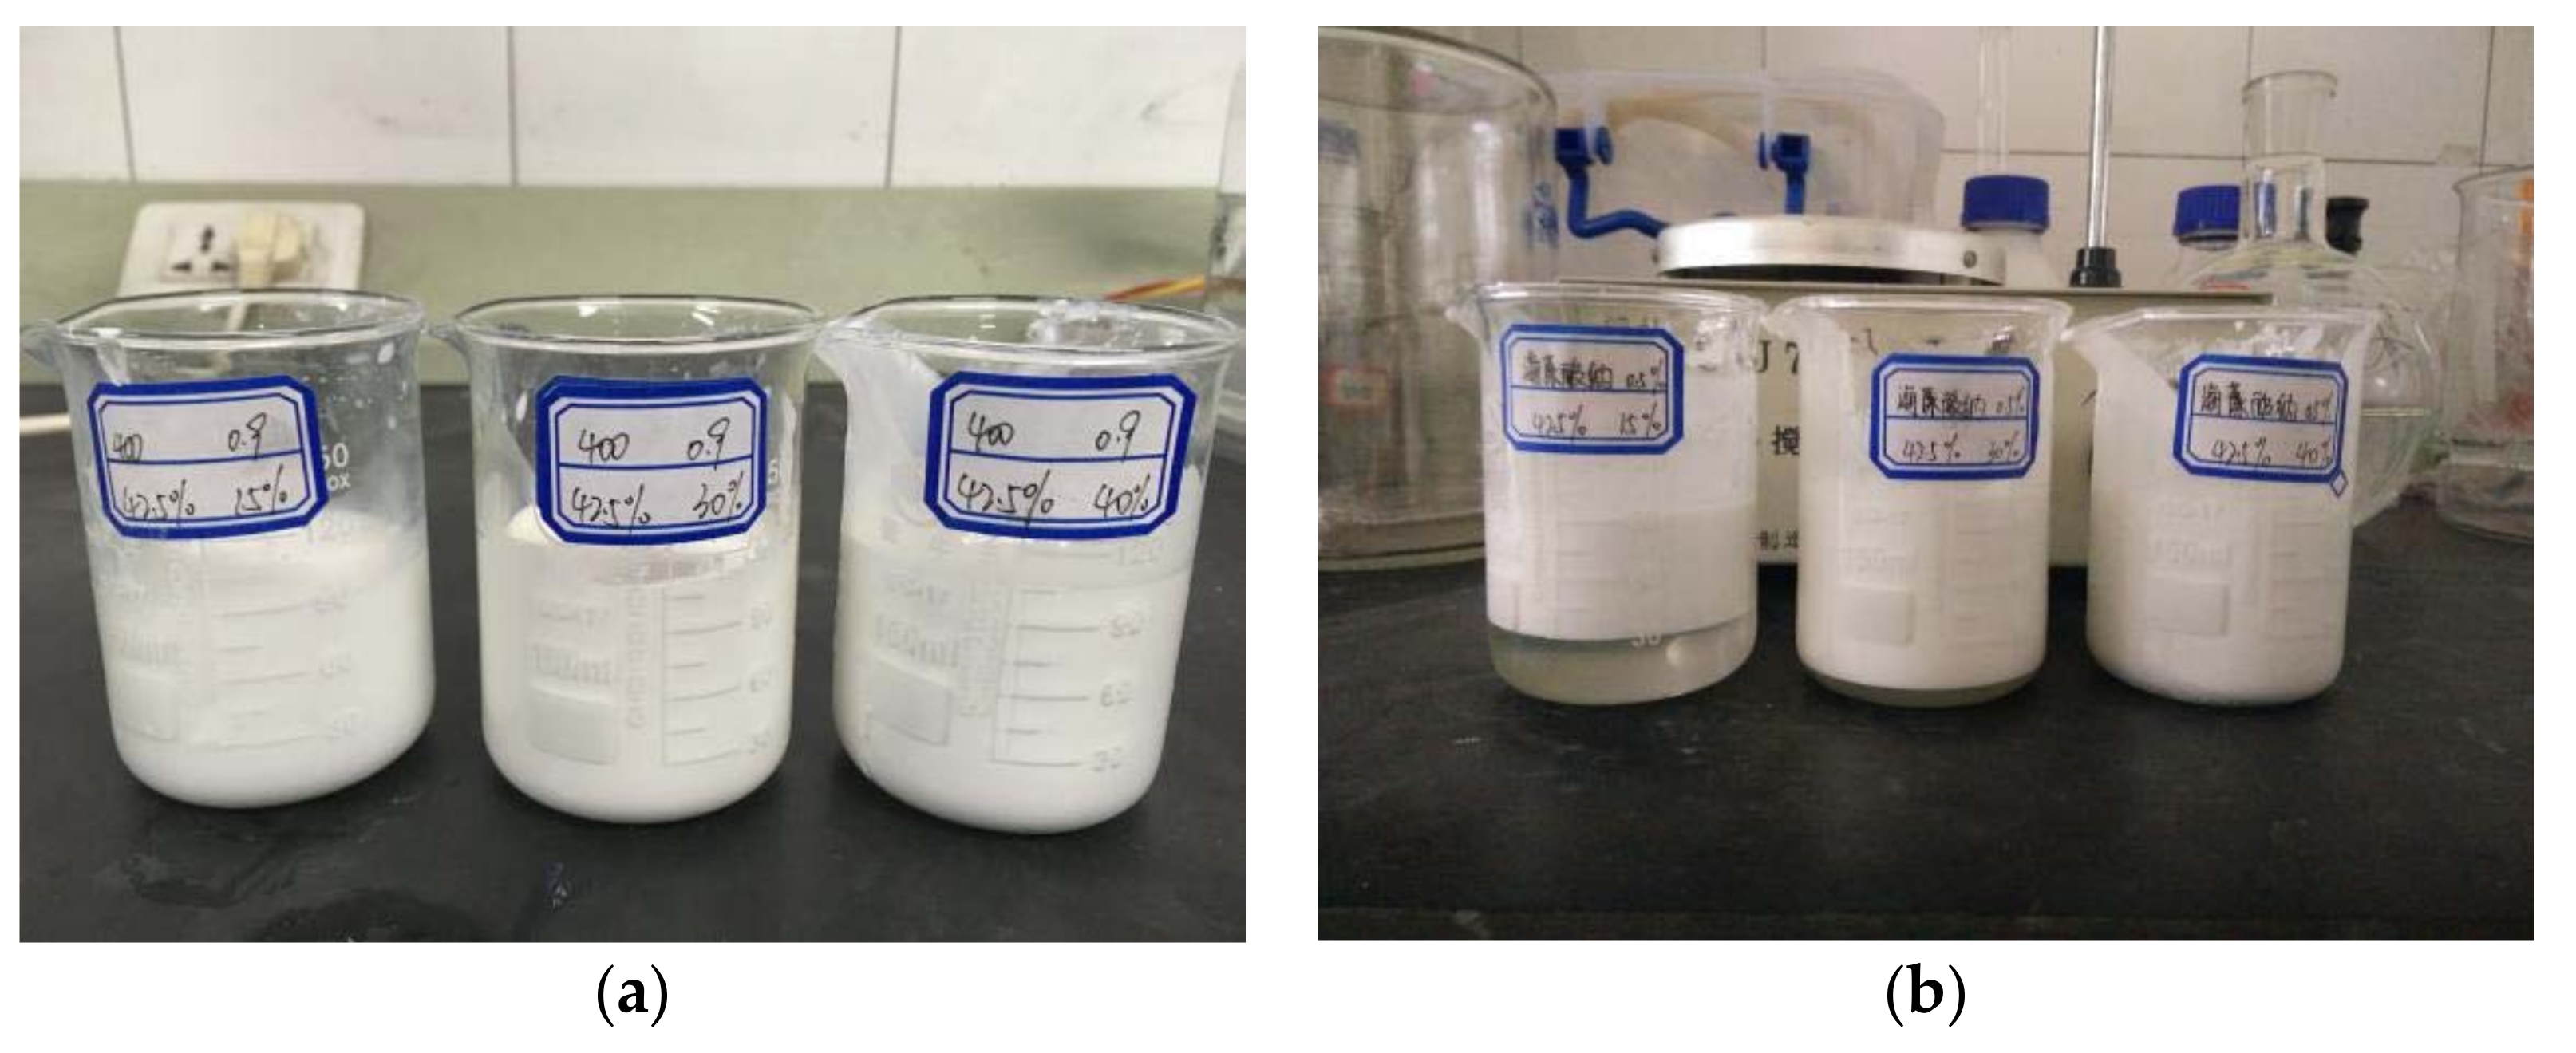
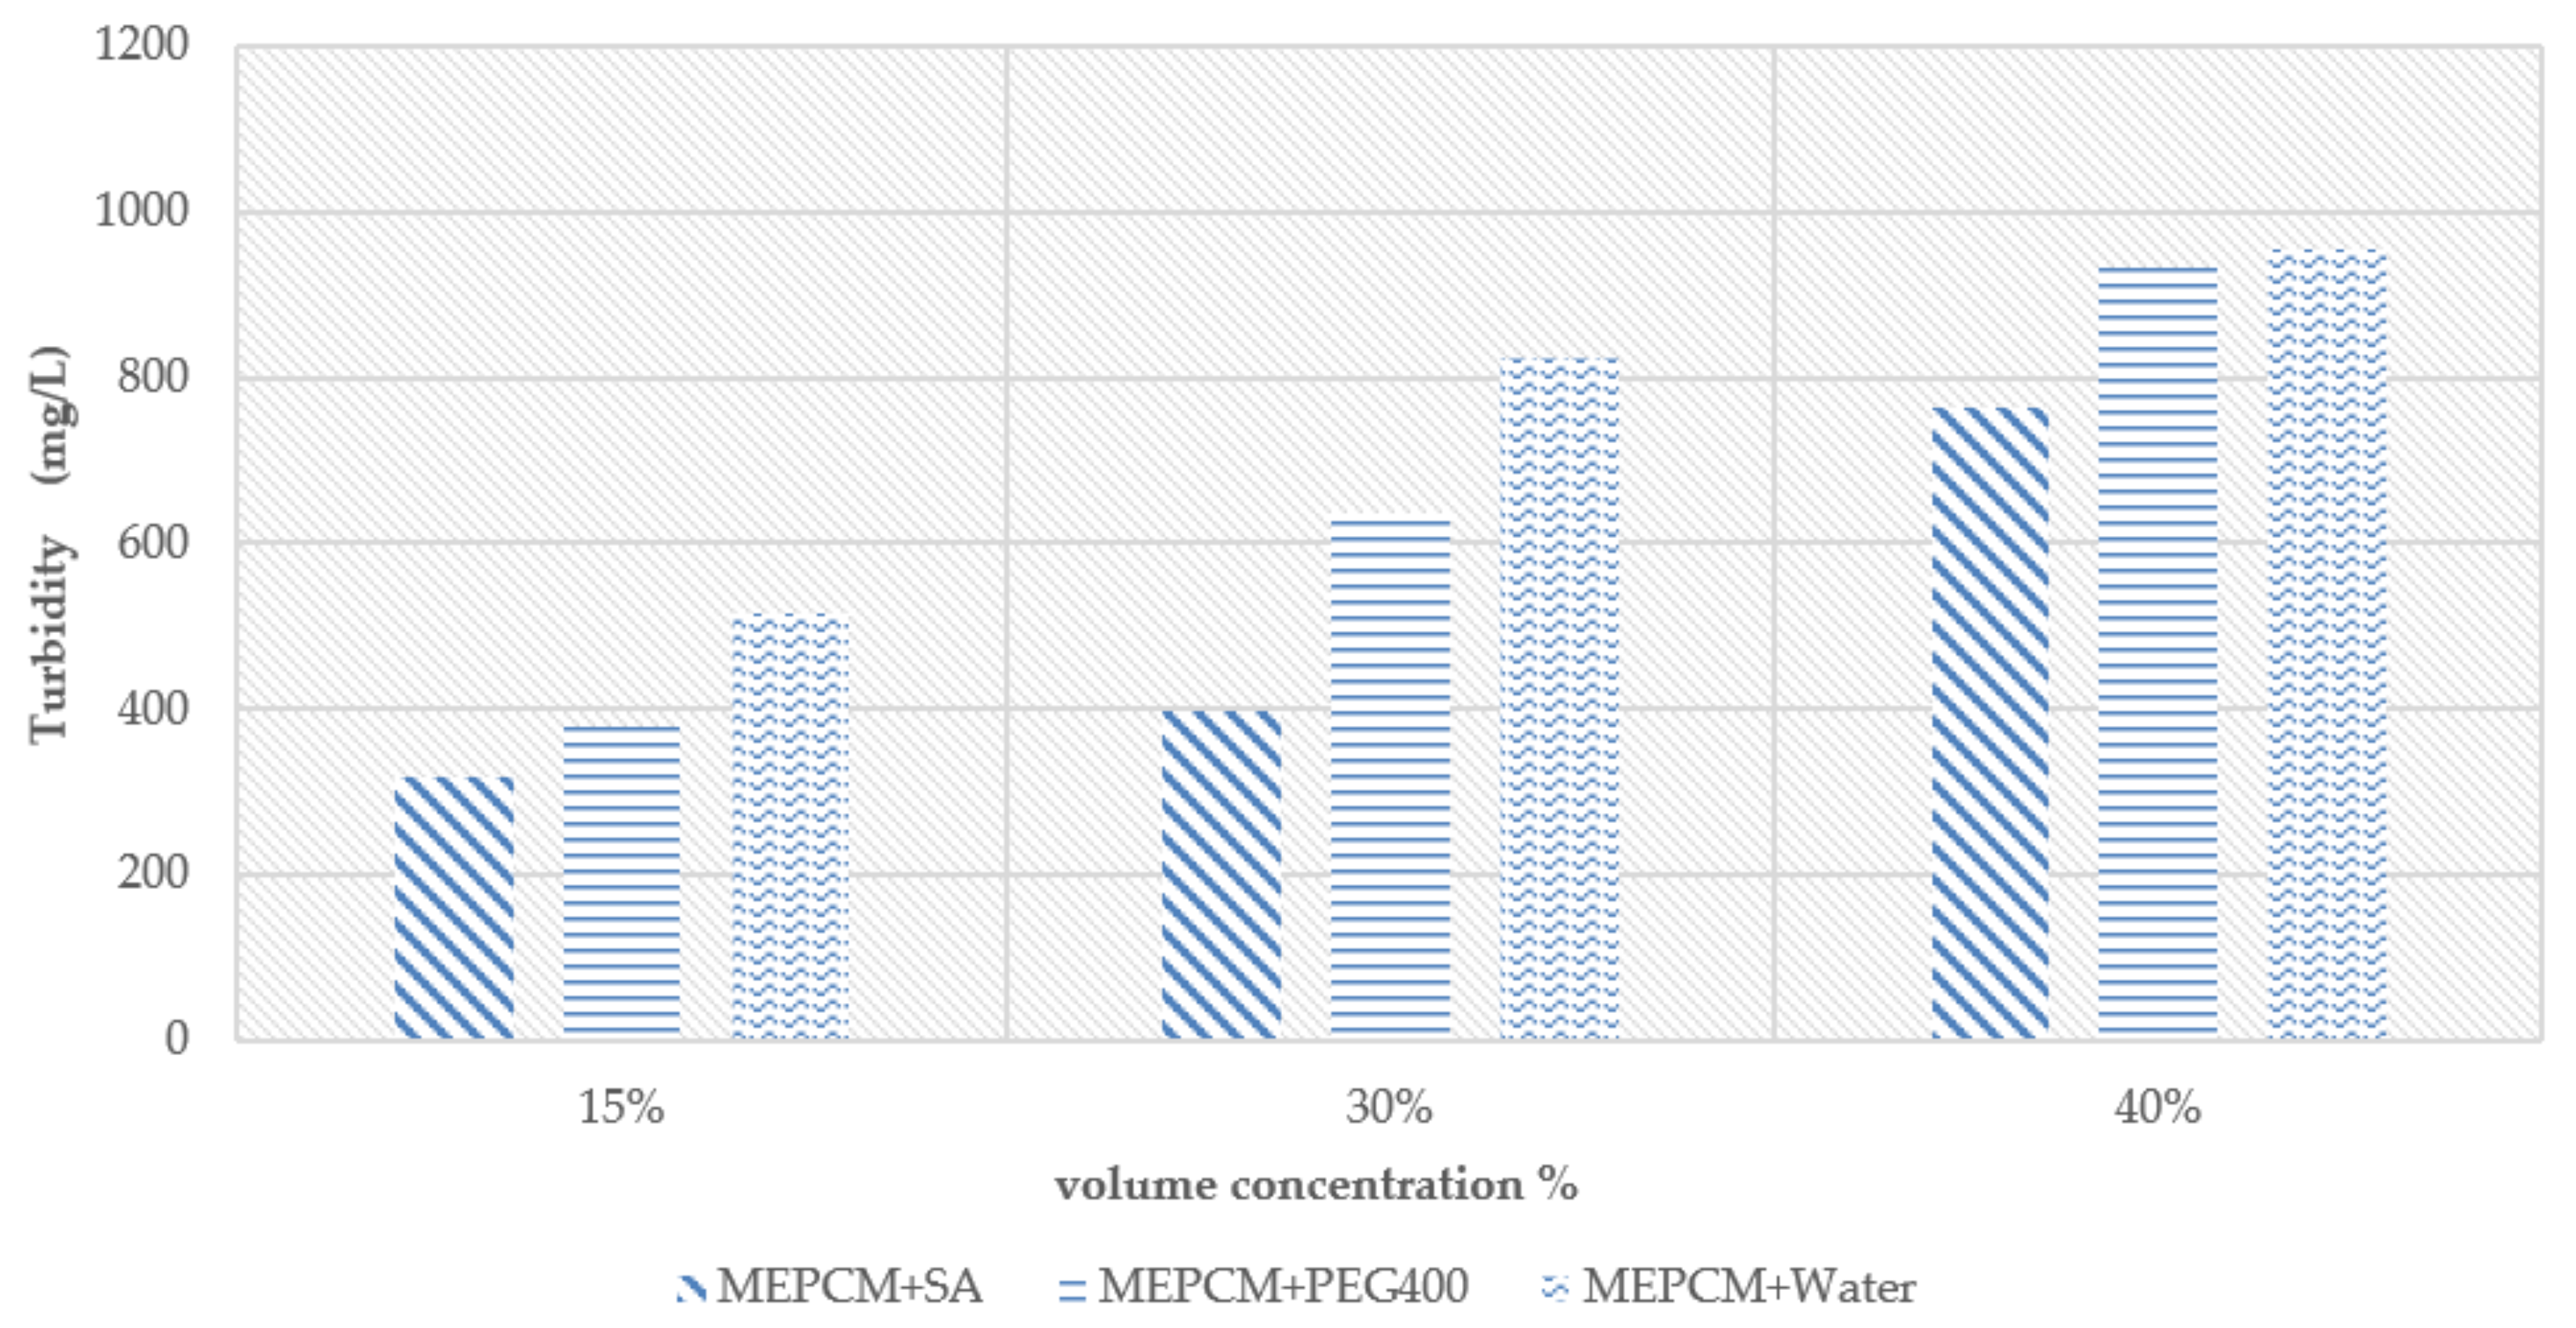
Figure 13 shows different volume concentration slurry after stood 48 h. According to the observation, the MEPCM slurry with PEG400 was more uniformly-distributed than MEPCM slurry with SA. It was found that the MEPCM slurry with SA slurry was homogeneous at concentrations 30% and 40%. The experimental turbidity measurements are shown in
Figure 14. The results show that the turbidity of both MEPCM slurry with PEG 400 and MEPCM slurry with SA are lower than MEPCM slurry. Thus, it can be determined that both of these surfactants have a positive effect on the stability of the slurry. Compared to the slurry of MEPCM with PEG400, the slurry of MEPCM with SA is more stable.
6. Conclusions
In this article, thermal properties of PCM and MEPCM such as phase change temperature, enthalpy, thermal conductivity, flow rates and energy transport effectiveness have been tested. Based on the results of DSC tests, it was discovered that it is more advantageous to use MEPCM in cold storage/transportation system with solar-driven cooling cycle than PCM. In addition, it can be concluded that MEPCM has a better heat conductivity performance than PCM based on the comparative study of their thermal conductivities performed. The flow characteristics experiment showed that the flow rate increases with the increased power of the peristaltic pump. The results of the stability experiment performed on MEPCM slurry indicated that the stability of the slurry can be improved by surfactants SA and PEG400. Furthermore, SA has the better improvement rate on slurry stability than PEF400. The study can assist in the selection of the most suitable chilling medium and thus further optimize the design of the cold storage/transportation system with solar driven cooling cycle.
Acknowledgments
This project is funded by the National Natural Science Foundation of China (No. 51508352), Science & Technology Bureau Foundation of Chengdu City, China (No. 2015-HM01-00244-SF) and Key Laboratory Deep Underground Science and Engineering Foundation of Sichuan University, China (No. DUSE201702).
Author Contributions
Lin Zheng took part in all the experiments and write the manuscript. The corresponding author Wei Zhang guided the experiments and the paper writing. Shuang Lin was responsible for recording data. Fei Liang and Xiangyu Jin was responsible for setting up the experimental rig.
Conflicts of Interest
There is no conflicts of interest regarding the publication of this paper.
References
- Olabi, A.G. Renewable energy and energy storage systems. Energy 2017, 136, 1–6. [Google Scholar] [CrossRef]
- Zhang, D.; Wang, J.; Lin, Y. Present situation and future prospect of renewable energy in China. Renew. Sustain. Energy Rev. 2017, 76, 865–871. [Google Scholar] [CrossRef]
- Zhao, G.Y.; Liu, Z.Y.; He, Y.; Cao, H.J.; Guo, Y.B. Energy consumption in machining: Classification, prediction, and reduction strategy. Energy 2017, 133, 142–157. [Google Scholar] [CrossRef]
- Gugulothu, R.; Somanchi, N.S.; Banoth, H.B.; Banothu, K. A Review on Solar Powered Air Conditioning System. Procedia Earth Planet. Sci. 2015, 11, 361–367. [Google Scholar] [CrossRef]
- Kalkan, N.; Young, E.A.; Celiktas, A. Solar thermal air conditioning technology reducing the footprint of solar thermal air conditioning. Renew. Sustain. Energy Rev. 2012, 16, 6352–6383. [Google Scholar] [CrossRef]
- Nkwetta, D.N.; Sandercock, J. A state-of-the-art review of solar air-conditioning systems. Renew. Sustain. Energy Rev. 2016, 60, 1351–1366. [Google Scholar] [CrossRef]
- Balghouthi, M.; Chahbani, M.H.; Guizani, A. Solar Powered air conditioning as a solution to reduce environmental pollution in Tunisia. Desalination 2005, 185, 105–110. [Google Scholar] [CrossRef]
- Rhee, K.; Kim, K.W. A 50 year review of basic and applied research in radiant heating and cooling systems for the built environment. Build. Environ. 2015, 91, 166–190. [Google Scholar] [CrossRef]
- Osterman, E.; Butala, V.; Stritih, U. PCM thermal storage system for ‘free’ heating and cooling of buildings. Energy Build. 2015, 106, 125–133. [Google Scholar] [CrossRef]
- Farid, M.M.; Khudhair, A.M.; Razack, S.A.K. A review on phase change energy storage: Materials and applications. Energy Convers. Manag. 2004, 45, 1597–1615. [Google Scholar] [CrossRef]
- Iten, M.; Liu, S.; Shukla, A. A review on the air-PCM-TES application for free cooling and heating in the buildings. Renew. Sustain. Energy Rev. 2016, 61, 175–186. [Google Scholar] [CrossRef]
- Xu, B.; Li, P.; Chan, C. Application of phase change materials for thermal energy storage in concentrated solar thermal power plants: A review to recent developments. Appl. Energy 2015, 160, 286–307. [Google Scholar] [CrossRef]
- Su, W.; Darkwa, J.; Kokogiannakis, G. Development of microencapsulated phase change material for solar thermal energy storage. Appl. Therm. Eng. 2017, 112, 1205–1212. [Google Scholar] [CrossRef]
- Alvarado, J.L.; Marsh, C.; Sohn, C.; Phetteplace, G.; Newell, T. Thermal performance of microencapsulated phase change material slurry in turbulent flow under constant heat flux. Int. J. Heat Mass Transf. 2007, 50, 1938–1952. [Google Scholar] [CrossRef]
- Jin, X.; Zhang, W.; Zheng, L. Application of PCM in green building and MEPCM thermal performance optimization research. Sichuan Archit. 2017, 4, 269–271. [Google Scholar]
- Li, F.Y.; Dai, D.H.; Zhao, T.B. Preparation of Paraffin Microemulsion by Nonionic and Anionic Surfactants. J. Petrochem. Univ. 2012, 2, 12–15. [Google Scholar]
- Jie, Q.; Guo, Z.; Wen, W. Effects of Ultrasonic Oscillation on the Morphology of Carbon Nanotubes. J. Petrochem. Univ. 2013, 3, 57–61. [Google Scholar]
- Lee, P.H.; Hoffer, T.E.; Schorran, D.E.; Ellis, E.C.; Moyer, J.W. Laser transmissometer—A description. Sci. Total Environ. 1982, 23, 321–335. [Google Scholar] [CrossRef]
- Chattopadhyay, J.; de Jesus Cortez, F.; Chakraborty, S.; Slater, N.K.; Billups, W.E. Synthesis of Water-Soluble PEGylated Single-Walled Carbon Nanotubes. Chem. Mater. 2006, 18, 5864–5868. [Google Scholar] [CrossRef]
© 2017 by the authors. Licensee MDPI, Basel, Switzerland. This article is an open access article distributed under the terms and conditions of the Creative Commons Attribution (CC BY) license (http://creativecommons.org/licenses/by/4.0/).


