Study on the Effects of Thermal Aging on Insulating Paper for High Voltage Transformer Composite with Natural Ester from Palm Oil Using Fourier Transform Infrared Spectroscopy (FTIR) and Energy Dispersive X-ray Spectroscopy (EDS)


Abstract
:1. Introduction
2. Materials and Methods
2.1. Samples
2.2. Tensile Strength (TS) and Degree of Polymerization (DP)
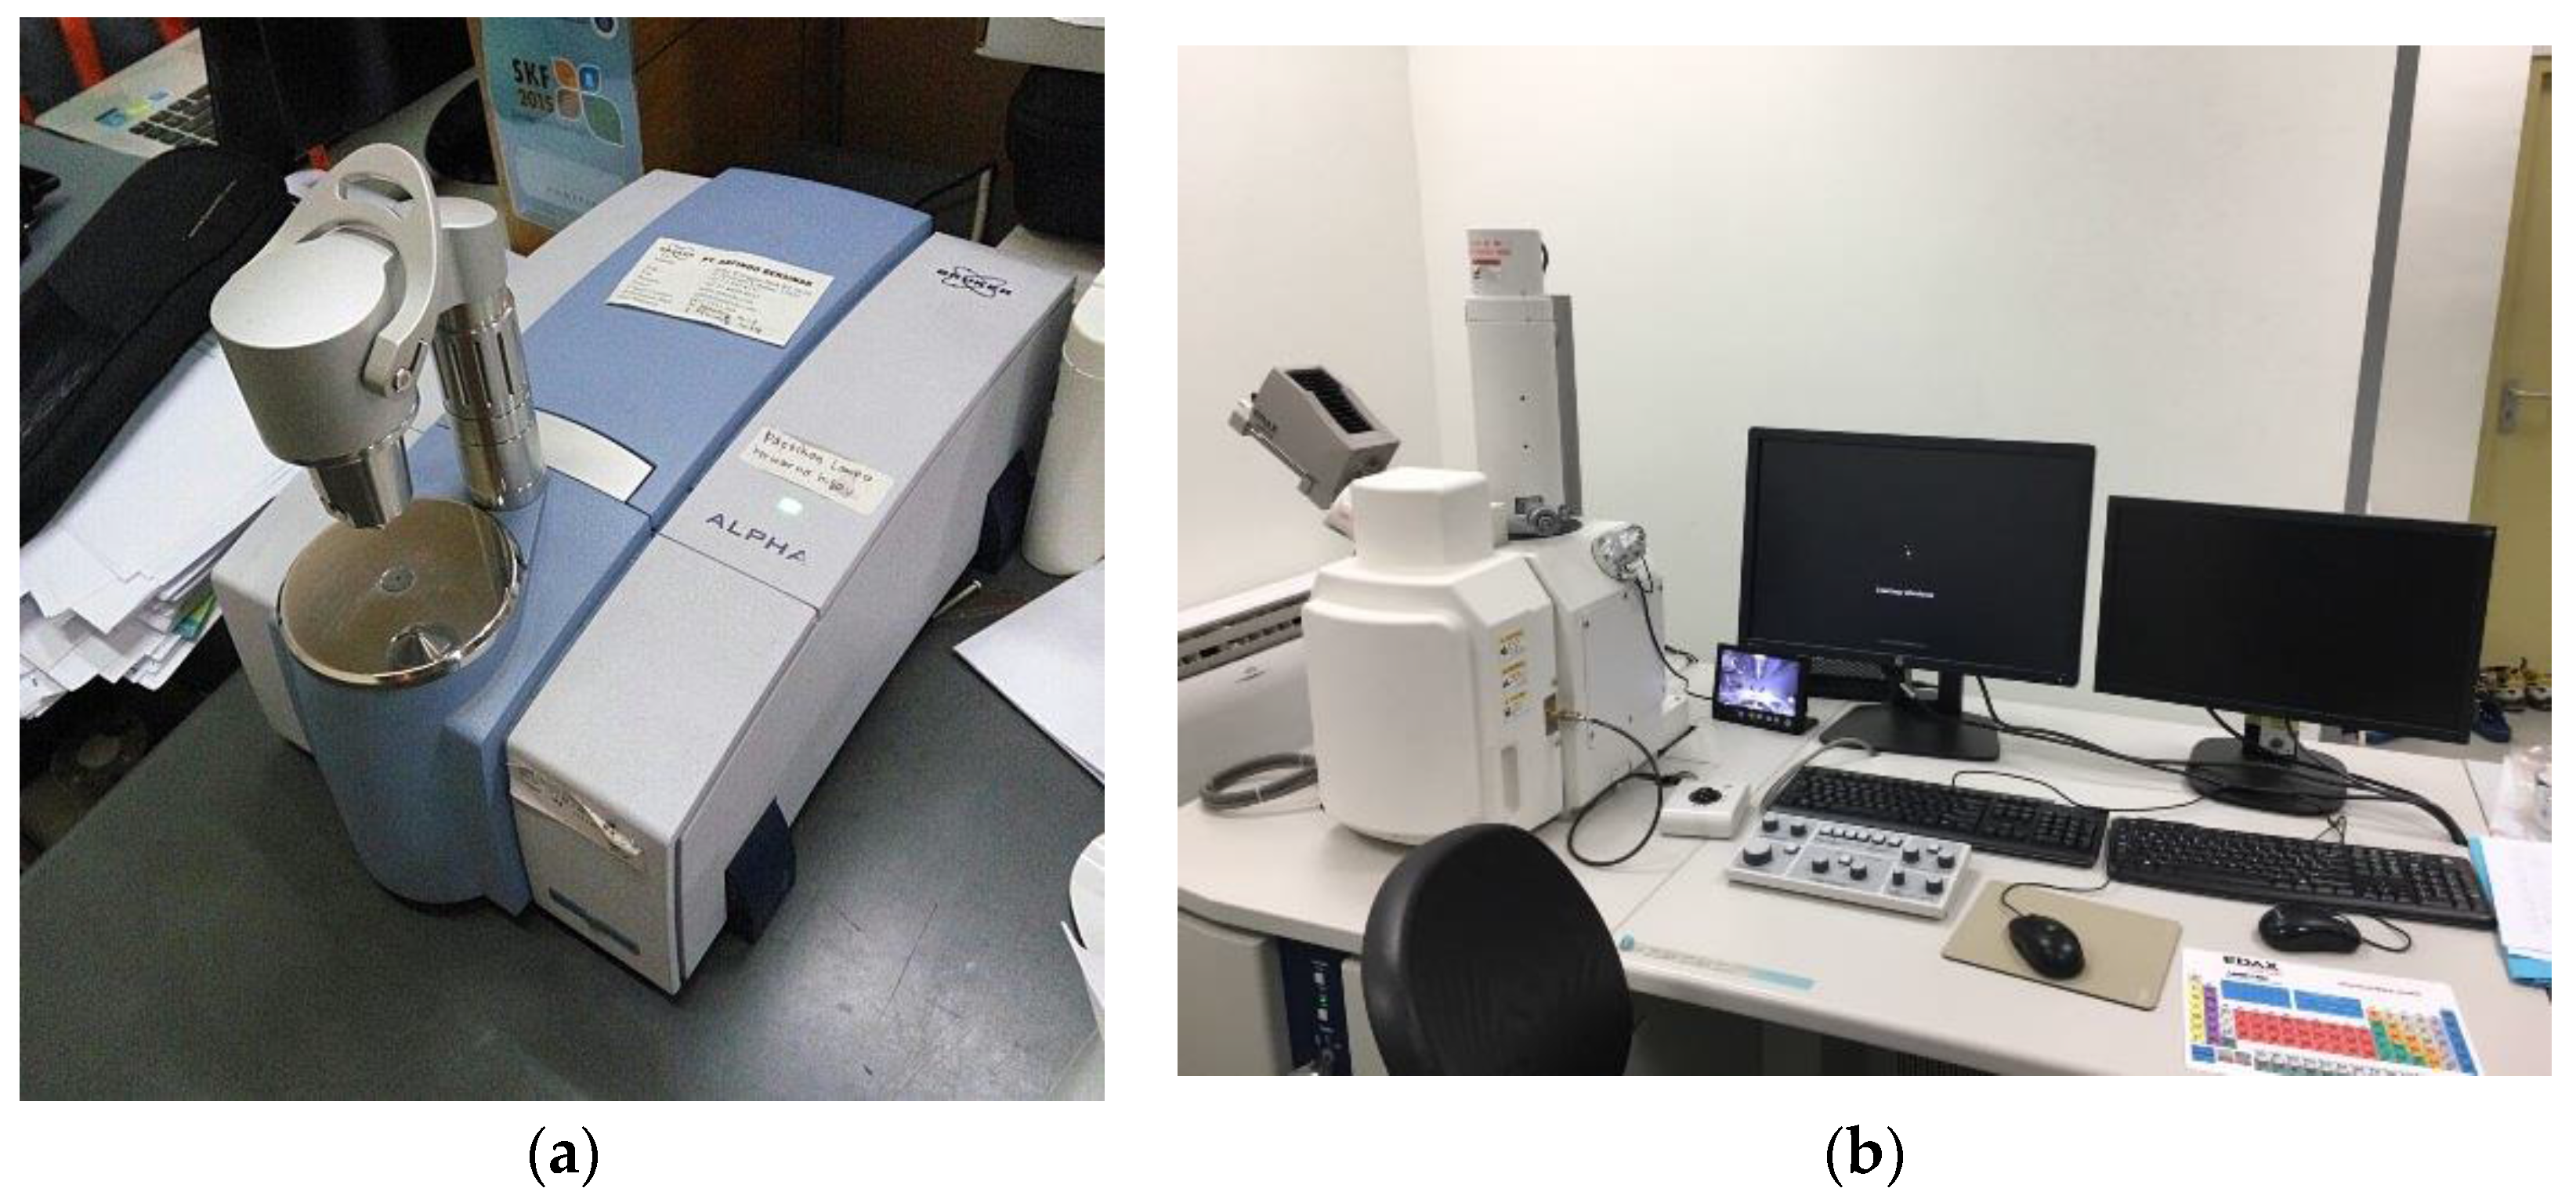
2.3. Fourier Transform Infrared Spectroscopy (FTIR) and Energy Dispersive X-ray Spectroscopy (EDS)
3. Results and Discussion
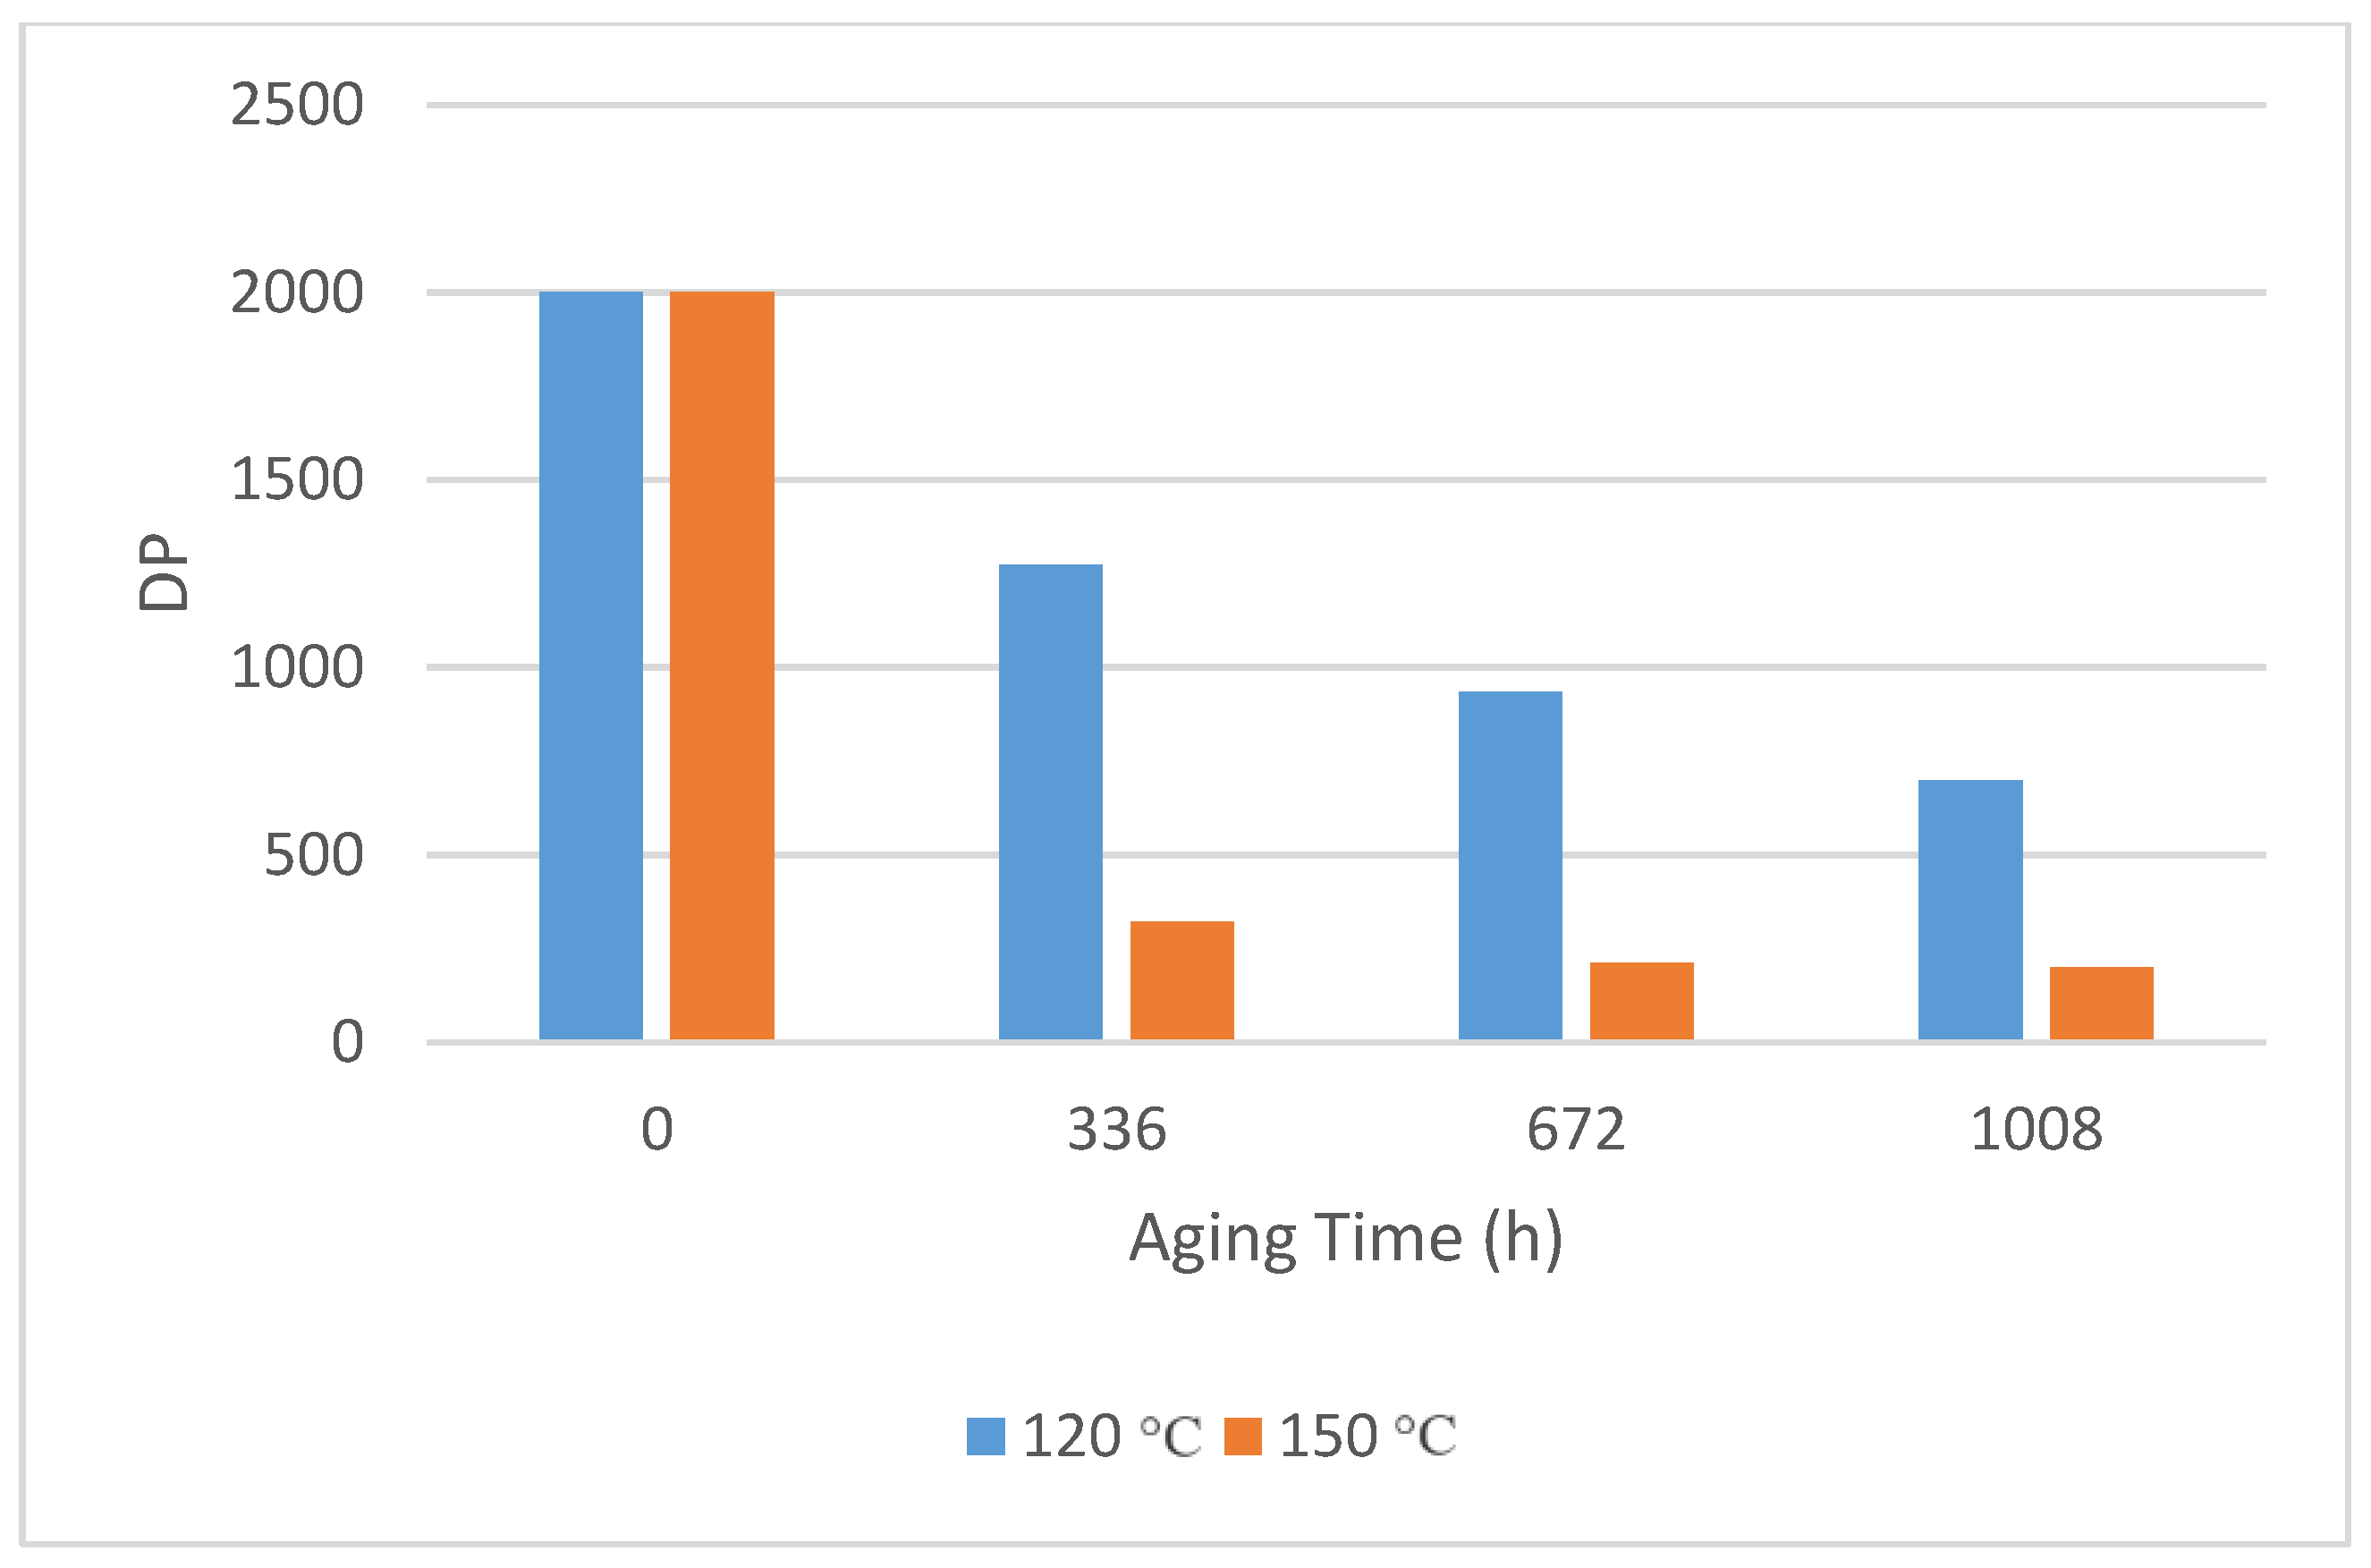
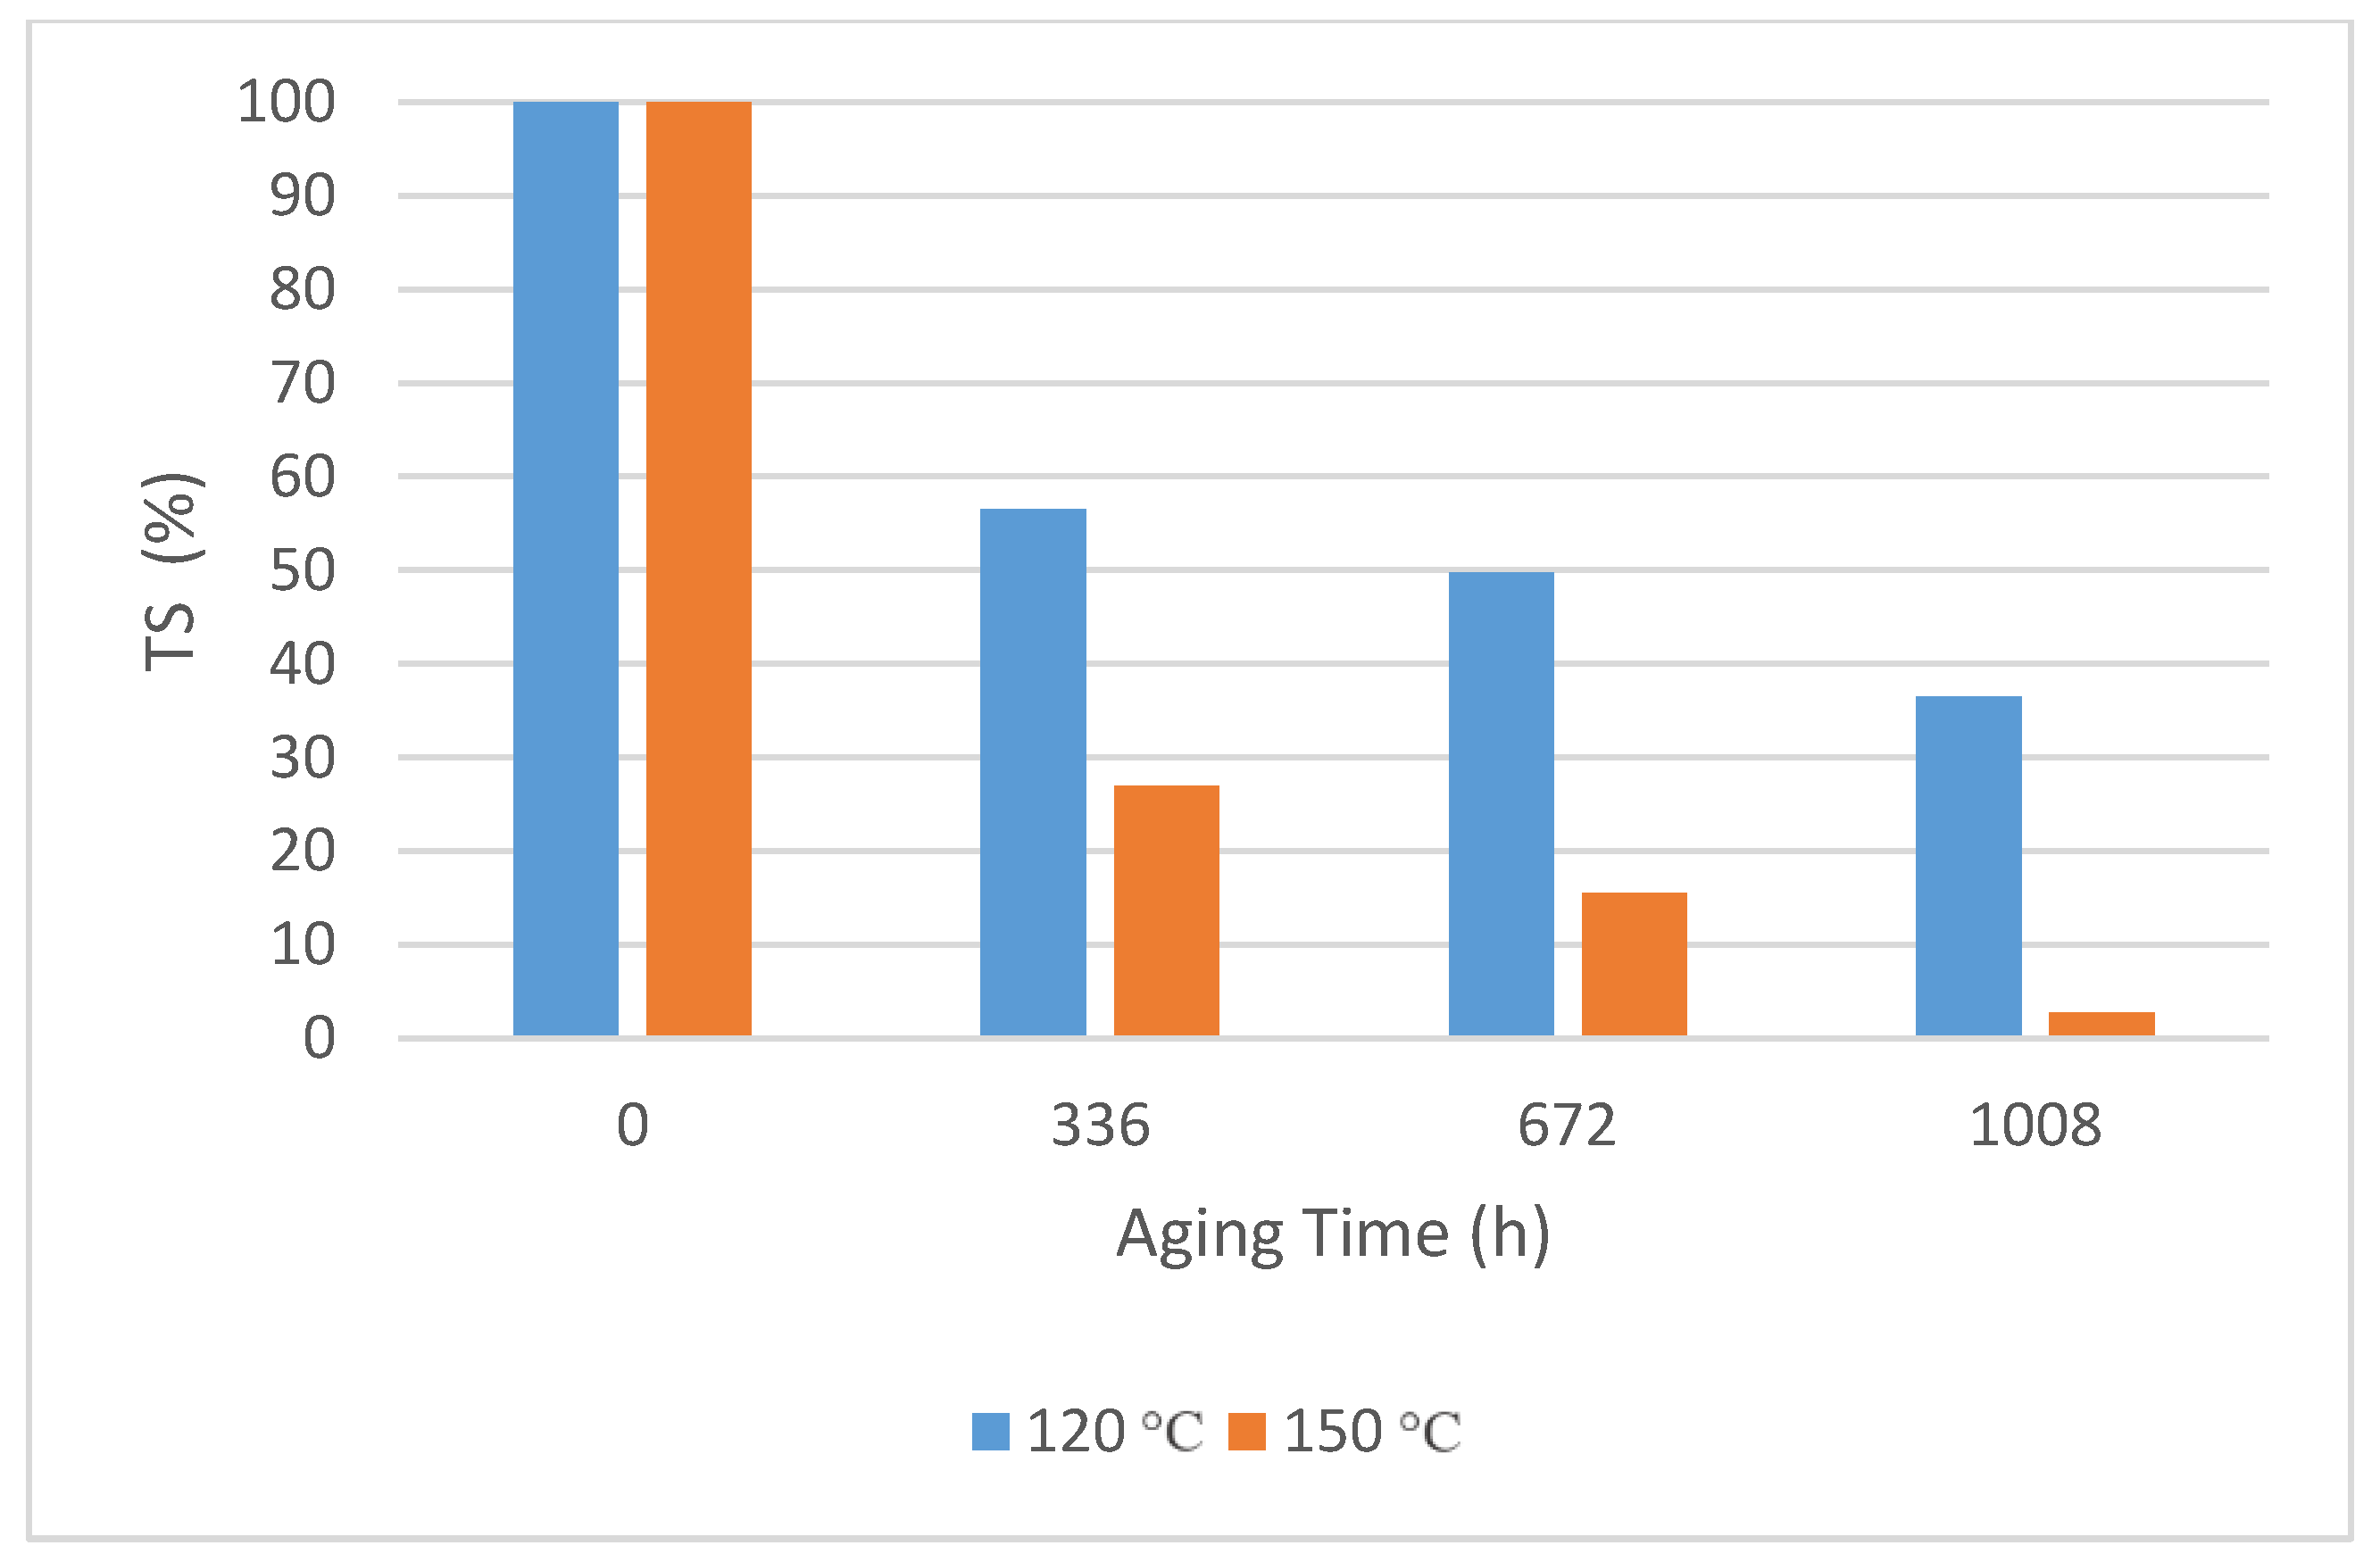
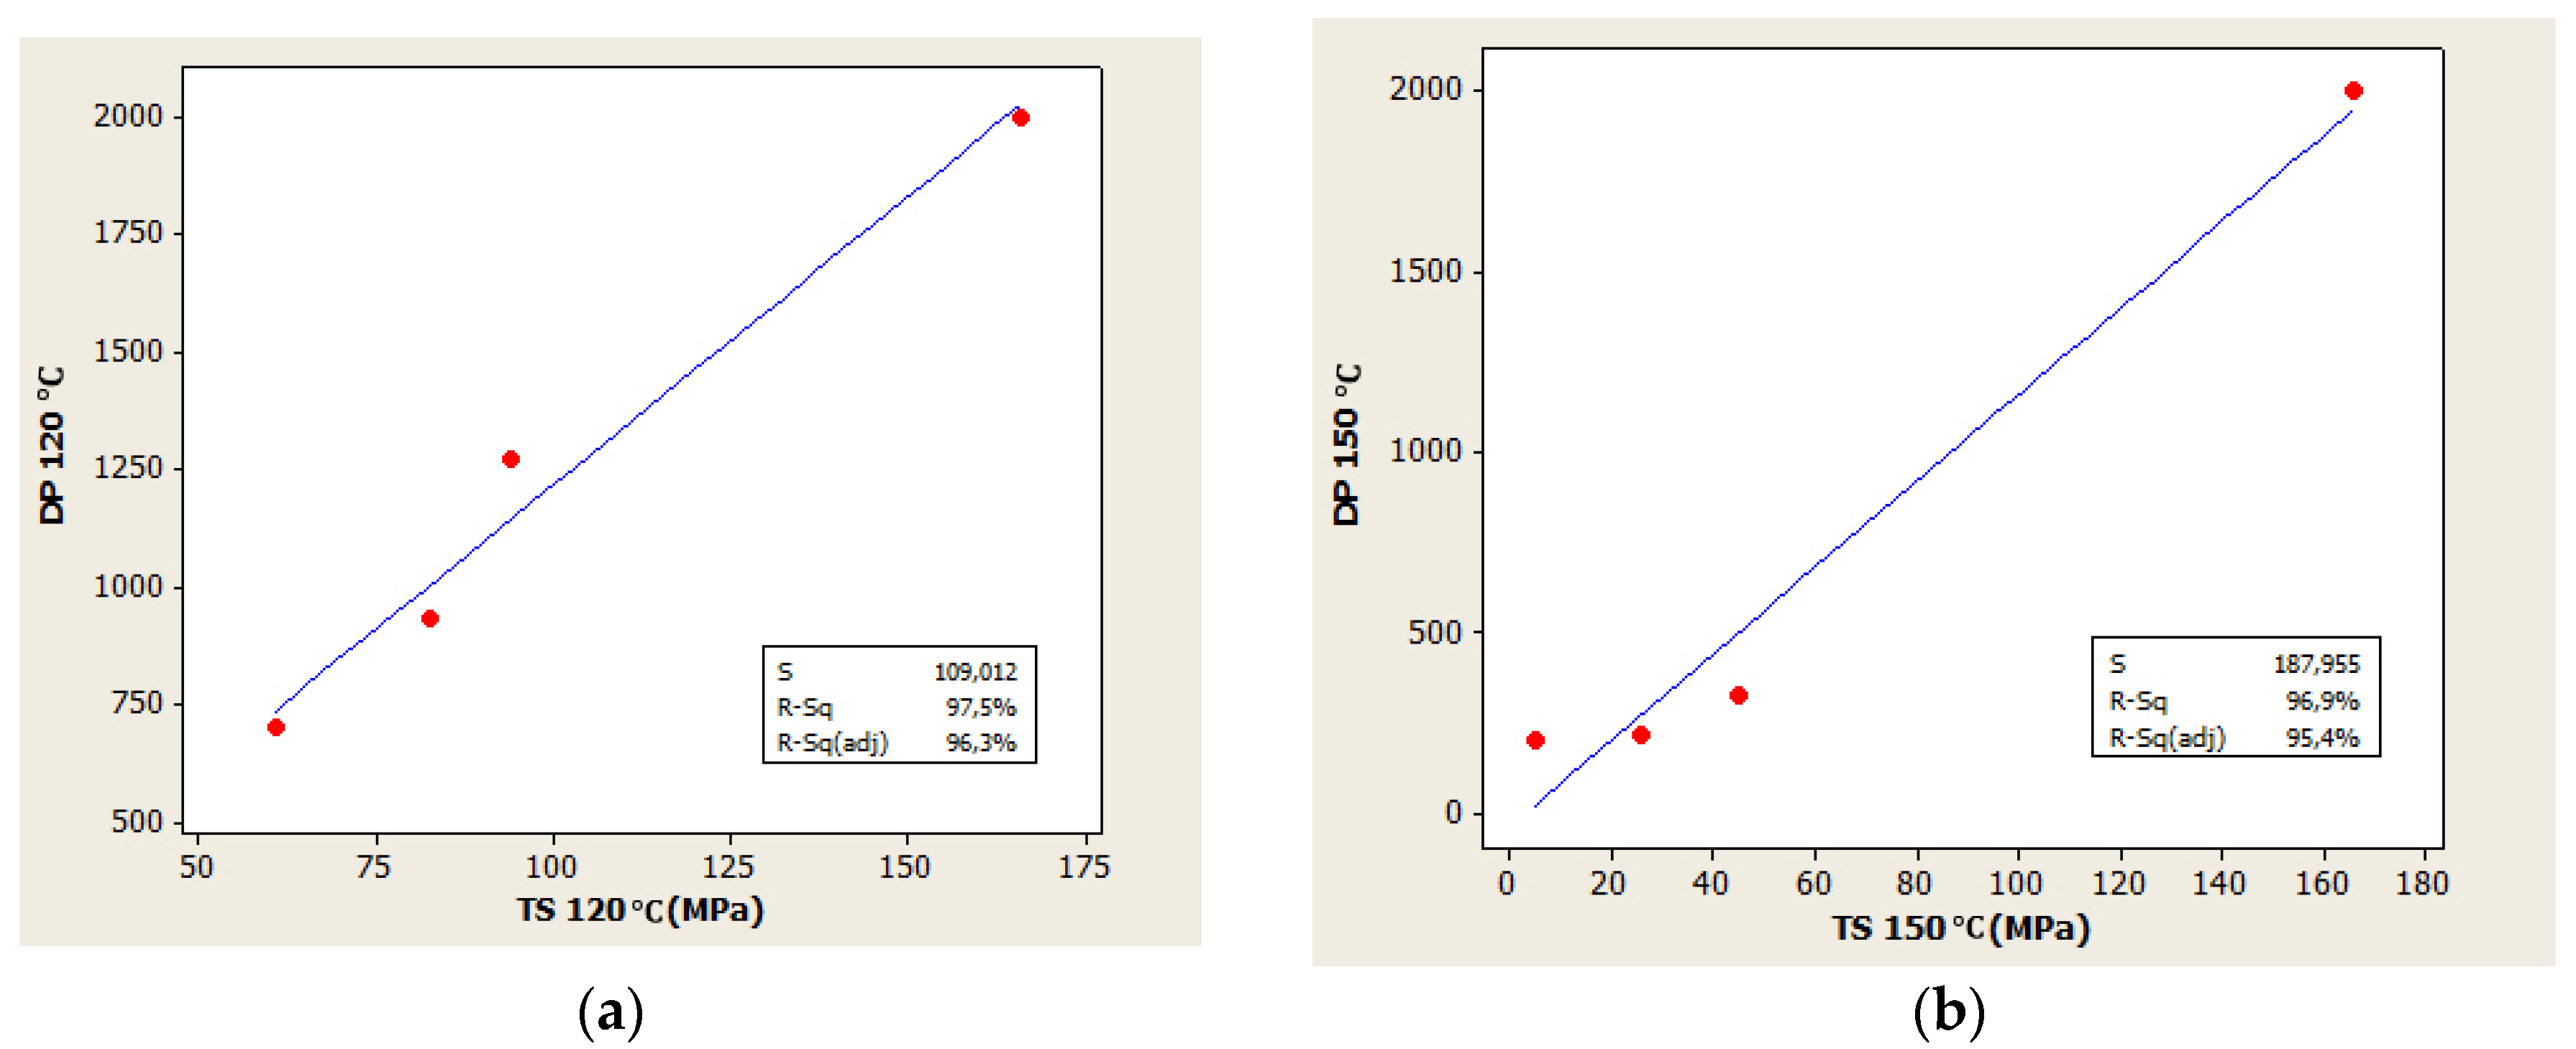
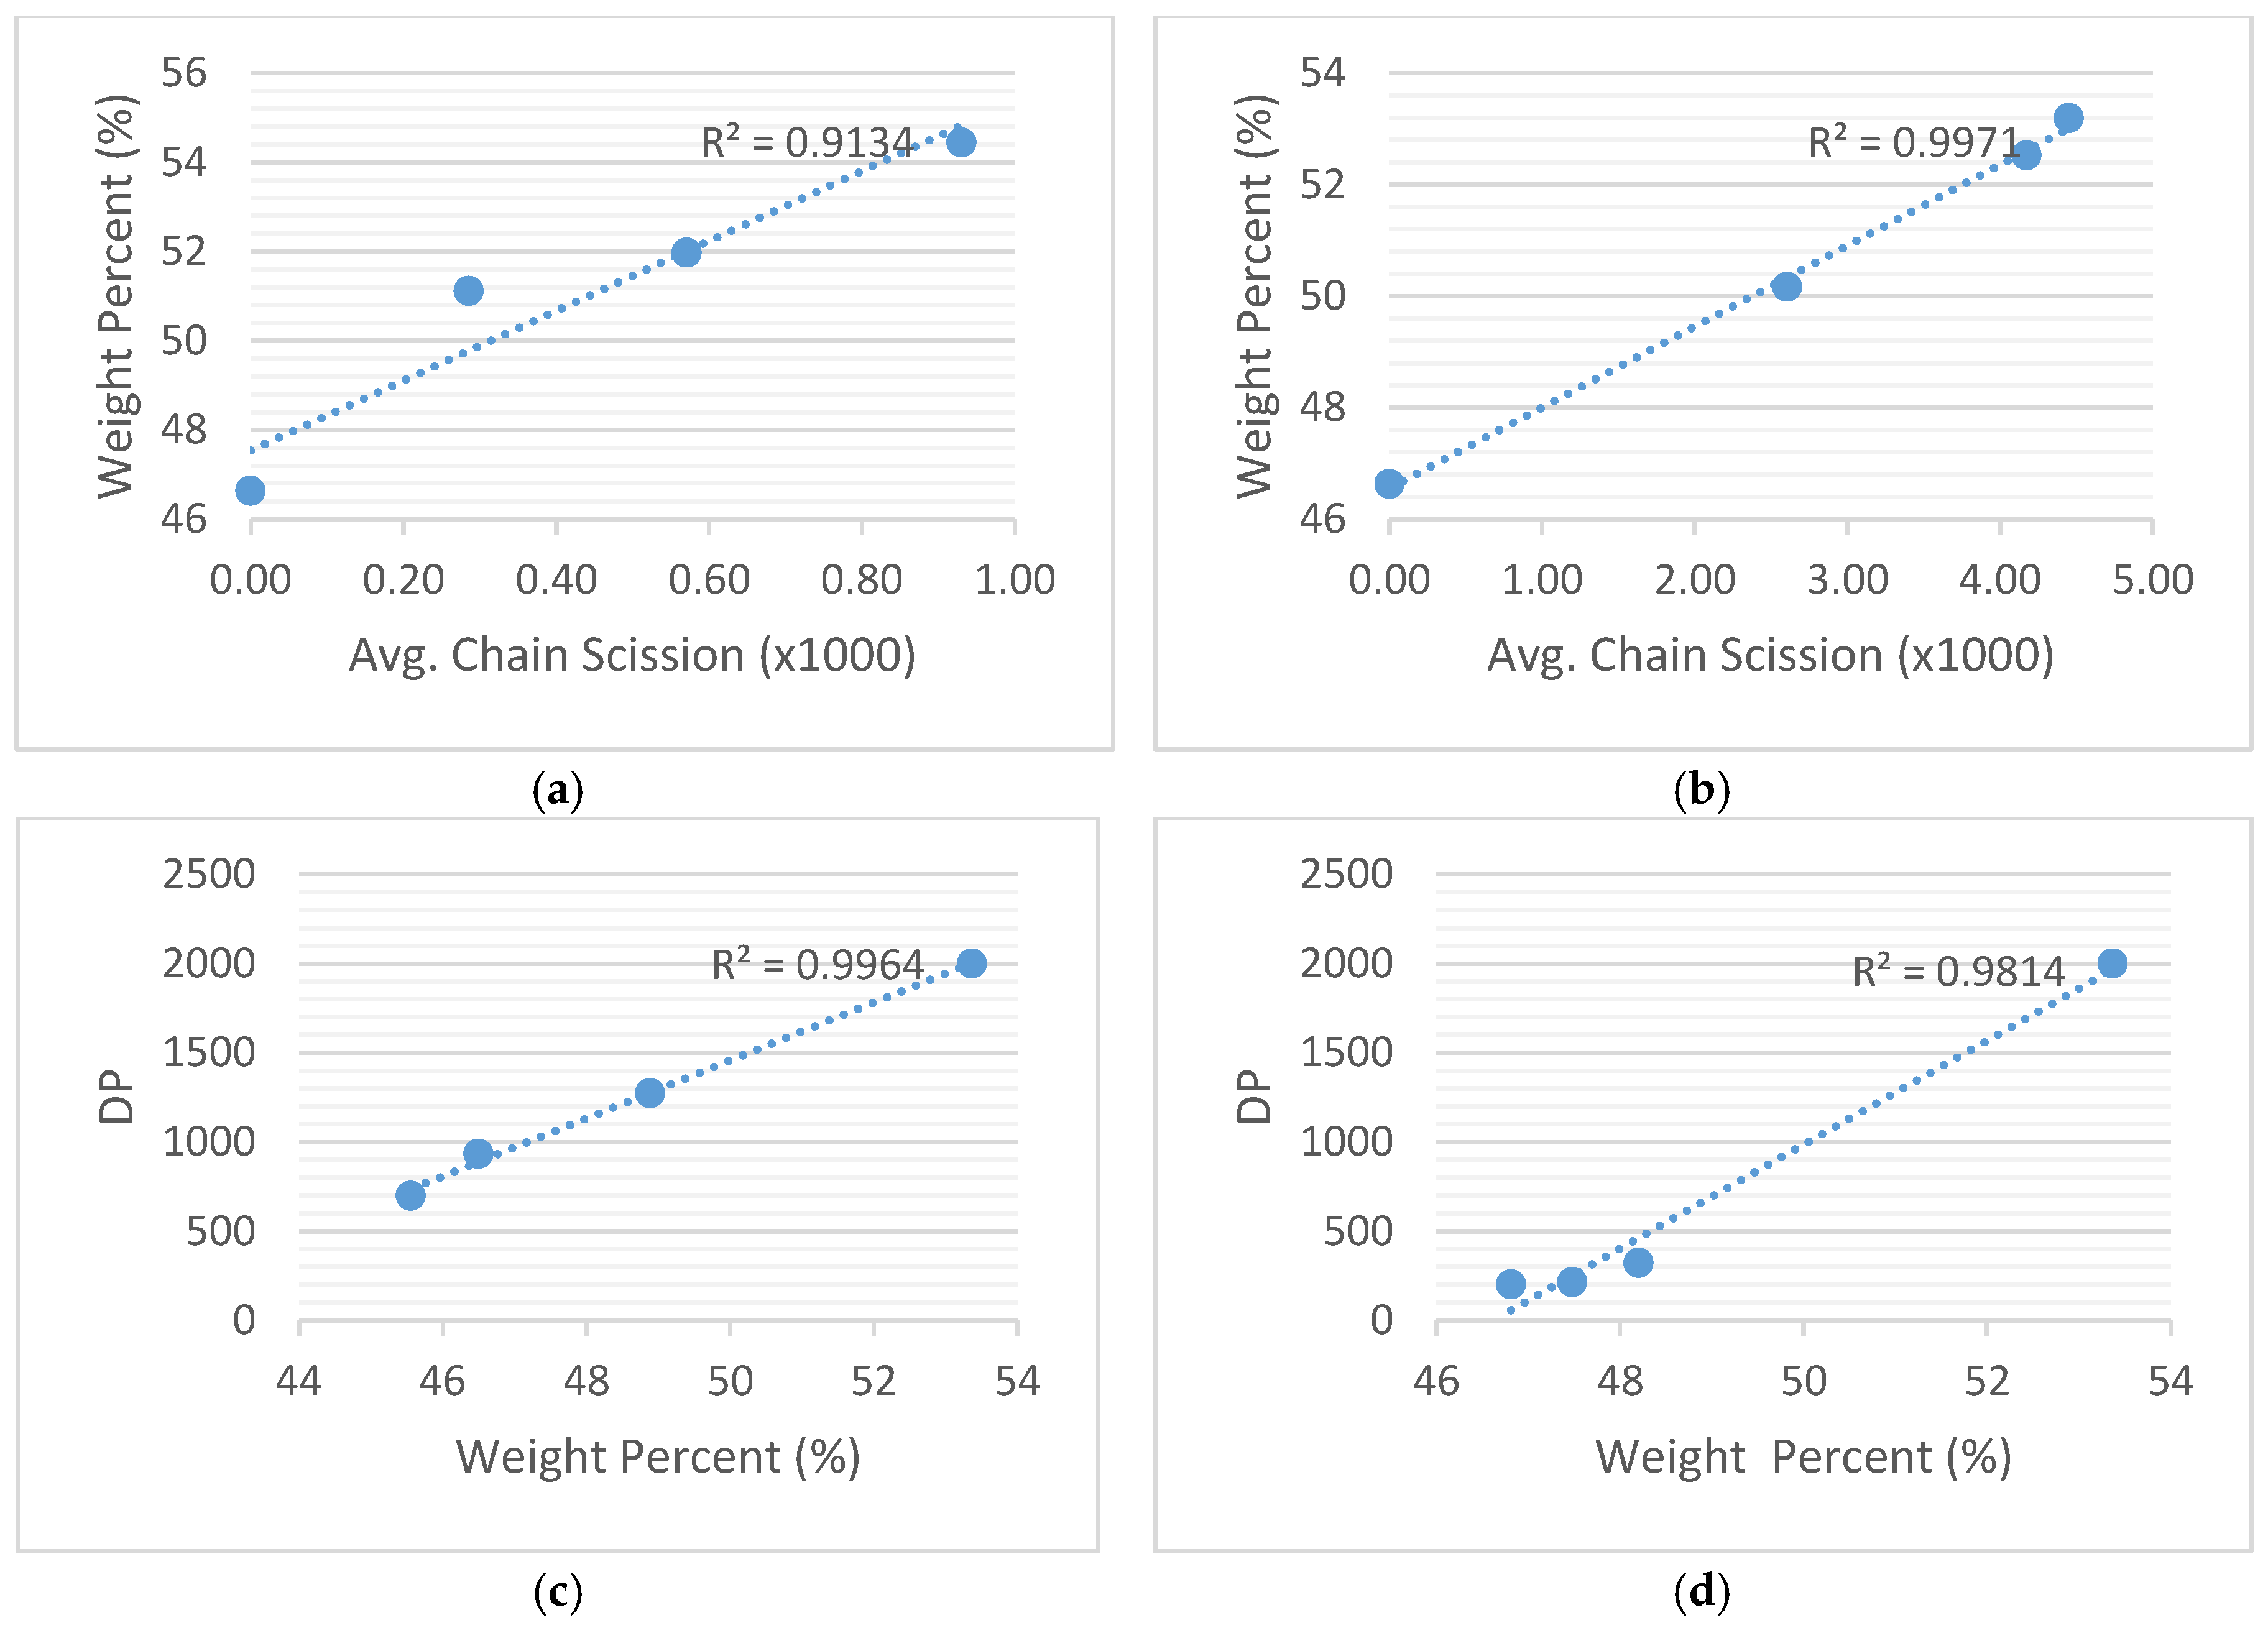
3.1. Degree of Polymerization (DP) and Tensile Strength (TS)
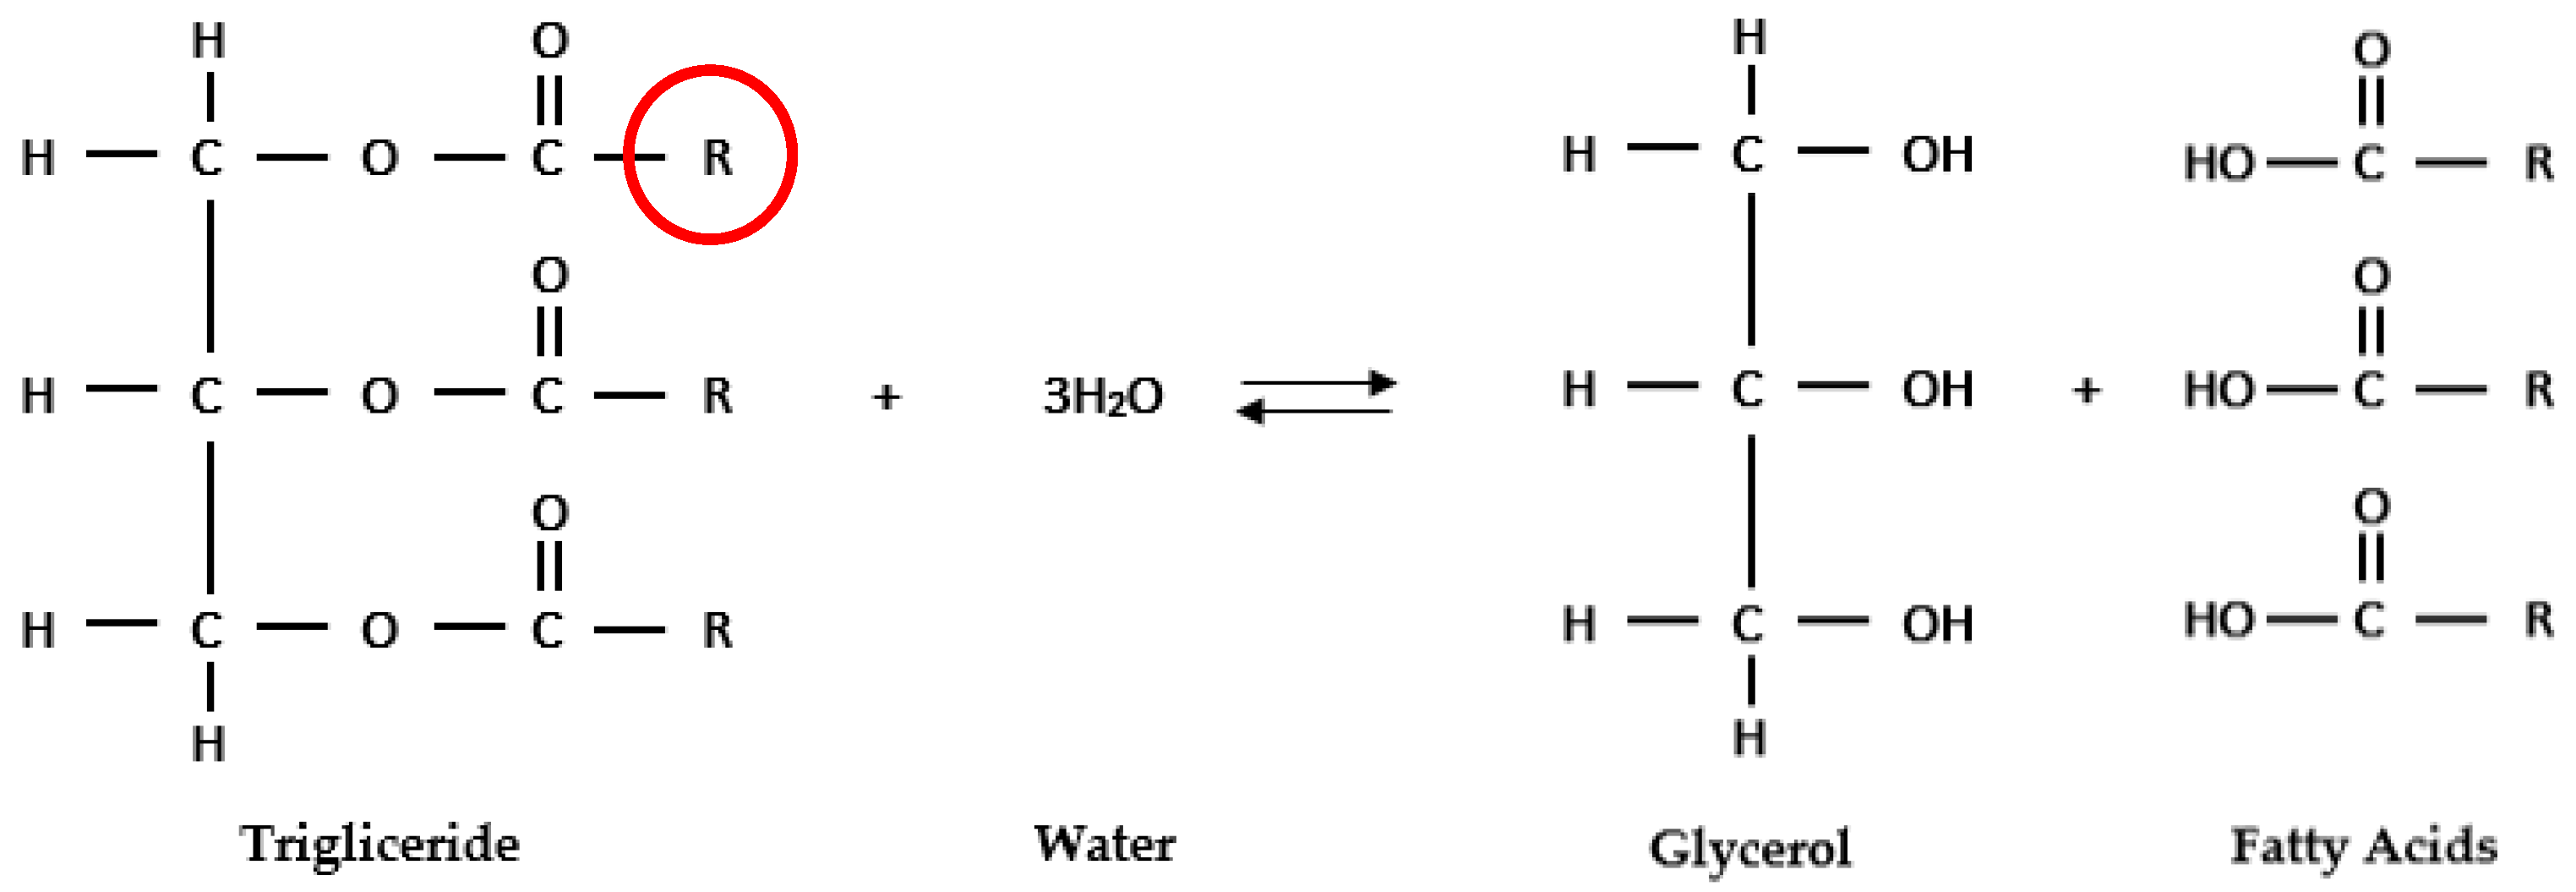
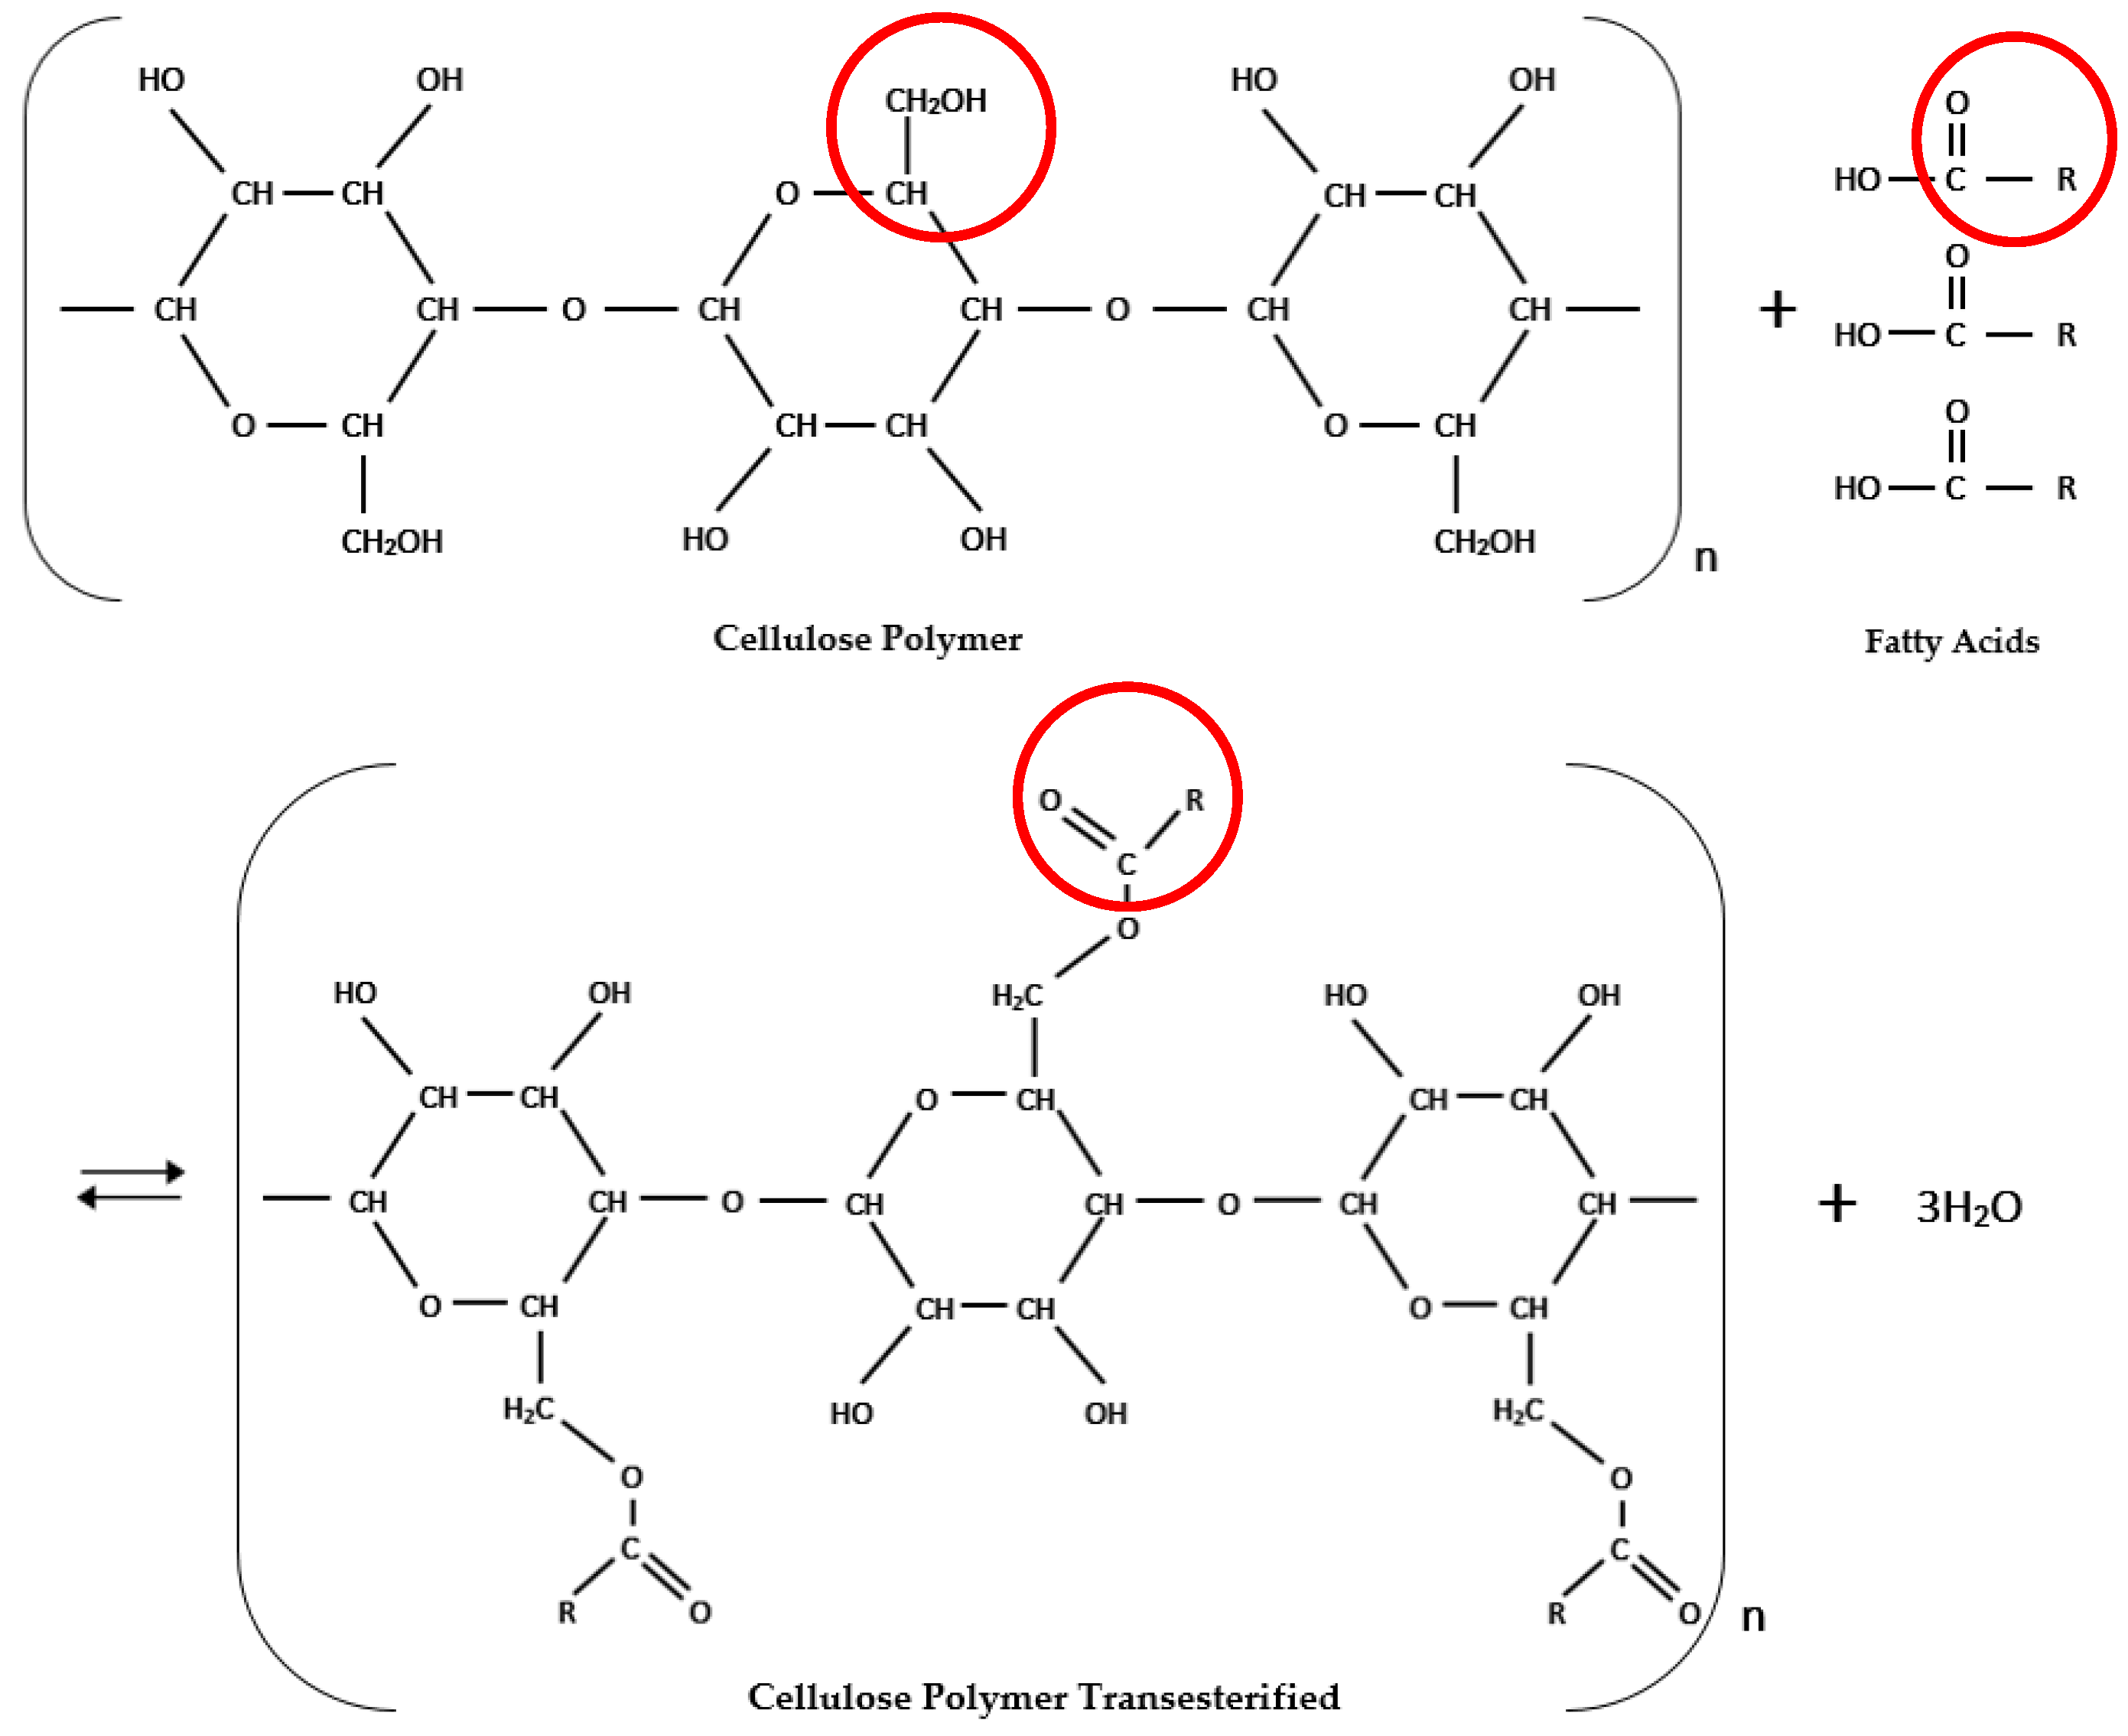
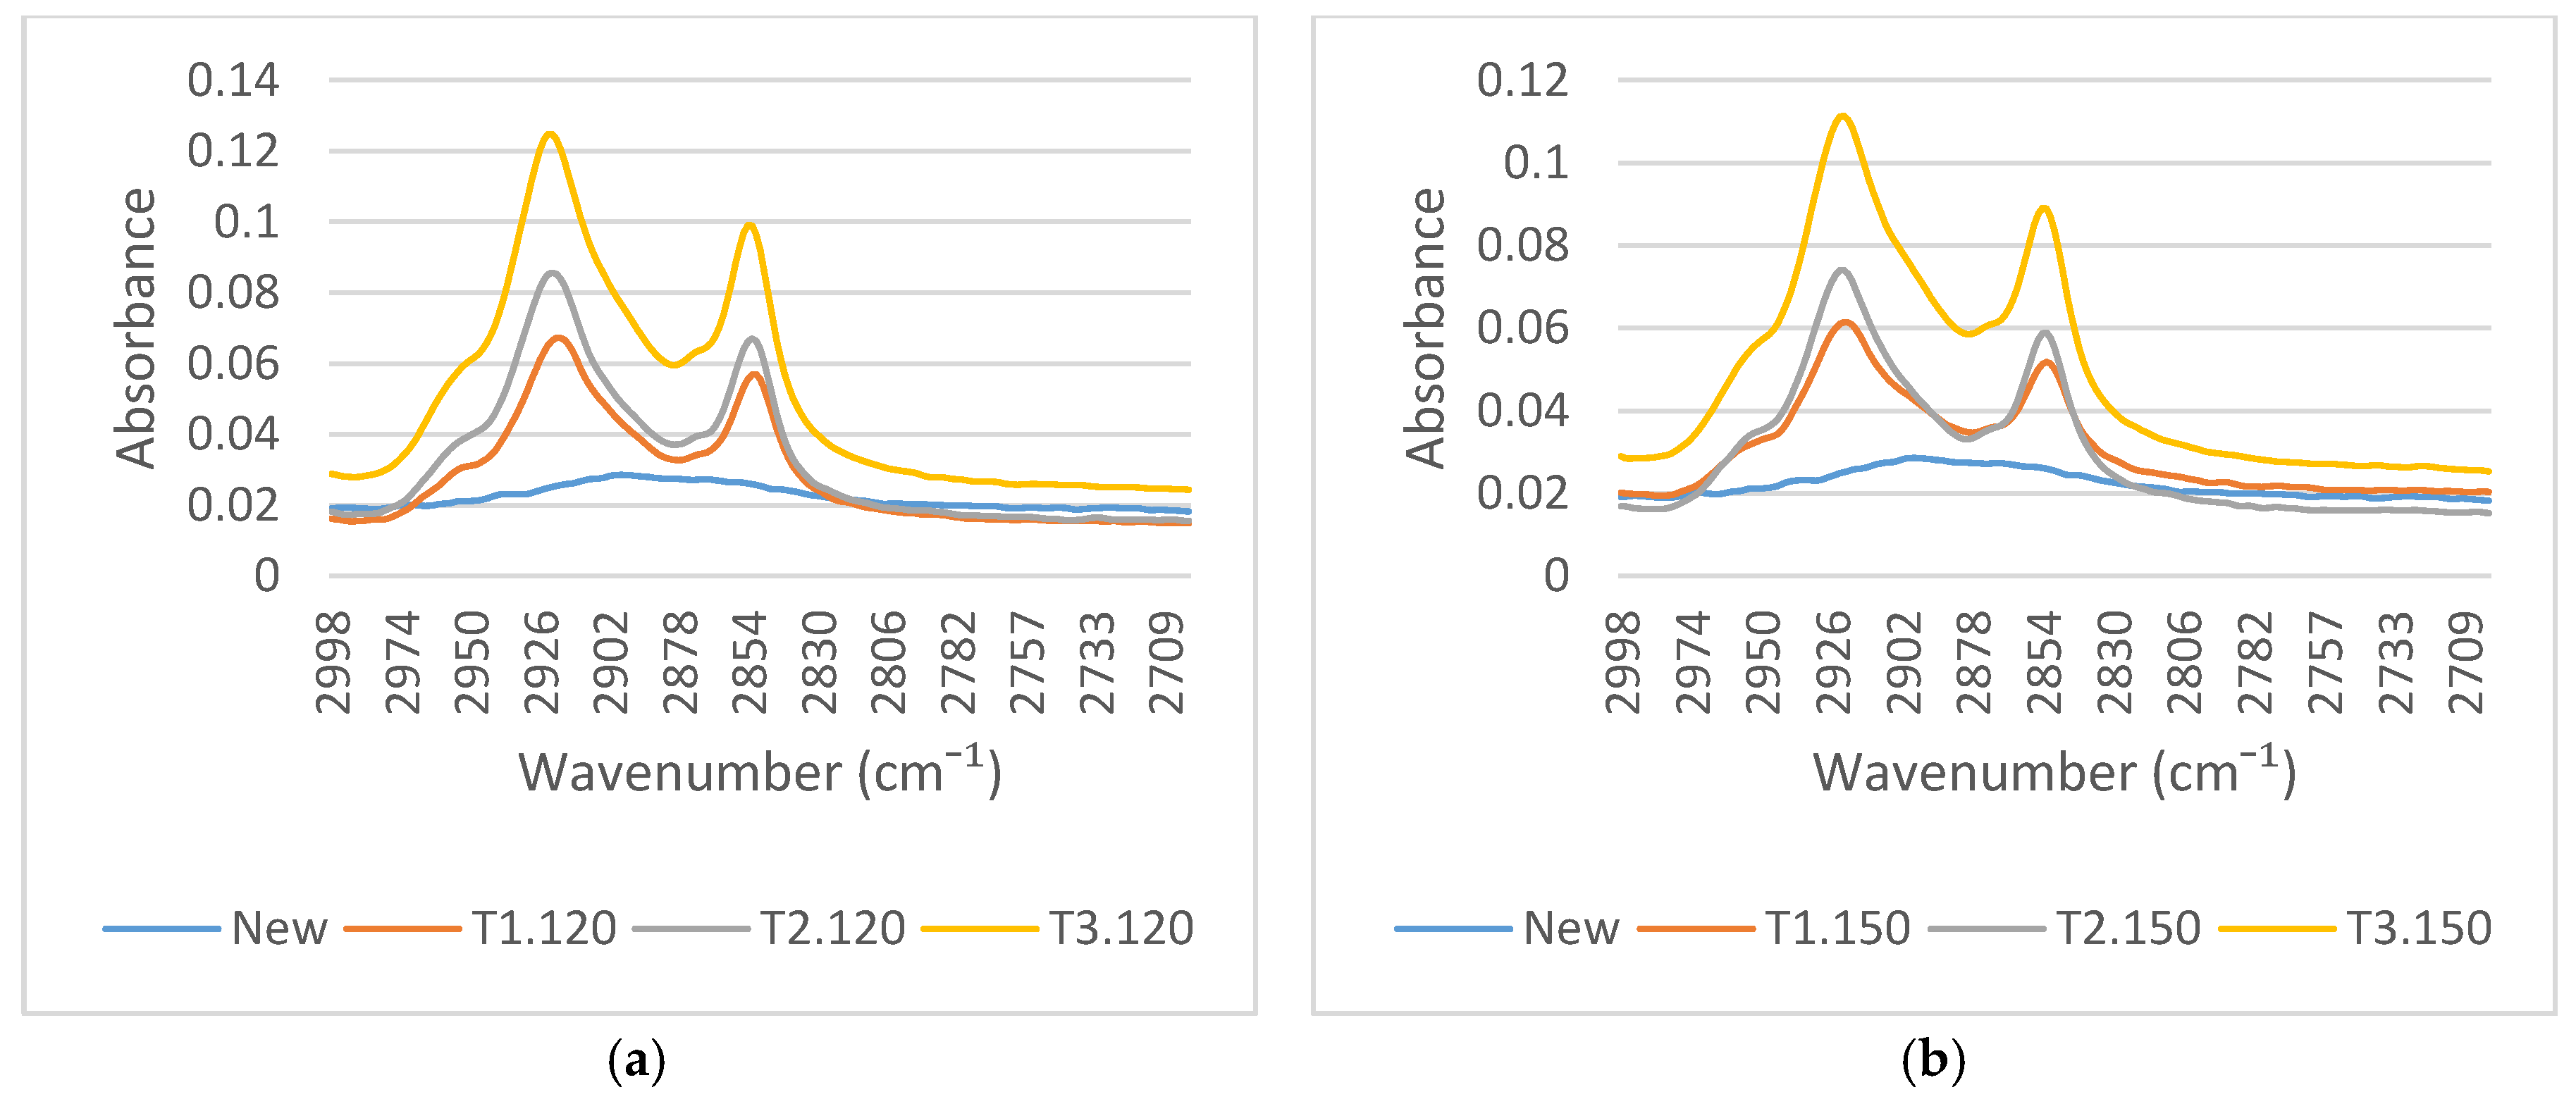
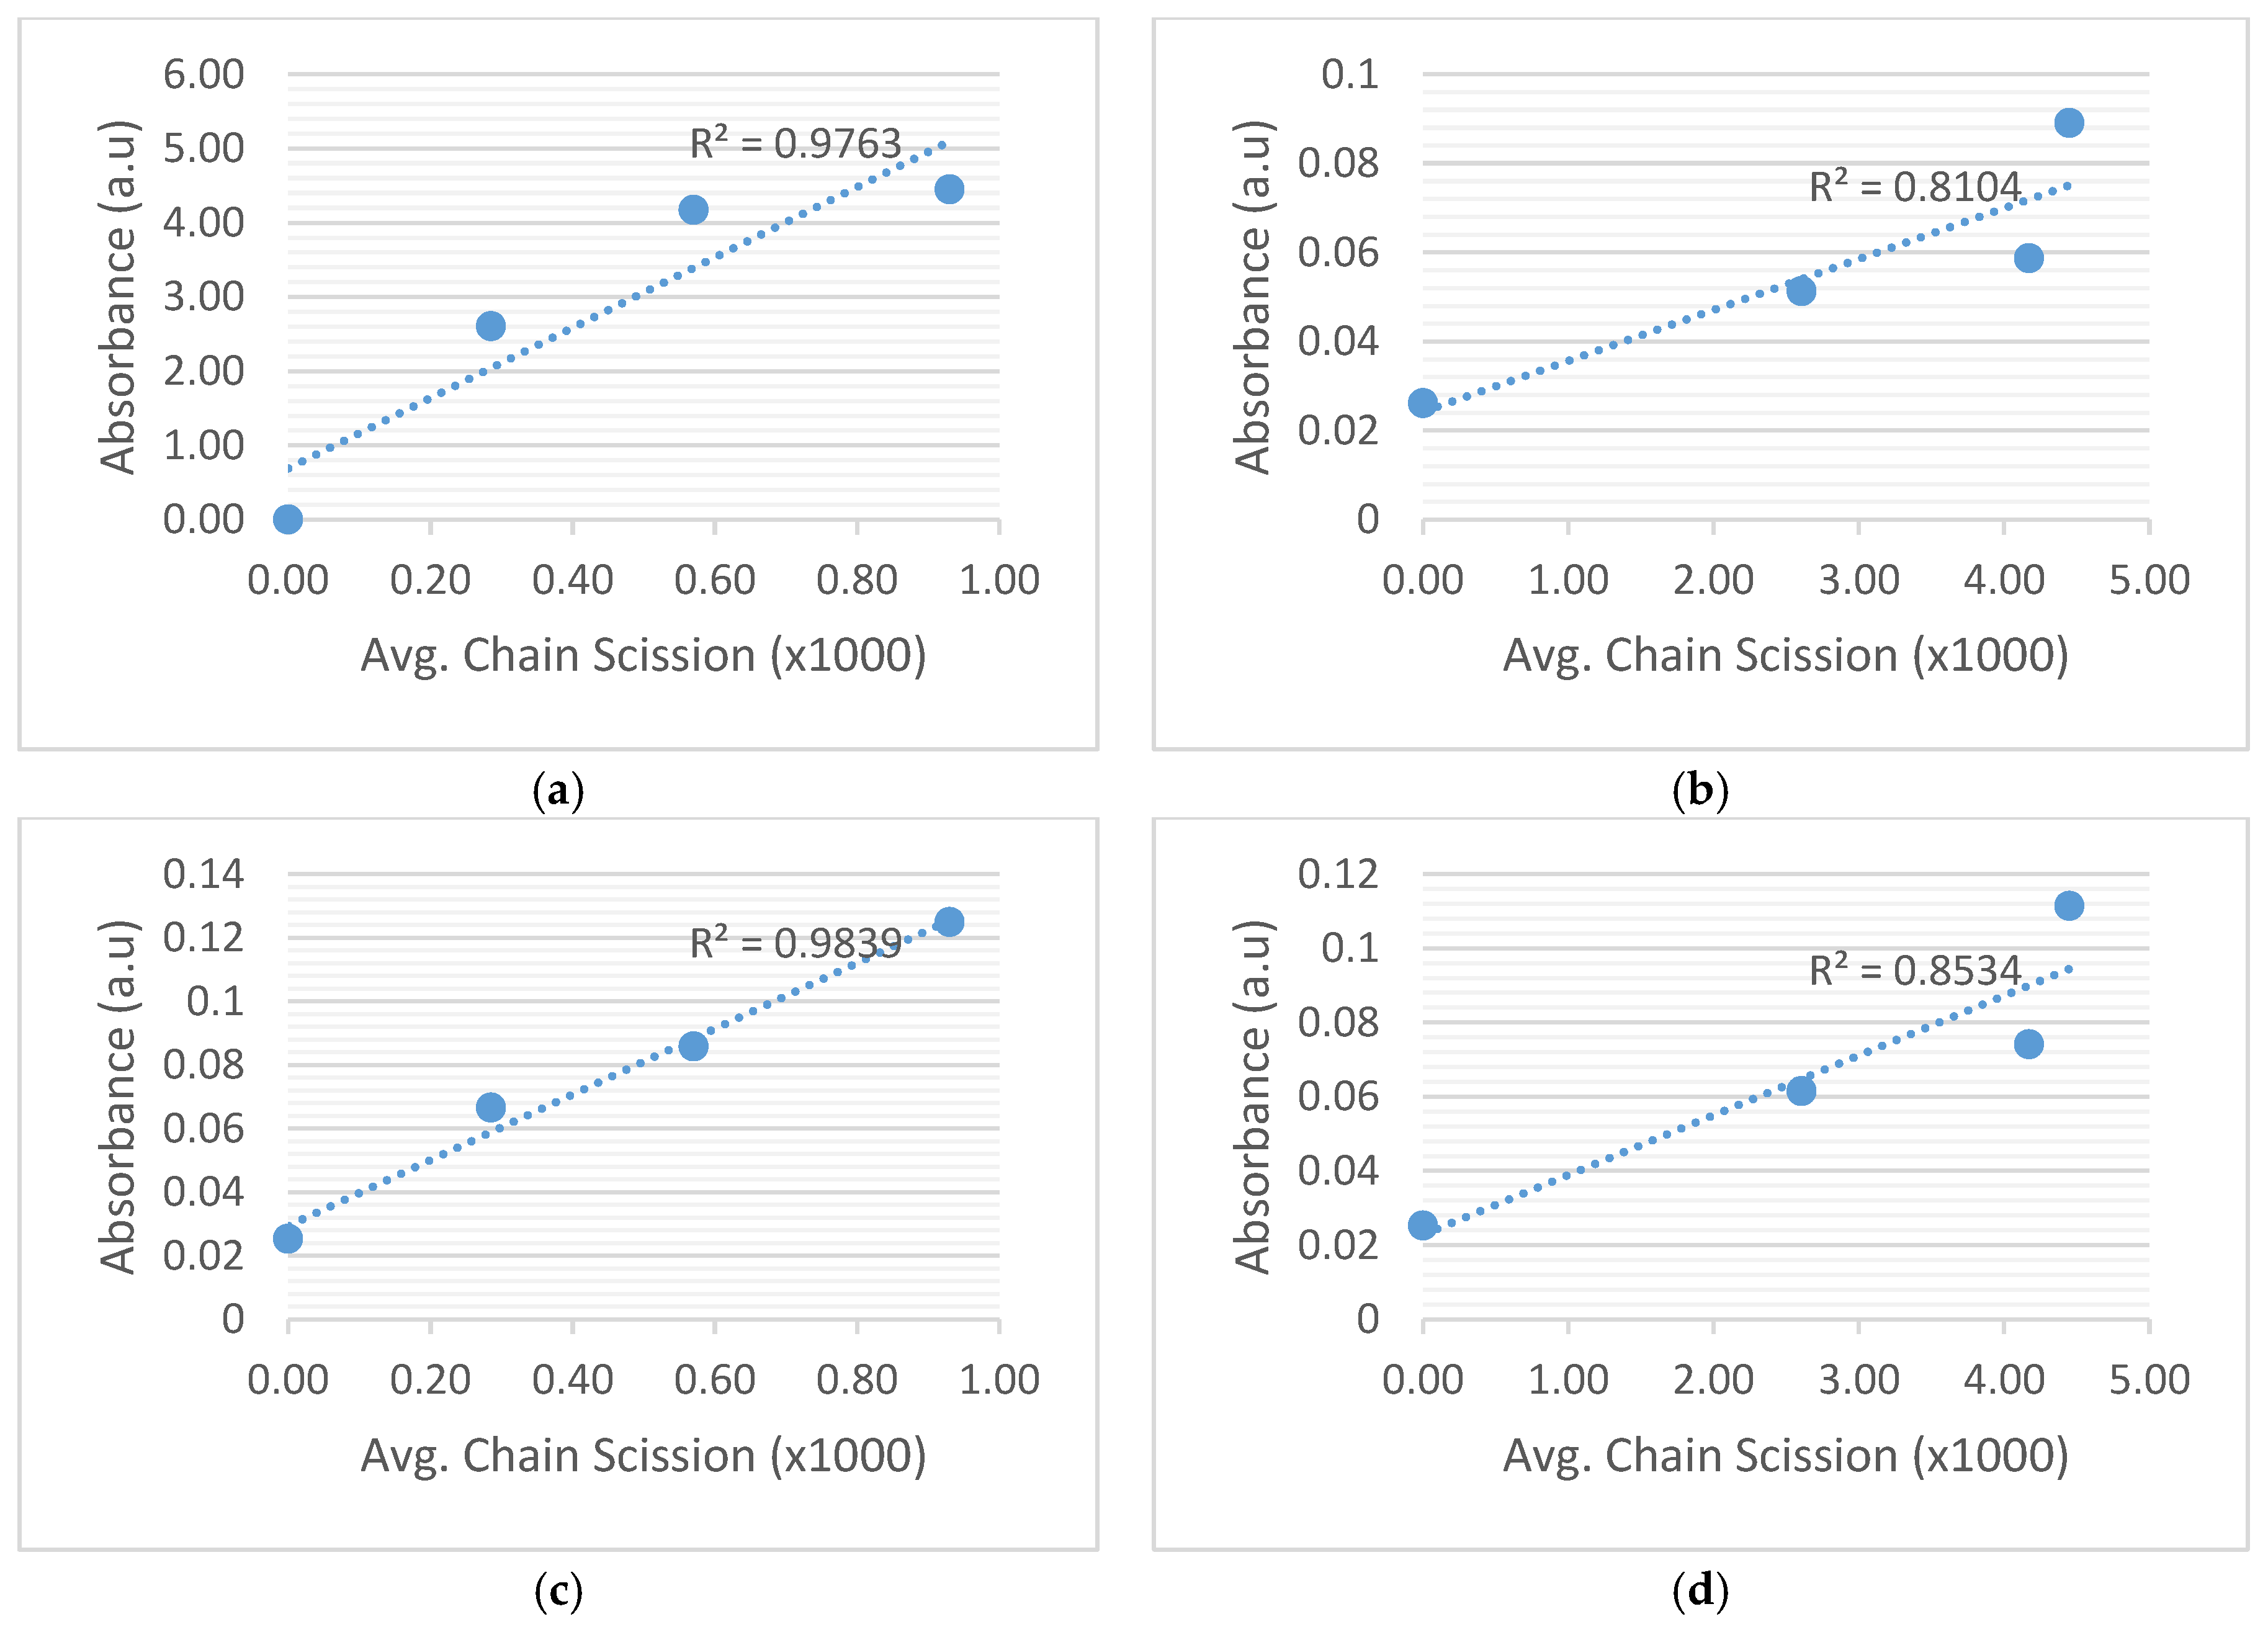
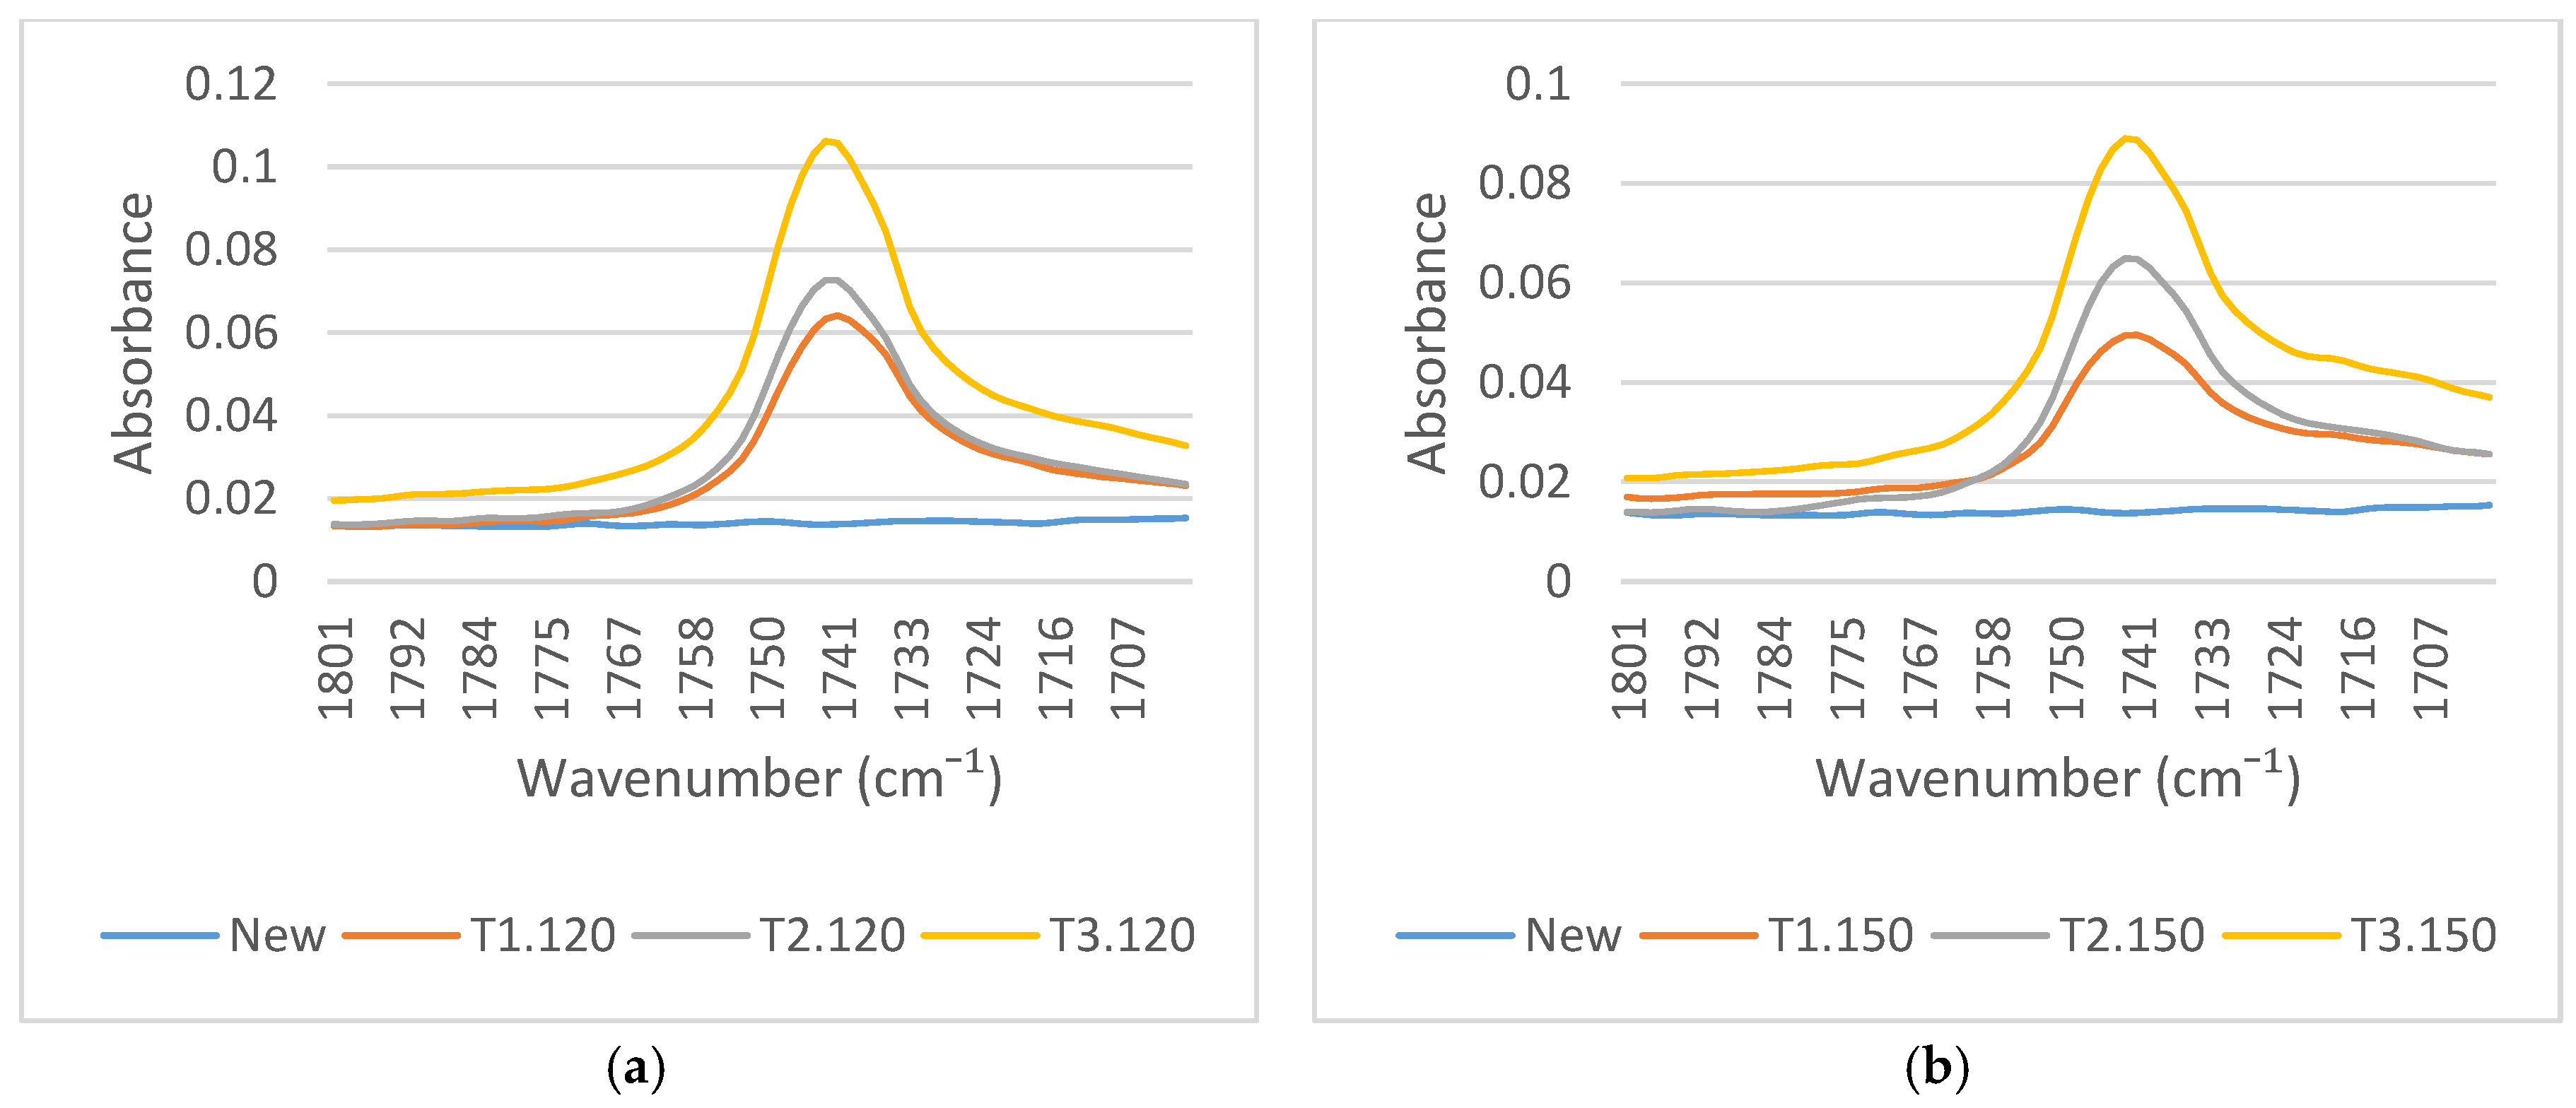
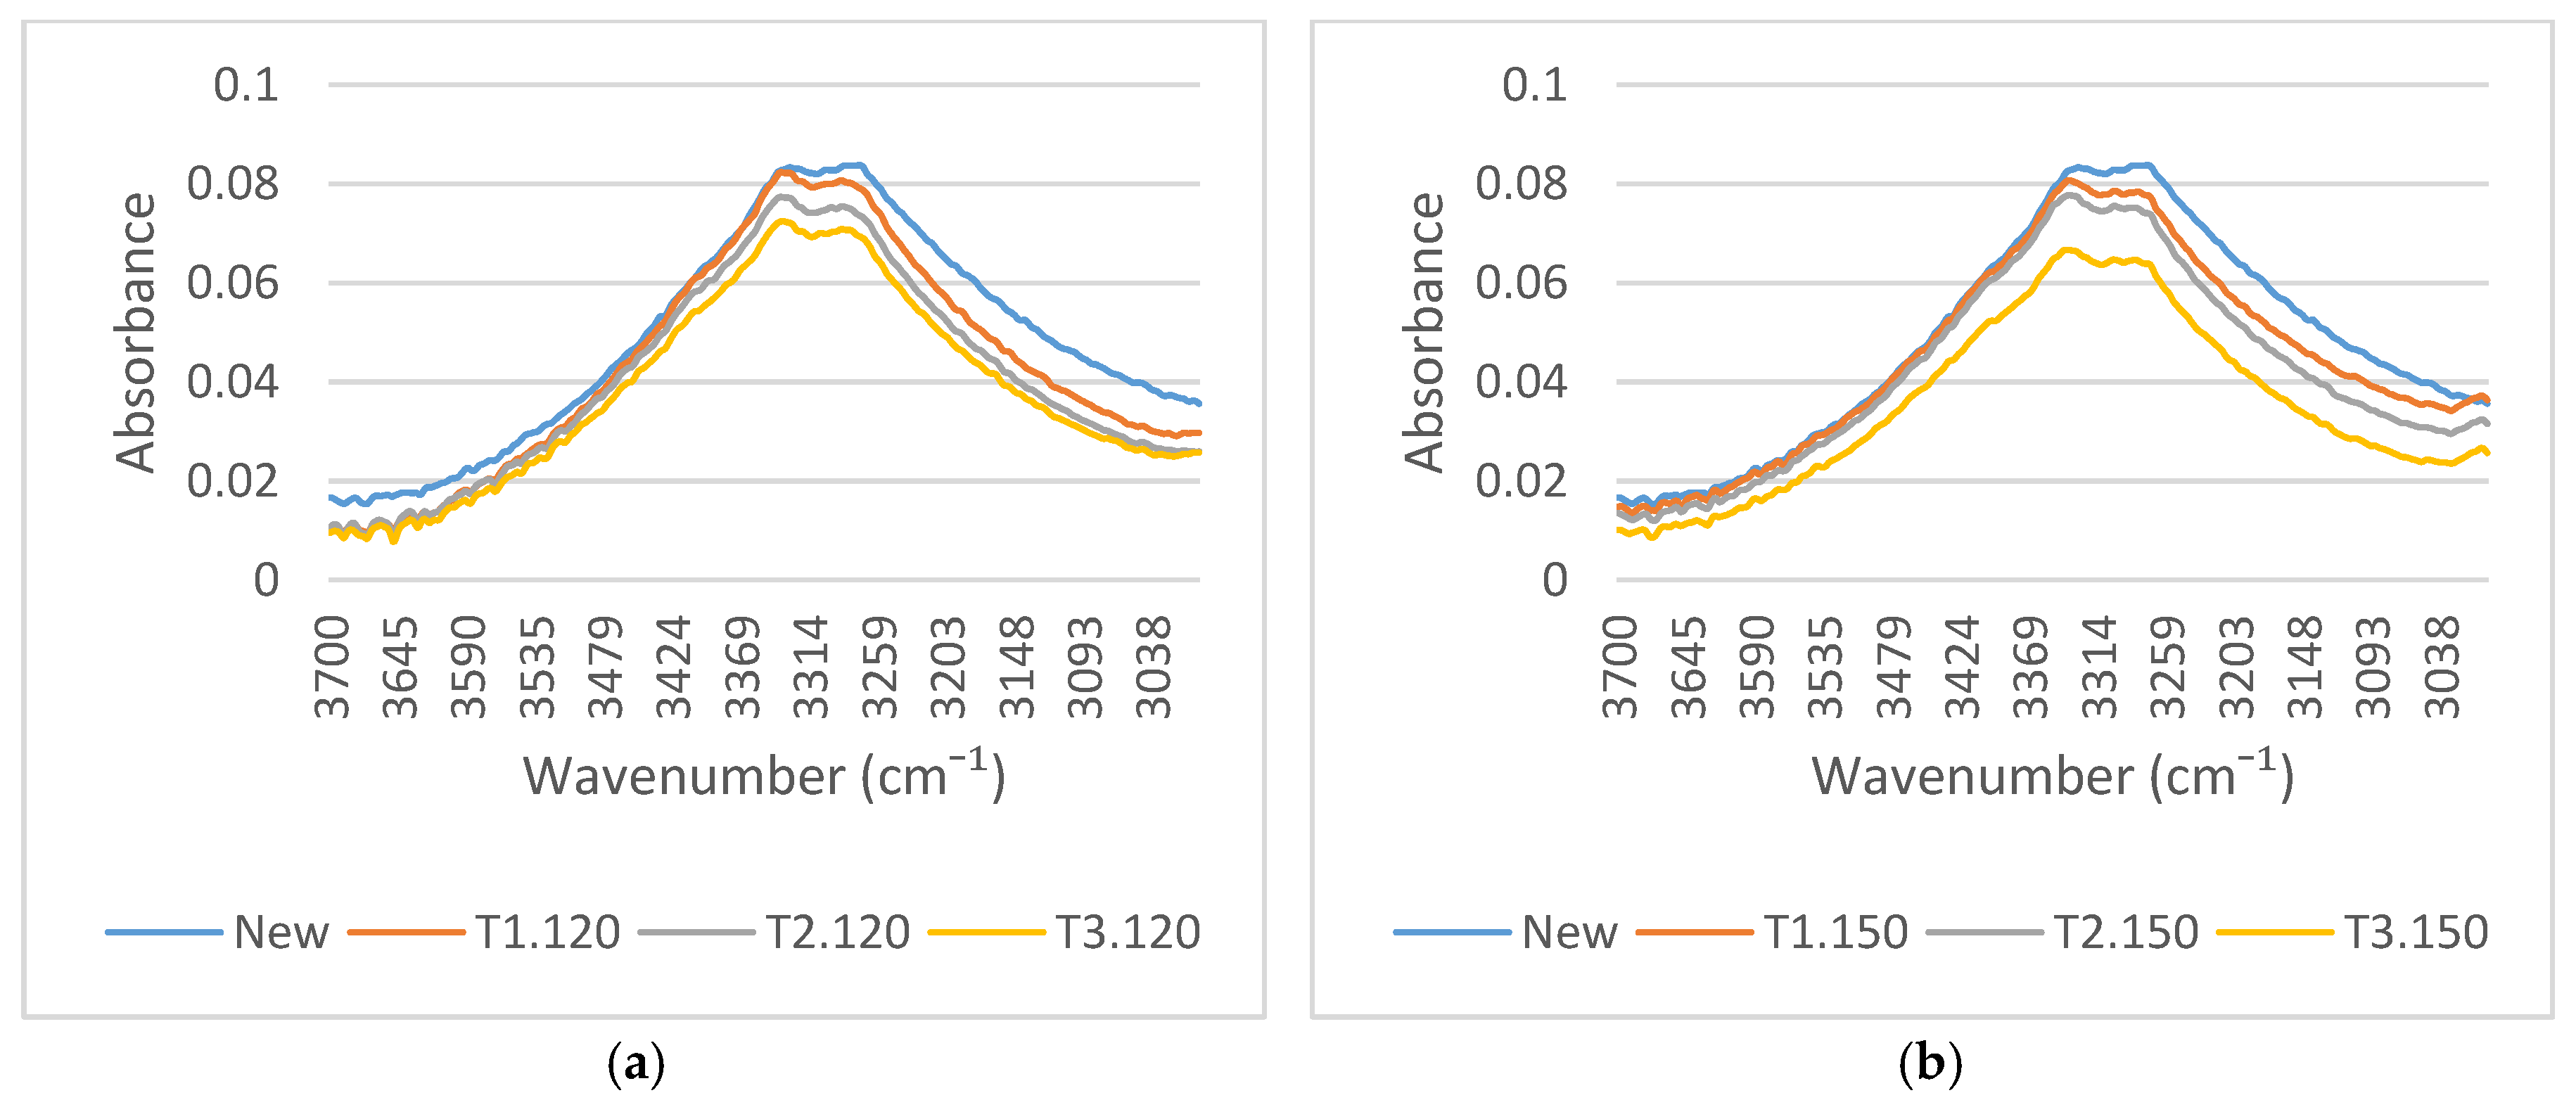
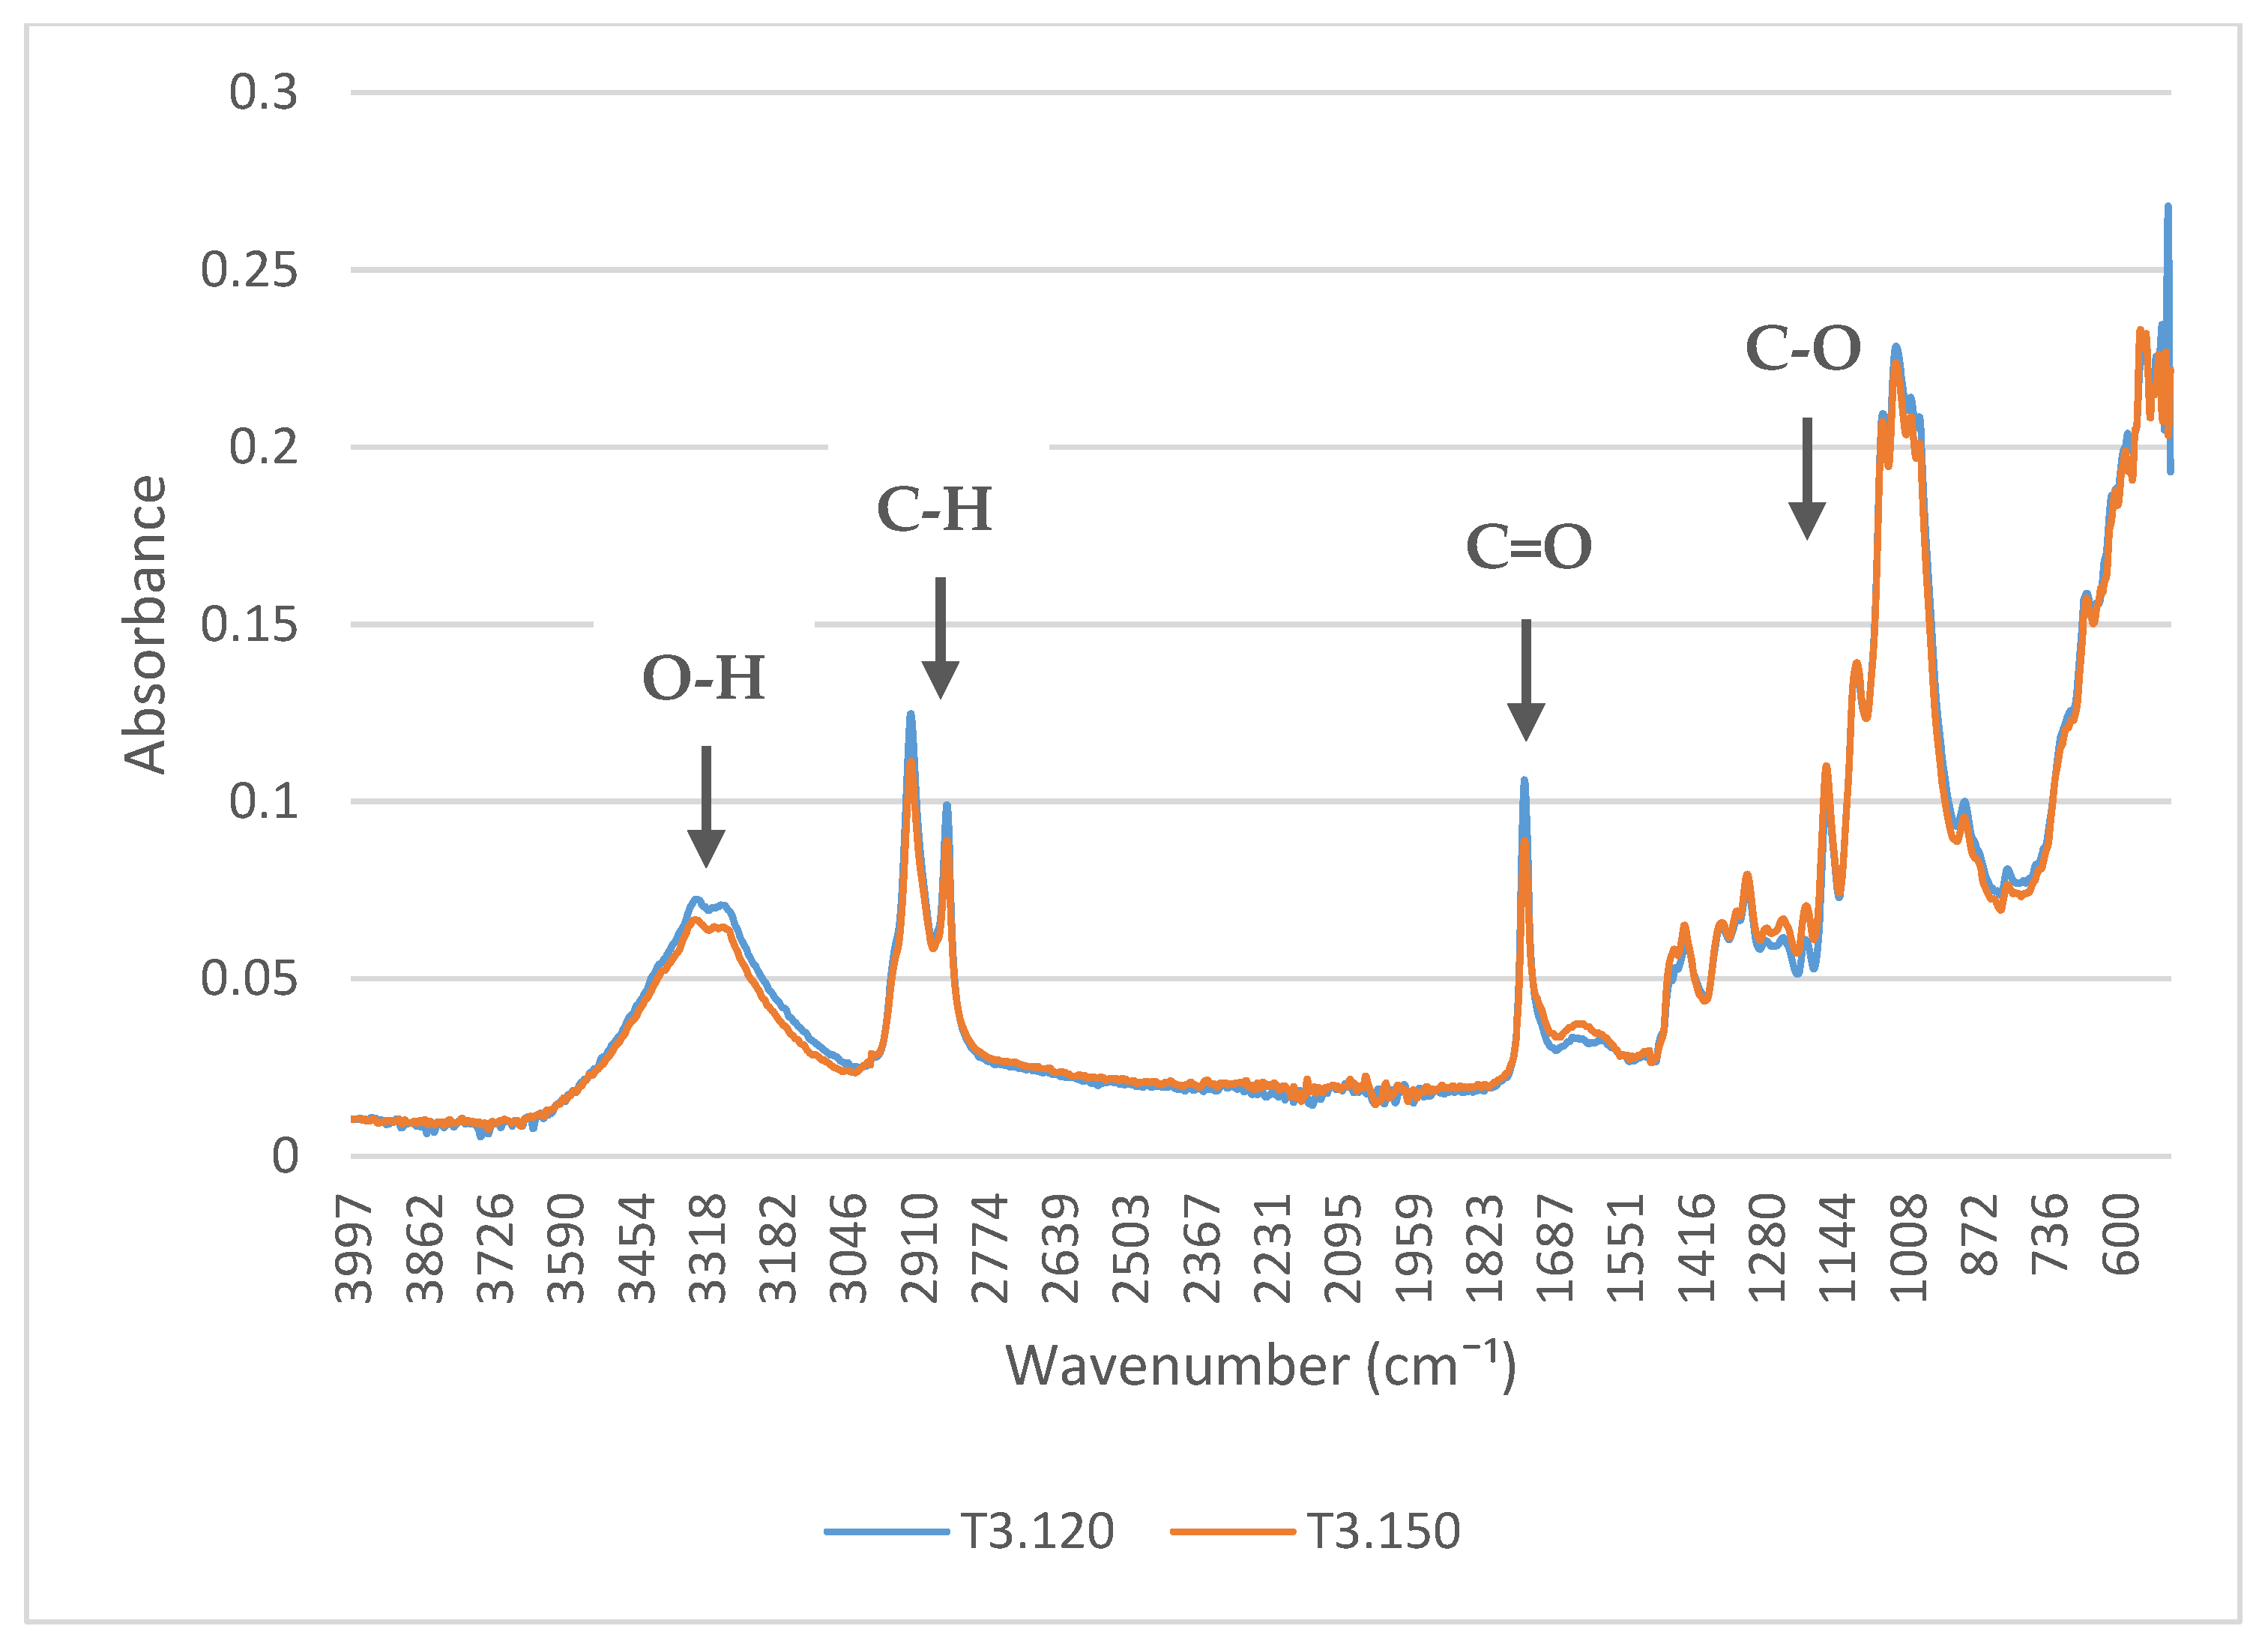
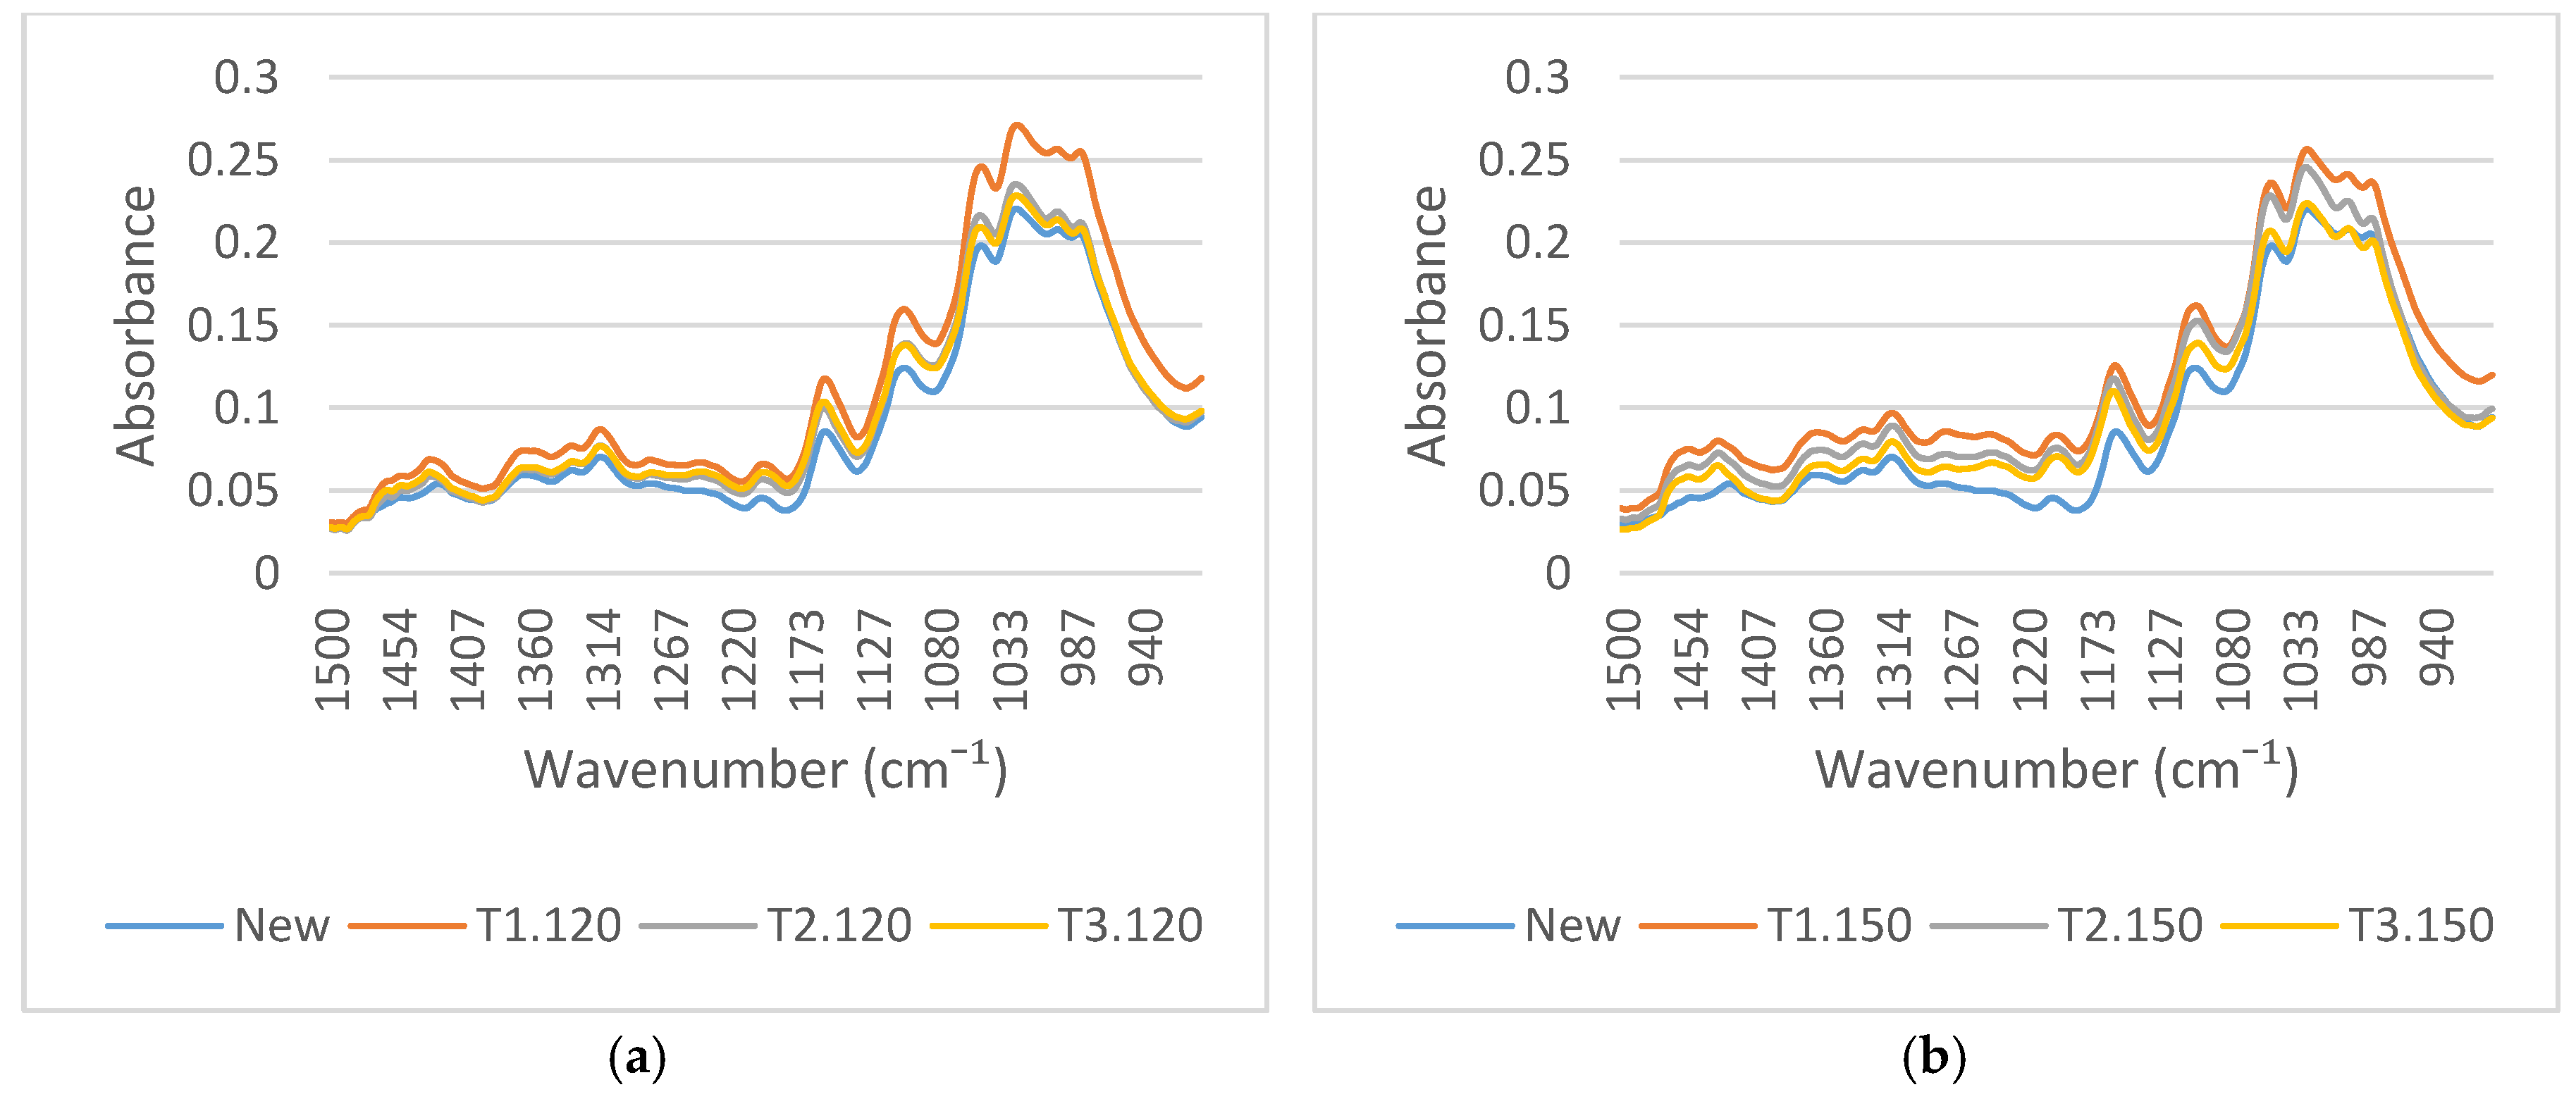
3.2. The Structural Changes of Transformer Insulation Paper
4. Conclusions
Acknowledgments
Author Contributions
Conflicts of Interest
References
- Rajab, A.; Sulaeman, A.; Sudirham, S.; Suwarno. A Comparison of Dielectric Properties of Palm Oil with Mineral and Synthetic Type Insulating Liquid under Temperature Variation. ITB J. Eng. Sci. 2011, 43, 191–208. [Google Scholar] [CrossRef]
- Jeong, J.-I.; An, J.-S.; Huh, C.-S. Accelerated aging effects of mineral and vegetable transformer oils on medium voltage power transformers. IEEE Trans. Dielectr. Electr. Insul. 2012, 19, 156–161. [Google Scholar] [CrossRef]
- Bandara, K.; Ekanayake, C.; Saha, T.K.; Annamalai, P.K. Understanding the aging aspects of natural ester based insulation liquid in power transformer. IEEE Trans. Dielectr. Electr. Insul. 2016, 23, 246–257. [Google Scholar] [CrossRef]
- Oommen, T.V. Vegetable oils for liquid-filled transformers. IEEE Electr. Insul. Mag. 2002, 18, 6–11. [Google Scholar] [CrossRef]
- Oommen, T.V.; Claiborne, C.C.; Mullen, J.T. Biodegradable electrical insulation fluids. In Proceedings of the IEEE Electrical Insulation Conference and Electrical Manufacturing and Coil Winding Conference, Rosemont, IL, USA, 25–25 September 1997. [Google Scholar]
- Beroual, A.; Khaled, U.; Noah, P.S.M.; Sitorus, M. Comparative Study of Breakdown Voltage of Mineral, Synthetic and Natural Oils and Based Mineral Oil Mixtures under AC and DC Voltages. Energies 2017, 10, 511. [Google Scholar] [CrossRef]
- Frimpong, G.K.; Oommen, T.V.; Asano, R. A survey of ageing characteristics of cellulose insulation in natural ester and mineral oil. IEEE Electr. Insul. Mag. 2011, 27, 36–48. [Google Scholar] [CrossRef]
- Yang, L.; Liao, R.; Caixin, S.; Zhu, M. Influence of vegetable oil on the thermal aging of transformer paper and its mechanism. IEEE Trans. Dielectr. Electr. Insul. 2011, 18, 692–700. [Google Scholar] [CrossRef]
- Liao, R.; Hao, J.; Chen, G.; Ma, Z.; Yang, L. A Comparative Study of physicochemical, dielectric and thermal properties of pressboard insulation impregnated with natural ester and mineral oil. IEEE Trans. Dielectr. Electr. Insul. 2011, 18, 1626–1637. [Google Scholar] [CrossRef]
- Garcia, B.; Garcia, T.; Primo, V.; Burgos, J.C.; Urquiza, D. Studying the loss of life of natural-ester-filled transformer insulation: Impact of moisture on the aging rate of paper. IEEE Electr. Insul. Mag. 2017, 33, 15–23. [Google Scholar] [CrossRef]
- Abdelmalik, A.A. Analysis of thermally aged insulation paper in a natural ester-based dielectric fluid. IEEE Trans. Dielectr. Electr. Insul. 2015, 22, 2408–2414. [Google Scholar] [CrossRef]
- Ciuriuc, A.; Dumitran, L.M.; Notingher, P.V.; Badicu, L.V.; Setnescu, R.; Setnescu, R. Lifetime estimation of vegetable and mineral oil impregnated paper for power transformers’. In Proceedings of the 2016 IEEE International Conference on Dielectrics (ICD), Montpellier, France, 3–7 July 2016. [Google Scholar]
- McShane, C.; Rapp, K.; Corkran, J.; Gauger, G.; Luksich, J. Aging of Kraft Paper in natural ester dielectric fluid. In Proceedings of the 2002 IEEE 14th International Conference on Dielectric Liquids (ICDL), Graz, Austria, 7 November 2002. [Google Scholar]
- Bandara, K.; Ekanayake, C.; Saha, T.; Ma, H. Performance of Natural Ester as a Transformer Oil in Moisture-Rich Environments. Energies 2016, 9, 258. [Google Scholar] [CrossRef]
- Suwarno; Widyanugraha, T.; Didit, P.; Suharto. Dielectric properties of silicone oil, natural Ester, and mineral oil under accelerated thermal aging. In Proceedings of the 2012 IEEE International Conference on Condition Monitoring and Diagnosis, Bali, Indonesia, 23–27 September 2012. [Google Scholar]
- Widyanugraha, T.; Rachmad, R.; Wendhy; Suwarno. DGA and tensile strength test on accelerated thermal aging of ester oil and kraft paper. In Proceedings of the 2015 International Conference on Electrical Engineering and Informatics (ICEEI), Bali, Indonesia, 10–11 August 2015. [Google Scholar]
- Cui, H.; Abu-Siada, A.; Li, S.; Islam, S. Correlation between dissolved gases and oil spectral response. In Proceedings of the 1st International Conference on Electrical Materials and Power Equipment (ICEMPE), Xi’an, China, 14–17 May 2017. [Google Scholar]
- Baka, N.; Abu-Siada, A.; Islam, S.; El-Naggar, M. A new technique to measure interfacial tension of transformer oil using UV-Vis spectroscopy. IEEE Trans. Dielectr. Electr. Insul. 2015, 22, 1275–1282. [Google Scholar] [CrossRef]
- Das, N.; Abu-Siada, A.; Islam, S. New approach to estimate furan contents in transformer oil using spectroscopic analysis. In Proceedings of the 2012 22nd Australasian Universities Power Engineering Conference (AUPEC), Bali, Indonesia, 26–29 September 2012. [Google Scholar]
- N’cho, J.S.; Fofana, I.; Hadjadj, Y.; Beroual, A. Review of Physicochemical-Based Diagnostic Techniques for Assessing Insulation Condition in Aged Transformers. Energies 2016, 9, 367. [Google Scholar] [CrossRef]
- Sun, P.; Sima, W.; Yang, M.; Wu, J. Influence of Thermal Aging on the Breakdown Characteristic of Transformer Oil Impregnated Paper. IEEE Trans. Dielectr. Electr. Insul. 2016, 23, 3373–3381. [Google Scholar] [CrossRef]
- IEEE Std. C57.91-2011 IEEE Guide for Loading Mineral-Oil-Immersed Transformers and Step-Voltage Regulators; IEEE: New York, NY, USA, 2012. [Google Scholar]
- IEEE Std. C57.12.00-2015. IEEE Standard for General Requirements for Liquid-Immersed Distribution, Power, and Regulating Transformers; IEEE: New York, NY, USA, 2015. [Google Scholar]
- Gorgan, B.; Notingher, P.V.; Wetzer, J.M.; Verhaart, H.F.A.; Wouters, P.A.A.F.; Schijndel, A.V.; Tanasescu, G. Calculation of the remaining life of power transformers paper insulation. In Proceedings of the 2012 13th International Conference on Optimization of Electrical and Electronic Equipment (OPTIM), Brasov, Romania, 5 July 2012. [Google Scholar]
- Emsley, A.M.; Stevens, G.C. Review of chemical indicators of degradation of cellulosic electrical paper insulation in oil-filled transformers. IEE Proc.-Sci. Meas. Technol. 1994, 141, 324–334. [Google Scholar] [CrossRef]
- Liao, R.; Liang, S.; Sun, C.; Yang, L.; Sun, H. A comparative study of thermal aging of transformer insulation paper impregnated in natural ester and in mineral oil. Eur. Trans. Electr. Power 2010, 20, 518–533. [Google Scholar] [CrossRef]
- Emsley, A.M.; Stevens, G.C. Kinetics and mechanisms of the low temperature degradation of cellulose. J. Cell. 1994, 1, 26–56. [Google Scholar] [CrossRef]
- Verma, P.; Chauhan, D.; Singh, P. Effects on tensile strength of transformer insulation paper under accelerated thermal and electrical stress. In Proceedings of the 2007 Annual Report Conference on Electrical Insulation and Dielectric Phenomena (CEIDP), Vancouver, BC, Canada, 14–17 October 2007. [Google Scholar]
- Han, S.; Li, Q.; Li, C.; Yan, J. Electrical and mechanical properties of the oil-paper insulation under stress of the hot spot temperature. IEEE Trans. Dielectr. Electr. Insul. 2014, 21, 179–185. [Google Scholar] [CrossRef]
- Rapp, K.J.; McShane, C.P.; Luksich, J. Interaction mechanisms of natural ester dielectric fluid and Kraft paper. In Proceedings of the 2005 IEEE International Conference on Dielectric Liquids (ICDL), Coimbra, Portugal, 26 June–1 July 2005. [Google Scholar]
- Wilhelm, H.M.; Tulio, L.; Jalsinski, R.; Almeida, G. Aging Markers for In-service Natural Ester-Based Insulating Fluids. IEEE Trans. Dielectr. Electr. Insul. 2011, 18, 714–719. [Google Scholar] [CrossRef]
- Lundgaard, L.E.; Hansen, W.; Ingebrigsten, S. Aging of Mineral Oil Impregnated Cellulose by Acid Catalysis. IEEE Trans. Dielectr. Electr. Insul. 2008, 15, 540–546. [Google Scholar] [CrossRef]
- Hinterstoisser, B.; Åkerholm, M.; Salmén, L. Effect of fiber orientation in dynamic FTIR study on native cellulose. Elsevier J. Carbohydr. Res. 2001, 334, 27–37. [Google Scholar] [CrossRef]
- Serban, M.; Helerea, E.; Munteanu, A. The Water Impact on the Aging of Power Transformer Oil. In Proceedings of the 2014 International Conference on Applied and Theoretical Electricity (ICATE), Craiova, Romania, 23–25 October 2014. [Google Scholar]
- Suwarno; Pasaribu, R.A. Thermal Aging of Mineral-Oil Paper Composite Insulation for High Voltage Transformer. Int. J. Electr. Eng. Inform. ITB 2016, 8, 820–835. [Google Scholar] [CrossRef]
- Stojilovic, N. Why Can’t We See Hydrogen in X-ray Photoelectron Spectroscopy? J. Chem. Educ. 2012, 89, 1331–1332. [Google Scholar] [CrossRef]


| Sample | Aging |
|---|---|
| T0 | New |
| T1.120 | 120 °C for 336 h |
| T2.120 | 120 °C for 672 h |
| T3.120 | 120 °C for 1008 h |
| T1.150 | 150 °C for 336 h |
| T2.150 | 150 °C for 672 h |
| T3.150 | 150 °C for 1008 h |
| Temperature | Aging Time (h) | |||
|---|---|---|---|---|
| 0 | 336 | 672 | 1008 | |
| 120 °C |  |  |  |  |
| 150 °C |  |  |  |  |
| Wavenumber (cm−1) | Functional Group | New | T1.120 | T2.120 | T3.120 |
|---|---|---|---|---|---|
| 1159 | C–O | 0.08585 | 0.11775 | 0.09983 | 0.10341 |
| 1743 | C=O | 0.01372 | 0.06336 | 0.07268 | 0.10618 |
| 2854 | C–H | 0.02616 | 0.05563 | 0.0662 | 0.09905 |
| 2922 | C–H | 0.02516 | 0.06646 | 0.08567 | 0.1248 |
| 3273 | O–H | 0.08377 | 0.07906 | 0.07358 | 0.06933 |
| 3325 | O–H | 0.08305 | 0.08125 | 0.07617 | 0.07111 |
| Wavenumber (cm−1) | Functional Group | New | T1.150 | T2.150 | T3.150 |
|---|---|---|---|---|---|
| 1159 | C–O | 0.08585 | 0.12555 | 0.11669 | 0.10868 |
| 1743 | C=O | 0.01372 | 0.04943 | 0.06493 | 0.08902 |
| 2854 | C–H | 0.02616 | 0.05131 | 0.05869 | 0.08909 |
| 2922 | C–H | 0.02516 | 0.06143 | 0.07405 | 0.11136 |
| 3273 | O–H | 0.08377 | 0.07764 | 0.07407 | 0.06387 |
| 3325 | O–H | 0.08305 | 0.07947 | 0.07603 | 0.06532 |
| Sample | Functional Group/Chemical Element | Testing Method | R2 |
|---|---|---|---|
| 120 | C–H (2922 cm−1) | FTIR | 0.9763 |
| 150 | 0.8104 | ||
| 120 | C–H (2854 cm−1) | FTIR | 0.9839 |
| 150 | 0.8534 | ||
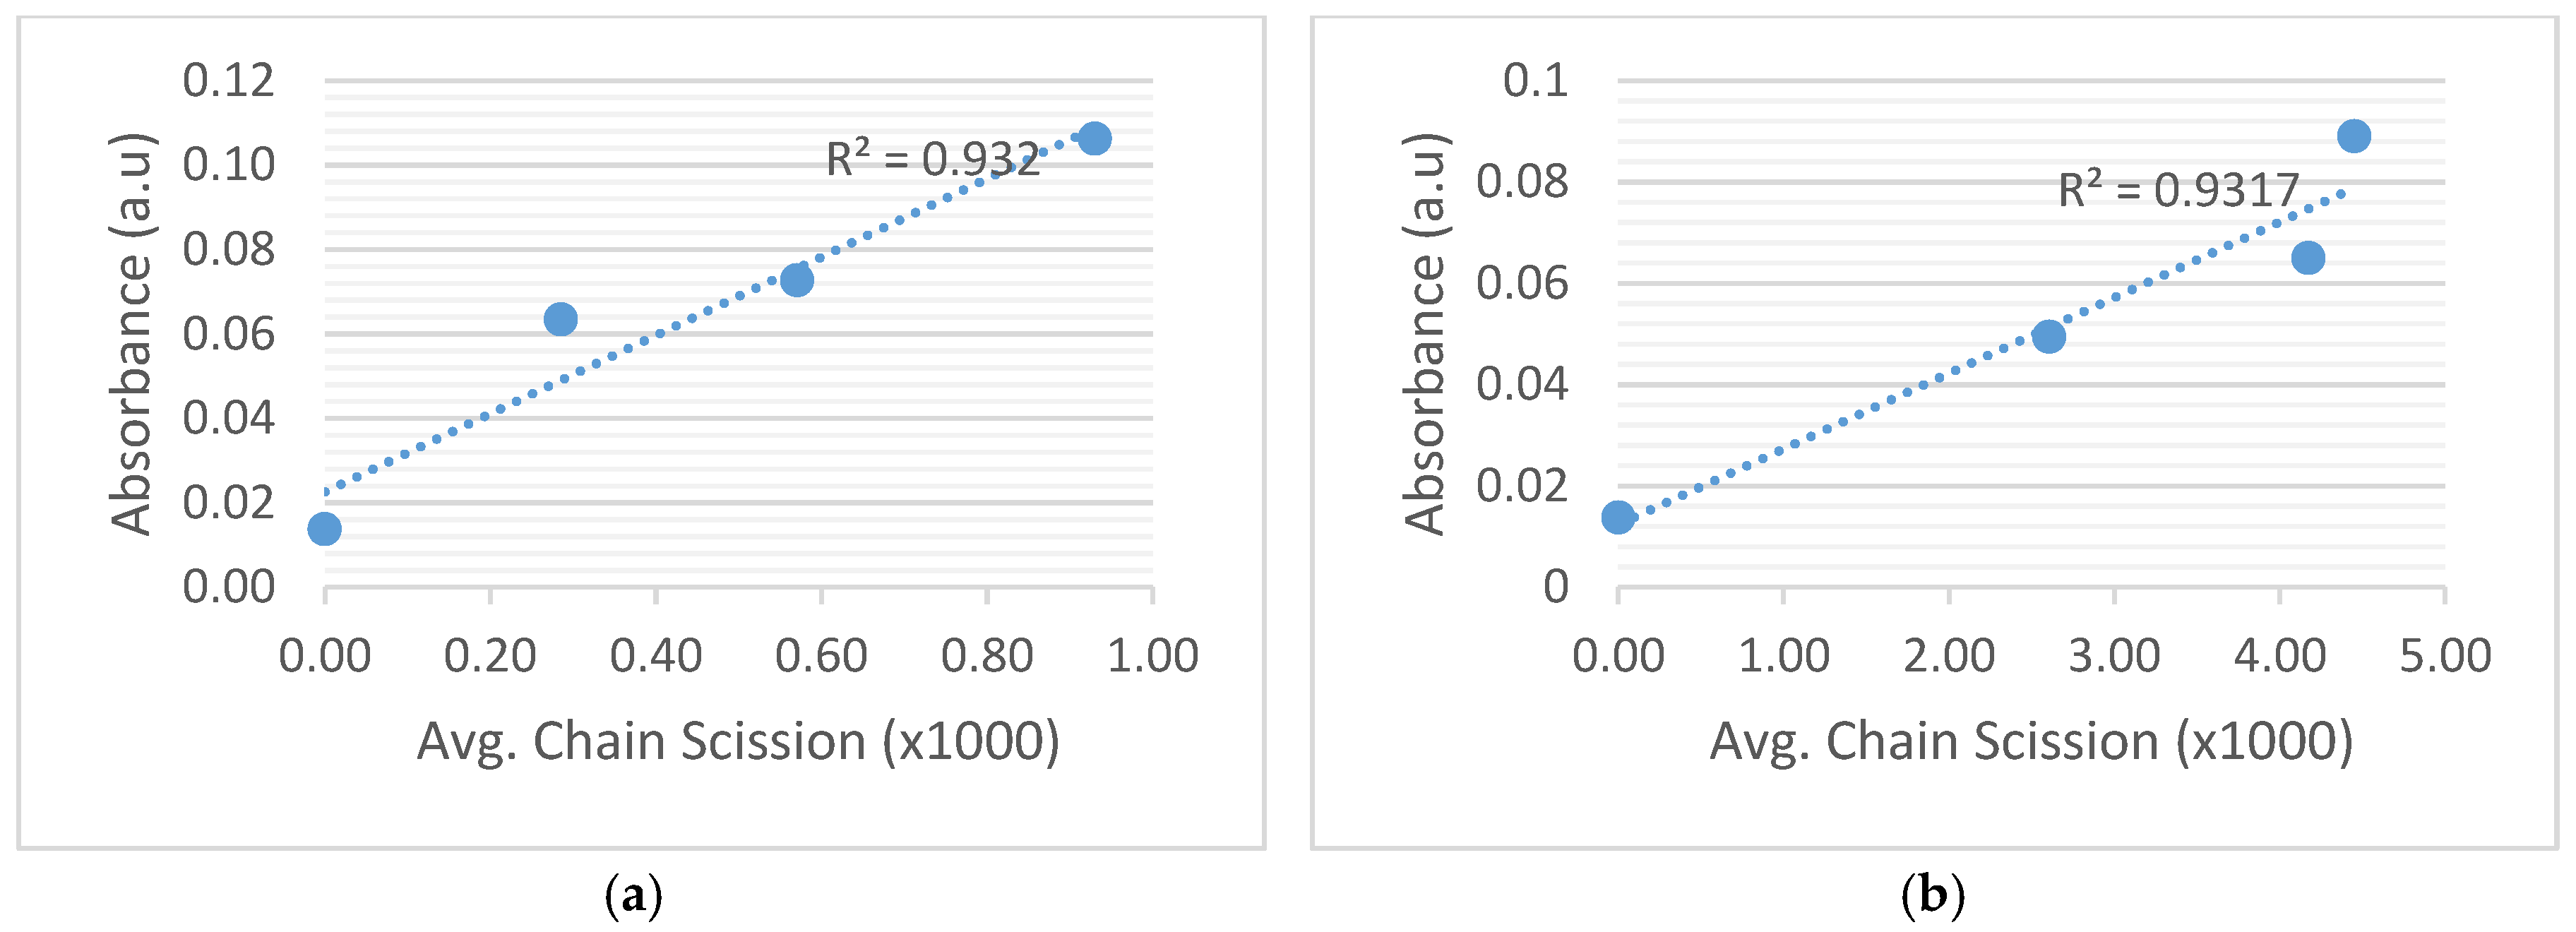
| 120 | C=O (1743 cm−1) | FTIR | 0.932 |
| 150 | 0.9317 | ||
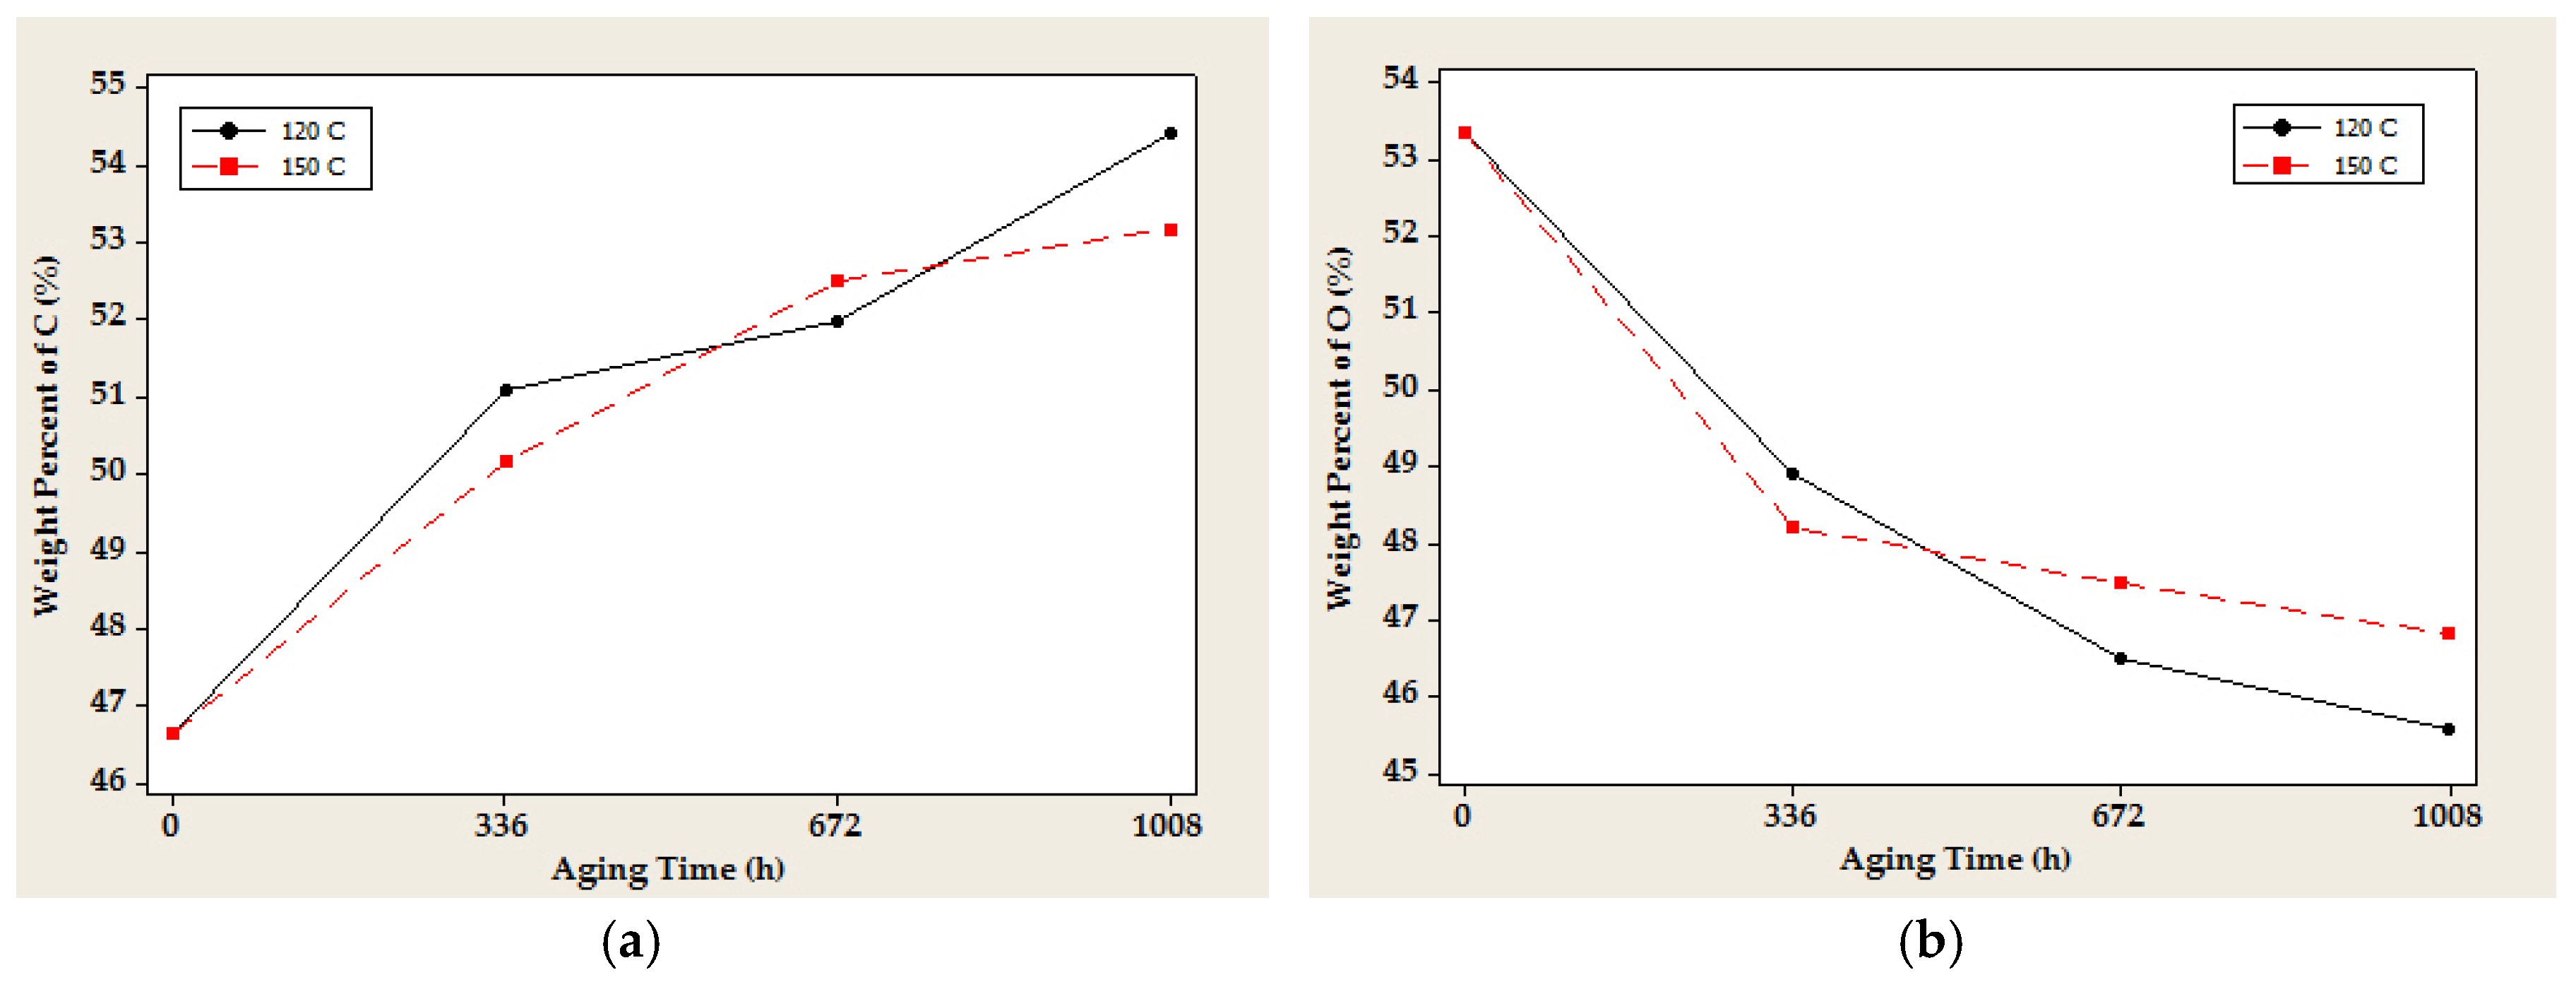
| 120 | Weight Percent C | EDS | 0.9134 |
| 150 | 0.9971 |
| Sample | Functional Group/Chemical Element | Testing Method | R2 |
|---|---|---|---|
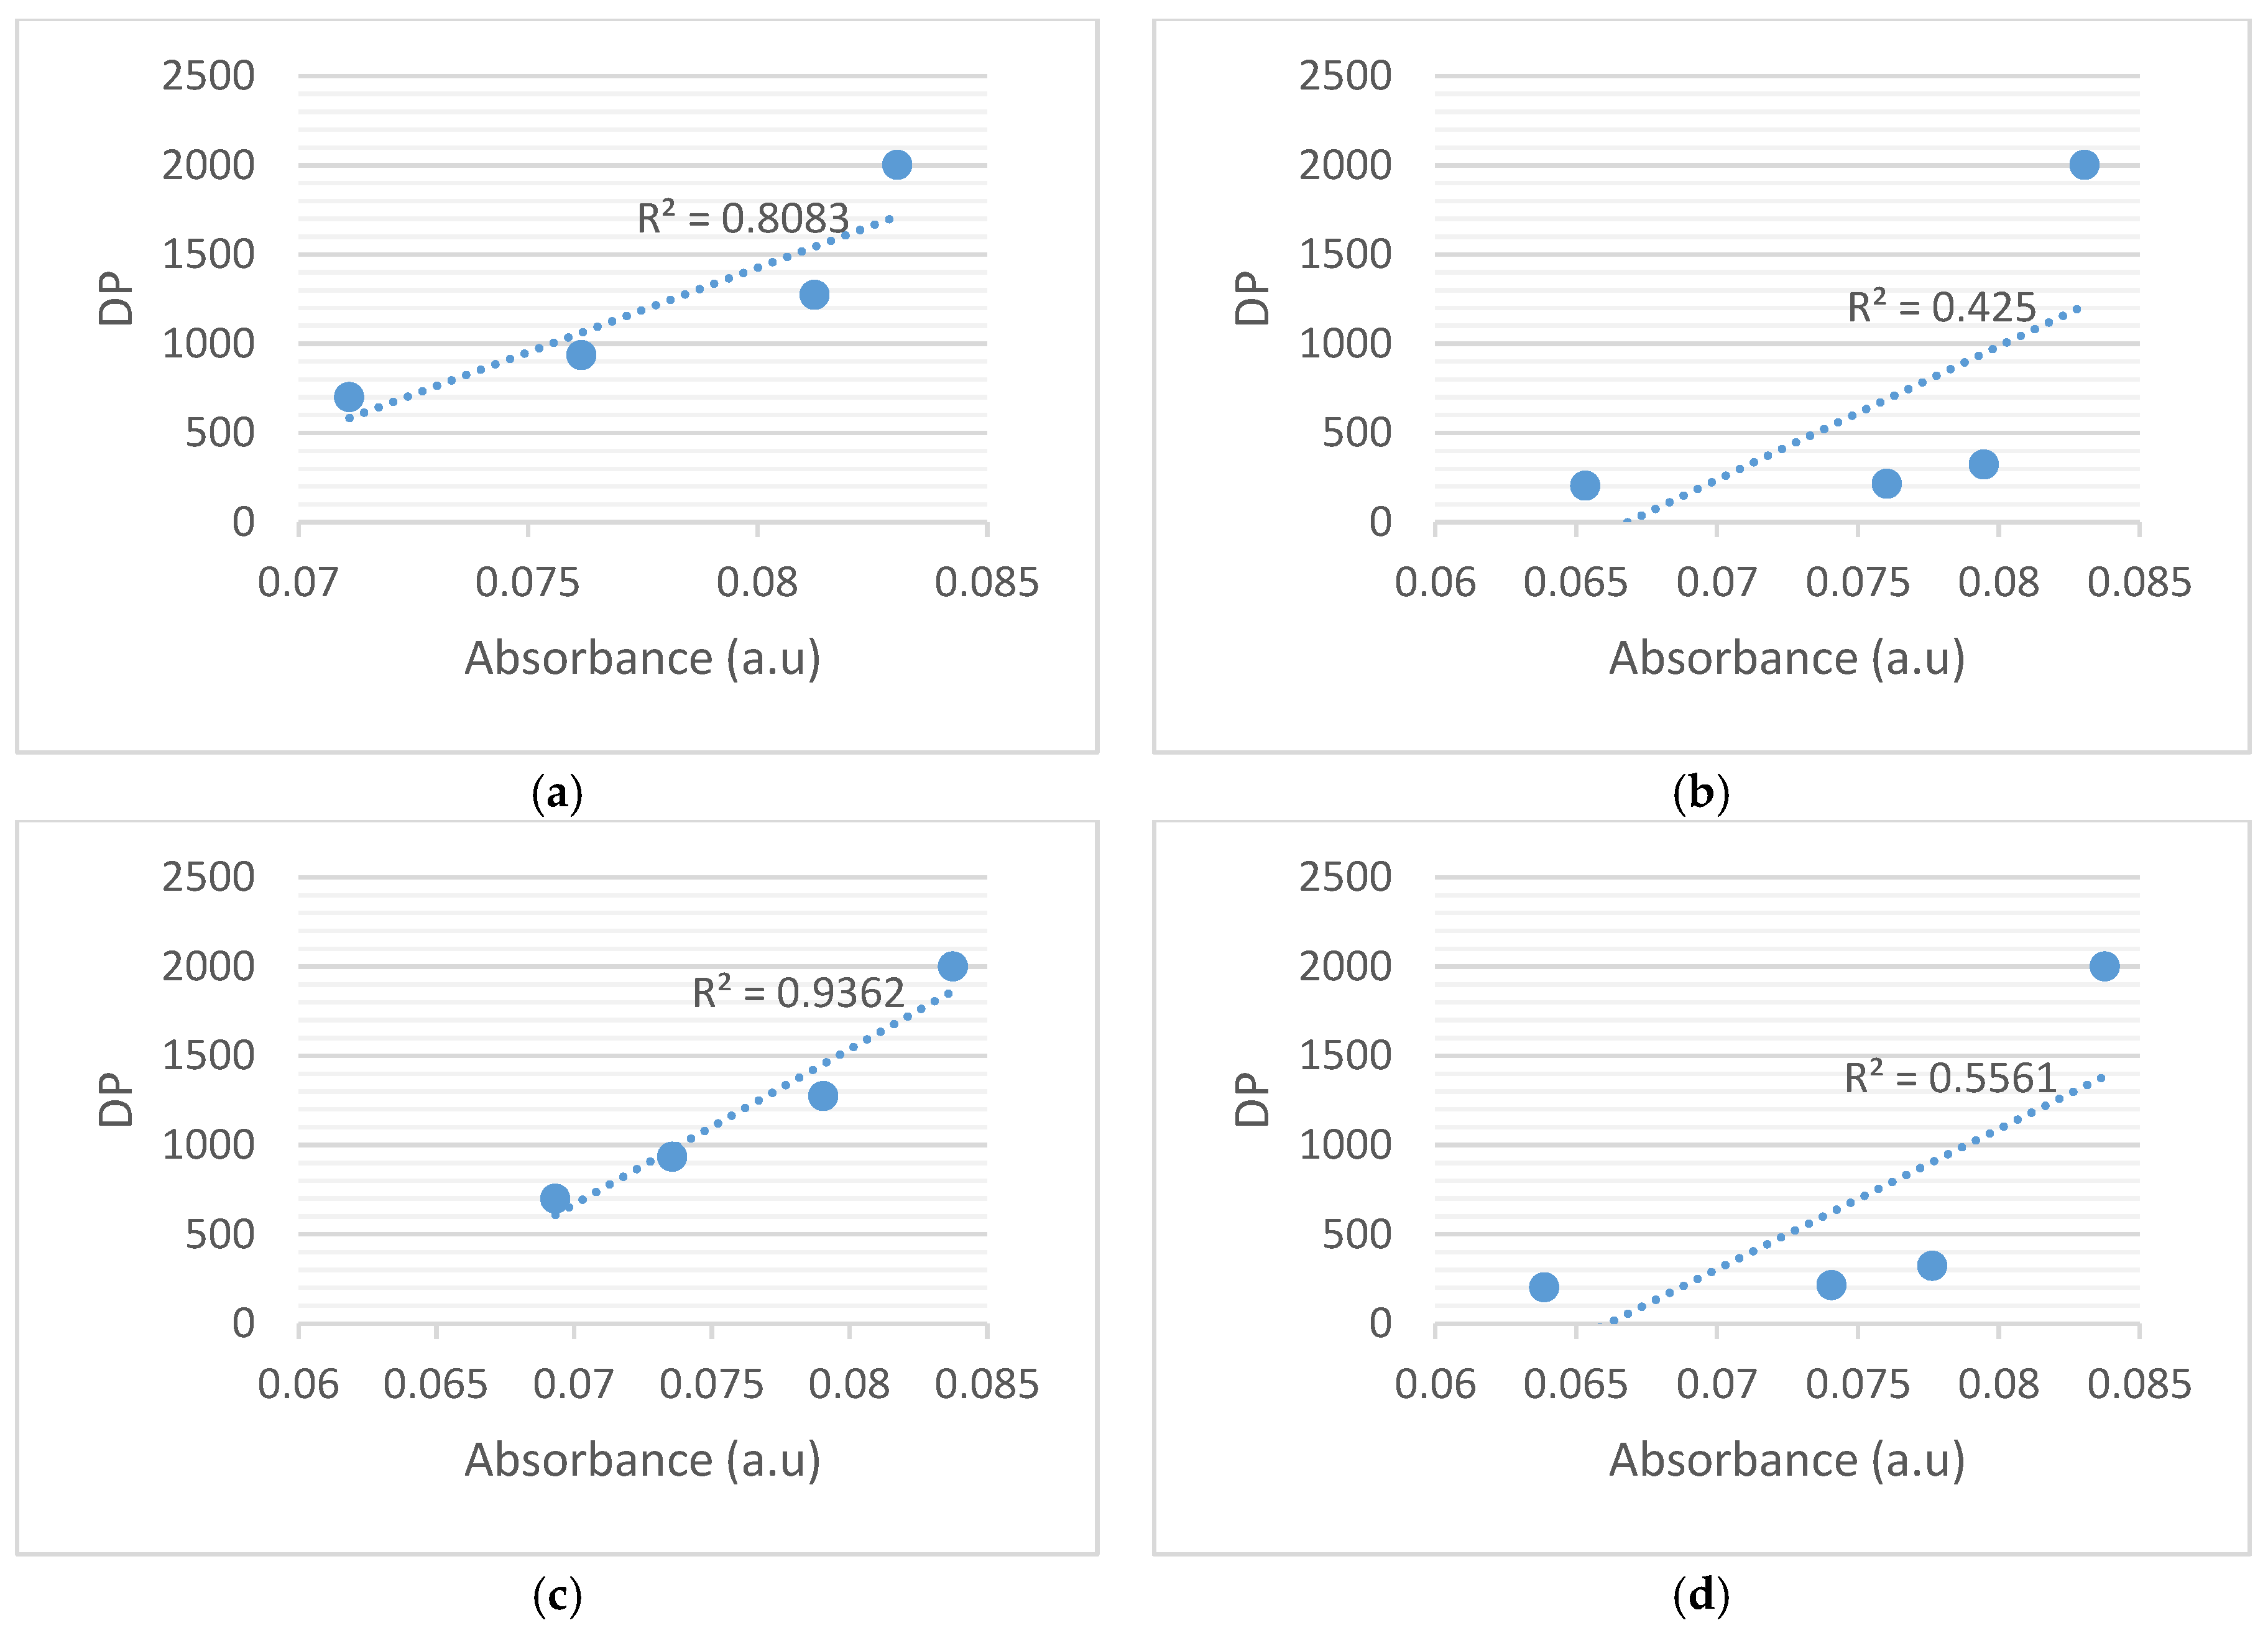
| 120 | O–H (3325 cm−1) | FTIR | 0.9362 |
| 150 | 0.5561 | ||
| 120 | O–H (3273 cm−1) | FTIR | 0.8083 |
| 150 | 0.425 | ||
| 120 | Weight Percent O | EDS | 0.9964 |
| 150 | 0.9814 |
© 2017 by the authors. Licensee MDPI, Basel, Switzerland. This article is an open access article distributed under the terms and conditions of the Creative Commons Attribution (CC BY) license (http://creativecommons.org/licenses/by/4.0/).
Share and Cite
Munajad, A.; Subroto, C.; Suwarno. Study on the Effects of Thermal Aging on Insulating Paper for High Voltage Transformer Composite with Natural Ester from Palm Oil Using Fourier Transform Infrared Spectroscopy (FTIR) and Energy Dispersive X-ray Spectroscopy (EDS). Energies 2017, 10, 1857. https://doi.org/10.3390/en10111857
Munajad A, Subroto C, Suwarno. Study on the Effects of Thermal Aging on Insulating Paper for High Voltage Transformer Composite with Natural Ester from Palm Oil Using Fourier Transform Infrared Spectroscopy (FTIR) and Energy Dispersive X-ray Spectroscopy (EDS). Energies. 2017; 10(11):1857. https://doi.org/10.3390/en10111857
Chicago/Turabian StyleMunajad, Abi, Cahyo Subroto, and Suwarno. 2017. "Study on the Effects of Thermal Aging on Insulating Paper for High Voltage Transformer Composite with Natural Ester from Palm Oil Using Fourier Transform Infrared Spectroscopy (FTIR) and Energy Dispersive X-ray Spectroscopy (EDS)" Energies 10, no. 11: 1857. https://doi.org/10.3390/en10111857
APA StyleMunajad, A., Subroto, C., & Suwarno. (2017). Study on the Effects of Thermal Aging on Insulating Paper for High Voltage Transformer Composite with Natural Ester from Palm Oil Using Fourier Transform Infrared Spectroscopy (FTIR) and Energy Dispersive X-ray Spectroscopy (EDS). Energies, 10(11), 1857. https://doi.org/10.3390/en10111857