Estimation of Transformers Health Index Based on the Markov Chain

 ,
,
Abstract
:1. Introduction
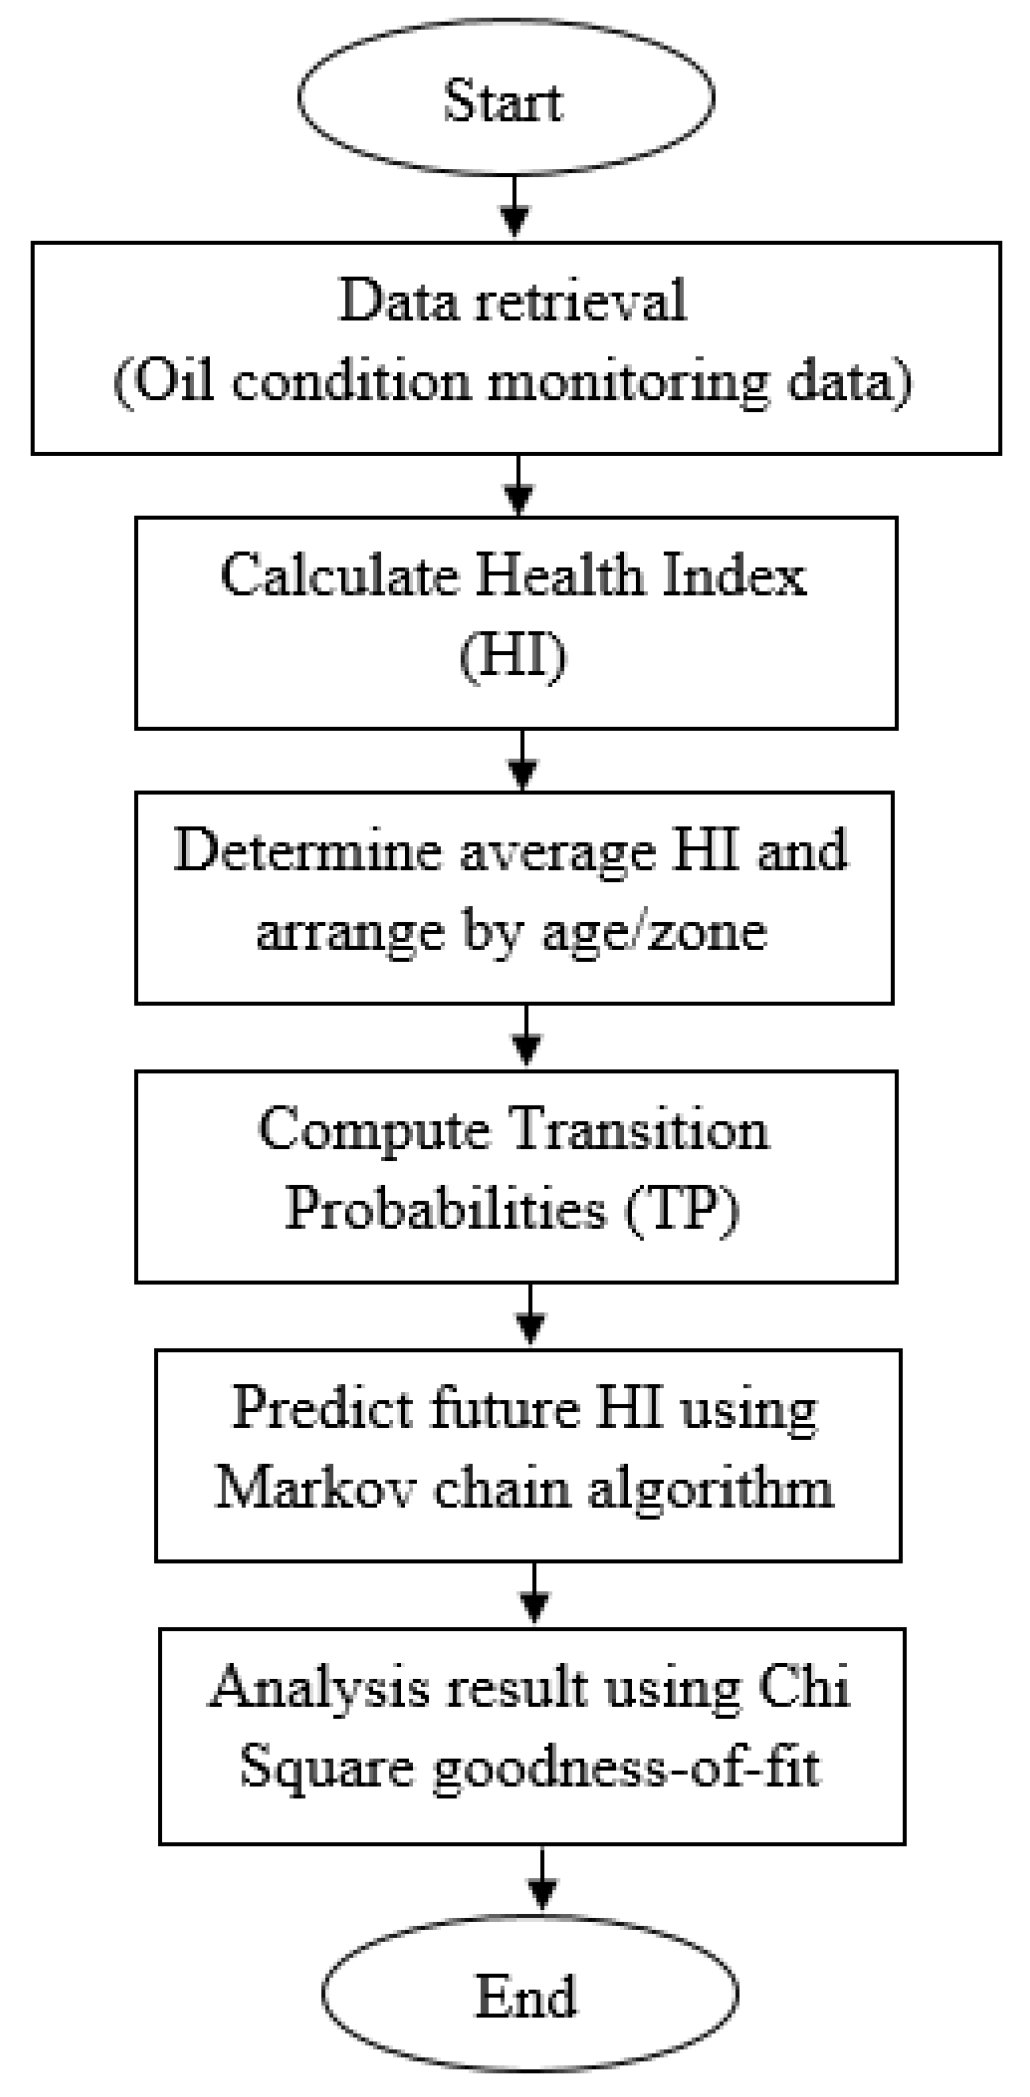
2. Condition Assessment and Health Index (HI)
3. Development of the Markov Model (MM)
3.1. Markov Chain Modeling Concept
3.2. Derivation of Transition Probabilities
4. Application of Markov Modeling
5. Conclusions
Acknowledgments
Author Contributions
Conflicts of Interest
References
- Emsley, A.; Steven, G. Review of chemical indicators of degradation of cellulosic electrical paper insulation in oil-filled transformers. IEE Proc. Sci. Meas. Technol. 1994, 141, 324–334. [Google Scholar] [CrossRef]
- A2.18 W.G. Life Management Techniques for Power Transformer; CIGRE: Paris, France, 2003. [Google Scholar]
- Wang, M.; Vandermaar, A.J.; Srivastava, K.D. Review of condition asessment of power transformers in service. Electr. Insul. Mag. IEEE 2002, 18, 12–25. [Google Scholar] [CrossRef]
- A2.34 W.G. Guide for Transformer Maintenance; CIGRE: Paris, France, 2011. [Google Scholar]
- Jahromi, A.; Piercy, R.; Cress, S.; Service, J.; Fan, W. An approach to power transformer asset management using health index. IEEE Electr. Insul. Mag. 2009, 25, 20–34. [Google Scholar] [CrossRef]
- Martins, M.A. Condition and risk assessment of power transformers: A general approach to calculate a health index. Ciência Tecnol. Mater. 2014, 26, 9–16. [Google Scholar] [CrossRef]
- Yang Ghazali, Y.Z.; Talib, M.A.; Ahmad Rosli, H. TNB experience in condition assessment and life management of distribution power transformers. In Proceedings of the Electricity Distribution—Part 1 (CIRED 2009), Prague, Czech Republic, 8–11 June 2009; pp. 1–4. [Google Scholar]
- Scatiggio, F.; Pompili, M. Health index: The TERNA’s practical approach for transformers fleet management. In Proceedings of the Electrical Insulation Conference (EIC), Ottawa, ON, Canada, 2–5 June 2013; pp. 178–182. [Google Scholar]
- Taengko, K.; Damrongkulkamjorn, P. Risk assessment for power transformers in PEA substations using Health Index. In Proceedings of the International Conference of Electrical Engineering/Electronics, Computer, Telecommunications and Information Technology (ECTI-CON), Krabi, Thailand, 15–17 May 2013; pp. 1–6. [Google Scholar]
- Tanasescu, G.; Notingher, P.V.; Dragomir, O.; Gorgan, B.; Voinescu, L. Health index calculation of electrical equipments using DiagConsole software. In Proceedings of the Advanced Topics in Electrical Engineering (ATEE), Bucharest, Romania, 23–25 May 2013; pp. 1–6. [Google Scholar]
- Haema, J.; Phadungthin, R. Condition assessment of the health index for power transformer. In Proceedings of the IEEE Power Engineering and Automation Conference (PEAM), Wuhan, China, 18–20 September 2012; pp. 1–4. [Google Scholar]
- Jiang, Y. Application and comparison of regression and Markov chain methods in bridge condition prediction and system benefit optimization. J. Transp. Res. Forum 2010, 49, 91–110. [Google Scholar]
- Si, X.S.; Wang, W.; Hu, C.H.; Zhou, D.H. Remaining useful life estimation—A review on the statistical data driven approaches. Eur. J. Oper. Res. 2011, 213, 1–14. [Google Scholar] [CrossRef]
- Butt, A.A.; Shahin, M.Y.; Feighan, K.J.; Carpenter, S.H. Pavement performance predíction model using the Markov process. Transp. Res. Rec. 1987, 1123, 12–99. [Google Scholar]
- Zhou, D.; Wang, Z.; Li, C. Data requisites for transformer statistical lifetime modelling-part I: Aging related failures. IEEE Trans. Power Deliv. 2013, 28, 1750–1757. [Google Scholar] [CrossRef]
- Zhou, D.; Wang, Z.; Jarman, P. Data requisites for transformer statistical lifetime modelling-part II: Aging related failures. IEEE Trans. Power Deliv. 2014, 29, 154–160. [Google Scholar] [CrossRef]
- Ridwan, M.I.; Talib, M.A.; Ghazali, Y.Z.Y. Application of weibull-bayesian for the reliability analysis of distribution transformers. In Proceedings of the IEEE 8th International Power Engineering and Optimization Conference (PEOCO2014), Langkawi, Malaysia, 24–25 March 2014. [Google Scholar]
- Jiang, Y.; Saito, M.; Sinha, K. Bridge performance prediction model using the Markov chain. Transp. Res. Rec. 1988, 1180, 25–32. [Google Scholar]
- Jiang, Y.; Sinha, K. Bridge service life prediction model using the Markov chain. Transp. Res. Rec. 1989, 1223, 24–30. [Google Scholar]
- Agrawal, A.K.; Kawaguchi, A.; Chen, Z. Deterioration rates of typical bridge elements in New York. J. Bridg. Eng. 2010, 15, 419–429. [Google Scholar] [CrossRef]
- Micevski, T.; Kuczera, G.; Coombes, P. Markov model for storm water pipe deterioration. J. Infrastruct. Syst. 2002, 8, 49–56. [Google Scholar] [CrossRef]
- Camahan, J.V.; Davis, W.J.; Shahin, M.Y.; Keane, P.L.; Wu, M.I. Optimal maintenance decisions for pavement management. J. Transp. Eng. 1987, 113, 554–572. [Google Scholar] [CrossRef]
- Riveros, G.A.; Arredondo, E. Guide to the Development of a Deterioration Rate Curve Using Condition State Inspection Data; Report No.: ERDC/CHL CHETN-IX-25; US Army Corps of Engineers: Davis, CA, USA, 2010; pp. 1–12.
- Ranjith, S.; Setunge, S.; Gravina, R.; Venkatesan, S. Deterioration prediction of timber bridge elements using the Markov chain. J. Perform. Constr. Facil. 2013, 27, 319–325. [Google Scholar] [CrossRef]
- Hamoud, G.A.; Member, S.; Yiu, C. One Markov model for spare analysis of distribution power transformers. IEEE Trans. Power Syst. 2016, 31, 1643–1648. [Google Scholar] [CrossRef]
- Li, Q.; Zhao, T.; Zhang, L.; Lou, J. Mechanical fault diagnostics of onload tap changer within power transformers based on hidden Markov model. IEEE Trans. Power Deliv. 2012, 27, 596–601. [Google Scholar] [CrossRef]
- Hoskins, R.P.; Strbac, G.; Brint, A.T. Modelling the degradation of condition indices. IEE Proc. Gener. Transm. Distrib. 1999, 146, 386–392. [Google Scholar] [CrossRef]
- Hamoud, G.A. Use of Markov models in assessing spare transformer requirements for distribution stations. IEEE Trans. Power Syst. 2012, 27, 1098–1105. [Google Scholar] [CrossRef]
- Deloitte Asset Management; Canadian Electricity Associate (CEA). Asset Health Indices: A Utility Industry Necessity; White paper; Deloitte: London, UK, 2014. [Google Scholar]
- Brandtzæg, G. Health Indexing of Norwegian Power Transformers. Master’s Thesis, Norwegian University of Science and Technology, Trondheim, Norway, 2015. [Google Scholar]
- Naderian, A.; Cress, S.; Piercy, R.; Wang, F.; Service, J. An approach to determine the health index of power transformers. In Proceedings of the IEEE International Symposium on Electrical Insulation (ISEI), Vancouver, BC, Canada, 9–12 June 2008; pp. 192–196. [Google Scholar]
- Abu-Elanien, A.E.B.; Salama, M.M.A.; Ibrahim, M. Calculation of a health index for oil-immersed transformers rated under 69 kV using fuzzy logic. IEEE Trans. Power Deliv. 2012, 27, 2029–2036. [Google Scholar] [CrossRef]
- Ashkezari, A.D.; Ma, H.; Saha, T.K.; Ekanayake, C. Application of fuzzy support vector machine for determining the health index of the insulation system of in-service power transformers. IEEE Trans. Dielectr. Electr. Insul. 2013, 20, 965–973. [Google Scholar] [CrossRef]
- Gorgan, B.; Notingher, P.V.; Badicu, L.V.; Tanasescu, G. Calculation of power transformers health indexes. Ann. Univ. Craiova Electr. Eng. Ser. 2010, 34, 13–18. [Google Scholar]
- Yates, R.D.; Goodman, D.J. Probability and Stochastic Processes, 2nd ed.; John Wiley & Sons Inc.: Hoboken, NJ, USA, 2005; pp. 445–451. ISBN 0-471-27214-0. [Google Scholar]
- Shannon, C.E. A mathematical theory of Communication. Bell Syst. Tech. J. 1948, 27, 379–423. [Google Scholar] [CrossRef]
- Davis, W.J.; Carnahan, J.V. Decision support for road surface maintenance. Omega 1987, 15, 313–322. [Google Scholar] [CrossRef]
- Morcous, G. Performance prediction of bridge deck systems using Markov chains. J. Perform. Constr. Facil. 2006, 20, 146–155. [Google Scholar] [CrossRef]
- Cesare, M.A.; Santamarina, C.; Turkstra, C.; Vanmarcke, E.H. Modeling bridge deterioration with Markov chains. J. Transp. Eng. 1993, 118, 820–833. [Google Scholar] [CrossRef]
- Zhang, Y.; Augenbroe, G.; Vidakovic, B. Uncertainty analysis in using Markov Chain to predict roof life cycle performance. In Proceedings of the Durability of Building Material and Components (10DBMC), Lyon, France, 17–20 April 2005. [Google Scholar]


| State | Health Index | Condition | Description |
|---|---|---|---|
| 1 | 85–100% | Very Good | Some aging or minor deterioration of a limited number of components. |
| 2 | 70–84% | Good | Significant deterioration of some components. |
| 3 | 50–69% | Fair | Widespread significant or serious deterioration of specific components. |
| 4 | 30–49% | Poor | Widespread serious deterioration. |
| 5 | 0–29% | Very Poor | Extensive serious deterioration. |
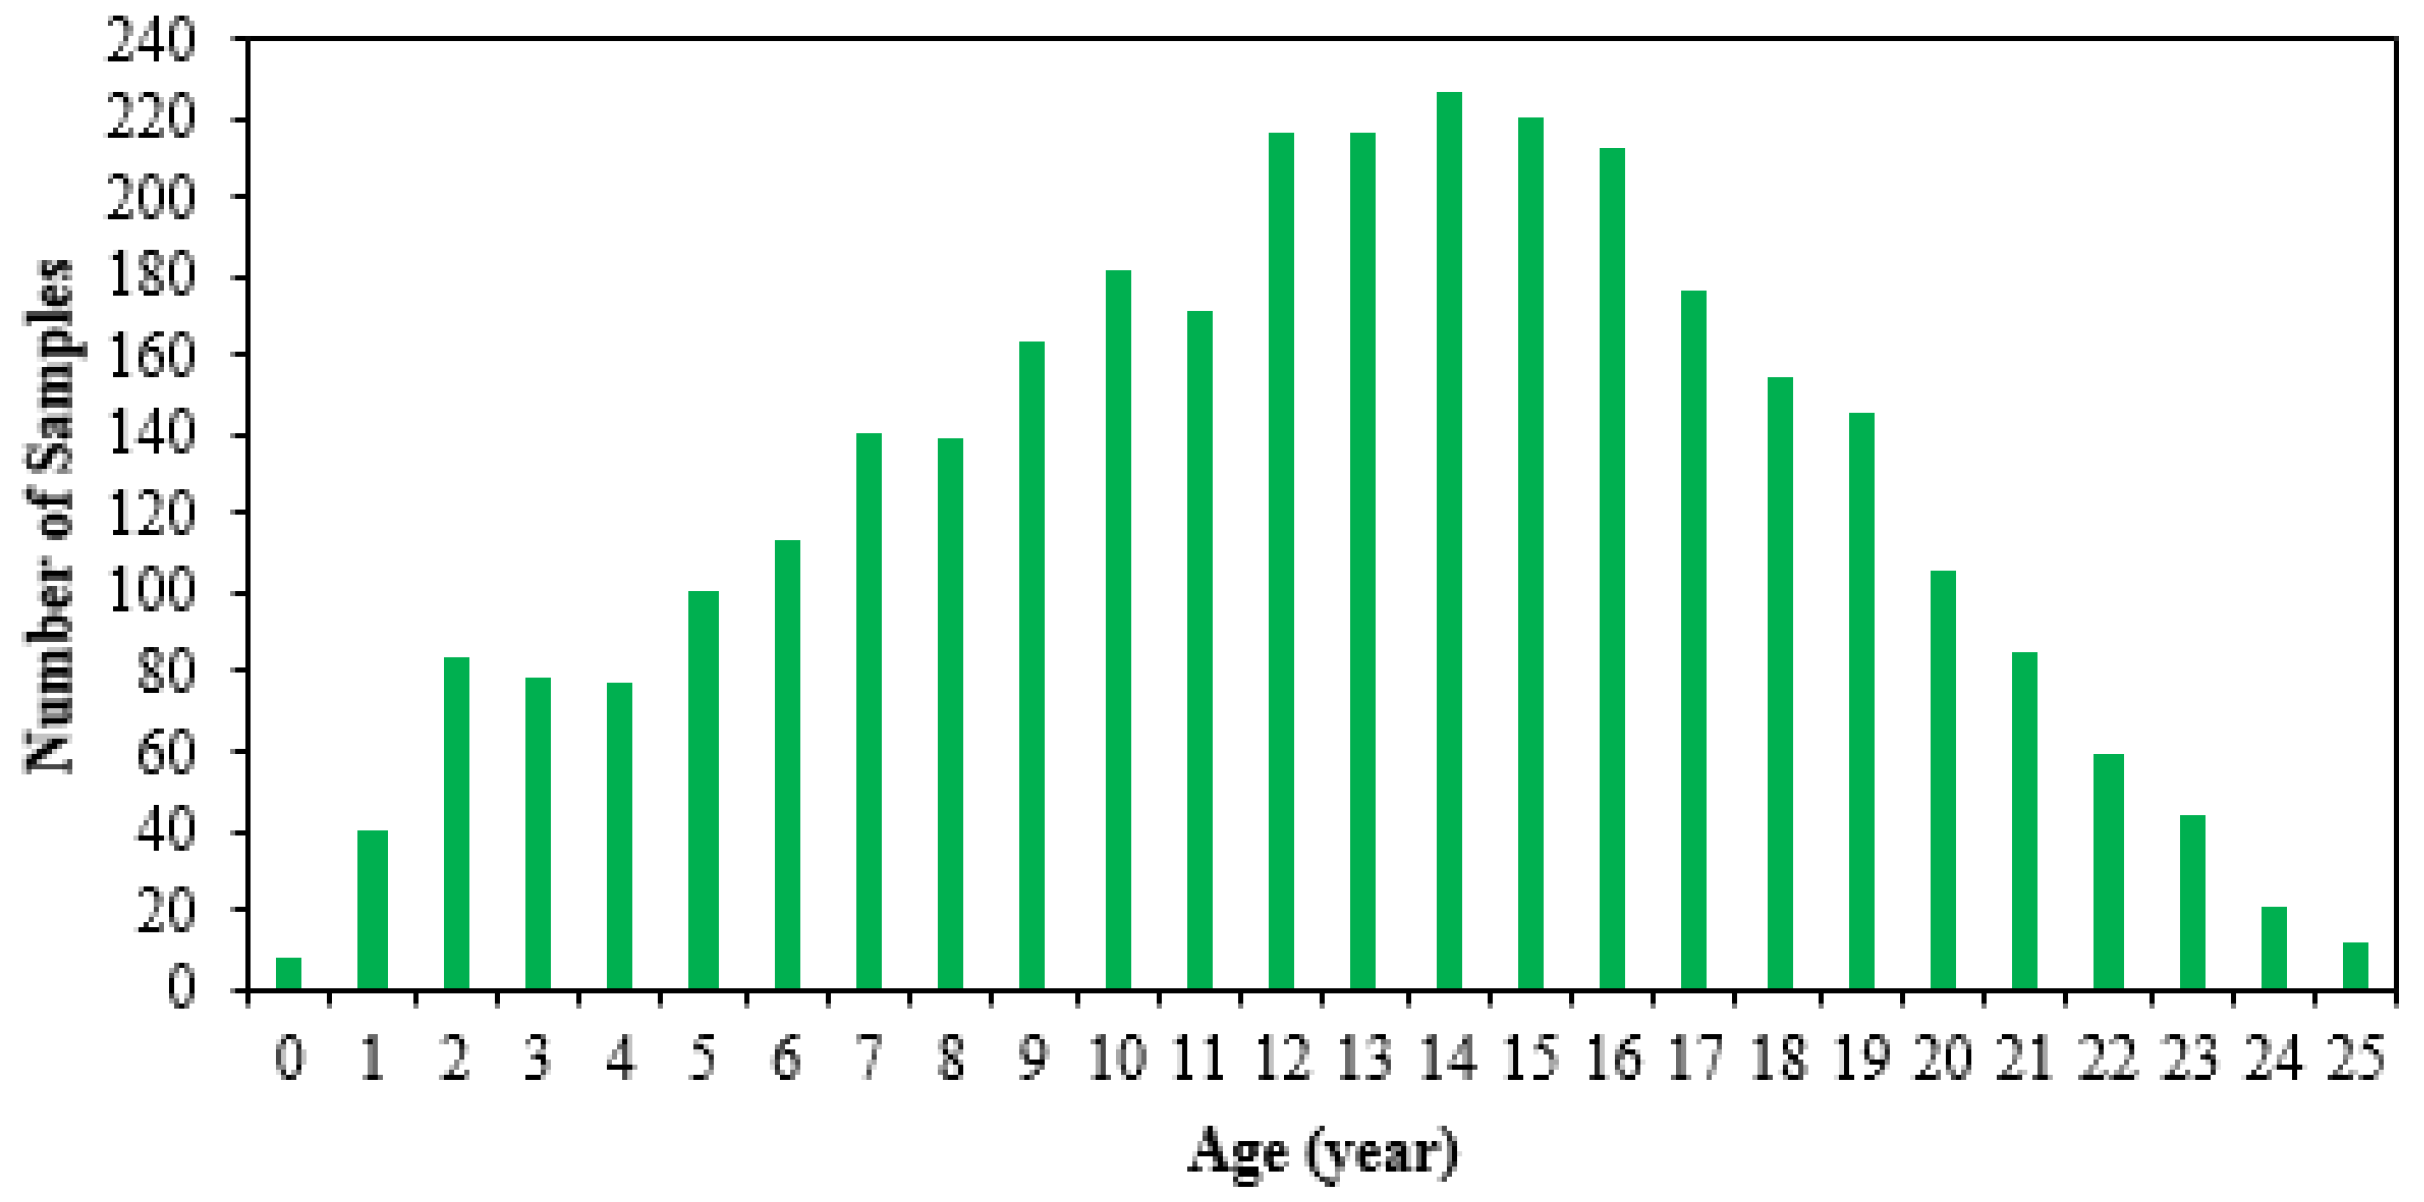
| Zone | Number of Oil Sample | Transformer Age (Year) | Computed HI (%) |
|---|---|---|---|
| 1 | 40 | 1 | 89.38 |
| 84 | 2 | 82.80 | |
| 79 | 3 | 82.57 | |
| 78 | 4 | 69.46 | |
| 101 | 5 | 74.33 | |
| 2 | 113 | 6 | 68.82 |
| 140 | 7 | 67.60 | |
| 139 | 8 | 65.53 | |
| 164 | 9 | 60.85 | |
| 182 | 10 | 61.09 | |
| 3 | 171 | 11 | 56.26 |
| 216 | 12 | 58.35 | |
| 216 | 13 | 55.59 | |
| 227 | 14 | 54.36 | |
| 220 | 15 | 54.41 | |
| 4 | 212 | 16 | 53.55 |
| 177 | 17 | 49.78 | |
| 154 | 18 | 50.24 | |
| 146 | 19 | 48.99 | |
| 106 | 20 | 49.05 | |
| 5 | 85 | 21 | 49.18 |
| 60 | 22 | 50.48 | |
| 44 | 23 | 57.82 | |
| 21 | 24 | 56.80 | |
| 12 | 25 | 51.41 |
| Zone | Initial State | ||||
|---|---|---|---|---|---|
| Zone 1 | 1.0000 | 0.0000 | 0.0000 | 0.0000 | 0.0000 |
| Zone 2 | 0.0020 | 0.4002 | 0.5622 | 0.0354 | 0.0002 |
| Zone 3 | 0.0001 | 0.2278 | 0.2136 | 0.5442 | 0.0144 |
| Zone 4 | 0.0000 | 0.1289 | 0.0991 | 0.7261 | 0.0459 |
| Zone 5 | 0.0000 | 0.0729 | 0.0515 | 0.7918 | 0.0838 |
| Zone 6 | 0.0000 | 0.0413 | 0.0282 | 0.8067 | 0.1238 |
| Zone 7 | 0.0000 | 0.0233 | 0.0157 | 0.7969 | 0.1640 |
| Age | Computed HI (%) | Predicted HI (%) |
|---|---|---|
| 1 | 89.38 | 88.62 |
| 2 | 82.80 | 82.90 |
| 3 | 82.57 | 79.25 |
| 4 | 69.46 | 76.53 |
| 5 | 74.33 | 74.35 |
| 6 | 68.82 | 70.66 |
| 7 | 67.60 | 67.60 |
| 8 | 65.53 | 65.02 |
| 9 | 60.85 | 62.84 |
| 10 | 61.09 | 60.96 |
| 11 | 56.26 | 59.34 |
| 12 | 58.35 | 57.92 |
| 13 | 55.59 | 56.66 |
| 14 | 54.36 | 55.56 |
| 15 | 54.41 | 54.57 |
| 16 | 53.55 | 53.69 |
| 17 | 49.78 | 52.89 |
| 18 | 50.24 | 52.17 |
| 19 | 48.99 | 51.51 |
| 20 | 49.05 | 50.91 |
| 21 | 49.18 | 50.35 |
| 22 | 50.48 | 49.84 |
| 23 | 57.82 | 49.37 |
| 24 | 56.80 | 48.94 |
| 25 | 51.41 | 48.53 |
© 2017 by the authors. Licensee MDPI, Basel, Switzerland. This article is an open access article distributed under the terms and conditions of the Creative Commons Attribution (CC BY) license (http://creativecommons.org/licenses/by/4.0/).
Share and Cite
Yahaya, M.S.; Azis, N.; Ab Kadir, M.Z.A.; Jasni, J.; Hairi, M.H.; Talib, M.A. Estimation of Transformers Health Index Based on the Markov Chain. Energies 2017, 10, 1824. https://doi.org/10.3390/en10111824
Yahaya MS, Azis N, Ab Kadir MZA, Jasni J, Hairi MH, Talib MA. Estimation of Transformers Health Index Based on the Markov Chain. Energies. 2017; 10(11):1824. https://doi.org/10.3390/en10111824
Chicago/Turabian StyleYahaya, Muhammad Sharil, Norhafiz Azis, Mohd Zainal Abidin Ab Kadir, Jasronita Jasni, Mohd Hendra Hairi, and Mohd Aizam Talib. 2017. "Estimation of Transformers Health Index Based on the Markov Chain" Energies 10, no. 11: 1824. https://doi.org/10.3390/en10111824
APA StyleYahaya, M. S., Azis, N., Ab Kadir, M. Z. A., Jasni, J., Hairi, M. H., & Talib, M. A. (2017). Estimation of Transformers Health Index Based on the Markov Chain. Energies, 10(11), 1824. https://doi.org/10.3390/en10111824