Article

Multi-Objective Optimization Approach for Placement of Multiple DGs for Voltage Sensitive Loads

Eelctrical and Instrumentation Engineering Department, Thapar University, Patiala 147004, India
*
Author to whom correspondence should be addressed.
Energies 2017, 10(11), 1733; https://doi.org/10.3390/en10111733
Submission received: 19 September 2017 / Revised: 12 October 2017 / Accepted: 23 October 2017 / Published: 29 October 2017
(This article belongs to the Section F: Electrical Engineering)

Abstract

:
This paper presents the optimal placement of multiple Dispersed Generators using multi-objective optimization. The optimization is carried out with objectives namely active power loss, reactive power loss, voltage deviation and overall economy. The multi-objective optimization and accounting conflicting objectives are realized through Particle Swarm Optimization with fuzzy decision approach to find the optimal sizes and sites of Dispersed Generators for voltage dependent residential, commercial and industrial loads. The clusters of buses are formulated from base case load flow to limit the search space for finding the placement of the Dispersed Generators. The effectiveness of the proposed approach is tested on a 69-bus radial distribution. It is found that the optimal placement of the Dispersed Generators improves the overall performance of the system and the optimal allocation is affected by the type of load.

1. Introduction

The distribution system is the final interconnection between the bulk power system and consumers. There is a large number of buses and lines with a high R/X ratio, which results into high power losses in distribution systems. These losses are even more significant at heavy loads. Moreover, the voltage of buses, farther from the substation, decreases. It is important to optimize the operation of distribution systems by reducing the losses and enhancing the voltages profile. To assure these improvements reconfiguration and capacitor placement have been employed earlier but in recent decade the placement of dispersed generation has attracted the researchers. Dispersed Generators (DGs) are small-scale generators that are located near to load centers. The size of DGs varies from less than a kW to tens of MW. The DGs have additional advantage of meeting load demand along with reduction in losses and improvement of voltage profile. To maximize these benefits, DG of optimal size should be placed at optimal site. Several optimization techniques have been utilized for DG placement by optimizing various objective functions, as single objective and multi-objective optimization problem.
The placement of DG as single objective optimization is carried out through various optimization techniques for loss minimization, cost minimization, profit maximization. These methods include Particle Swarm Optimization (PSO) [1,2], Genetic Algorithm (GA) [3], Artificial Bee Colony (ABC) [4], Improved Bat Algorithm [5], and Analytical expression based heuristics [6,7,8,9]. The limitation of analytical expression based heuristics is inability to handle multiple objectives and multiple DGs.
The optimal placement of DG has been investigated through PSO [1,2] to minimize losses in distribution system. The effectiveness of three different types of DGs have been analyzed [1]. The DG that is capable of supplying both active and reactive power is most effective for loss reduction. Loss minimization has been investigated by integrating multiple DGs [2]. The realistic nature of loads has been accounted by time-varying characteristics. GA [3] has been applied to optimally allocate DGs to minimize losses. It has been concluded that the benefit of loss minimization by DG placement is limited up to certain locations only and after that trend reverses. The problem of DG placement to minimize losses has been solved by ABC algorithm [4] for two different load scenarios. Multiple DG placement has been obtained by Bat Algorithm [5] to achieve maximum reduction in annual energy losses in distribution system.
An analytical heuristic based on exact loss formula has been derived to attain the optimal size and location of DG [6] to reduce the power losses in distribution system. The location of DG, capable of supplying only active power, is found by sensitivity loss factors. The heuristic proposed in [6] is elaborated to consider different types of DG [7]. Another classical technique utilizes loss formula based on bus-injection to branch-current (BIBC) and branch-current to bus-voltage (BCBV) matrices [8] to calculate the optimal size and site of DG. This method does not require calculation of impedance matrix. Another technique based on analytical expressions [9] obtain the optimal site and size of four different types of DG by minimizing the losses. A decision making approach [10] based on exhaustive load flow has been employed to allocate wind and photovoltaic (PV) based DGs in distribution system to reduce the power losses and improve voltage profile. The PV based DG is found more influential in voltage profile improvement in comparison to wind based DG.
The multi-objective optimization problem has been solved by two different approaches i.e., by representing multi-objective optimization as single objective optimization using weighed sum approach or by handling multiple objectives simultaneously. The common objectives for multi-objective DG placement are minimization of power loss, voltage deviation, customer interruptions, cost of purchased energy and cost of DG.
The weighted sum approach has been used in [11,12,13,14,15] to find the optimal size and optimal site of DG. The allocation has been investigated through GA [11] where the multi-objective problem is changed to single objective by assigning weights to four objectives namely real and reactive power loss index, voltage profile index and Mega Volt Ampere (MVA) capacity index. In addition to these four objectives short-circuit current is also considered as objective in [12]. The optimization has been carried out using PSO after changing the multi-objective problem to single objective problem. Optimal site of DG for predefined size has been obtained by Simulated Annealing [13] for minimizing power loss, emissions and contingency. Optimal allocation of multiple DGs based on wind turbine and PV array has been done by PSO [14] for minimizing power loss and improving voltage stability. The multi-objective optimization problem is converted to single objective by assigning weights, where the weights were updated iteratively. Weighted sum approach has also been utilized in [15] for optimal sizing and siting of voltage controlled DG for balanced as well as unbalanced distribution networks for objectives as real and reactive power loss index, voltage profile index and reserve capacity of conductor index. The optimization has been attempted by supervised big-bang crunch method. The limitation of weighted sum approach is that the solution is dependent on weight assigned to each objective or the decision maker who assigns the weights to the objectives, influences the solution. Such solutions may be non-optimal solutions.
Multi-objective optimization problem has been solved by ε-constrained technique in [16,17,18] to suggest optimal allocation of DG in which one objective is selected as main objective and rest of objectives are treated as constraints. Minimization of cost of energy losses, voltage profile and power quality index are selected as objectives in [16] to attempt optimization by ε-constrained technique. The ε-constrained technique has been combined with GA [17] for optimal allocation of DG by minimizing four costs network upgrading, purchased energy, energy losses, energy not supplied. The combination of ε-constrained technique and GA [18] has been employed to allocate DG optimally considering voltage dependent loads. The minimization of interruptions to customers, cost of active power losses, cost of energy purchased, bus voltage deviation and maximization of security margin has been considered as multiple objectives.
Optimal location and size of DG has been obtained by Strength Pareto Evolutionary Algorithm and Non-dominated Sorting GA-II in [19] and Shuffled frog leaping algorithm in [20] to minimize real power loss and cost of DG. Optimization of weight factor is additional parameter to be optimized in [20] which balances the two main objectives. In addition to minimization of real power losses of system and cost of DG, voltage deviation minimization is also considered as objective in [21]. Non-dominated Sorting GA-II was used to solve the problem of optimal allocation of specified number of DGs of multiple types. The pareto front is obtained for simultaneous optimization of three objectives and final solution is selected from non-dominated solutions by normalized membership functions. Optimal allocation of DG models has been done by minimizing voltage deviation index, real and reactive power loss index, line loading index and short-circuit index using fuzzy embedded GA [22]. The multi-objective problem is simplified by assigning fuzzy membership function to each index. Goal optimization algorithm [23] has been used for optimal allocation of DG in distribution system by achieving the set goal for the indices used in [22]. In [24] combination of GA and PSO has been utilized by where optimal site is obtained by GA and size of DG is obtained by PSO. Multiple DGs of optimal size has been placed to minimize losses, improve voltage profile and to optimize voltage stability index. Enhanced multi-objective PSO has been proposed to optimally allocate multiple DGs by minimizing power losses and maximize voltage stability index [25,26]. Fuzzy decision-making has been employed to select single solution from Pareto front. Sequential quadratic programming has been employed in [27] to obtain set of optimal solutions to minimize total real power loss and cost of DG. In addition to loss and voltage deviation minimization, cost minimization is also considered as objective [
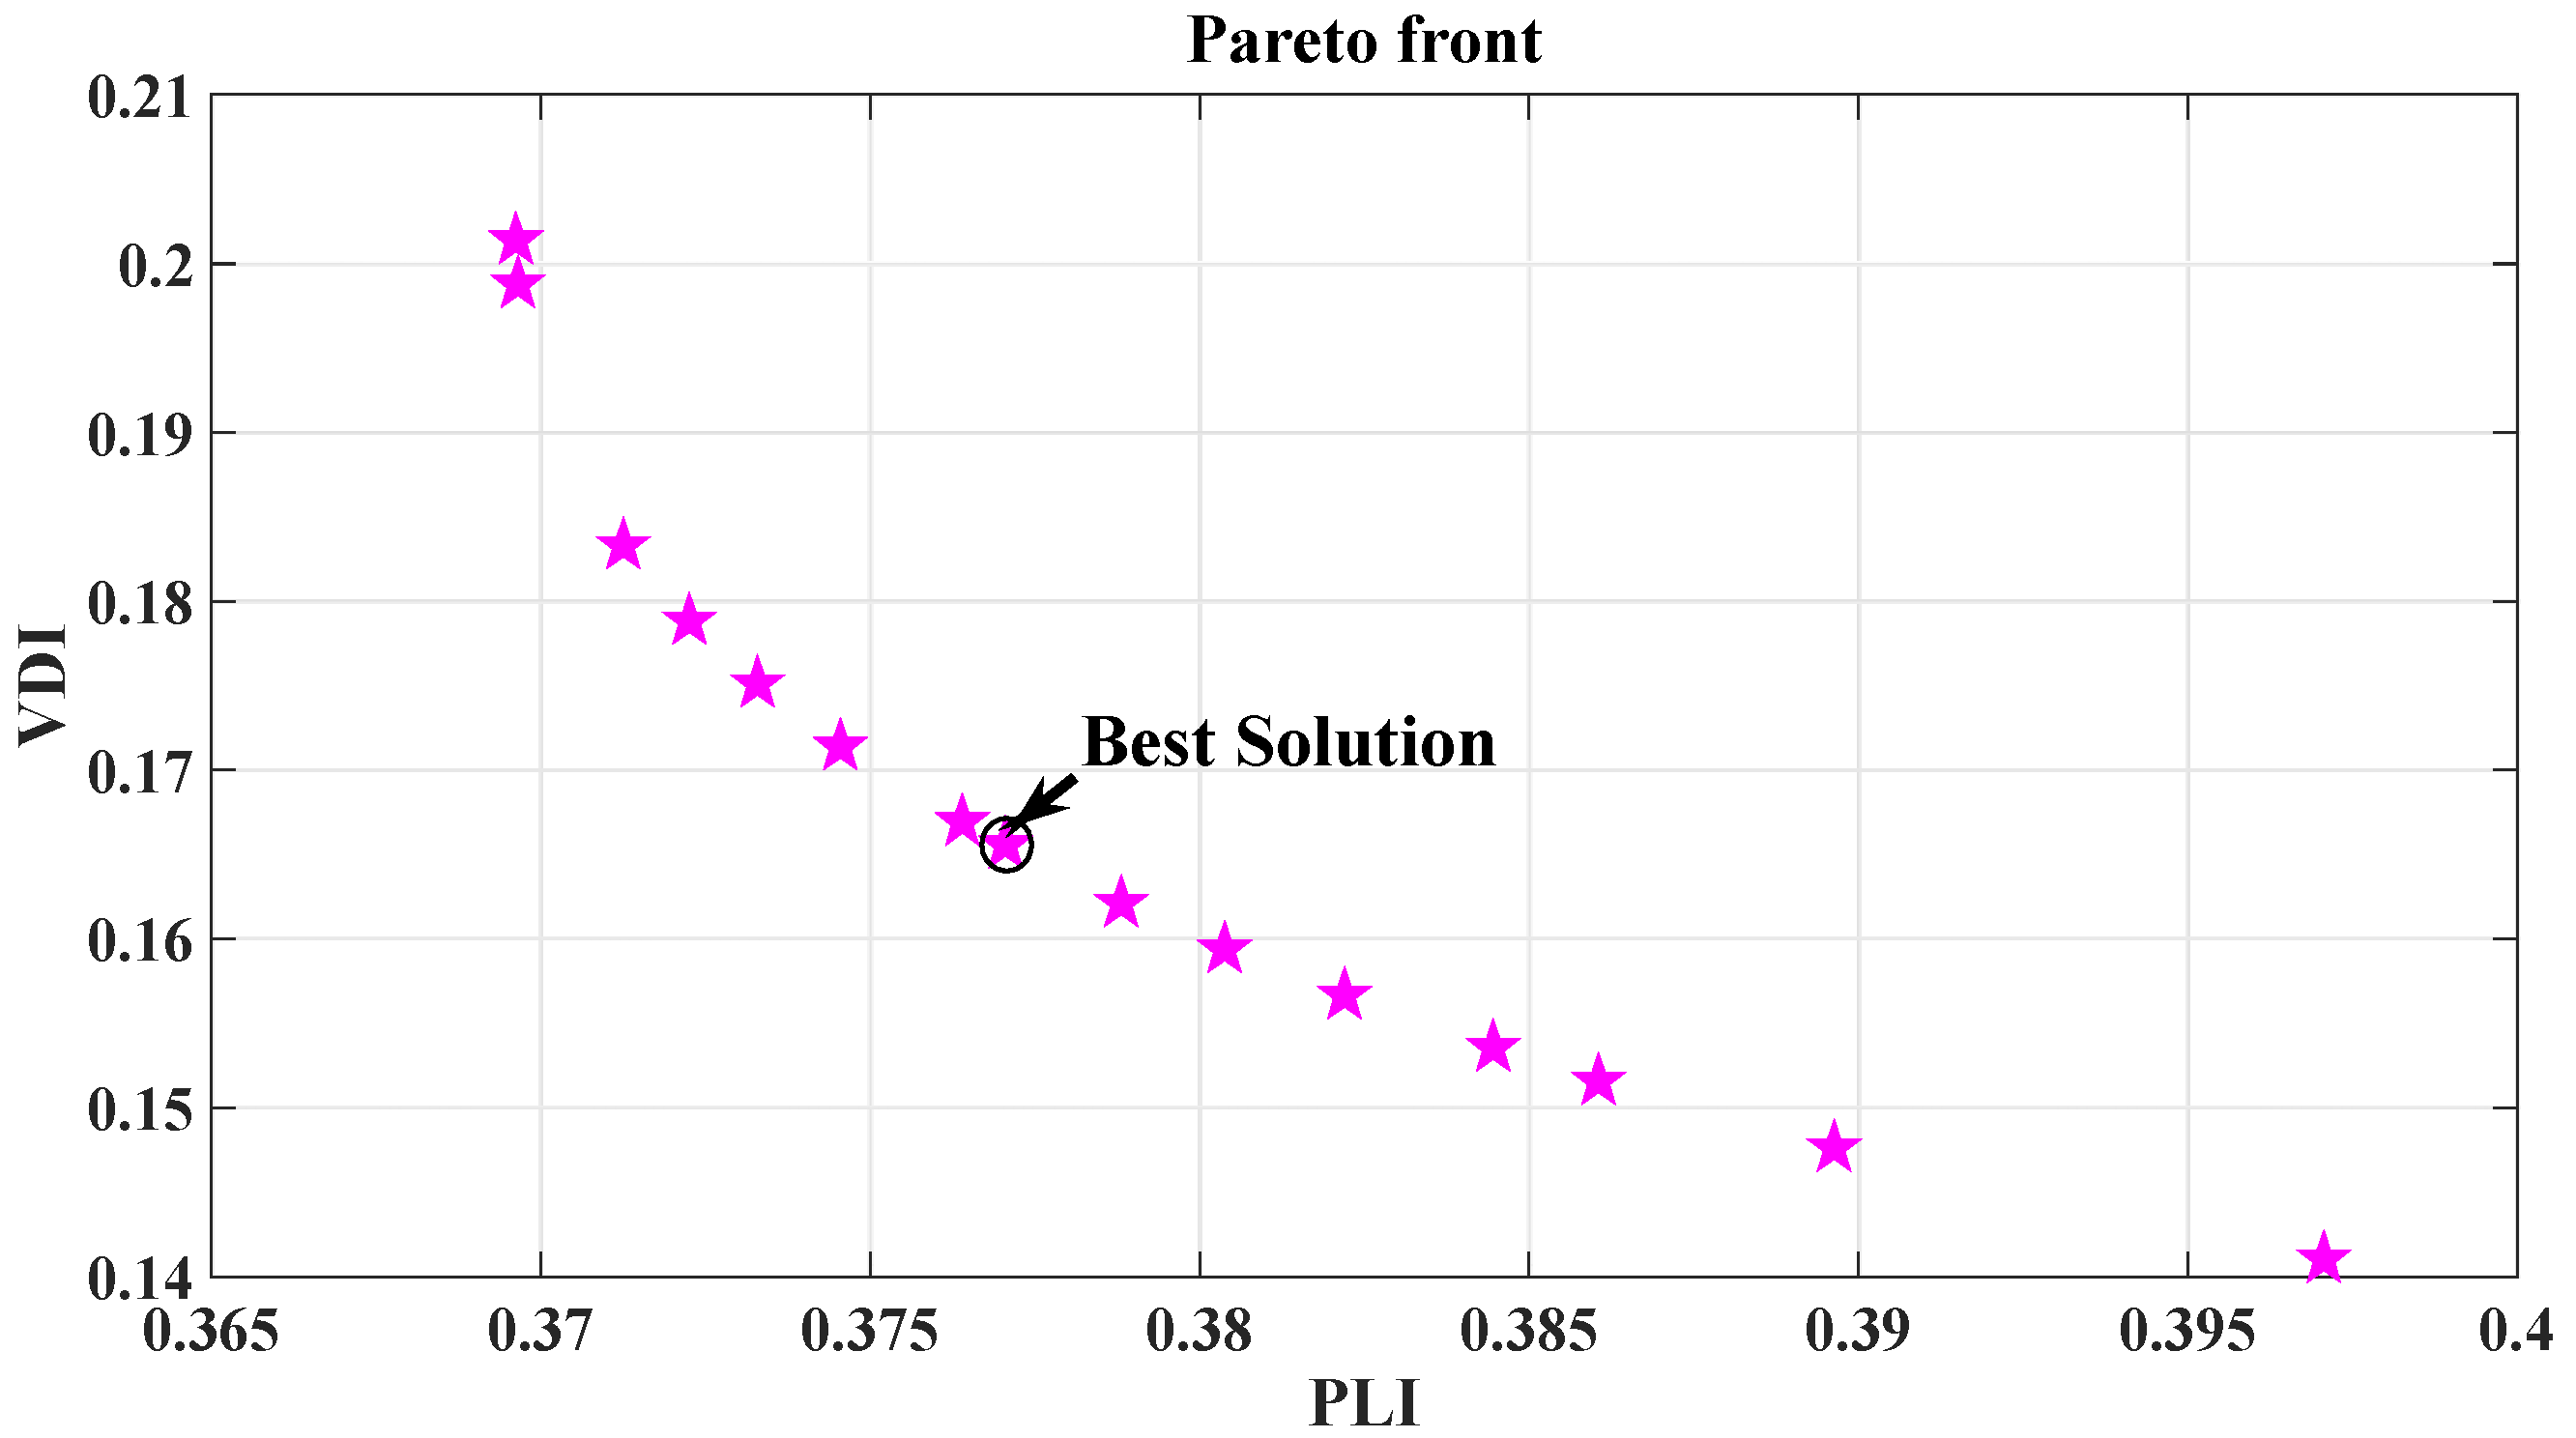
28]. Shuffled Bat algorithm has been employed in solving optimization. Pareto front has been obtained in both and compromised solution has been selected from set of solutions. The best solution has been selected by fuzzy decision-making in [27] and while it has been done by max-min technique in [28].
The GA and PSO are commonly used techniques for optimal placement of DG. The PSO has better diversity and exploration in comparison to GA and its convergence is fast due to momentum effect on particles [29]. Therefore, the optimization in the presented work is carried out through PSO.
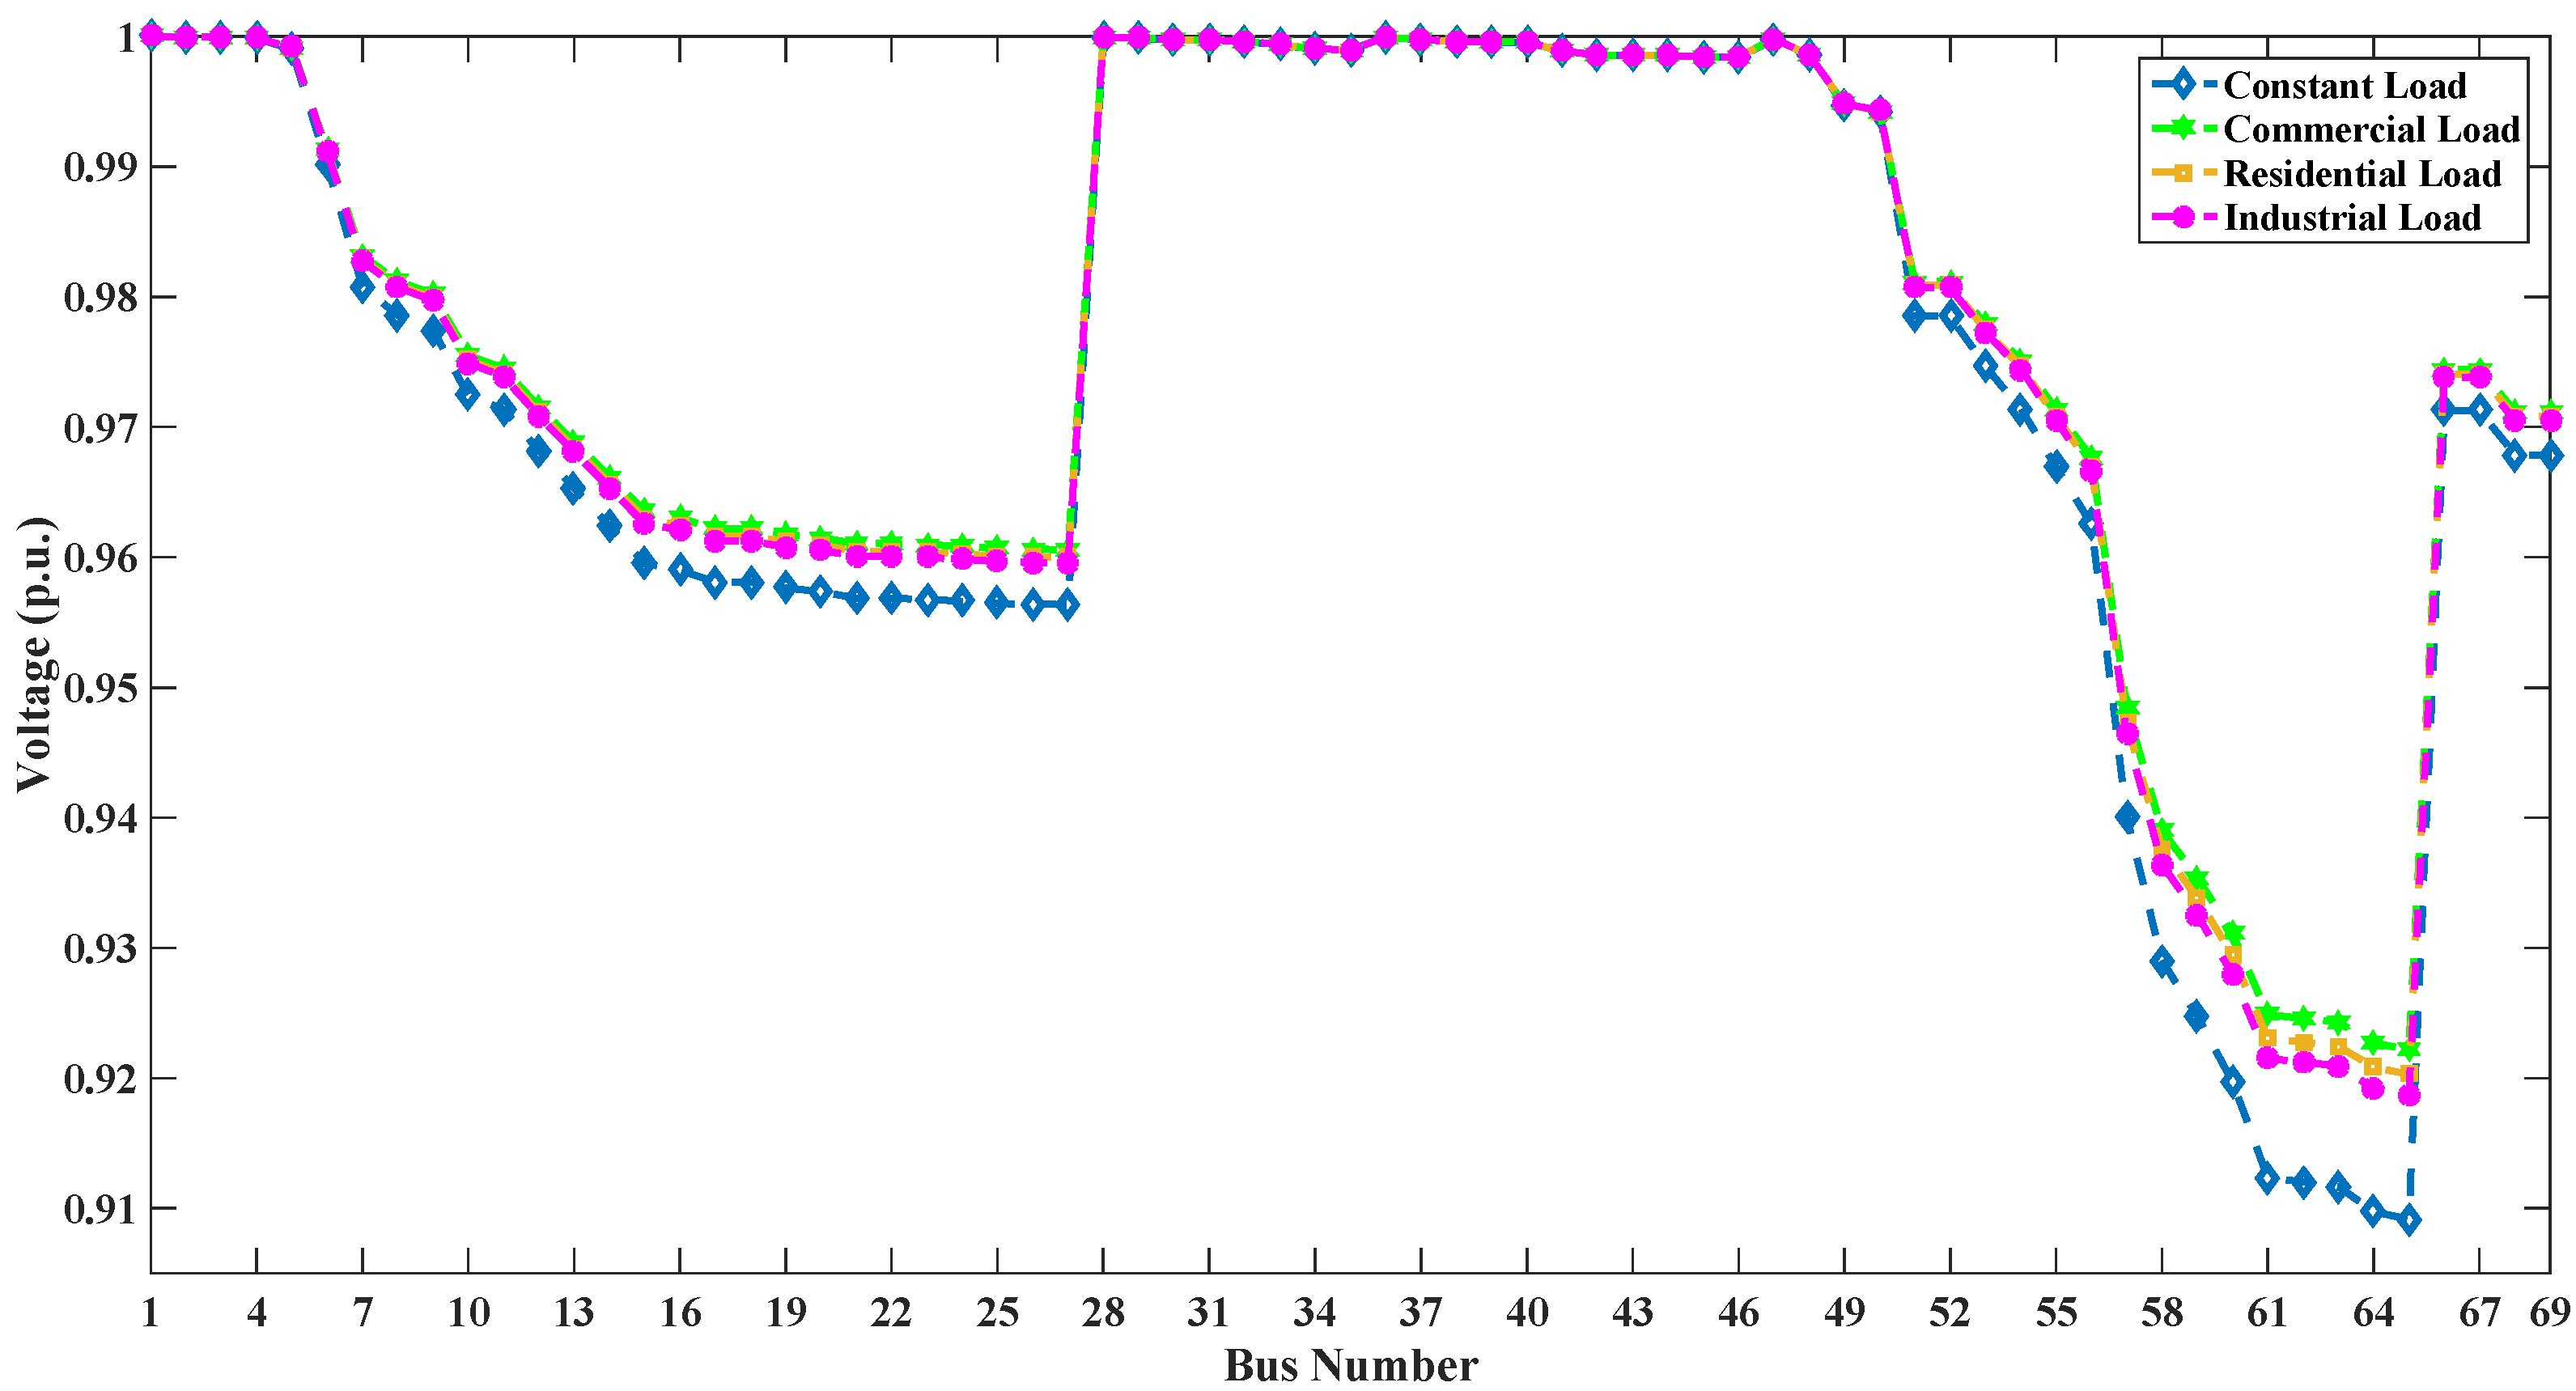
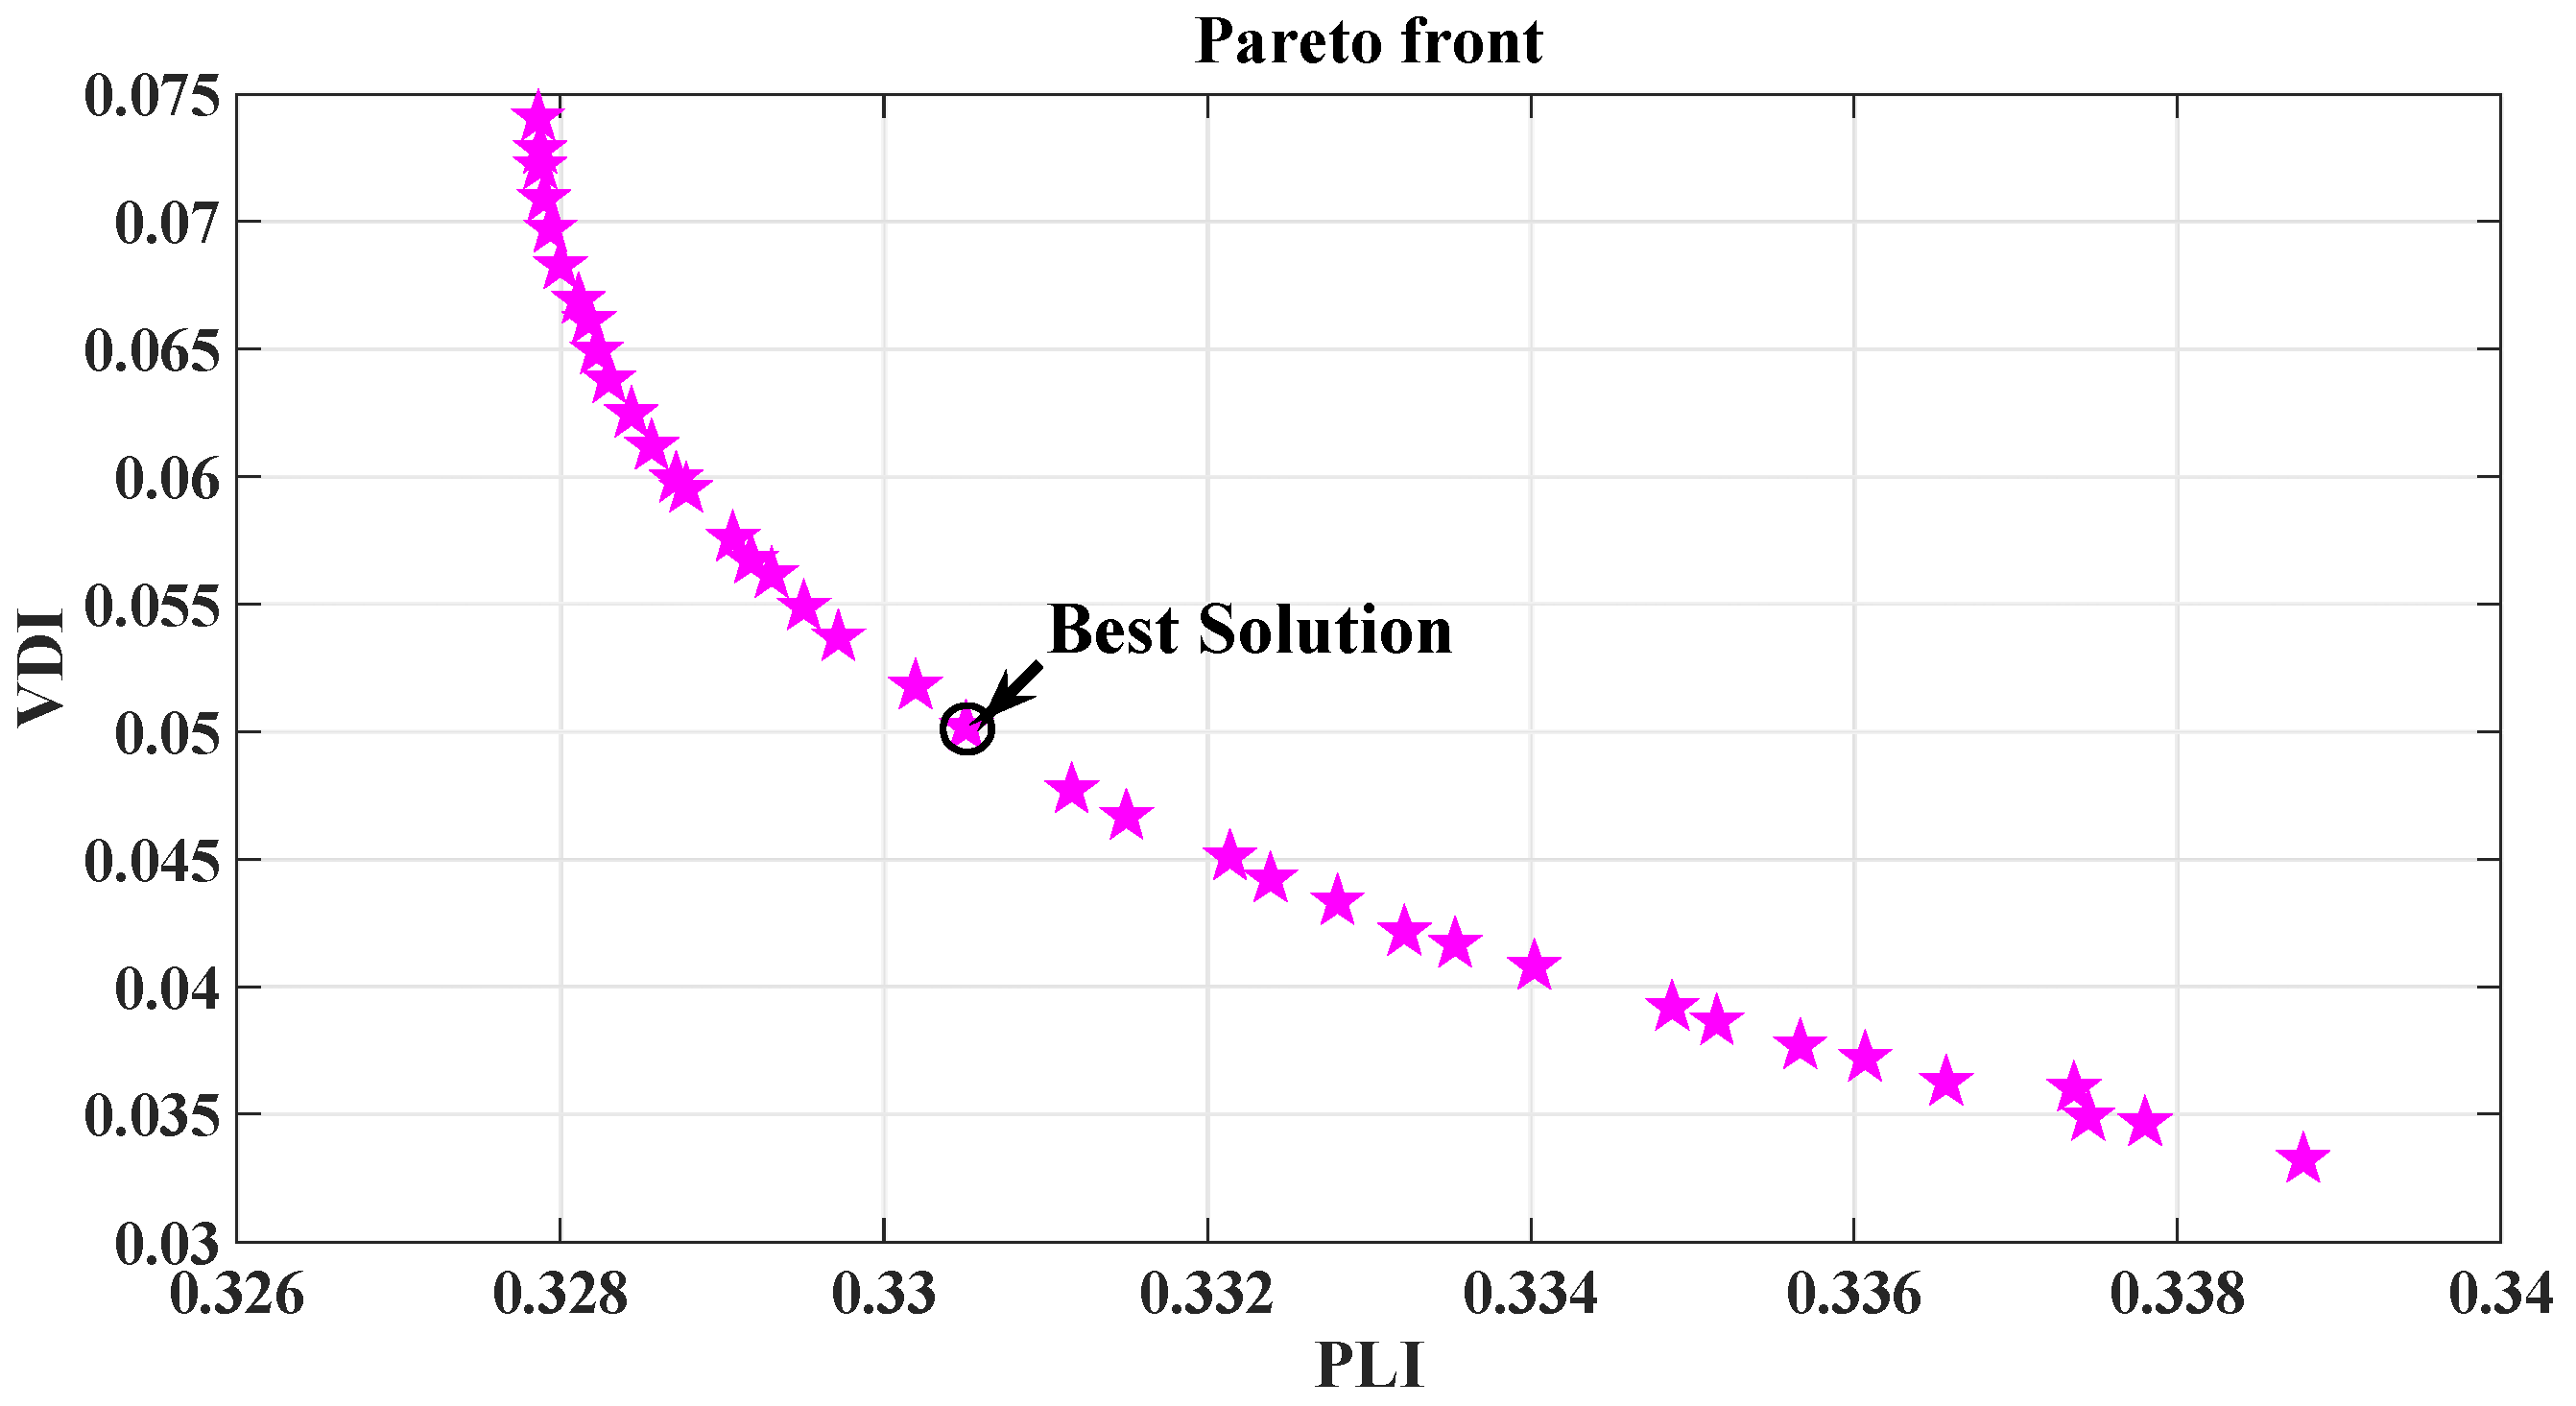
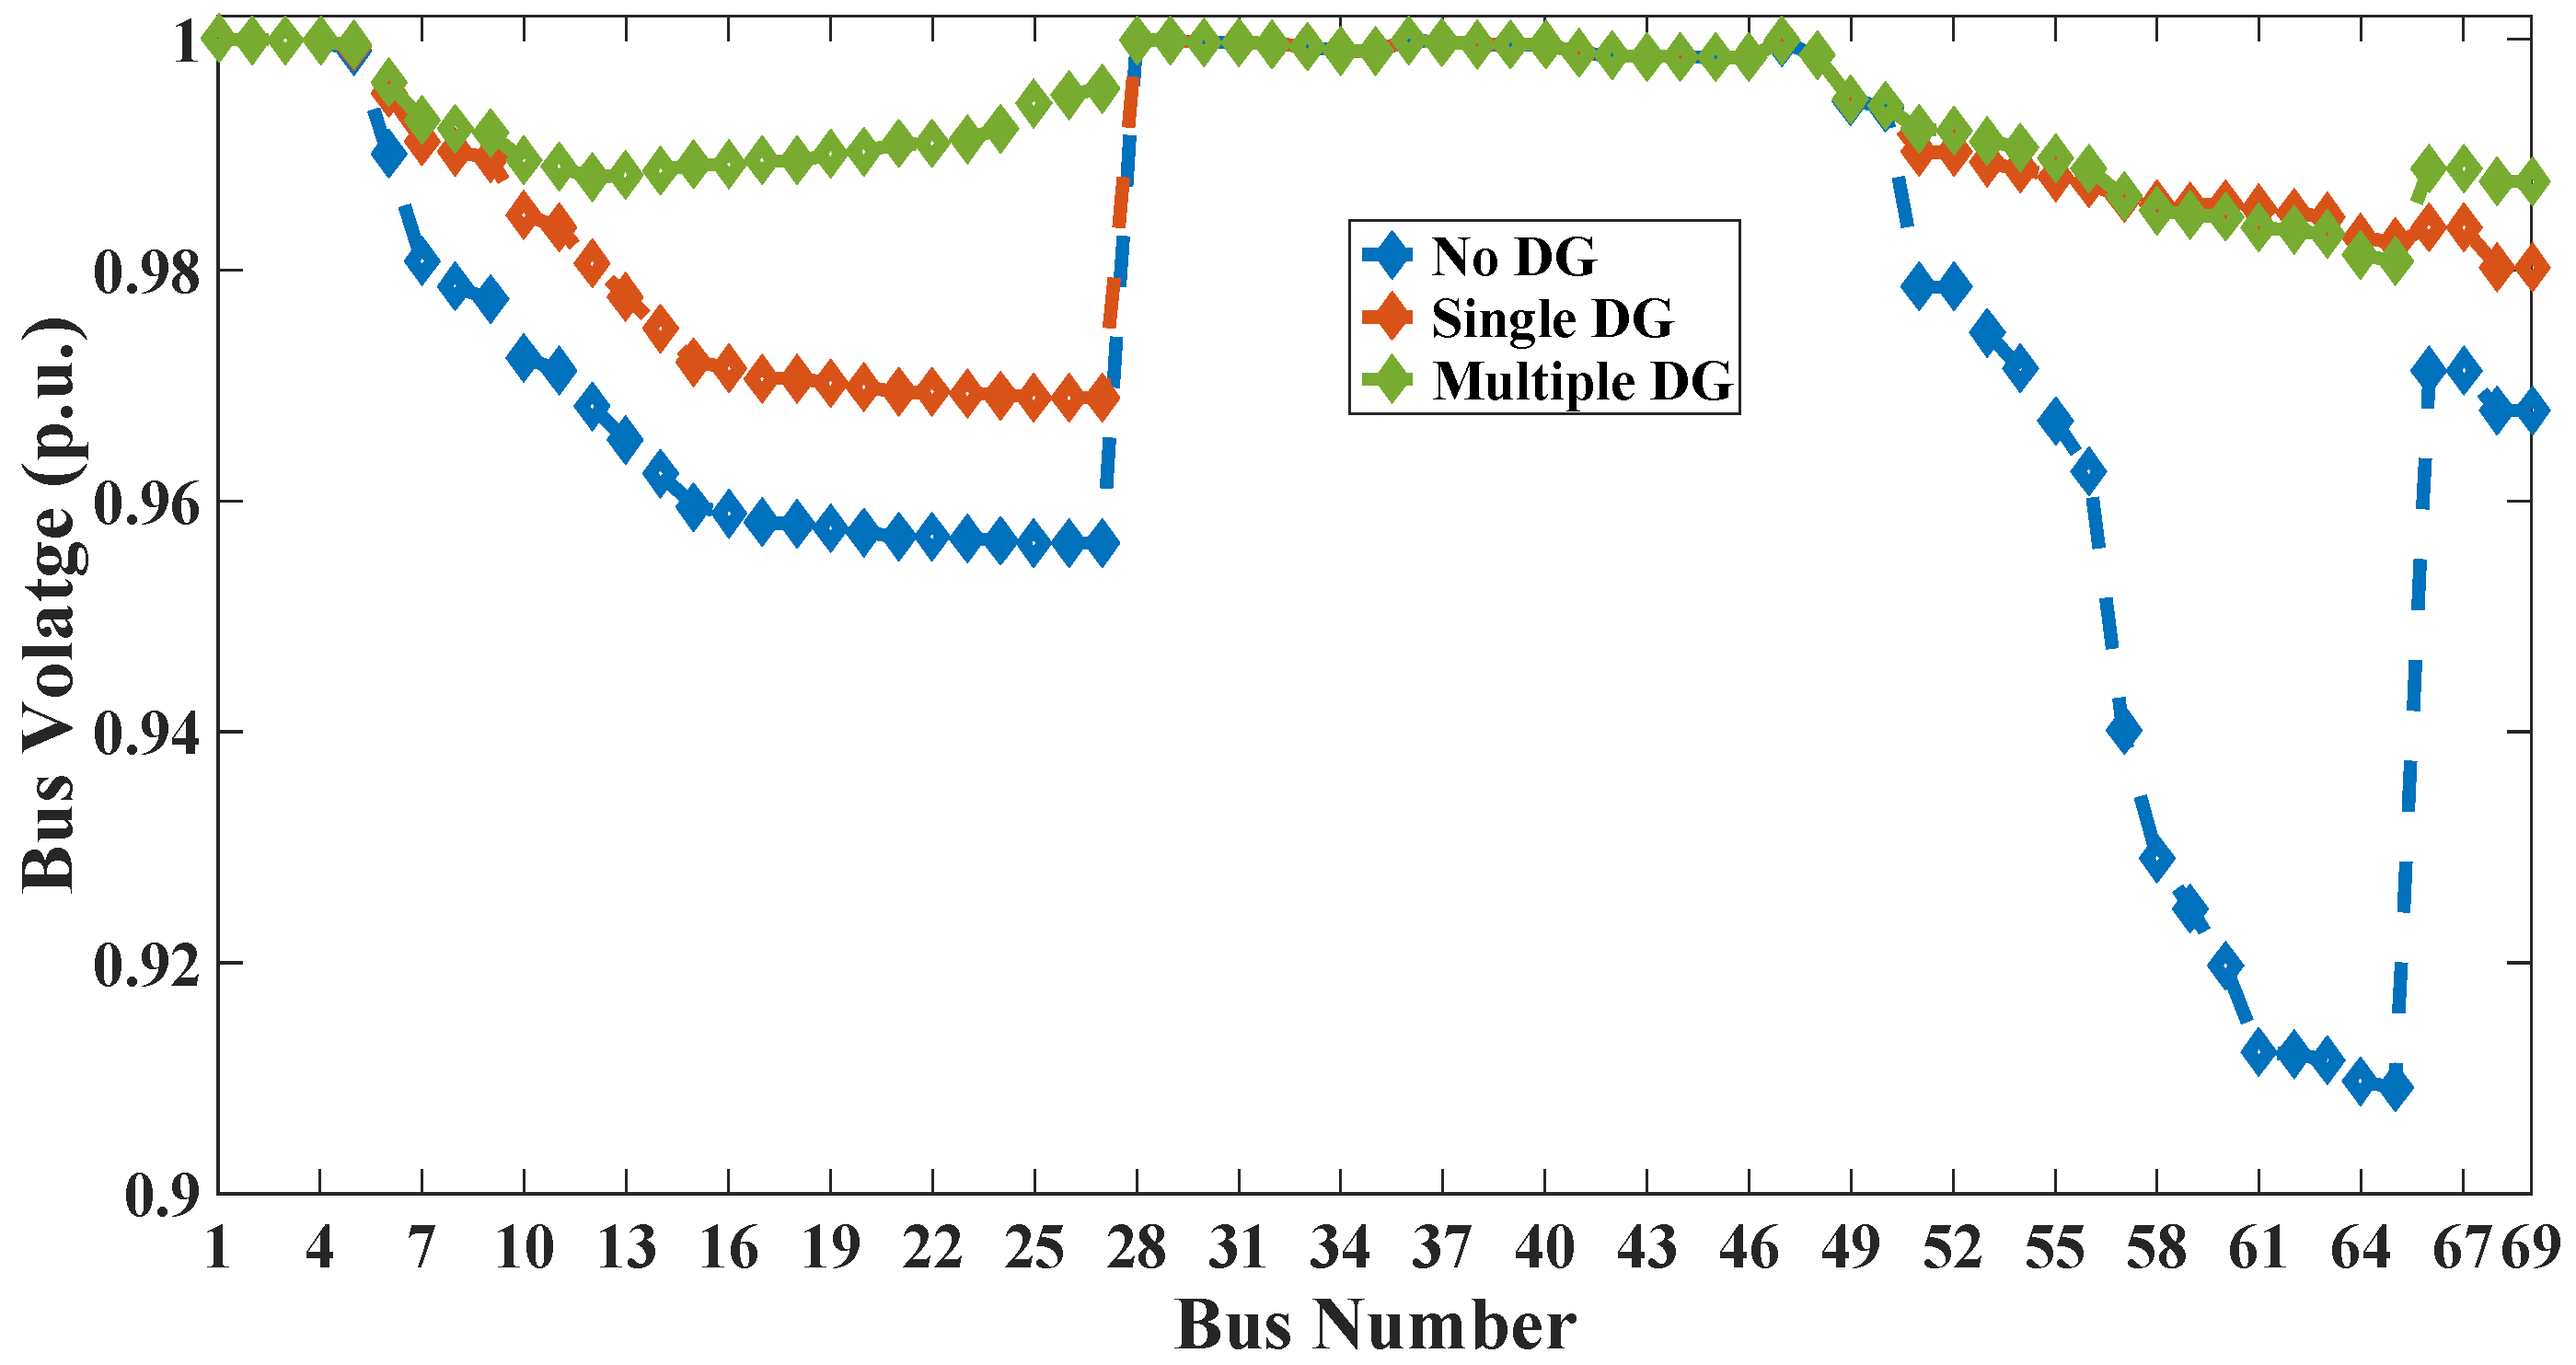
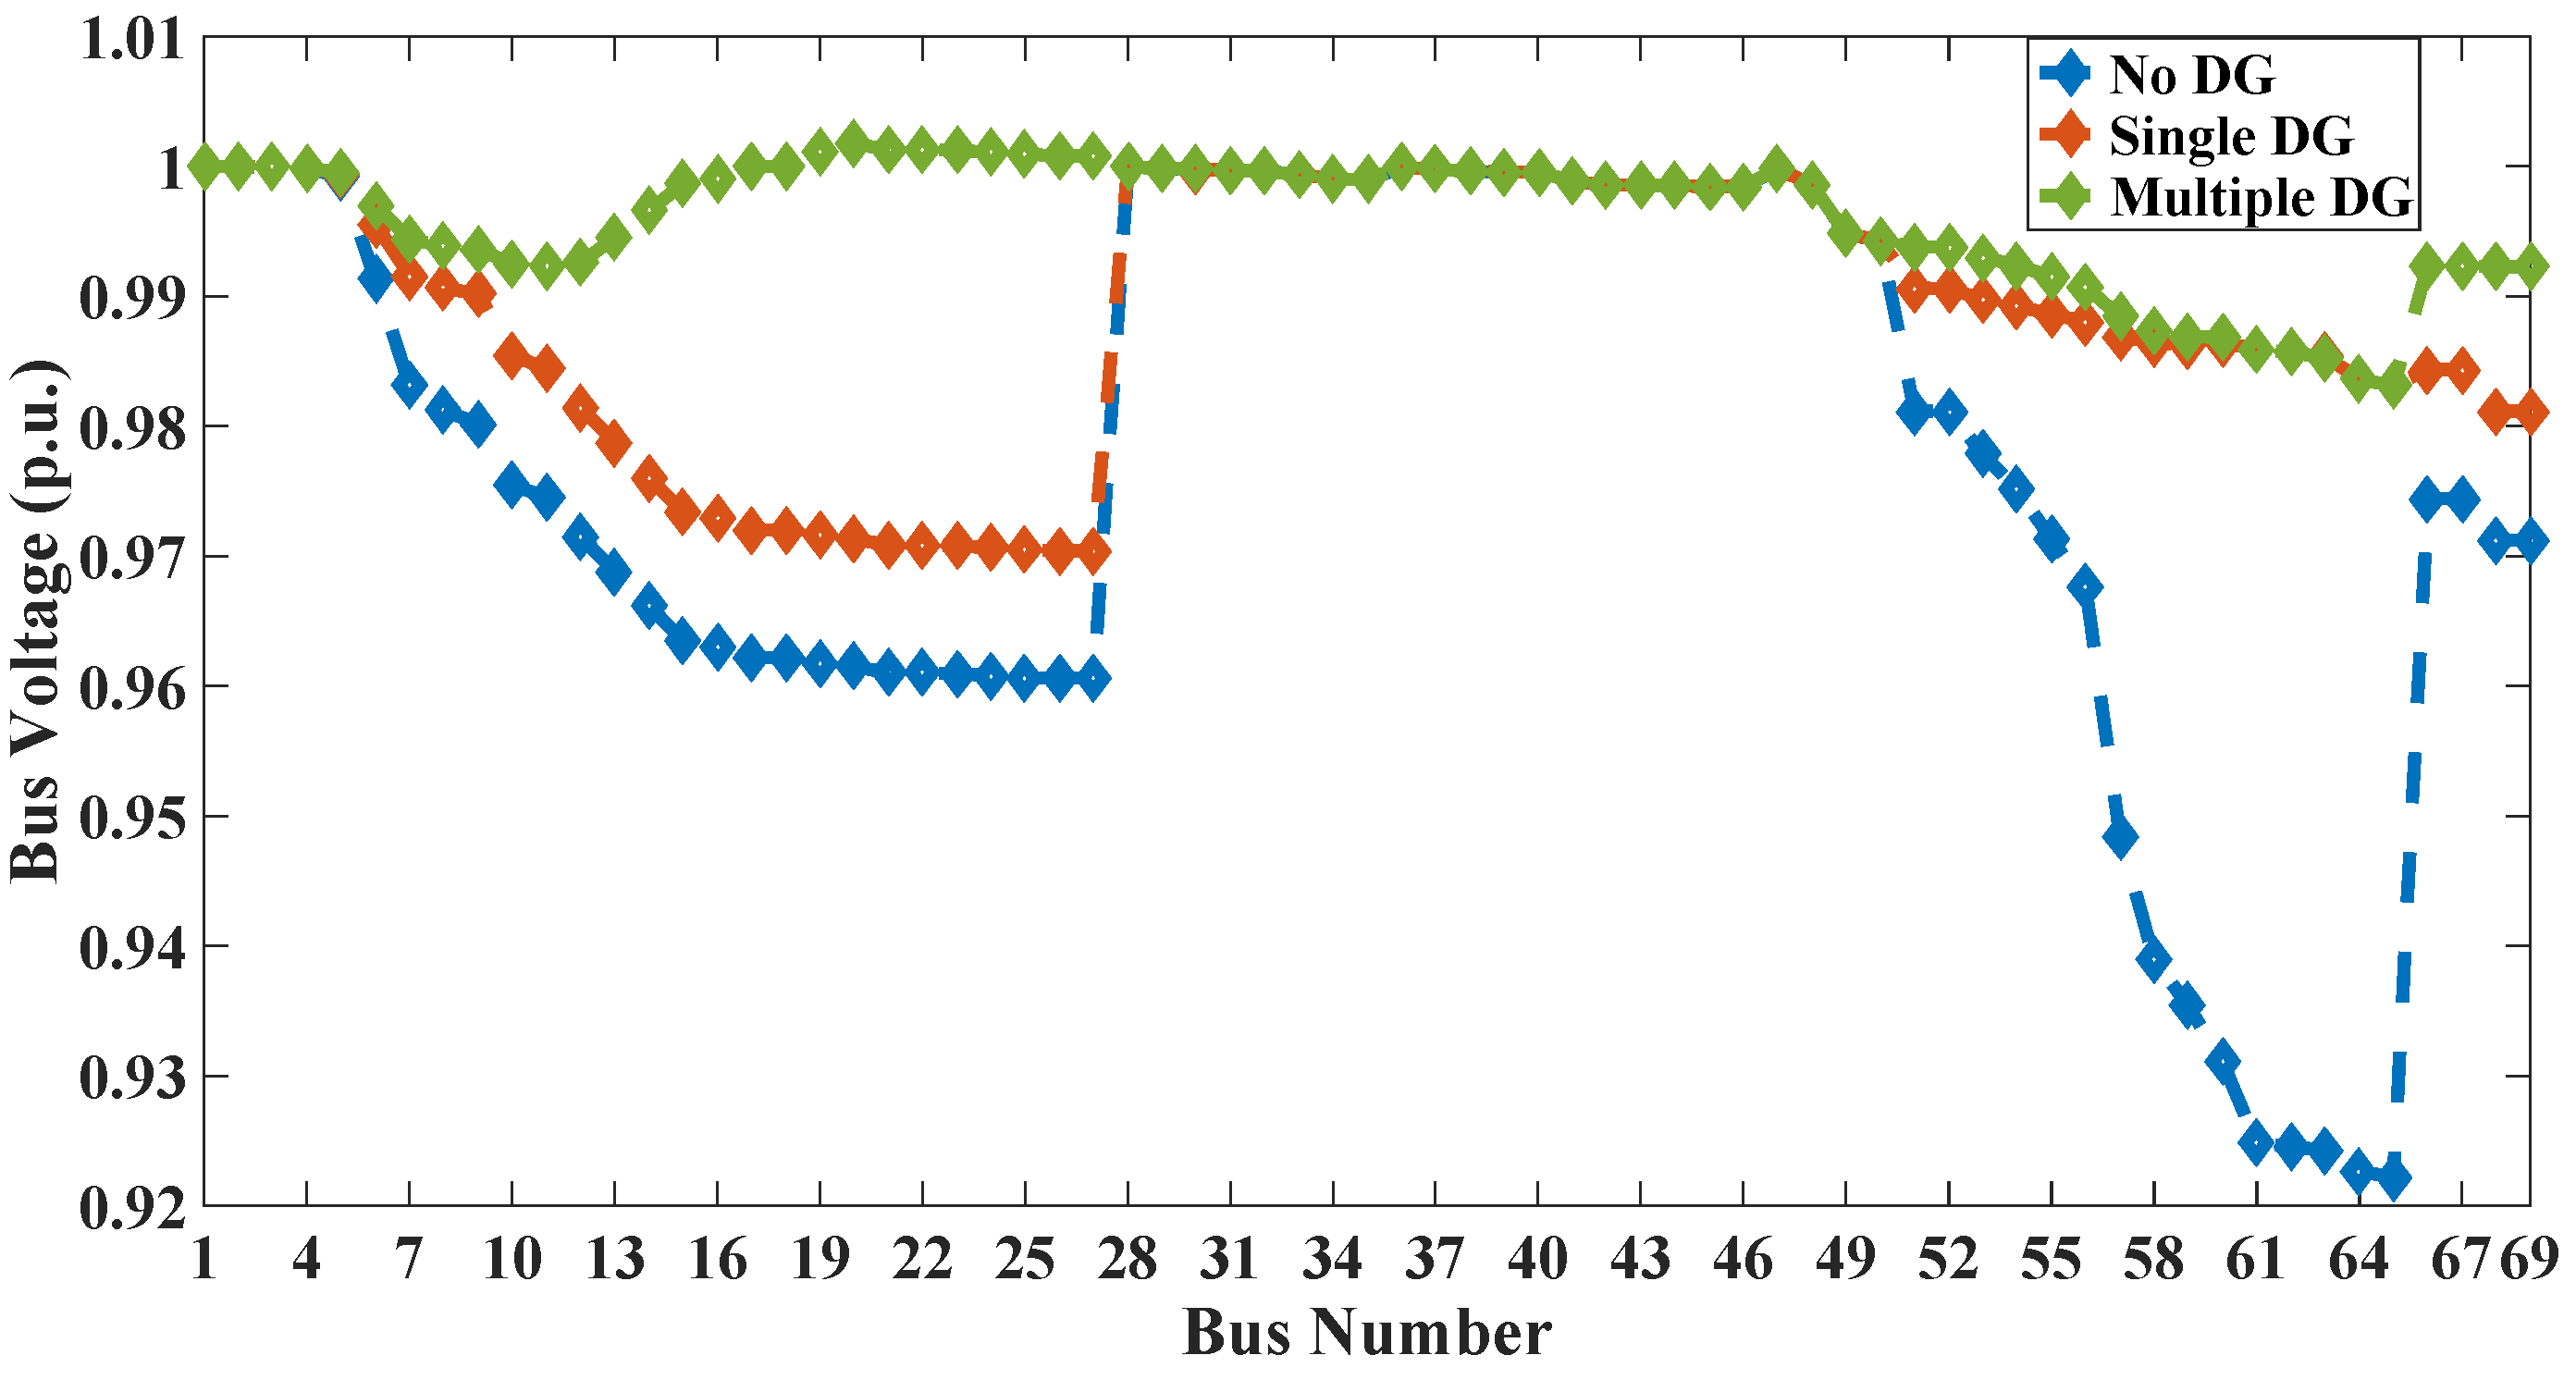
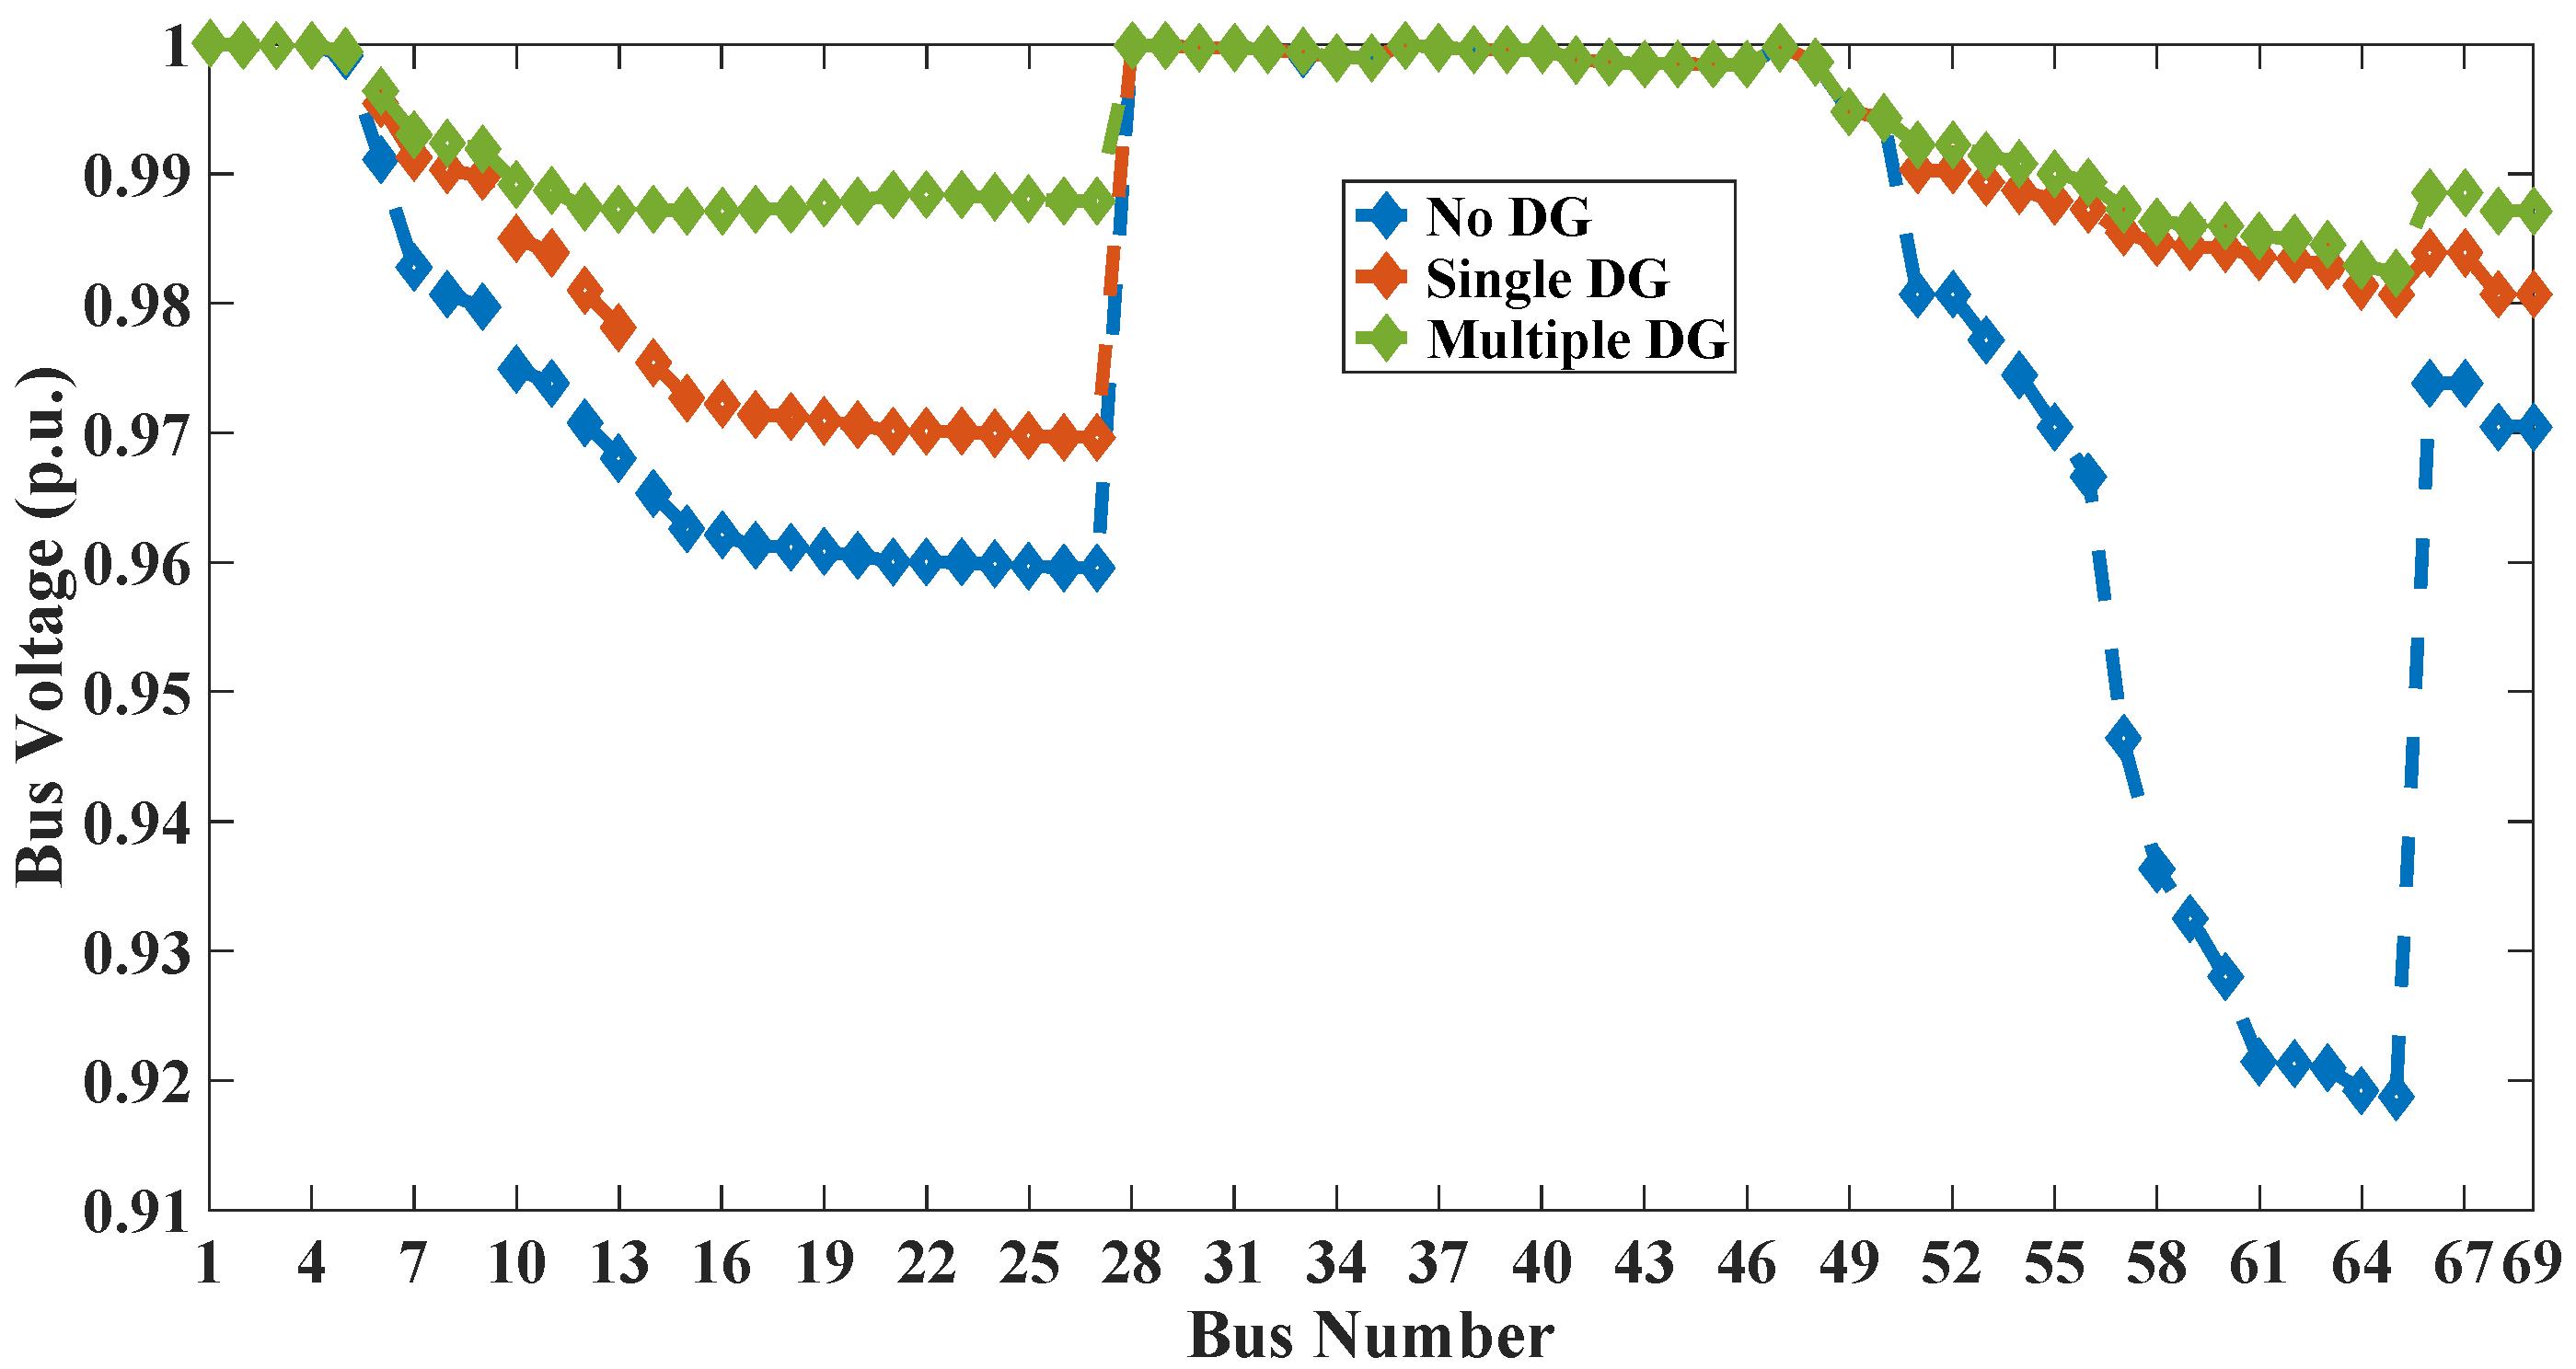
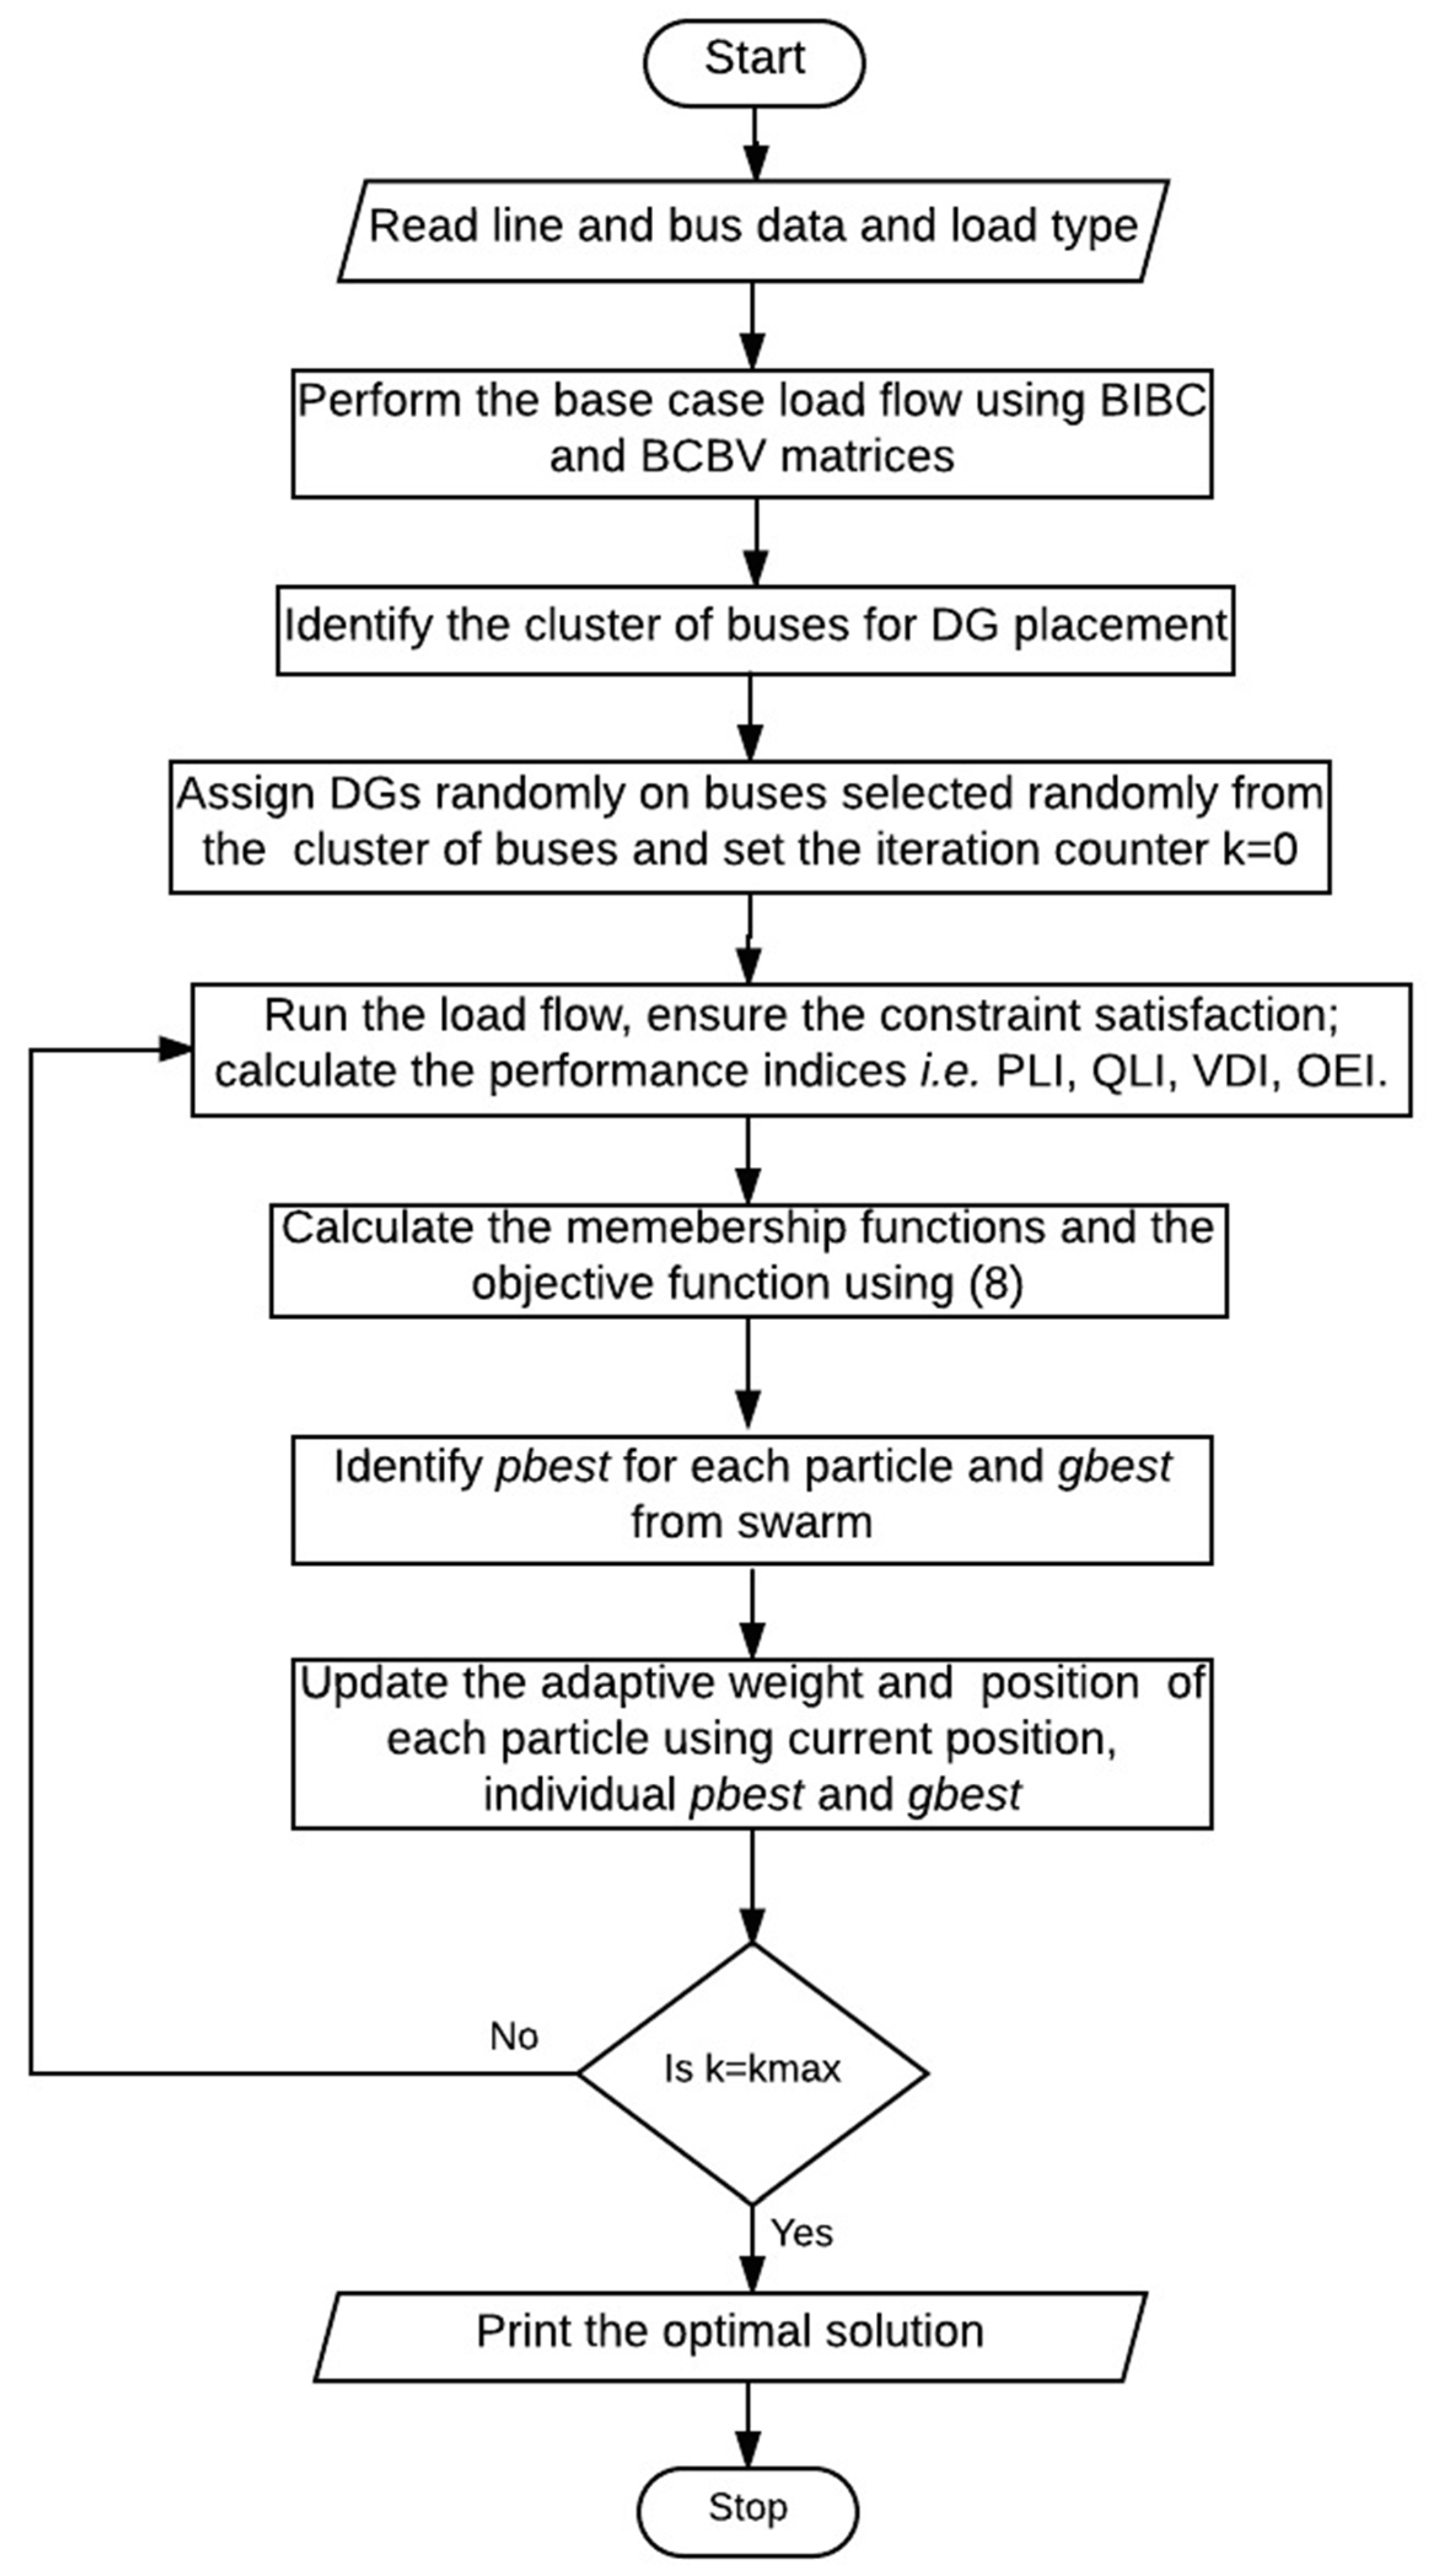
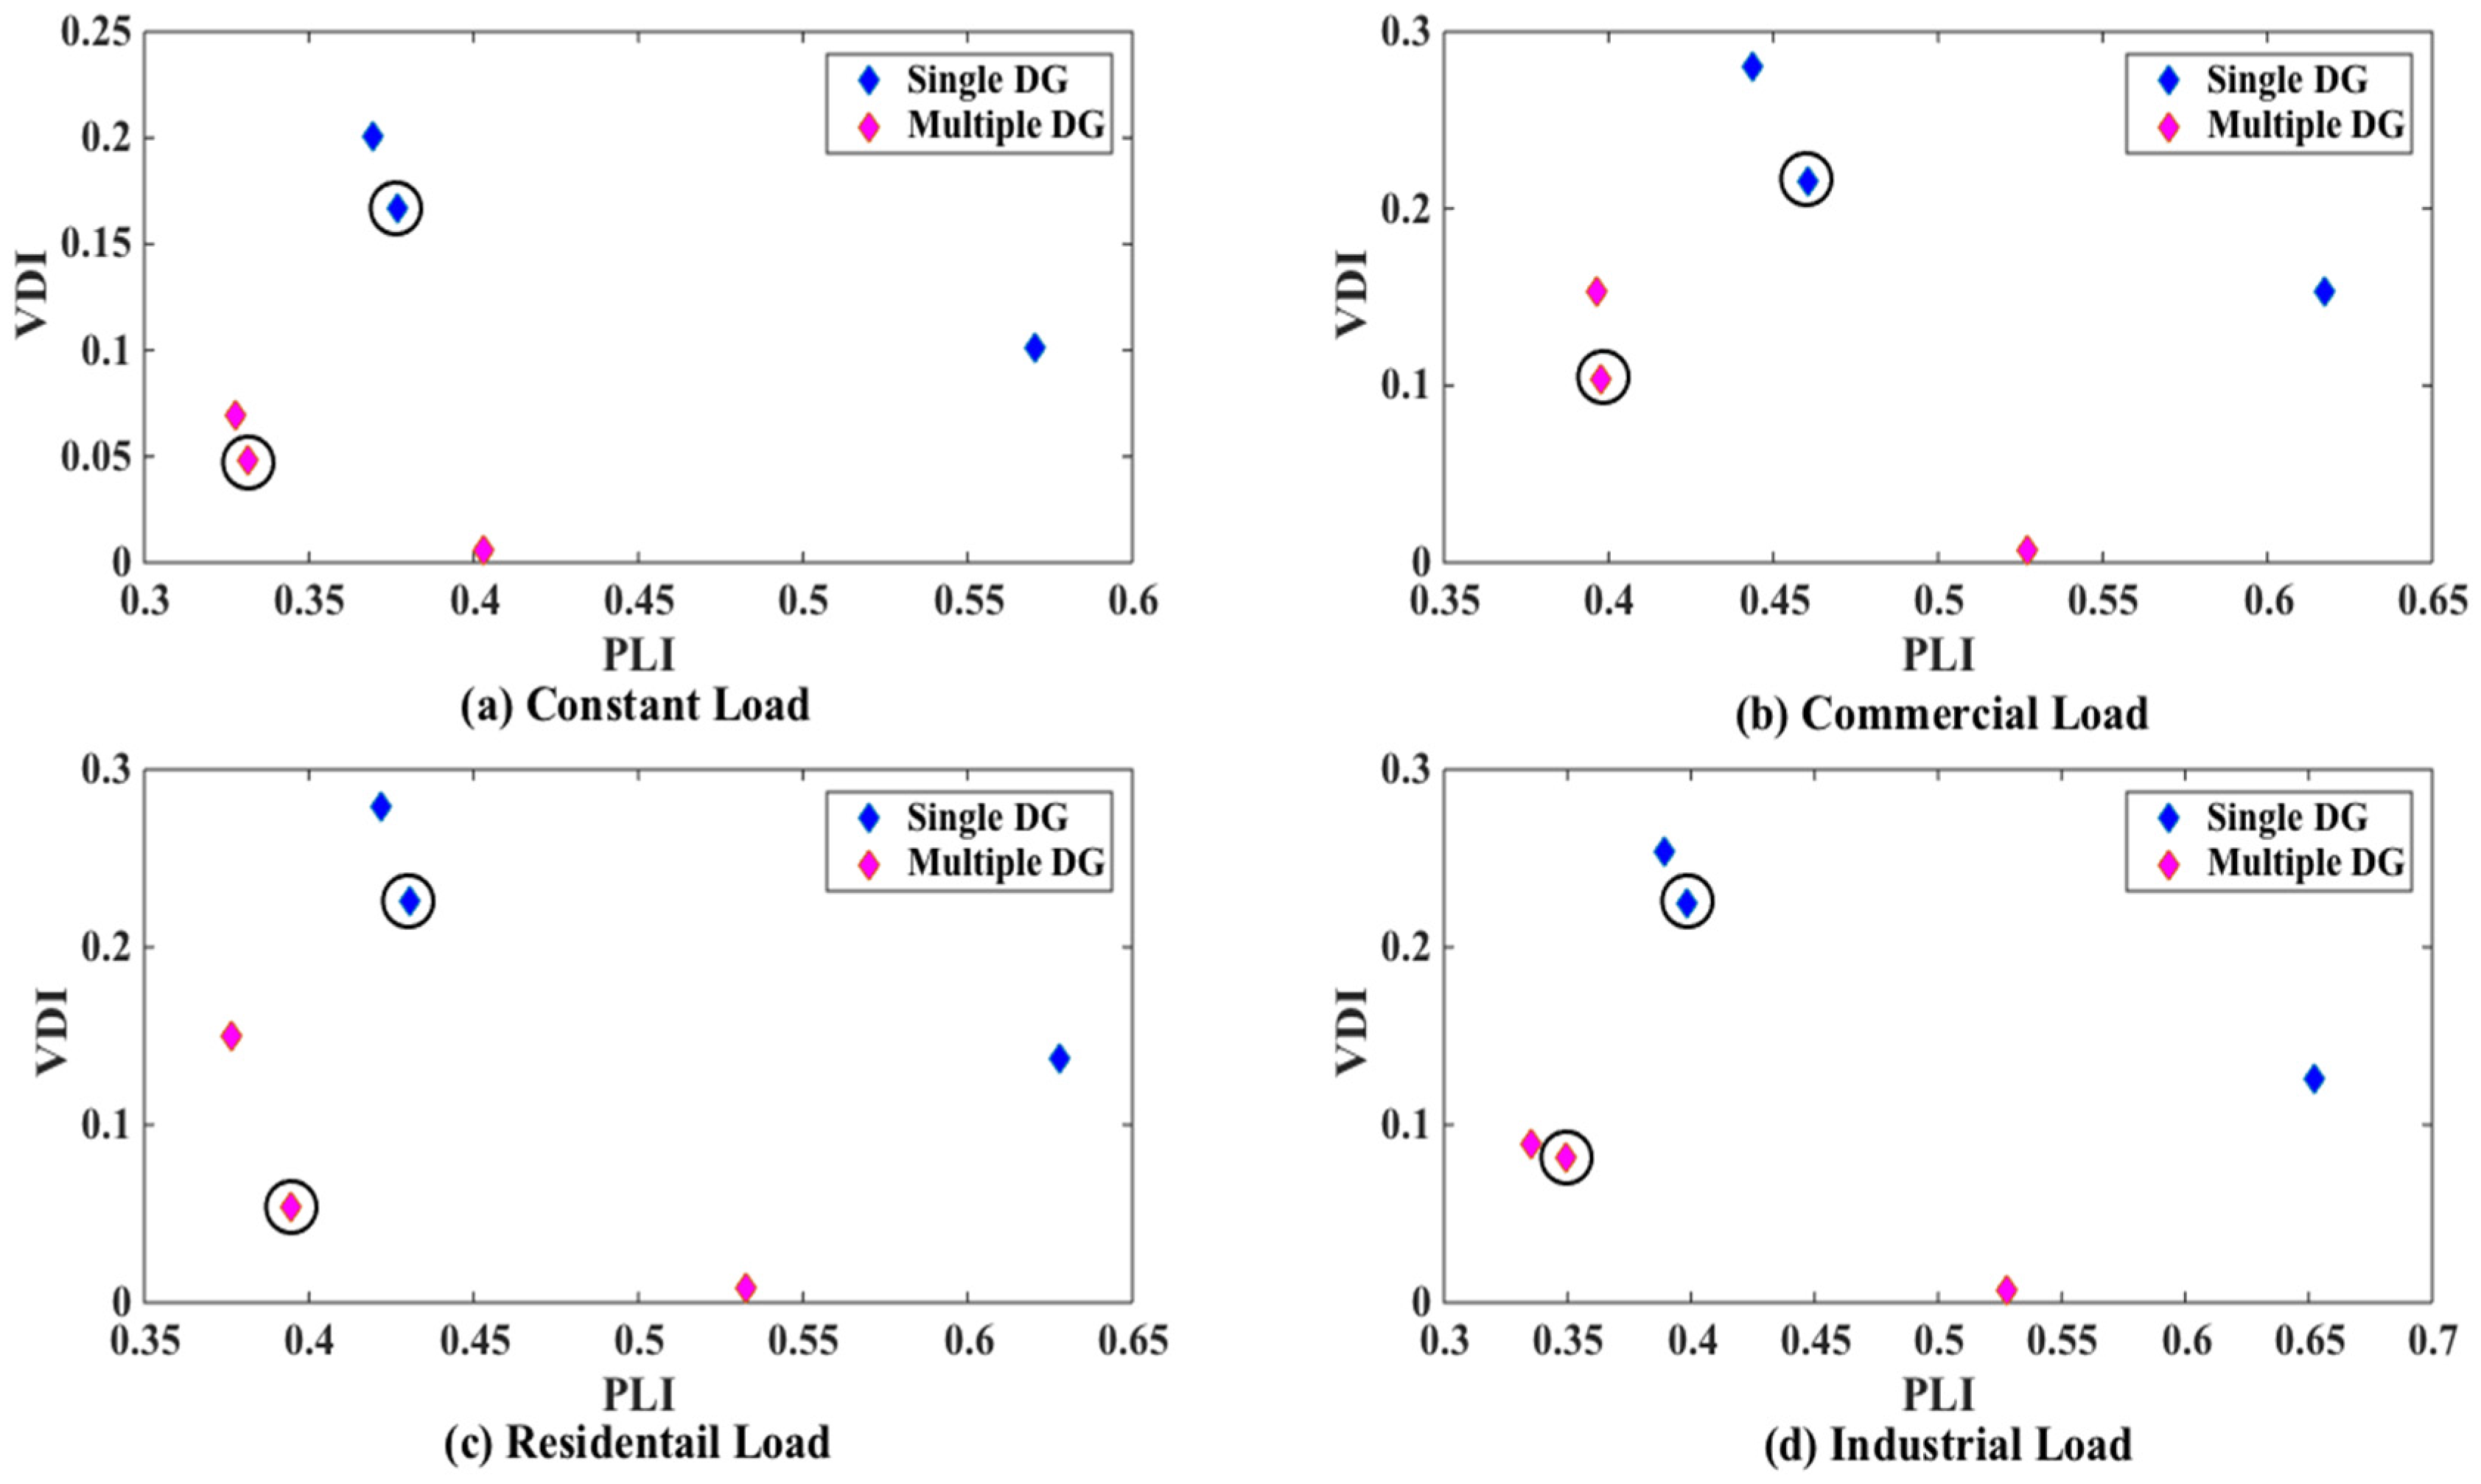
In this paper the four indices are selected for allocation of DG of optimal size at optimum location in radial distribution system (RDS). These indices are active power loss index (PLI), reactive power loss index (QLI), voltage deviation index (VDI) and overall economy index (OEI). The multi-objective optimization is implemented using fuzzy decision approach by assigning fuzzy memberships to these indices and optimizing the resultant membership. The optimal sizes and sites of DGs are obtained through PSO for voltage dependent residential, commercial and industrial loads. The optimization is carried out for placement of single as well as multiple DGs. The clustering of buses based on base case load flow is done to reduce the search space.

2. Objectives for DG Placement

The placement of DG in RDSs affects active power losses, reactive power losses and, voltage profile of buses. If DG of appropriate size is placed at optimum site then the losses will decrease and voltage profile of the buses gets improved. In the presented work four individual objectives are accounted simultaneously for the multi-objective formulation. Corresponding to these objectives, the values of indices before placement of DG is taken as unity and it is desired to reduce the value of these indices by placement of optimal sized DG at optimal site. These indices are formulated as:

2.1. Active Power Loss Index (PLI)

With the integration of DG in RDSs, active power losses are expected to reduce. The active power loss index (PLI) gives the effectiveness of DG integration on active power loss and is defined as:
P L I = P L D G P L
This objective attempts to minimize active power loss in distribution system by addition of DG.

2.2. Reactive Power Loss Index (QLI)

The reactive power loss also varies with integration of DG in RDSs. The effectiveness of DG integration on reactive power losses is given by QLI, which is defined as:
Q L I = Q L D G Q L
This objective minimizes reactive power loss in distribution system by addition of DG.

2.3. Voltage Deviation Index (VDI)

The voltage deviation (VD) is a measure of the deviation of bus voltages from reference bus. The effectiveness of improvement in voltage profile of buses after optimal placement of DG is measured by voltage deviation index (VDI). It is defined as:
V D I = V D D G V D
where V D D G and VD are measure of deviation in the bus voltage with respect to reference voltage after and before integration of DG respectively. These are defined as:
V D D G = i = 2 n ( V n o m V i D G V n o m ) 2
V D = i = 2 n ( V n o m V i V n o m ) 2

2.4. Overall Economy Index (OEI)

Economy is accompanying every activity in today’s competitive market. The overall economy index (OEI) is minimized so as to make DG operation economical. The OEI is expressed as:
O E I = C E D G C E
C E D G and CE are stated as:
C E D G = P L D G C P T + i = 1 n ( C P T ( P i D P i D G ) + C D G P i D G )
C E = P L C P T + i = 1 n ( C P T P i D )

3. Multi-Objective Planning for DG Placement

A general multi-objective problem can be formulated mathematically as:
min f ( X ) = { f 1 ( X ) , f 2 ( X ) , f 3 ( X ) , . f n ( X ) }
Subjected to
h ( X ) = 0
C ( X ) 0
Such that
X S
where X is solution vector, S is solution space, fi(X) is ith objective function, h(X) is equality constraint and C(X) is inequality constraint.
The objectives in the multi-objective optimization are usually conflicting. The objectives that are optimized simultaneously are expressed through indices namely PLI, QLI, VDI and OEI. Instead of using the true Pareto based optimization, the objectives are combined using the membership functions derived from the fuzzy decision approach. The fuzzy membership function values ( μ ) are computed for each objective and are defined as:
μ j = 0 ,   for   y j y 1 ;
μ j = ( y j y 1 ) ( y 2 y 1 ) ,   for   y 1 < y j < y 2 ;
μ j = 1 ,   for   y j y 2
where y j is the value of performance index.
In this presented work the values of y 2 and y 1 are considered as 1.25 and 0 respectively.
The multi-objective function (MOF) formulated by combining four objectives functions can be expressed as:
min   M O F = min { ( μ P L I × P L I ) + ( μ Q L I × Q L I ) + ( μ V D I × V D I ) + ( μ O E I × O E I ) }
where μ y is the fuzzy membership assigned to index y.
The objective function represented by Equation (8) is subjected to inequality constraints of bus voltage limits and MVA capacity of lines.

3.1. Bus Voltage Constraints

The incorporation of DGs in RDS boosts the voltage level of all buses, which may result in over-voltage at some buses. Moreover, there are always limits on lower level of voltage so the bus voltage constraints are defined as:
V i min V i V i max
The limits for V i min and V i max are taken as 0.90 and 1.05 p.u. [30].

3.2. MVA Capacity Constraints

The integration of DG in RDS changes the nature of RDS from passive to active and hence the current levels change. This constraint is necessary to ensure thermal limits of lines. MVA capacity constraint is expressed as:
S i j S i j max

3.3. Limiting Search Space

The search space for optimal allocation of DG is limited by making the clusters of buses. Bus voltages obtained after the load flow for the base case are used to decide these clusters. These clusters represent the group of buses having significant low voltage. The potential buses for the placement of DGs are selected from the cluster of buses, and thus limiting the search space. Such identified cluster of buses although reduces the search space but always yields optimal solution and thereby does not compromise on the quality of the optimal solution.

4. Voltage Dependent Loads

The effect of node voltage on connected load is accounted while evaluating the optimal site and size of DG for single as well as multi-objective optimization. The practical loads such as industrial, commercial, residential are prevalent in the RDS. These practical loads affect the bus voltage or bus voltages affect the power drawn by these loads. These loads are modeled as:
P i = P i 0 V i n p
Q i = Q i 0 V i n q
Here np and nq are the active and reactive power exponents. These exponents are considered as zero for constant load, which is conventionally, used in power flow studies. The value of these exponents for various types of loads is tabulated in Table 1 [18].

5. Algorithm for DGs Allocation

PSO is a population-based search and optimization technique in which individuals called particles change their position (state) with time. In PSO, particles move through the search space to keep itself in the best position pbest. The best position searched by the group particles gbest is assessable to each particle. The particles change their position with the help of their current positions, their pbest and gbest. The Figure 1 shows the flowchart for implementing the multi-objective DG allocation problem using PSO, where algorithm steps are described as follows:
Step 1
Read the distribution system line and bus data and the type of load.
Step 2
Carryout the base case load flow using Bus injection to branch current (BIBC) and branch current to bus voltage (BCBV) matrices [31].
Step 3
Calculate the indices i.e., PLI, QLI, VDI and OEI before placement of DG.
Step 4
Identify the cluster of buses for obtaining optimal site of DG.
Step 6
Initialize the particles positions that are random DGs at random buses in the search space and set the iteration counter k = 0.
Step 6
For these positions, calculate load flow and check for constraints satisfaction. Compute the performance indices and corresponding membership functions using Equation (7).
Step 7
Obtain the objective function from Equation (8).
Step 8
For the positions, assign them as individual best positions pbest. Also identify the best of the pbest as global best gbest.
Step 9
Update the particles positions by accounting their adaptive weight and current positions [1], pbest and gbest and increase iterations as k = k + 1.
Step 10
Go to Step 6 until the convergence is achieved.

6. Results

The methodology adopted for optimal allocation of DG in this presented work is tested on IEEE 69-bus RDS [32]. This system has total load of 3.800 MW and 2.690 MVAr and it is resulting into 225.005 kW active power losses and 102.173 kVAr reactive power losses. The algorithm is implemented under MATLAB (R2014b, MathWorks, Natick, MA, USA) in MAC environment. The presented algorithm has been executed while considering the swarm size as 50 for 50 iterations. For multi-objective optimization the optimal size and site of DG are found for the placement of single as well as multiple DGs. The DGs that are capable of supplying only active power, is considered for optimization.
The search space for obtaining optimal site of DG is obtained by forming the clusters of buses with significantly lower bus voltage from base-case load flow for all types of loads. The variation of bus voltage for base case is shown in Figure 2. Two clusters of buses with minimum voltage are selected to obtain the optimal site of DG. First cluster of buses consists of buses from 57 to 65 and second cluster of buses ranges from bus 16 to 28.

6.1. DG Placement Using Single Objective Optimization

Optimal size and site of DG are found when all four indices are considered independently for placement of single as well as multiple DGs. For placement of single DG, only first cluster of buses is considered while for placement of two DGs, one DG is selected from each of the respective cluster. The four cases that are investigated for DG placement through single objective optimization are: Minimizing PLI, Minimizing QLI, Minimizing VDI and Optimizing OEI.

6.1.1. Minimizing PLI

With PLI as objective, the optimal size and site of DG and corresponding indices after optimal allocation of DG for all types of loads are presented in Table 2. The value of PLI is 1.0 before placement of DG in RDS. Its value reduces significantly after integration of optimal sized DG at optimal site due to reduction in active power loss. For constant load the improvement is maximum, where its value reduces to 0.3696 and 0.3280 corresponding to placement of single and multiple DGs respectively. The values of all other indices also reduce after placement of DG.

6.1.2. Minimizing QLI

With QLI minimization, the resulted optimal DG size, site and corresponding values of indices are presented in Table 3 for placement of single as well as multiple DGs. In addition to reduction in QLI all other indices also reduces i.e., performance is improved. The reduction in QLI is almost same for both objectives PLI and QLI as both are dependent on current.

6.1.3. Minimizing VDI

The deviation in bus voltages in RDS is an important factor, which can be improved by integration of DG. The optimal size, site of DG and performance indices are summarized in Table 4 corresponding to minimization of VDI for placement of single as well as multiple DGs. The size of DG for VDI optimization is higher in comparison to the sizes of DGs obtained for optimizing PLI and QLI independently. The improvement in VDI results in improvement of voltage of all buses in RDS. The placement of multiple DGs is found more effective as the reduction in VDI is more as compared to single DG placement.

6.1.4. Optimizing OEI

The optimization of overall economy index OEI is very important objective as economy is major decision factor. For OEI formulation, the cost of power supplied by DG is taken as 46 US$/MWh and power tariff is taken as 44.5 US$/MWh [18]. Corresponding to the optimization of OEI, the optimal placement and values of the indices are summarized in Table 5. The reduced value of OEI results in economic operation of DG. It is observed that placement of multiple DGs is more economical as compared to single DG. The obtained OEI for placement of two DG is always lower than its value for single DG. The reduction in OEI follows the pattern of PLI, as OEI is dependent on active power losses given by Equation (5).
The size of DG is higher for constant load model among four types of loads for every objective and hence the reduction in all objectives is also maximum for constant load model.

6.2. DG Placement Using Multi-Objective Optimization

The placement of DG using multi-objective optimization is discussed for two cases. In first case PLI and VDI are considered simultaneously and in second case all the four objectives (PLI, QLI, VDI and OEI) are considered simultaneously.

6.2.1. Validation of Proposed Technique

The results obtained from proposed PSO based technique are compared with multi-objective GA for validation. The comparison of DG size, site and performance indices obtained by proposed technique with GA for single objective as well as multi-objective case is presented in Table 6. In addition to multi-objective case the comparison of two techniques is also done for single objective case. The constant load model is considered for comparison and is equally applicable to other load models.
The optimal sizes of DG for the placement of single as well as multiple DGs obtained by both techniques are comparable. In implementation of GA true Pareto front is obtained while in PSO fuzzy memberships are assigned that yields in fast convergence. The true Pareto front for the placement of single DG as well as multiple DGs is shown in Figure 3 and Figure 4 respectively.

6.2.2. Case I Optimizing both PLI and VDI Simultaneously

The placement of single as well as multiple DGs has been investigated by considering PLI and VDI simultaneously by assigning fuzzy membership function to each performance index. For all types of voltage dependent loads optimal size, site and corresponding value of each index after placement of DGs are summarized in Table 7.
These results are compared to the single objective optimization results presented in Table 2 and Table 4, which summarize the results corresponding to minimization of PLI and minimization of VDI respectively. From Table 2 and Table 4, it is clear that the value of PLI is minimum, while VDI is maximum when only PLI is the objective, whereas VDI is minimum and PLI is maximum when only VDI is the objective for all types of loads.
The results of multi-objective optimization, while compared with single objective optimization, PLI and VDI forms the non-dominated set of solutions. The variation of PLI with variation in VDI for placement of single as well as multiple DGs is shown in Figure 5a–d for different types of load models. From the Pareto front, a set of optimal solutions obtained by multi-objective optimization, the best compromised solution is obtained. The compromised solutions are marked as encircled solutions while; the extreme solutions are for individual objectives. As the optimal solution set corresponding to the multiple DG placement is more dominant i.e. near to the origin, which suggests that the placement of multiple DGs is more beneficial and multiple DG placement reduces values of indices as compared to single DG placement.

6.2.3. Case-II Optimizing All Indices Simultaneously

In second case of multi-objective optimization based placement of DG, all four indices PLI, QLI, VDI and OEI are combined by assigning fuzzy membership to each index. The optimal size and site of DG and all indices are tabulated in Table 8. It is observed from results that type of load is affecting DG size and site significantly.
The placement of multiple DGs is more advantageous as compared to single DG placement and it results in reduced values of indices. The reduced values of PLI and QLI show reduction in active and reactive power losses respectively and reduced values of VDI show improvement in voltage profile of all buses. The reduction in OEI means that integration of DG in distribution system is economical as it reduces the losses and cost of DG is being overcome by reduction in losses.

6.3. Bus Voltage after DG Placement

The placement of DGs of optimal size at optimal site improves the voltage of all buses of the RDS. The variation of voltage of each bus after and before placement of optimal sized DG at optimal site for multi-objective optimization after considering all indices is shown in Figure 6, Figure 7, Figure 8 and Figure 9 for four different types of loads. The plot of voltage indicates that the improvement in bus voltage is better with placement of multiple DGs as compared to single DG. Also the voltage of all buses is within the limits of voltage constraints for all types of load after placement of single as well as multiple DG.
The effect of selection of DG on voltage profile of all buses is shown in Figure 10 for constant load model. Significant improvement in voltage of all buses is achieved after optimal integration of DG corresponding to all individual objectives and two cases of multi-objective optimization but it is maximum for placement of multiple DGs corresponding to objective VDI.

6.4. Comparative Results

The proposed technique is validated by comparing with well-known multi-objective GA as presented in Table 6. Further the obtained results are compared with the available results in literature for placement of single as well as multiple DGs. The comparative analysis is presented in Table 9.

7. Discussion

The optimal placement of single as well as multiple DGs has been investigated for voltage sensitive loads through the optimization of objectives represented through indices PLI, QLI, VDI and OEI. The single and multi-objective optimization has been investigated for the placement of single DG and placement of multiple DGs. As summarized in Section 6.1 through Table 2, Table 3, Table 4 and Table 5, the values of PLI, QLI, VDI and OEI through single objective optimization are higher for single DG placement then the respective values obtained with the placement of two DGs. This suggests that the placement of two DGs is yielding better optimization. The comparative results have been included in Table 9, where the results of proposed method have been compared with published results obtained through various heuristics PSO [1], GA [3], ABC [4], and Analytical methods [6,8,9] for minimizing losses. The proposed method is giving better performance. The multi-objective optimization, as summarized in Section 6.2 through Table 7 and Table 8, yields the lower values of indices with two DG placement in comparison to single DG placement. The Pareto-front as shown in Figure 5 is closer to origin for two DG. This suggests that two DG placement is yielding better optimization compared to single DG placement. With multiple DGs of optimum size, the compensation is affected at multiple locations and thereby the load burden is not getting reflected up to substation. Such multiple DG placement thereby resulting into reduced losses, improved bus voltage profile. The ideal numbers of DG placement is an area of research and beyond the scope of presented manuscript.

8. Conclusions

In this paper a fuzzy decision based multi-objective optimization approach is presented to decide the optimal placement of single and multiple DGs. The optimization problem is solved by PSO to yield optimal solution. The search space for selection of optimal sites for DG placement is reduced by forming the cluster of buses. The proposed approach is implemented on 69-bus RDS for different voltage sensitive residential, commercial and industrial loads. It is observed that the load types significantly affects the sites and sizes of DGs. The significant improvement in the voltage profile is observed at all buses after integration of DG of optimal size at optimal site. Moreover, the placement of multiple DGs is found to be more effective in improving the system performance as compared to placement of single DG. Two DGs are sufficient to improve the overall performance for both single and multi-objective optimization for different loads.

Author Contributions

Navdeep Kaur has done this work and prepared the manuscript under supervision of Sanjay Kumar Jain.

Conflicts of Interest

The authors declare no conflict of interest.

Nomenclature

CE and C E D G Cost of losses and energy purchased before and after integration of DG respectively
C P T Power tariff
C D G Cost of power supplied by DG
nNumber of buses
P i D G Power supplied by ith DG
P i D Load demand at ith bus
P i and Q i Active and reactive power at ith bus
P i 0 and Q i 0 Actual active are reactive power at ith bus
P L and P L D G Active power loss before and after integration of DG respectively
Q L and Q L D G Reactive power loss before and after integration of DG respectively
S i j and S i j max MVA flow in line between bus i and j and maximum limit of S i j
VD and V D D G Deviation in the bus voltage before and after integration of DG respectively
V i and V i D G Voltage of ith bus before and after placement of DG respectively
V i min Minimum level of the voltage of ith bus
V i max Maximum level of the voltage of ith bus
V n o m Nominal voltage ( V n o m = 1 p.u.)

References

  1. Kansal, S.; Kumar, V.; Tyagi, B. Optimal Placement of Different Type of DG Sources in Distribution Networks. Int. J. Electr. Power Energy Syst. 2013, 53, 752–760. [Google Scholar] [CrossRef]
  2. Kumawat, M.; Gupta, N.; Jain, N.; Bansal, R.C. Swarm-Intelligence-Based Optimal Planning of Distributed Generators in Distribution Network for Minimizing Energy Loss. Electr. Power Compon. Syst. 2017, 45, 589–600. [Google Scholar] [CrossRef]
  3. Shukla, T.N.; Singh, S.P.; Srinivasarao, V.; Naik, K.B. Optimal Sizing of Distributed Generation Placed on Radial Distribution Systems. Electr. Power Compon. Syst. 2010, 38, 260–274. [Google Scholar] [CrossRef]
  4. Abu-Mouti, F.S.; El-Hawary, M.E. Optimal Distributed Generation Allocation and Sizing in Distribution Systems via Artificial Bee Colony Algorithm. IEEE Trans. Power Deliv. 2011, 26, 2090–2101. [Google Scholar] [CrossRef]
  5. Kanwar, N.; Gupta, N.; Niazi, K.R.; Swarnkar, A. Optimal Distributed Generation Allocation in Radial Distribution Systems Considering Customer-wise Dedicated Feeders and Load Patterns. J. Mod. Power Syst. Clean Energy 2015, 3, 475–484. [Google Scholar] [CrossRef]
  6. Acharya, N.; Mahat, P.; Mithulananthan, N. An Analytical Approach for DG Allocation in Primary Distribution Network. Int. J. Electr. Power Energy Syst. 2006, 28, 669–678. [Google Scholar] [CrossRef]
  7. Hung, D.Q.; Mithulananthan, N.; Bansal, R.C. Analytical Expressions for DG Allocation in Primary Distribution Networks. IEEE Trans. Energy Convers. 2010, 25, 814–820. [Google Scholar] [CrossRef]
  8. Gözel, T.; Hocaoglu, M.H. An Analytical Method for the Sizing and Siting of Distributed Generators in Radial Systems. Electr. Power Syst. Res. 2009, 79, 912–918. [Google Scholar] [CrossRef]
  9. Kaur, N.; Jain, S.K. Analytical Approach for Optimal Allocation of Distributed Generators to Minimize Losses. J. Electr. Eng. Technol. 2016, 11, 1582–1589. [Google Scholar] [CrossRef]
  10. Vita, V. Development of a Decision-Making Algorithm for the Optimum Size and Placement of Distributed Generation Units in Distribution Networks. Energies 2017, 10, 1433. [Google Scholar] [CrossRef]
  11. Singh, D.; Singh, D.; Verma, K.S. Multiobjective Optimization for DG Planning with Load Models. IEEE Trans. Power Syst. 2009, 24, 427–436. [Google Scholar] [CrossRef]
  12. El-Zonkoly, A.M. Optimal Placement of Multi-distributed Generation Units Including Different Load Models Using Particle Swarm Optimization. Swarm Evol. Comput. 2011, 1, 50–59. [Google Scholar] [CrossRef]
  13. Sutthibun, T.; Bhasaputra, P. Multi-objective Optimal Distributed Generation Placement Using Simulated Annealing. In Proceedings of the 2010 International Conference on Electrical Engineering/Electronics Computer Telecommunications and Information Technology (ECTI-CON), Chiang Mai, Thailand, 19–21 May 2010; pp. 810–813. [Google Scholar]
  14. Kayal, P.; Chanda, C.K. Placement of Wind and Solar Based DGs in Distribution System for Power Loss minimization and voltage stability improvement. Int. J. Electr. Power Energy Syst. 2013, 53, 795–809. [Google Scholar] [CrossRef]
  15. Abdelaziz, A.Y.; Hegazy, Y.G.; El-Khattam, W.; Othman, M.M. A Multi-objective Optimization for Sizing and Placement of Voltage-controlled Distributed Generation Using Supervised Big Bang–Big Crunch Method. Electr. Power Compon. Syst. 2015, 43, 105–117. [Google Scholar] [CrossRef]
  16. Carpinelli, G.; Celli, G.; Mocci, S.; Pilo, F.; Russo, A. Optimisation of Embedded Generation Sizing and Siting by Using A Double Trade-off Method. IEE Proc. Gener. Transm. Distrib. 2005, 152, 503–513. [Google Scholar] [CrossRef]
  17. Celli, G.; Ghiani, E.; Mocci, S.; Pilo, F. A Multiobjective Evolutionary Algorithm for the Sizing and Siting of Distributed Generation. IEEE Trans. Power Syst. 2005, 20, 750–757. [Google Scholar] [CrossRef]
  18. Singh, R.K.; Goswami, S.K. Multi-objective Optimization of Distributed Generation Planning Using Impact Indices and Trade-off Technique. Electr. Power Components Syst. 2011, 39, 1175–1190. [Google Scholar] [CrossRef]
  19. Moeini, A.; Yassami, H.; Owlady, M.; Sadeghi, M.H. Disco Planner Flexible DG Allocation in MV Distribution Networks Using Multi-objective Optimization Procedures. In Proceedings of the 12th International Conference on Optimisation of Electrical and Electronic Equipment (OPTIM), Brasov, Romania, 20–22 May 2010; pp. 240–245. [Google Scholar]
  20. Yammani, C.; Maheswarapu, S.; Matam, S. Multiobjective Optimization for Optimal Placement and Size of DG Using Shuffled Frog Leaping Algorithm. Energy Procedia 2012, 14, 990–995. [Google Scholar] [CrossRef]
  21. Buayai, K. Optimal Multi-type DGs Placement in Primary Distribution System by NSGA-II. Res. J. Appl. Sci. Eng. Technol. 2012, 4, 3610–3617. [Google Scholar]
  22. Vinothkumar, K.; Selvan, M.P. Fuzzy Embedded Genetic Algorithm Method for Distributed Generation Planning. Electr. Power Compon. Syst. 2011, 39, 346–366. [Google Scholar] [CrossRef]
  23. Vinothkumar, K.; Selvan, M.P. Distributed Generation Planning: A New Approach Based on Goal Programming. Electr. Power Compon. Syst. 2012, 40, 497–512. [Google Scholar] [CrossRef]
  24. Moradi, M.H.; Abedini, M. A Combination of Genetic Algorithm and Particle Swarm Optimization for Optimal DG Location and Sizing in Distribution Systems. Int. J. Electr. Power Energy Syst. 2012, 34, 66–74. [Google Scholar] [CrossRef]
  25. Cheng, S.; Chen, M.; Wai, R.; Wang, F. Optimal Placement of Distributed Generation Units in Distribution Systems via An Enhanced Multi-objective Particle Swarm Optimization Algorithm. J. Zhejiang Univ. Sci. C 2014, 15, 300–311. [Google Scholar] [CrossRef]
  26. Mahesh, K.; Nallagownden, P.; Elamvazuthi, I. Advanced Pareto Front Non-Dominated Sorting Multi-Objective Particle Swarm Optimization for Optimal Placement and Sizing of Distributed Generation. Energies 2016, 9, 982. [Google Scholar] [CrossRef]
  27. Darfoun, M.A.; El-Hawary, M.E. Multi-objective Optimization Approach for Optimal Distributed Generation Sizing and Placement. Electr. Power Compon. Syst. 2015, 43, 828–836. [Google Scholar] [CrossRef]
  28. Yammani, C.; Maheswarapu, S.; Matam, S.K. A Multi-objective Shuffled Bat algorithm for Optimal Placement and Sizing of Multi Distributed Generations with Different Load Models. Int. J. Electr. Power Energy Syst. 2016, 79, 120–131. [Google Scholar] [CrossRef]
  29. Hassan, R.; Cohanim, B.; de Weck, O. A Comparison of Particle Swarm Optimization and The Genetic Algorithm. In Proceedings of the 46th AIAA/ASME/ASCE/AHS/ASC Structures, Structural Dynamics and Materials Conference, Austin, TX, USA, 18–21 April 2005; pp. 1–13. [Google Scholar]
  30. Hung, D.Q.; Mithulananthan, N. Multiple Distributed Generator Placement in Primary Distribution Networks for Loss Reduction. IEEE Trans. Ind. Electron. 2013, 60, 1700–1708. [Google Scholar] [CrossRef]
  31. Teng, J. A Direct Approach for Distribution System Load Flow Solutions. IEEE Trans. Power Deliv. 2003, 18, 882–887. [Google Scholar] [CrossRef]
  32. Baran, M.E.; Wu, F.F. Optimal Capacitor Placement on Radial Distribution Systems. IEEE Trans. Power Deliv. 1989, 4, 725–734. [Google Scholar] [CrossRef]
Figure 1. Flowchart for the proposed DG allocation technique.
Energies 10 01733 g001
Figure 2. Variation of base-case bus voltage for all loads.
Energies 10 01733 g002
Figure 3. Pareto front for the placement of single DG.
Energies 10 01733 g003
Figure 4. Pareto front for the placement of multiple DG.
Energies 10 01733 g004
Figure 5. Variation of PLI with variation in VDI for placement single and multiple DGs. (a) constant load; (b) commercial load; (c) residential load; (d) industrial load.
Energies 10 01733 g005
Figure 6. Variation of bus voltage before and after placement of DG for Constant Load.
Energies 10 01733 g006
Figure 7. Variation of bus voltage before and after placement of DG for Commercial Load.
Energies 10 01733 g007
Figure 8. Variation of bus voltage before and after placement of DG for Residential Load.
Energies 10 01733 g008
Figure 9. Variation of bus voltage before and after placement of DG for Industrial Load.
Energies 10 01733 g009
Figure 10. Variation of bus voltage showing effect of objective for constant load.
Energies 10 01733 g010
Table 1. Load models and exponents [18].
Loadnpnq
Constant00
Commercial1.513.40
Residential0.924.04
Industrial0.186.00
Table 2. Optimal size and site of DG and Indices values for power loss index (PLI) as objective.
Type of LoadOptimal DG Size (MW)Optimal DG SitePLIQLIVDIOEI
Constant1.88610.36960.39640.20110.4946
1.83, 0.4261, 260.32800.35960.06890.4641
Commercial1.63610.44370.47630.28050.5839
1.37, 0.4661, 230.39620.43660.15270.5485
Residential1.62610.42170.45550.27900.5646
1.51, 0.3461, 260.37630.41660.15020.5307
Industrial1.70610.38930.42350.25330.5388
1.62, 0.5061, 210.33520.37620.08930.4985
Table 3. Optimal size and site of DG and Indices values for reactive power loss index (QLI) as objective.
Type of LoadOptimal DG Size (MW)Optimal DG SitePLIQLIVDIOEI
Constant1.9252610.37000.39610.19200.4974
1.80, 0.5761, 190.31990.35220.05190.4578
Commercial1.76610.44610.47640.25120.5864
1.34, 0.5762, 230.40540.44320.13130.5558
Residential1.76610.42390.45220.24730.5668
1.61, 0.5461, 220.36820.40680.08520.5256
Industrial1.70610.38910.42340.25490.5386
1.64, 0.5261, 250.34750.38490.07990.5080
Table 4. Optimal size and site of DG and Indices values for voltage deviation index (VDI) as objective.
Type of LoadOptimal DG Size (MW)Optimal DG SitePLIQLIVDIOEI
Constant2.98580.57060.56220.10160.6603
2.33, 0.6963, 200.40330.42890.00570.5260
Commercial2.54590.61730.61690.15270.7177
2.33, 0.7162, 190.52730.54710.00680.6522
Residential2.67590.62770.62320.13760.7238
2.41, 0.6560, 210.53250.55370.00830.6528
Industrial2.82580.65230.63870.12650.7415
2.35, 0.7163, 200.52740.54950.00690.6470
Table 5. Optimal size and site of DG and Indices values for OEI as objective.
Type of LoadOptimal DG Size (MW)Optimal DG SitePLIQLIVDIOEI
Constant1.87610.36960.39660.20300.4696
1.78, 0.5061, 200.31970.35290.06400.4576
Commercial1.55610.44520.47900.29960.5848
1.52, 0.5462, 250.40760.44310.09690.5581
Residential1.60610.42190.45580.28150.5647
1.58, 0.4961, 230.36750.40700.09990.5247
Industrial1.63610.38790.42320.26850.5376
1.66, 0.4561, 220.33620.37750.09240.4993
Table 6. Validation of proposed technique.
ObjectiveMethodOptimal DG Size (MW)Optimal DG SitePLIQLIVDIOEI
PLIPSO1.87610.36960.39640.20110.4949
GA1.87610.36960.39640.20110.4949
PSO1.83, 0.4261, 260.32800.35960.06890.4641
GA1.82, 0.4261, 260.32800.35960.06920.4641
VDIPSO2.98580.57030.56190.10170.6600
GA2.98580.57030.56190.10170.6600
PSO2.33, 0.6963, 200.40330.42890.00570.5260
GA2.34, 0.7063, 200.40650.43170.00570.5286
Both PLI and VDIPSO2.09610.37660.39970.16660.5029
GA2.09610.37660.39970.16660.5029
PSO1.91, 0.4861, 260.33120.36090.04770.4669
GA1.91, 0.4861, 260.33120.36090.04770.4669
Table 7. Optimal size and site of DG for the placement of single DG and multiple DG and Indices values for multi-objective optimization (PLI and VDI).
Type of LoadOptimal DG Size (MW)Optimal DG SitePLIQLIVDIOEI
Constant1.87610.36960.39660.20300.4696
1.78, 0.5061, 200.31970.35290.06400.4576
Commercial1.55610.44520.47900.29960.5848
1.52, 0.5462, 250.40760.44310.09690.5581
Residential1.60610.42190.45580.28150.5647
1.58, 0.4961, 230.36750.40700.09990.5247
Industrial1.63610.38790.42320.26850.5376
1.66, 0.4561, 220.33620.37750.09240.4993
Table 8. Optimal size and site of DG for single and multiple DG placement and Indices values for multi-objective optimization (all objectives).
Type of LoadOptimal DG Size (MW)Optimal DG SitePLIQLIVDIOEI
Constant1.97610.37120.39640.18380.4984
1.85, 0.4861, 270.33080.36080.05460.4665
Commercial1.92610.45800.48450.21970.5961
1.80, 0.7461, 200.41810.44770.03720.5680
Residential1.91610.43550.46310.21660.5761
1.85, 0.4961, 190.38020.41680.06000.5354
Industrial1.86610.40000.43060.22160.5473
1.85, 0.4161, 220.35210.39060.07410.5117
Table 9. Comparative results.
ObjectiveNumber of DGMethodDG Size (MW) @ Site% Loss Reduction
Loss Reduction1PSO [1]1.81 @ 6162.95
GA [3]1.87 @ 6163.01
ABC [4]1.90 @ 6162.97
Analytical [6]1.81 @ 6162.86
Analytical [8]1.81 @ 6159.09
Analytical [9]1.81 @ 6162.97
Proposed Method1.88 @ 6163.04
2GA [3]1.78 @ 61, 0.56 @ 1168.09
Proposed Method1.80 @ 61, 0.57 @ 1968.10

