Evaluation Model of Specific Indoor Environment Overall Comfort Based on Effective-Function Method

1
School of Environmental and Municipal Engineering, Qingdao University of Technology, Qingdao 266033, China
2
School of Architectural Engineering, Qingdao Agricultural University, Qingdao 266109, China
*
Author to whom correspondence should be addressed.
Energies 2017, 10(10), 1634; https://doi.org/10.3390/en10101634
Submission received: 20 September 2017
/
Revised: 13 October 2017
/
Accepted: 14 October 2017
/
Published: 17 October 2017
Abstract
:The indoor overall environmental comfort of part limited spaces is studied in this paper. The operative temperature, illumination, and noise intensity are used as objective parameters in order to evaluate the thermal, luminous, and acoustic environment. The thermal, luminous, and acoustic environment are investigated by using the subjective questionnaire in this experiment, and the function relation of the single physical parameter is established. Then, using the effective-function comprehensive evaluation carries on non-dimensional, weighting, and penalty substitution synthesis for the evaluation index of thermal, luminous, and acoustic environment, and establishes the evaluation model of the indoor overall environment. According to the experimental results and evaluation analysis, it is considered that the noise intensity and operative temperature have great influence on the indoor environment overall comfort and the illumination has less effect. Referring to the ISO7730 standard and combining it with the situation of our country, the indoor overall environment is divided into the zone of comfort. The predicted overall comfort vote (POCV), which is greater than or equal to −0.5 is the high comfort zone I. The area of −0.5 > POCV ≥ −1.0 is designated as low comfort zone II. It provides a certain basis for the evaluation of indoor overall environmental comfort.
1. Introduction
In recent years some progress has been made in the common indoor environmental comfort in China [1,2,3,4]. With the science and technology growth, and the rising in rail mileage and air throughput [5,6], the times and frequency of habitat and construction activities have increased from common indoor environment to specific indoor environment. People are often in the indoor environment, such as train carriage and flight carbine, and these indoor environments have important influence on people’s comfort and health. Most of the flight carbine (train carriage) indoor environments are long and narrow. At the same time, they are affected by many physical environment factors. It requires not only a comfortable thermal environment, but also a bright luminous environment and a quiet acoustic environment. Therefore, the attentions and researches on the overall comfort of the specific indoor environments are increasing.
So far Zhe Zhang [7] and others investigated the IEQ of 8 major Chinese large-hub airport terminal buildings. The instrumental objective measurements and questionnaire subjective surveys had been performed in this research. This survey method utilized belongs to Post-Occupancy Evaluation (POE). The results showed that thermal environment and air quality were the two crucial factors for the overall satisfactory level. Yang Geng [8] and others on the one hand investigated indoor environment quality (IEQ) for 8 major Chinese airport terminals, and on the other hand analyzed the impacts of individual IEQ factors on overall satisfaction based on Kano’s model [9,10]. Three factors Basic Factors, Bonus Factors, and Proportional Factors were identified. Furthermore, the result of this paper was compared with other people’s research, and the comparison showed a big difference on how IEQ factors affect overall satisfaction. Japan was the earlier country to study the comfort of high-speed trains. Main factors that influence comfort, as well as 27 physical and 7 non-physical items for comfort were investigated by Suzuki Hiroa [11]. Using the method of factor analysis and multiple regression calculation, the influencing factors were classified and weighted. At the present stage, the relative standard of comfort is mainly determined from 6 aspects of vibration, acoustic environment, and thermal environment, luminous environment, pressure wave, and air quality in China. Based on factor analysis and analytic hierarchy process (AHP), Chen Xiang [12] analyzed the factors that affect comfort and constructed the evaluation model from the level of physiological feelings and psychological feelings of passenger demand. Liu Lu [13] analyzed and evaluated the influencing factors of the overall comfort of high-speed trains. The weights of factors were determined. An evaluation formula of overall comfort was established by weighted sum method. Lin Sen [14] determined the weights of the factors affecting the comprehensive comfort of high-speed trains by Delphi method and AHP. The regression model of several influencing factors comfort was given by the least square method.
The above references were from statistics and analysis to the formation of objective overall evaluation system using objective parameter measurement and subjective questionnaire survey. Factor analysis and AHP were applied to the weight calculation step by step. A multielement overall evaluation and calculation method was established and combined with fuzzy mathematics, multivariate statistical regression, least square method, weighted sum, and other multivariate statistical methods. These evaluation methods have certain applicability. The experimental method of references [1,2,3,4] is worth learning. But, because of the inconsistent evaluation environment, the parameters of the environment are different. Noise intensity, in particular, is higher in the flight carbine (train carriage) than in the office building. The research environment in references [7,8,9,10,11,12,13,14] is consistent with this paper. However, references [7,8,9,10] calculation methods have a higher automation level while the complexity of evaluation increases correspondingly. The application rages of these methods is limited. The references [11,12,13,14] mainly uses weighted sum method in comprehensive evaluation. This method allows the evaluation values between different environments to compensate each other, but will lead to the final evaluation is too large.
On the basis of this view, the overall comfort of part limited spaces including thermal environment, luminous environment and acoustic environment was carried out. In this paper, the effective-function comprehensive evaluation method was used to analyze and study the factors which affected the indoor environment overall comfort. And established the overall comfort evaluation model of specific indoor environment. It will provide some references for the definition of specific environment overall comfort and the revision of relevant standards.
2. Method
The common indoor environment focused more attention on the thermal environment, air quality, luminous environment, and acoustic environment [15]. Indoor air quality had a small range of changes in this specific indoor environment. In addition, China was required to ban smoking in the flight carbine and high-speed train carriage in 1988 and 2008, respectively. The air pollutants such as VOCs and Respirable Suspended Particulates are lower in concentration, and most passengers were satisfied with air quality in specific indoor environment. So, the indoor air quality was not involved in the following discussion. The emphasis was on the effects of heat, light, and sound on overall comfort. The research content involved several index variables, which belonged to multivariate comprehensive evaluation. Combining the results of the experimental research, the effective-function method was used to evaluate the comprehensive environment.
2.1. Experimental Simulation Chamber
All of the experiments of this research took place in the simulation chamber of building and train air conditioning and energy saving laboratory of Qingdao Technological University. The simulation chamber experiment rig is shown in Figure 1. The materials of chamber used certain thickness of the steel plate, and ensured the air tightness within the chamber. Visual glass windows are arranged on the hatch door to facilitate the observation out of the chamber after hatch door is closed. The inner surface of the chamber coated with absorbing materials, so as to reduce the background noise as much as possible during the experiments.
The structure of simulation chamber is the room-in-room. The size and measurement points of the chamber are shown in Figure 1. The simulation chamber can control and measure the variables of the thermal environment, luminous environment and acoustic environment. The participants are college students, healthy and aged between 19–26 years old. There are 76 participants involved in the experiments. They are given simple training before entering the chamber.
2.2. Multi-Index Comprehensive Evaluation Method
The multi-index comprehensive evaluation method is a generic terms for a series of effective methods of integrating multiple indexes. It contained a number of indexes that illustrated several aspects of what is to be evaluated. The evaluation method should make a comprehensive evaluation of the things to be evaluated, and then use a general index to explain the level of the things to be evaluated [16,17]. The indoor environment overall comfort evaluation contained several indexes, such as air temperature, mean radiant temperature, air velocity, illumination, uniformity of illumination, main frequency range of noise, and noise intensity. These indexes evaluate the acceptability of indoor overall comfort from heat, light, and sound, respectively. The evaluation of indoor environment overall comfort is a comprehensive evaluation problem. Finally, a general index should be determined to make a comprehensive evaluation of the overall comfort.
Research on multi-index comprehensive evaluation, some methods of discipline, such as fuzzy mathematics, cluster analysis, principal component analysis, grey system theory, and artificial neural network technology [18,19,20,21,22,23] had certain applications and popularizations. Although these modern comprehensive evaluation methods were advanced and practical, the complexity of these algorithms determined that they must be completed by means of computer software. The key to the selection of comprehensive evaluation methods lies in the rationality and scientific nature of evaluation thought.
Concise evaluation thought is applied to the comprehensive evaluation in this paper. After the evaluation indexes are non-dimensional, the total evaluation value was weighted synthesis by an established model. Namely, a comprehensive evaluation model of indoor environment overall comfort is established by means of effective-function comprehensive evaluation method. Write a general equation for:
ωi: The weight value of xi; ξi: Synthetic model of yi and ωi; yi = fi (xi): Effective-function evaluation value of xi, that is, non-dimensional values; fi: Effective-function of xi, that is, non-dimensional functions. Therefore, the effective-function method in the comprehensive evaluation of indoor environmental overall comfort is the determination process about effective-function of fi, weighted value of ωi and synthetic model of ξ. The specific process included the following three aspects:
The first is the non-dimensional evaluation index. On the basis of the characteristics that can reflect the comfort of indoor environment accurately and directly. In order to avoid the influence of the difference of the units or the magnitude of the numerical value, the evaluation index should be treated by non-dimensional method.
The second is to determine the weight coefficient. In a number of evaluation indexes, the impact of each indicator on overall comfort is different. It is necessary to determine the evaluation index value of the importance according to some weighted methods.
The third is the synthesis of evaluation indexes. That is to say, a number of evaluation indexes were combined with some mathematical function to synthesize a total evaluation index value. The evaluation function of thought should be scientific and reasonable. And should make the evaluation index physical meaning of the single and overall values consistent.
3. Establishment of Evaluation Model
3.1. Non-Dimensional Process
There are positive and negative indexes in several evaluation indexes of specific indoor environment. The units and properties of these single evaluation indexes are different, and the equivalent discomfort is also different [24]. The relationship between different evaluation environment levels and comfort is inconsistent, and the non-dimensional method needs different compound functions. The form of the non-dimensional compound function should be obtained according to the relationship between the physical parameters and the participants’ comfort in the experiment.
The quantitative evaluation Cx of thermal, luminous, or acoustic environment should first be directional. The evaluation of the acoustic environment is in a single direction. Therefore, the thermal environment and luminous environment can only be evaluated with consistent values. Secondly, the new indexes should have the same meaning after the non-dimensional, and the scale distance is the same. There are the thermal sensation from −3 to +3 and thermal comfort vote from 4 to 0 in the ASHRAE 55-2013. This paper used a vote similar to thermal comfort vote (TCV) [25]. That is, from 0 to −4 of 5 grade index. Table 1 shows the relationship between physical stimulation comfort and evaluation indexes.
3.1.1. Non-Dimensional Process of Thermal Environment Parameters
During the experiment, the temperature is controlled by the air conditioner outside of the chamber and the auxiliary electric heater in the chamber, so as to ensure the temperature within the control range. Adjust the air velocity and flow direction of the fan coil in the chamber, try to keep the participants in breezeless. The wall temperature was collected to calculate the mean radiant temperature. Relative humidity is measured only, but not controlled. The major control parameters of thermal comfort experiment include: air temperature and air velocity in the chamber. The main monitoring parameters include the wall temperature and the relative humidity. The instruments required for parameter measurements were shown in Figure 2. The measuring range of the hand-held thermal anemometer is 0.1~20 m/s.
A total of two conditions are conducted, and each experiment temperature is controlled at 3 levels. Among them, winter is 16 °C, 22 °C, 24 °C, summer is 22 °C, 25 °C, 28 °C. When the body is warm and comfortable, fully dressed in a quiet state, 18 °C is not sense of coldness and 15 °C is the apparent temperature limits of the coldness, according to the research results of the relevant health departments at home and abroad. In this study, we discuss the comfort zone of thermal environment, and also study whether the comfort of each environment can compensate for other environment. Therefore, a lower 16 °C is set as a reference for comparison. The thermal resistance clothing is about 1.5 clo and 1.02 clo in winter and summer. Participants are asked to sit still for 30 min, followed by an experiment and a subjective questionnaire. Evaluation content is not allowed during experiment. The duration of each temperature level is controlled by 30 min. The former 15 min is the adaptation process in each case, and the individual information in the questionnaire is filled at that time. The middle 10 min participants fill out questionnaires, and the experimental organizers need to record all parameters. The last 5 min is the parameter adjustment phase.
There are many factors that affect the thermal comfort. The operative temperature reflect the comprehensive effect of convection and radiation. Therefore, it has certain accuracy and described the thermal comfort of indoor environment with the operative temperature under most indoor conditions [26]. The operative temperature is calculated in accordance with Equation (2). Participants’ thermal comfort evaluation vote (TCEV) is recorded correspondingly.
: air temperature; : mean radiant temperature.
According to the experimental results in winter and summer, quadratic curve functions are determined by curve estimation method. The non-dimensional function of the thermal environment is shown in Figure 3.
3.1.2. Non-Dimensional Process of Luminous Environment Parameters
There are 18 fluorescent lamps installed evenly at the top of the simulation chamber. 9 lamps’ color temperature is 6400 K and 9 lamps’ color temperature was 3300 K. The layout is shown in Figure 4. It needs an air conditioner outside of the chamber and a fan coil inside of the chamber to work at the same time in order to reduce the influence of temperature and humidity. The major control parameters include: illumination value and color temperature of light source. The main monitoring parameters include air temperature, relative humidity, and air velocity. All of the instruments needed for the measurement of luminous environment parameters are the same as those required for the thermal environment except for the photometer. The split type high-precision photometer’s range is 0~200,000 lx as shown in Figure 5. The precision is ±3% lx.
Before the luminous comfort experiment started, the fluorescent lamps should be lit for 15 min [27]. The three conditions of the illumination level are selected from dark to bright, from the opening of 1 light, 5 light, to 9 light, namely 120 lx, 660 lx, and 1200 lx. The participants are required to adapt themselves to the 15 min, and then to carry out experiments under different conditions. Throughout the experiment, participants remain sitting still and talk softly other than the experiments. The results of luminous environment comfort vote (LECV) are analyzed by curvilinear regression. As shown in Figure 6, the non-dimensional function of the luminous environment is obtained.
3.1.3. Non-Dimensional Process of Acoustic Environment Parameters
The soundtrack equipment is applied to simulate different noise sources. Only components of low frequency, intermediate frequency, or high frequency are kept by filters. The acoustic comfort evaluation vote (ACEV) of participants under different noise intensity and frequencies is obtained. The temperature controlled is (24 ± 1) °C, the relative humidity is (62 ± 2)%, and the illumination is about 600 lx. The major control parameters include: the noise intensity and the frequency of simulated noise. The main monitoring parameters include air temperature, relative humidity, and air velocity. The noise intensity produced by sound equipment is measured by a type of AWA6291. The sound level meter is shown in Figure 7 with a range of 25–140 dB (A).
According to the relevant noise control standards, most countries in the world have set the upper limit of noise control to 90 dB. Taking into account the actual noise in the traffic, the noise intensity is set up with 6 working conditions, namely 60 dB, 65 dB, 70 dB, 75 dB, 80 dB and 85 dB. Relationship testing between ACEV and noise intensity and frequency, in accordance with the noise intensity from low to high, selected <1000 Hz, 3500 Hz–4500 Hz, and 7000 Hz–8000 Hz in turn. The noise source in the front 30 s of each working condition is played, and the middle 30 s is stopped. The last 2 min, the participants are evaluated subjectively for the acoustic environment comfort. The experiments have 18 conditions with a duration of 54 min.
According to the experimental data, the curves of different frequencies are fitted. The linear function of the non-dimensional acoustic environment is shown in Figure 8. It can be seen that if the same slope is used in the range of noise discussed, then it will lead to smaller noise intensity corresponding acoustic comfort index is smaller. The larger noise intensity result in a greater value of the corresponding acoustic comfort evaluation index. Thus take the piecewise function, as shown in Table 2.
3.2. Weight’s Calculation
The role and importance of thermal, luminous, and acoustic environment in the comprehensive evaluation system are different. After each index system has been determined and completed non-dimensional, it is necessary to calculate different weights to the three evaluation indexes. Some use the personal or expert knowledge and experience for subjective weighting method. Objective weighting methods derive from analyzed and processed investigation data. Based on the content of the study involves more professional, Analytic Hierarchy Process (AHP) is adopted. In the AHP, the theory of “binary weight comparison” is introduced, and the judgment matrix is established to calculate the weights. The judgment value is given from two aspects of importance proportion. The specific assignment is shown in Table 3.
The survey is conducted by means of network collection within the professional field. By clicking on the link, participants can fill in the information directly on the phone or computer. A total of 89 data from 16 cities are collected. According to the corresponding data, determine the judgment matrix are shown in Table 4.
B1 stands for thermal environment, B2 stands for luminous environment and B3 stands for acoustic environment.
The geometric mean contrast method is selected to calculate weights, and the results are shown in Table 5.
The maximum eigenvalue can be obtained according to the weight, and the consistency check is carried out.
CR = CI/RI = 0.00207/0.58 = 0.00357 < 0.1.
3.3. Synthesis of Evaluation Indexes
It is one of the theoretical bases of the effective-function comprehensive evaluation method to select the reasonable synthetic model. It is necessary to synthesize the single evaluation index into the overall evaluation value. In decision science theory, there are four kinds of synthetic models, which are additive synthesis, multiplication synthesis, additive and multiplicative mixed synthesis, and substitution synthesis [28]. There are two principles when choosing a composite model: Firstly, the physical meaning of the overall evaluation value should be consistent with the physical meaning of the single index value, so as to know whether the single evaluation value is good or bad. The second is the evaluation thought and the synthesis rule must conform to the actual people’s subjective request. When a single index in a specific indoor environment reached unbearable, the impact on people is much greater than other singly indexes reached comfort at this time. That is to say, if the thermal environment is unbearable, even the light and the sound are comfortable at this time, but the overall evaluation value would be unbearable. This is not mentioned in other related studies. Therefore, the evaluation principle of choosing synthetic model is that the failure of an index will lead to the failure of the overall evaluation value. The penalty type substitution synthesis method is shown in Equation (3).
L: The theoretical minimum of a single evaluation index, according to Table 1 the evaluation value of comfort, −4.
Equation (3) means that as long as any evaluation value reach the lower limit L, then the overall evaluation value C reach Min. Its evaluation principle is “punishment leg behind”, which has the characteristics of “veto power”. The value C of Equation (3) is the predicted overall comfort vote. The 3 non-dimensional functions are substituted into Equation (3), and Equation (4) can be obtained.
POCV: Predicted Overall Comfort Vote; y1, y2, y3: Non-dimensional function of single index of thermal environment, luminous environment, and acoustic environment; : Weights of single indexes of thermal environment, luminous environment, and acoustic environment.
4. Discussion and Verification
4.1. Result and Discussion
4.1.1. Results and Discussion of Thermal Environment Comfort
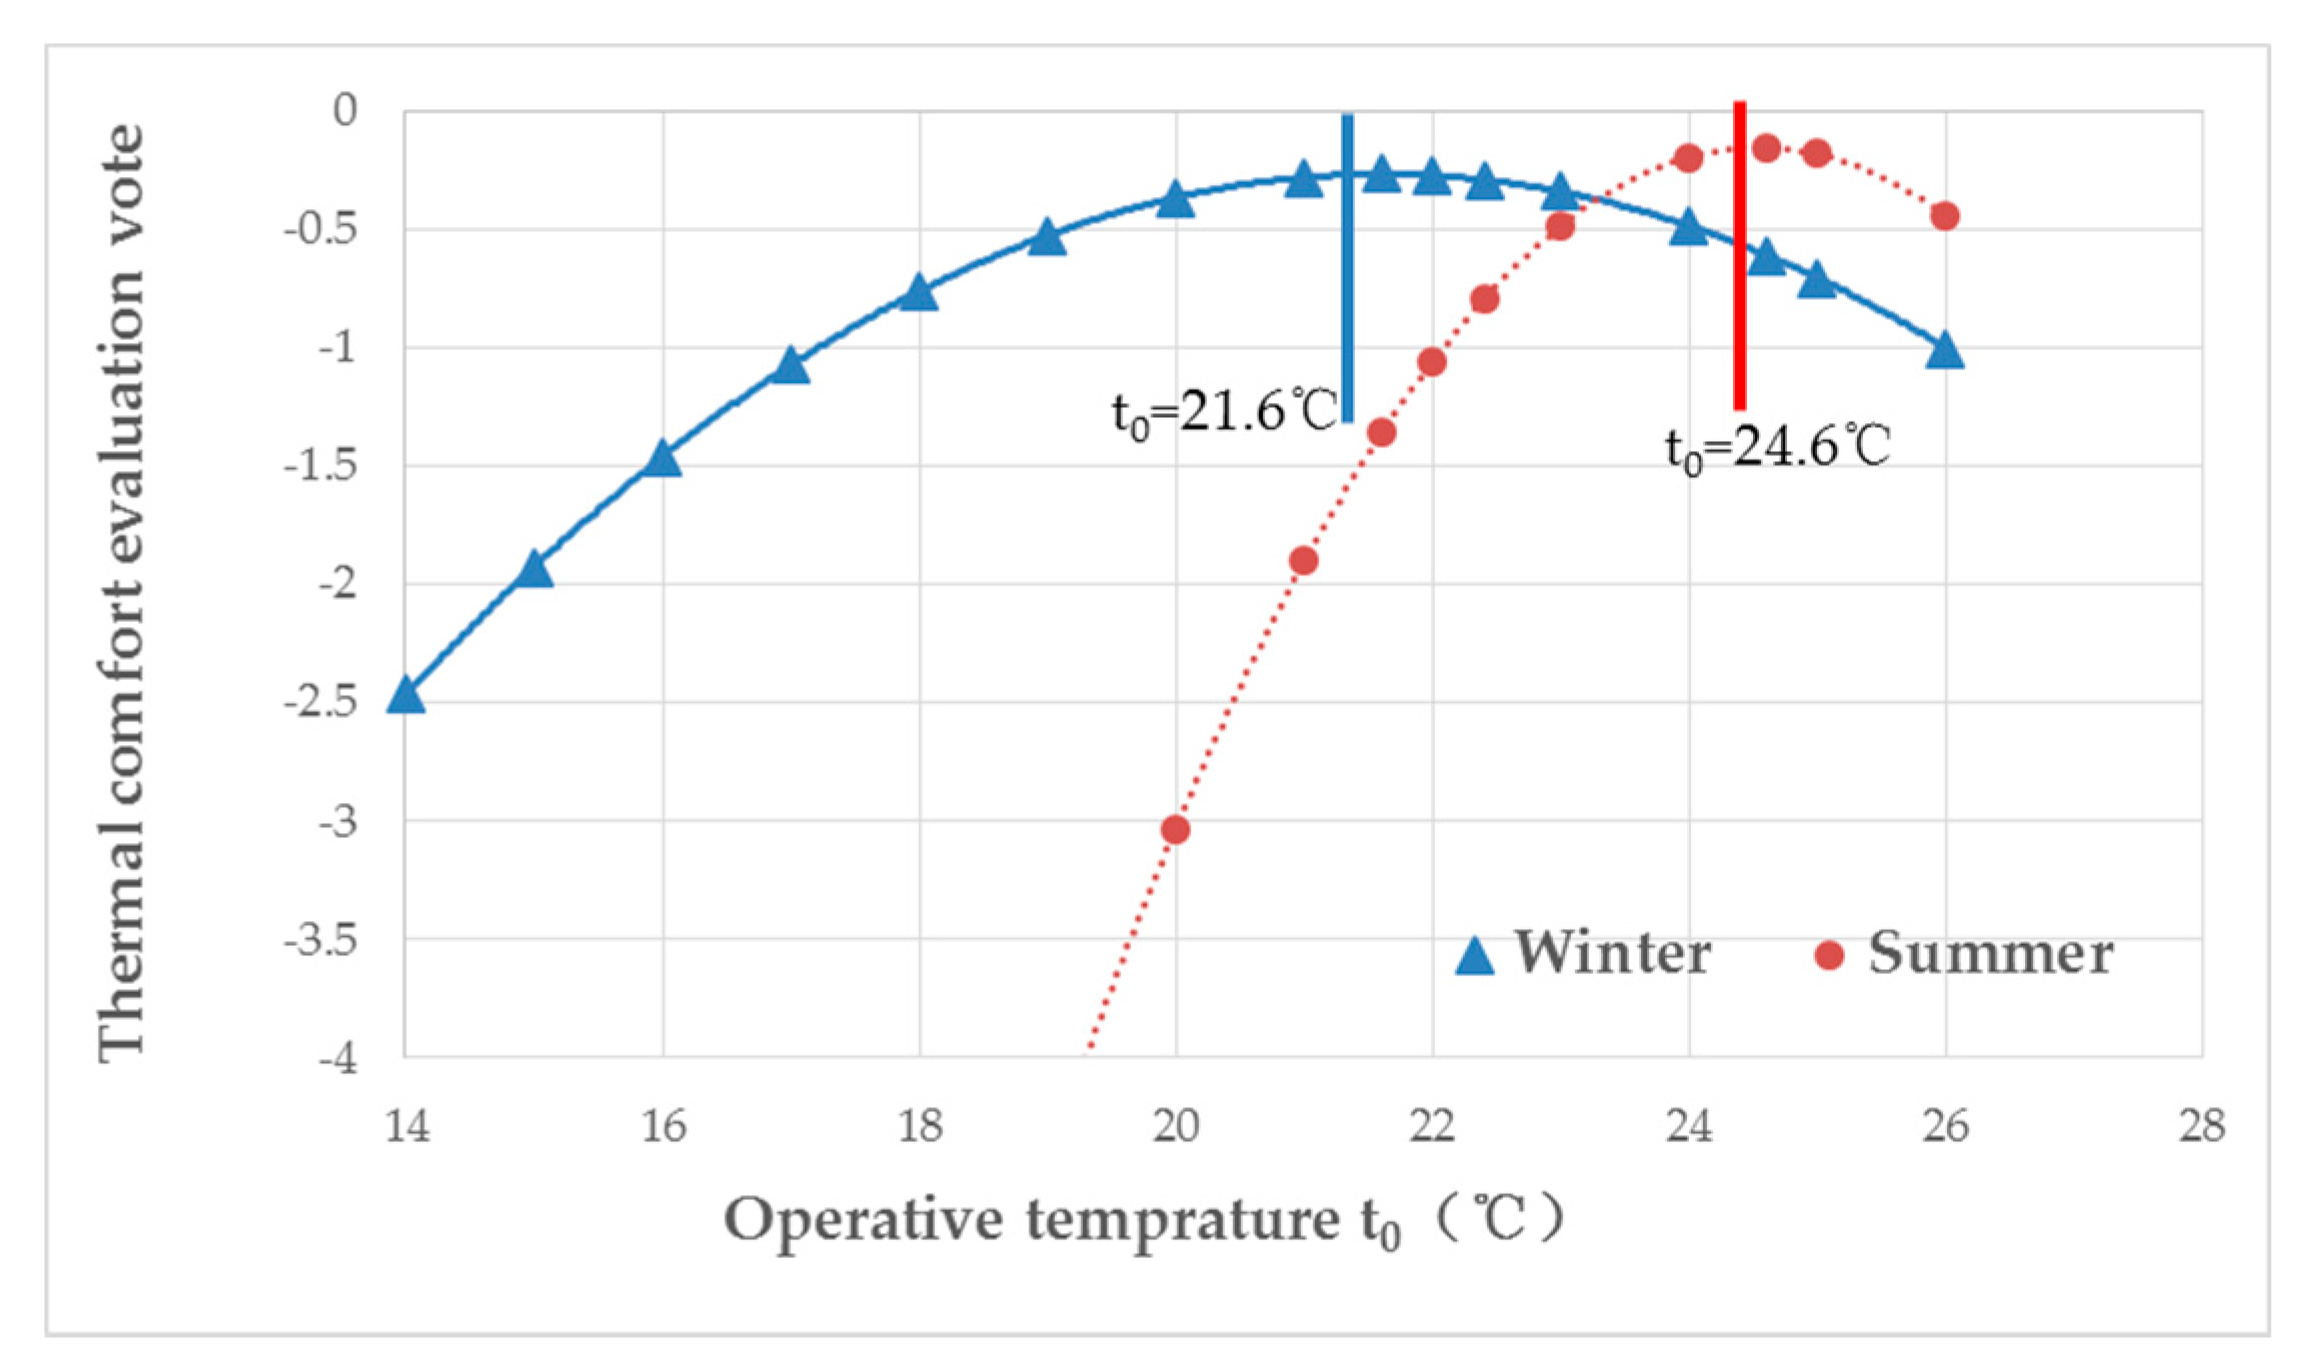
From the non-dimensional function of thermal comfort, the TCEA corresponding to different operative temperature can be obtained in winter and summer. As shown in Figure 9, when the winter condition is t0 = 21.6 °C, the participants are in a higher comfort zone; in summer, the participants are in higher comfort zone at t0 = 24.6 °C. This is consistent with the temperature range of the air conditioning indoor calculations specified in reference [29] for the long stay area. The non-dimensional function of winter thermal comfort was more gentle than summer, indicating that the more comfortable areas in winter can be accepted than in summer. From the point of view of energy conservation, under the values of similar thermal comfort evaluation, winter can choose a colder environment, while summer can choose a hotter environment.
4.1.2. Results and Discussion of Luminous Environment Comfort
The luminous comfort of two color temperature 3300 K and 6400 K is compared according to the non-dimensional function of luminous comfort. As shown in Figure 10, when the illumination of the light source is the same, the LCEV of low color temperature is lower than that of high color temperature. Considering that the high color temperature of the light source is white, close to the color temperature of daylight, the trend of luminous comfort in the two color temperatures is almost the same. Therefore, the results of luminous comfort survey with high color temperature 6400 K should be adopted to analyze the overall comfort.
4.1.3. Results and Discussion of Acoustic Environment Comfort
Compare the acoustic comfort levels of three frequencies (low frequency, intermediate frequency, high frequency), as shown in Figure 11. At any frequency, the acoustic comfort vote (AECV) of the participants decreased with the increase of noise intensity, and the relationship between the both is monotonic change. The effect of noise intensity of 3 frequencies on the acoustic comfort of participants is not significant. Among them, the evaluation index of the intermediate frequency noise intensity is slightly higher. In addition, when the noise intensity reaches 80 dB, it can be seen that there is an inflection point in the three frequency ranges. When the noise intensity is greater than 80 dB, the straight line became steeper. For most participants, if the noise intensity exceeds 80 dB, the acoustic comfort would span two intervals, from slightly uncomfortable to very uncomfortable.
4.1.4. Results and Discussion of Overall Comfort of Specific Indoor Environment
The experimental data show the lower the noise intensity, the higher the predicted overall comfort of indoor environment, when the operative temperature is between [24 °C, 25 °C] in summer, or between [21 °C, 22 °C] in winter, the illumination is between [600 lx, 800 lx]. However, within the entire experimental range, participants have the highest voting value close to 0, but not equal to 0. This is consistent with the conclusion of PMV = 0, but PPD = 5% in the thermal environment. Even if the indoor environmental parameters have reached a better comfortable state, there are a few people who feel uncomfortable and dissatisfied.
As shown in Figure 12, the influence of indoor operative temperature on the overall comfort is uneven. The operative temperature difference of 1 °C caused the POCV to vary from 0.01 to 0.6. In winter, the POCV varied more slowly with the operation temperature.
As shown in Figure 13, when the illumination is in the range of [500 lx, 800 lx], the POCV varies very little. In the [200 lx, 500 lx] and [800 lx, 1100 lx], illumination changes 100 lx, maximum difference of POCV is about 0.15. This shows that the effect of unit change of illumination is smaller than of unit change of operative temperature on the POCV. When the noise intensity is close to 89 dB, the illumination change tend to be straight. This means that the noise have reached unacceptable and that the POCV is not affected by the other two environmental factors and reaches a smaller value.
From Figure 14, the higher the noise intensity, the lower the POCV, the worse the comfort of the participants. A sudden change occurred when the noise intensity reached 80 dB. When the noise intensity continued to increase, the POCV dropped sharply until it reached unbearable level.
According to the recommended value of ISO7730 [30] to PMV-PPD, and the classification of thermal comfort grade in China: PMV ≤ ±0.5, the thermal comfort is determined for class I and ±0.5 ≤ PMV ≤ ±1, the thermal comfort is determined for class II [29]. The two auxiliary lines of POCV = −0.5 and POCV = −1 are added, respectively, in Figure 12, Figure 13 and Figure 14. When POCV ≥ −1, the participants without discomfort, is acceptable for the whole indoor environment. POCV ≥ −0.5 represents an indoor environment with an overall comfortable for higher level I zone. −0.5 > POCV ≥ −1 represents an indoor environment overall comfortable is lower level II zone. It can be seen from the results of the division zone of the indoor environment overall comfort that the main affecting factors are noise intensity and temperature, while the illumination is less. At the same time, the comfort zone can be judged directly according to the parameters of the region. It reduces the time of experiments effectively, and provides a certain reference basis for the evaluation of overall comfort.
4.2. Verification of Overall Comfort Evaluation Model
As shown in Table 6, take the summer condition as an example. The participants are selected randomly to evaluate the specific indoor environment. The correlation test is carried out with the predicted POCV of indoor environment overall comfort.
The results of verification are shown in Table 7. C0 is significantly related to the POCV. It shows that the calculation of POCV is objective and accurate.
5. Conclusions
According to the experimental results and the synthesis and analysis of the indoor environment overall comfort model, the following conclusions can be drawn:
- (1)
- Based on the experimental data of the simulation chamber, the effective-function comprehensive evaluation is used. An overall comfort evaluation model is established for a specific indoor environment with thermal environment, luminous environment, and acoustic environment.
- (2)
- The overall comfort zone of a specific indoor environment is defined and divided. The higher comfort zone I requires that the noise intensity ≤65 dB, the operative temperature at [19.5 °C, 23.5 °C] in winter, the operative temperature at [23 °C, 26 °C] in summer, the illumination at [500 lx, 1000 lx]. The lower comfort zone ІІ requires that the noise intensity ≤80 dB, the operative temperature at [17 °C, 27 °C] in winter, the operative temperature at [21.5 °C, 27 °C] in summer, the illumination was above 250 lx.
- (3)
- In the comfort zone I and II with POCV ≤ −1, the influence of environmental factor changes on POCV is different. That is, the unit variation of each parameter causes differences in POCV. From the numerical results, the unit variation of the operative temperature has the greatest impact on the POCV. The unit variation of illumination has the least impact on the POCV. And for different comfort zones, the impact is not consistent.
Therefore, more active measures should be taken to reduce the discomfort caused by noise in a specific indoor environment. At the same time, indoor air temperature and air velocity should be adjusted in time.
The experimental processes don’t take into account the indoor air quality and the indoor pressure fluctuations on the overall comfort. This is also the main direction of future expansion of this project. In addition, we should increase the number of samples that are verified by the evaluation model, and improve the evaluation model constantly, so that the application of the indoor overall comfort evaluation model will be more universal.
Acknowledgments
Supported by the National Science Foundation of China: 51378267; Supported by the National Science Foundation of China: 51778305.
Author Contributions
Songtao Hu putted forward the framework of the paper and supervised the whole work. Tieming Guo and Guodan Liu were responsible for determining the experimental plan. Tieming Guo and Guodan Liu performed the experimental test process. Tieming Guo analyzed the experimental data and established the evaluation model. Tieming Guo wrote the paper.
Conflicts of Interest
The authors declare no conflict of interest.
References
- Huang, L.; Zhu, Y.; Ouyang, Q.; Cao, B. A study on the effects of thermal, luminous, and acoustic environments on indoor environmental comfort in offices. Build. Environ. 2012, 49, 304–309. [Google Scholar] [CrossRef]
- Cao, B.; Ouyang, Q.; Zhu, Y. Development of a multivariate regression model for overall satisfaction in public buildings based on field studies in Beijing and Shanghai. Build. Environ. 2012, 47, 394–399. [Google Scholar] [CrossRef]
- Cui, F.; Xin, S. Theoretical study on comprehensive evaluation of indoor environmental comfort and design of an evaluation system. High Technol. Lett. 2014, 24, 721–731. [Google Scholar]
- Francesco, A.; Cinzia, B.; Franco, C.; Giorgio, B.; Michele, G. Evaluation of green buildings’ overall performance through in situ monitoring and simulations. Energies 2013, 6, 6525–6547. [Google Scholar]
- Civil Aviation Administration of China. National Airport Production Statistics Bulletin in 2015. Available online: http://news.carnoc.com/list/340/340998.html (accessed on 31 March 2016).
- Lan, L. Over the next ten years, rail investment will continue to run high, doubling the number of high-speed rail lines. Constr. Mach. Dig. 2016, 9, 67–70. [Google Scholar]
- Wang, Z.; Zhao, H.; Lin, B.; Zhu, Y.; Ouyang, Q. Investigation of indoor environment quality of Chinese large-hub airport terminal buildings through longitudinal field measurement and subjective survey. Build. Environ. 2015, 94, 593–605. [Google Scholar] [CrossRef]
- Geng, Y.; Yu, J.; Lin, B.; Wang, Z.; Huang, Y. Impact of individual IEQ factors on passengers’ overall satisfaction in Chinese airport terminals. Build. Environ. 2017, 112, 241–249. [Google Scholar] [CrossRef]
- Kim, J.; de Dear, R. Nonlinear relationships between individual IEQ factors and overall workspace satisfaction. Build. Environ. 2012, 49, 33–40. [Google Scholar] [CrossRef]
- Kim, J.; de Dear, R. Impact of different building ventilation modes on occupant expectations of the main IEQ factors. Build. Environ. 2012, 57, 184–193. [Google Scholar] [CrossRef]
- Suzuki, H. Evaluation of train comfort. Foreign Rolling Stock. 1999, 2, 26–32. [Google Scholar]
- Chen, X.; Li, F. Evaluation model and empirical analysis of ride comfort of high-speed trains based on factor analysis and AHP. J. Chin. Railw. Soc. 2010, 32, 13–18. [Google Scholar]
- Liu, L. The Research of Evaluation Method for the Synthesis Comfort of High-Speed Train and the Design of Its Simulation System; Southwest Jiao tong University: Chengdu, China, 2011; Volume 11. [Google Scholar]
- Lin, S.; Lin, J.; Liu, L. An objective method to evaluate the synthesis comfort of high-speed train. Railw. Locomot. Car. 2013, 33, 5–9. [Google Scholar]
- ISO/TC205. ISO/DIS 16814 Building Environment Design—Indoor Air Quality—Methods of Expressing the Quality of Indoor Air for Human Occupancy; ISO: Geneva, Switzerland, 2005. [Google Scholar]
- Su, H. Research on the Theory and Method of Multi Index Comprehensive Evaluation; China Price Press: Beijing, China, 2001. [Google Scholar]
- Qin, K. Principles and Methods of Comprehensive Evaluation; Electronics Industry Press: Beijing, China, 2003. [Google Scholar]
- Liu, J.; Yu, H.; Chu, J. Fuzzy comprehensive evaluation of civil aircraft cabin comfort evaluation based on. Chin. J. Ergon. 2017, 23, 60–64. [Google Scholar]
- Li, J.; Yu, Z.; Liu, Z.; Zhang, G. A method for residential building energy benchmarking and energy use evaluation. J. Civ. Archit. Environ. Eng. 2016, 38, 75–83. [Google Scholar]
- Lin, H.; Du, Z. Some problems in comprehensive evaluation in the principal component analysis. Stat. Res. 2013, 30, 25–31. [Google Scholar]
- Yan, Y.; Wang, Z.; Liu, X. Grey theory application in evaluation of air quality in northern farm house. Build. Energy Environ. 2015, 34, 44–46. [Google Scholar]
- Du, X. Research on the Evaluate and Control Methods of the Building Intelligent Light Environment; Chang’an University: Xi’an, China, 2016; Volume 6. [Google Scholar]
- Mario, C.; Antonio, M.; Giuseppina, N.; Giovanni, P. A dynamic fuzzy controller to meet thermal comfort by using neural network forecasted parameters as the input. Energies 2014, 7, 4727–4756. [Google Scholar]
- Pellerin, N.; Candas, V. Effects of steady-state noise and temperature conditions on environmental perception and acceptability. Indoor Air 2004, 14, 129–136. [Google Scholar] [CrossRef] [PubMed]
- ASHRAE Standard55-2013. Thermal Environmental Condition for Human Occupancy; American Society of Heating, Refrigerating and Air-Conditioning Engineers, Inc.: Atlanta, GA, USA, 2013. [Google Scholar]
- Dedear, R.J.; Brager, G.S. Developing an adaptive model of thermal comfort and preference. ASHRAE Trans. 1998, 104, 145–167. [Google Scholar]
- Liu, J.; Dai, T. Architectural Physics Experiment; China Building Industry Press: Beijing, China, 2006; Volume 3. [Google Scholar]
- Qu, D. Systematic Analysis of Multi Index Comprehensive Evaluation Method; China Statistics Press: Beijing, China, 1991; Volume 12.
- GB50376-2012. Design Code for Heating Ventilation and Air Conditioning of Civil Buildings; China Building Industry Press: Beijing, China, 2012; Volume 8. [Google Scholar]
- ISO7730-2005. Ergonomics of the Thermal Environment-Analysis Determination and Interpretation of Thermal Comfort Using Calculation of the PMV and PPD Indices and Local Thermal Comfort Criterial; ISO: Geneva, Switzerland, 2005. [Google Scholar]
Figure 1.
The structure of simulation chamber.

Figure 2.
The test instruments of thermal environment: (a) Temperature data acquisition (Agilent34980A); (b) Dry-wet bulb thermometer (TJ-103); and, (c) Thermal anemometer.
Figure 2.
The test instruments of thermal environment: (a) Temperature data acquisition (Agilent34980A); (b) Dry-wet bulb thermometer (TJ-103); and, (c) Thermal anemometer.
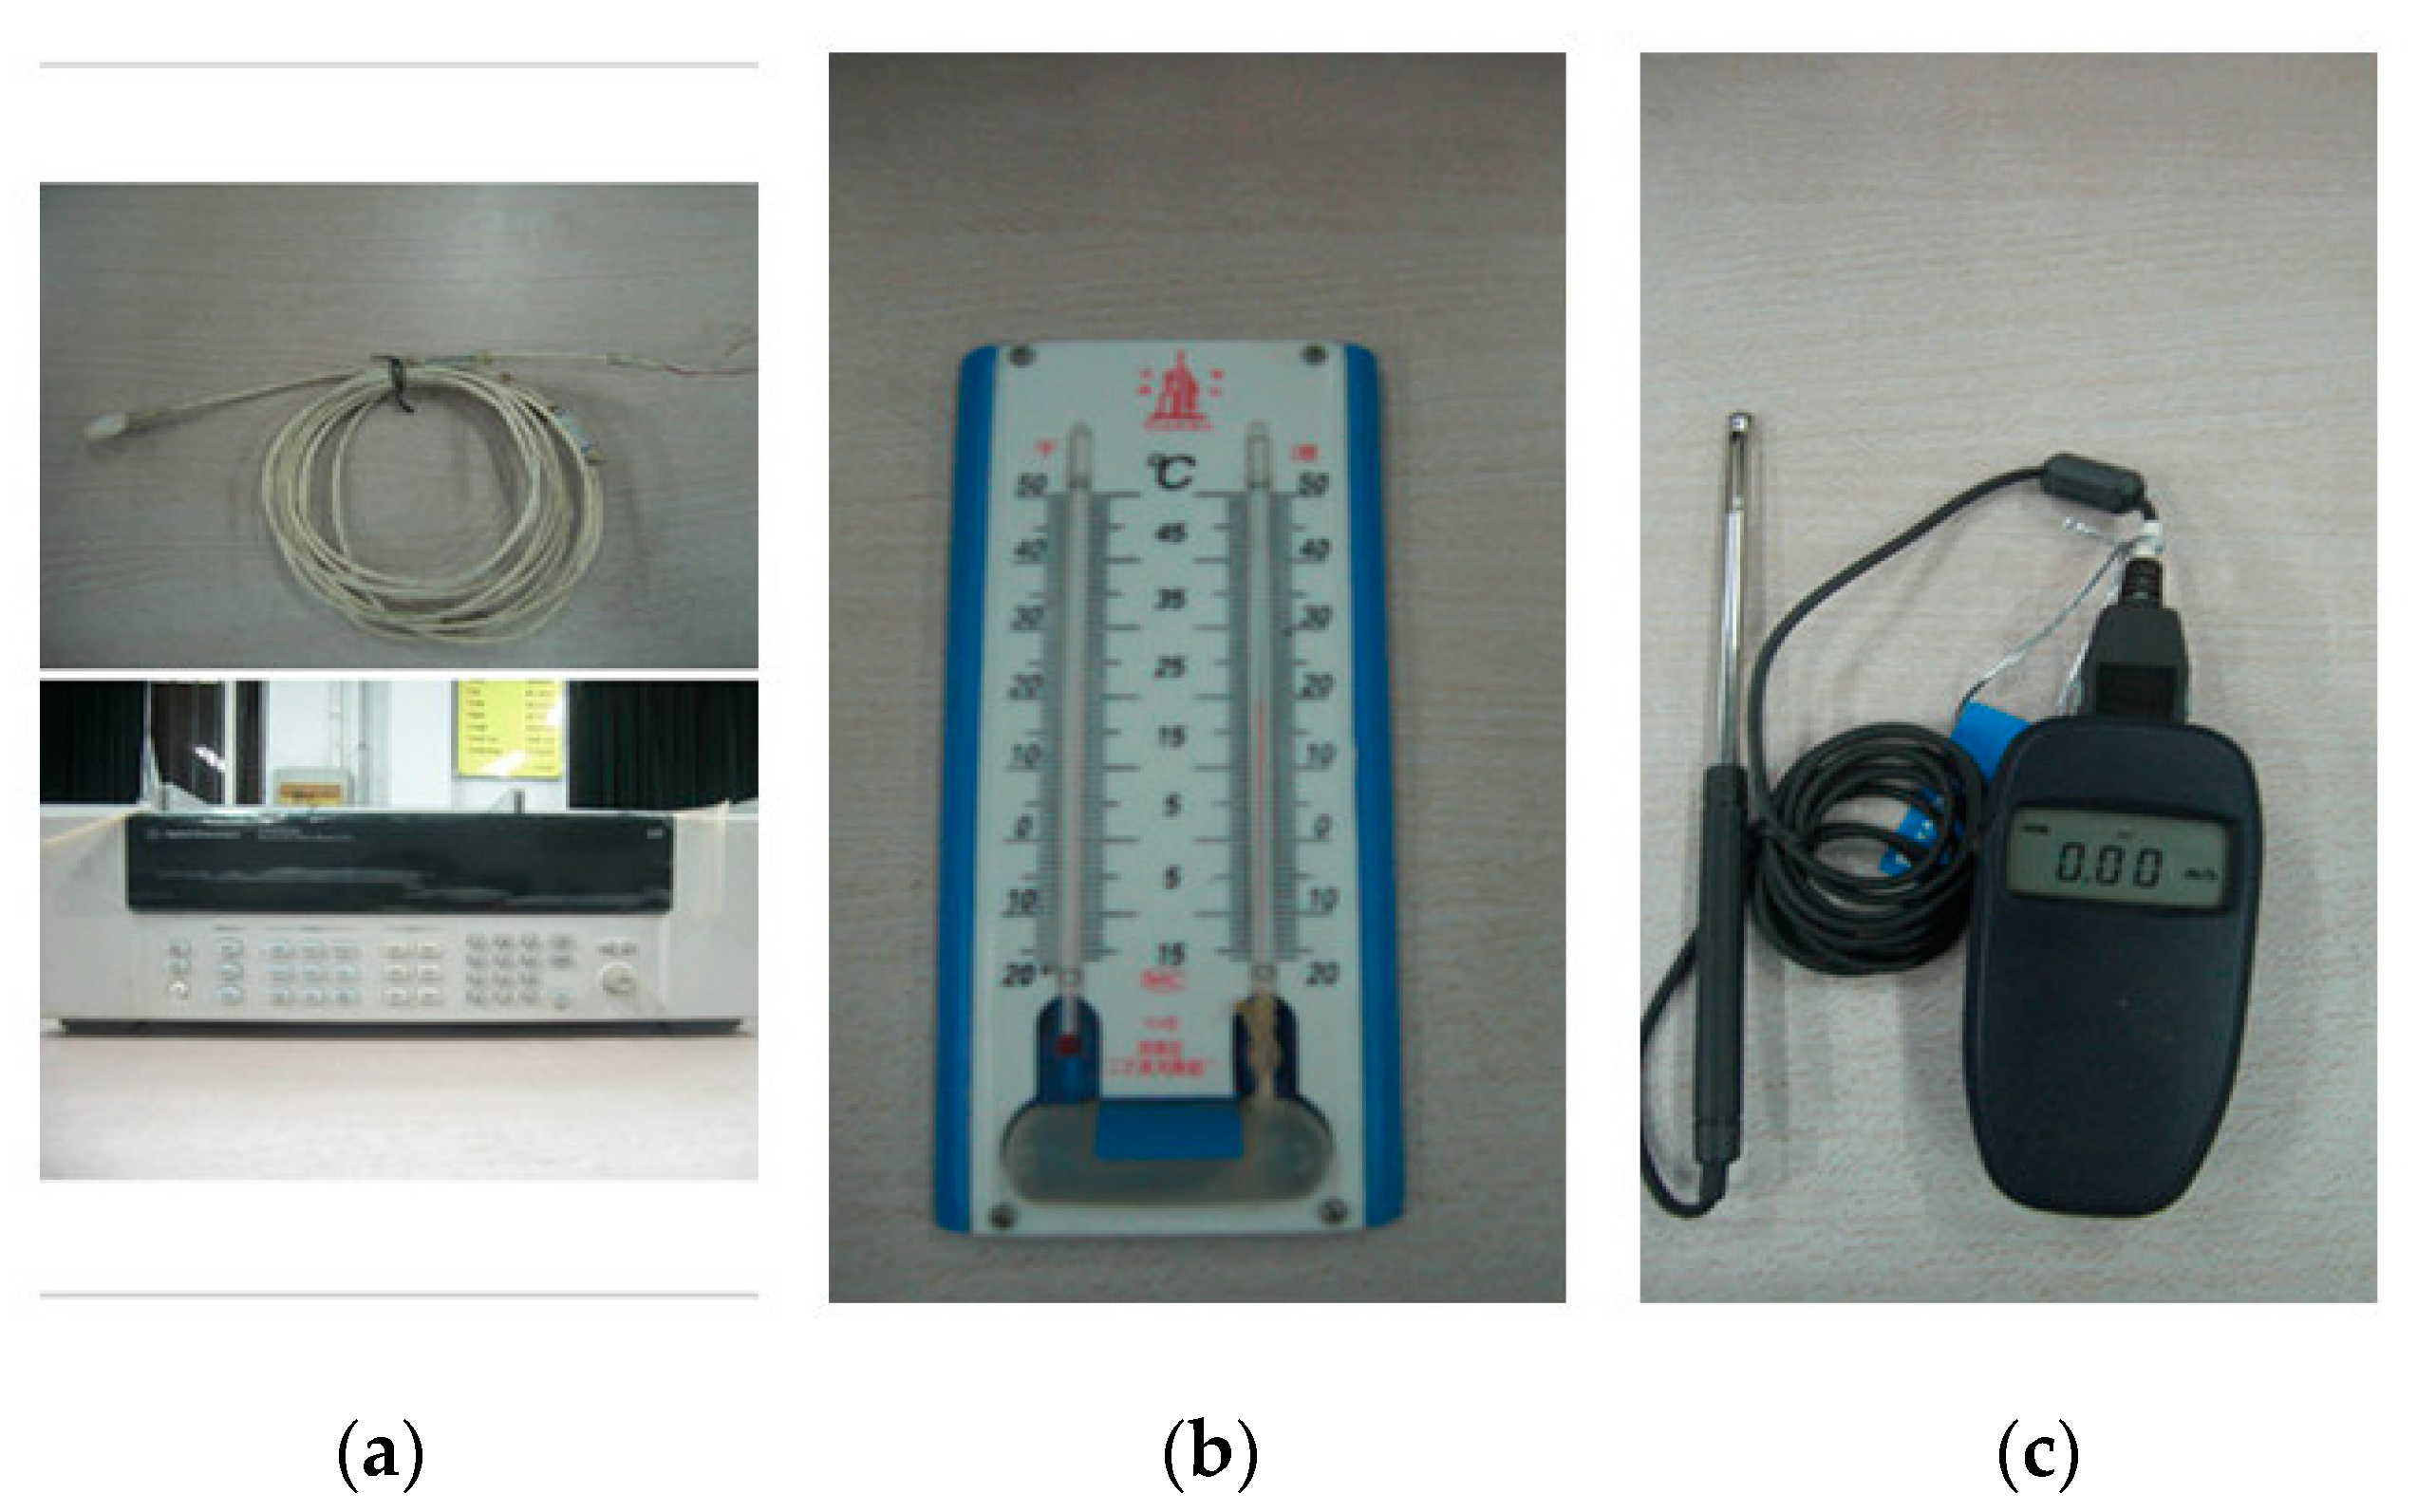
Figure 3.
Thermal comfort evaluation vote.
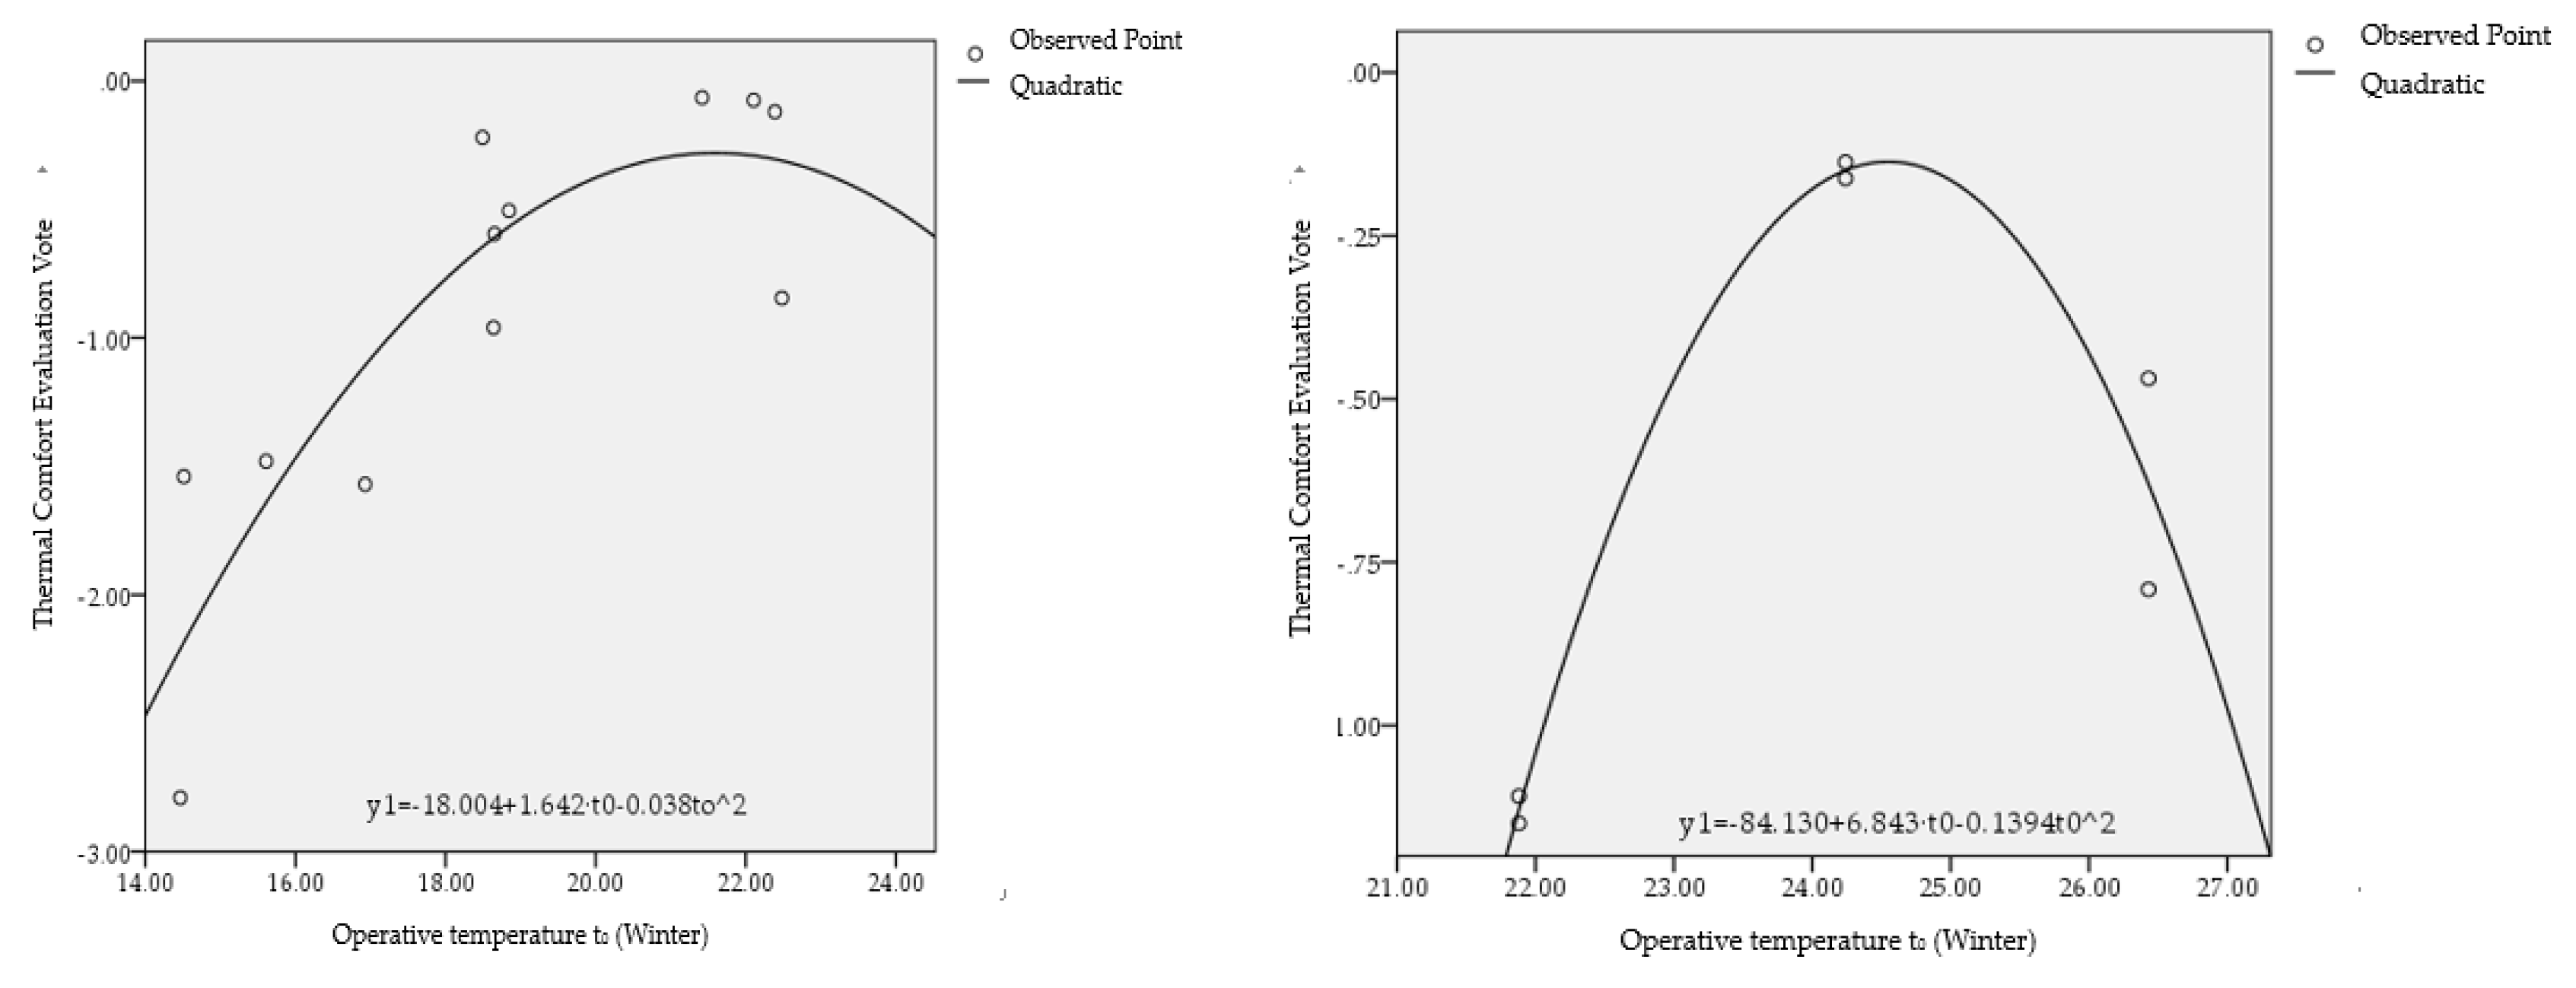
Figure 4.
Arrangement of lamps.
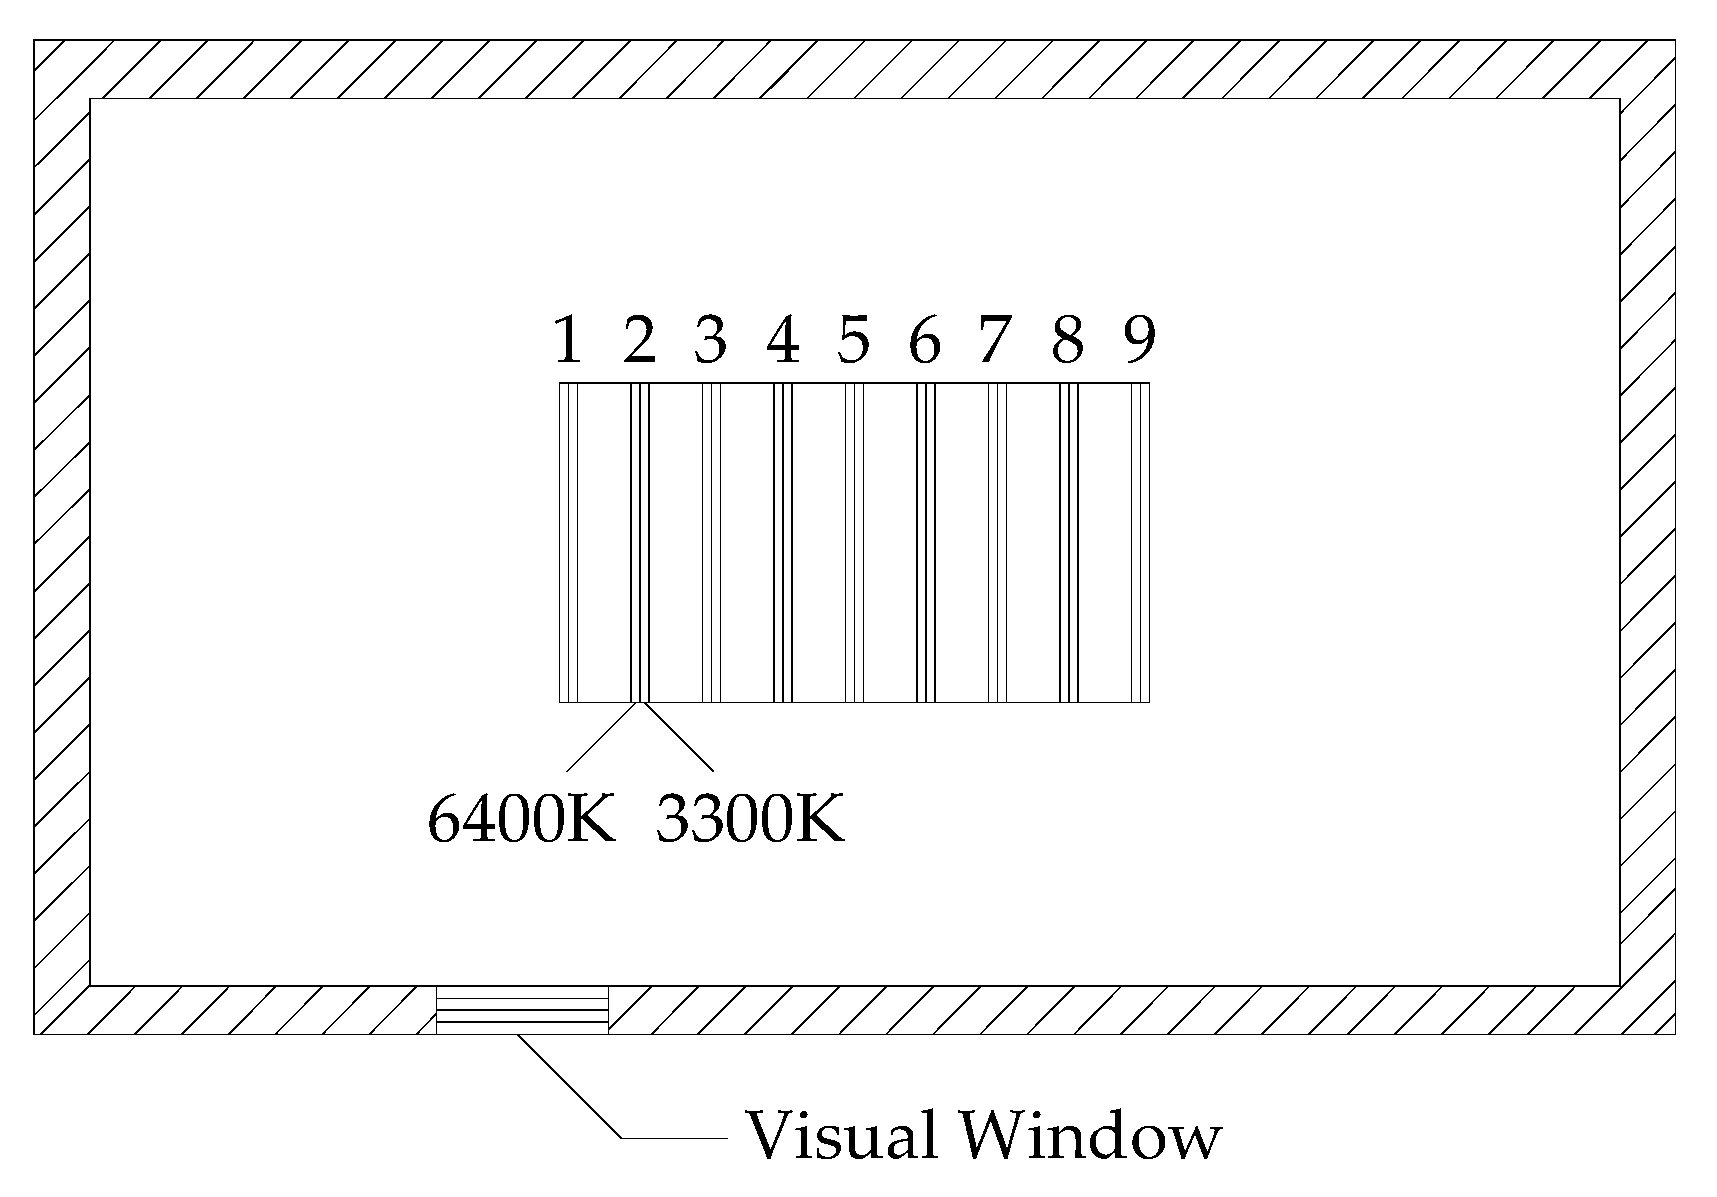
Figure 5.
Photometer.

Figure 6.
Luminous comfort evaluation vote.
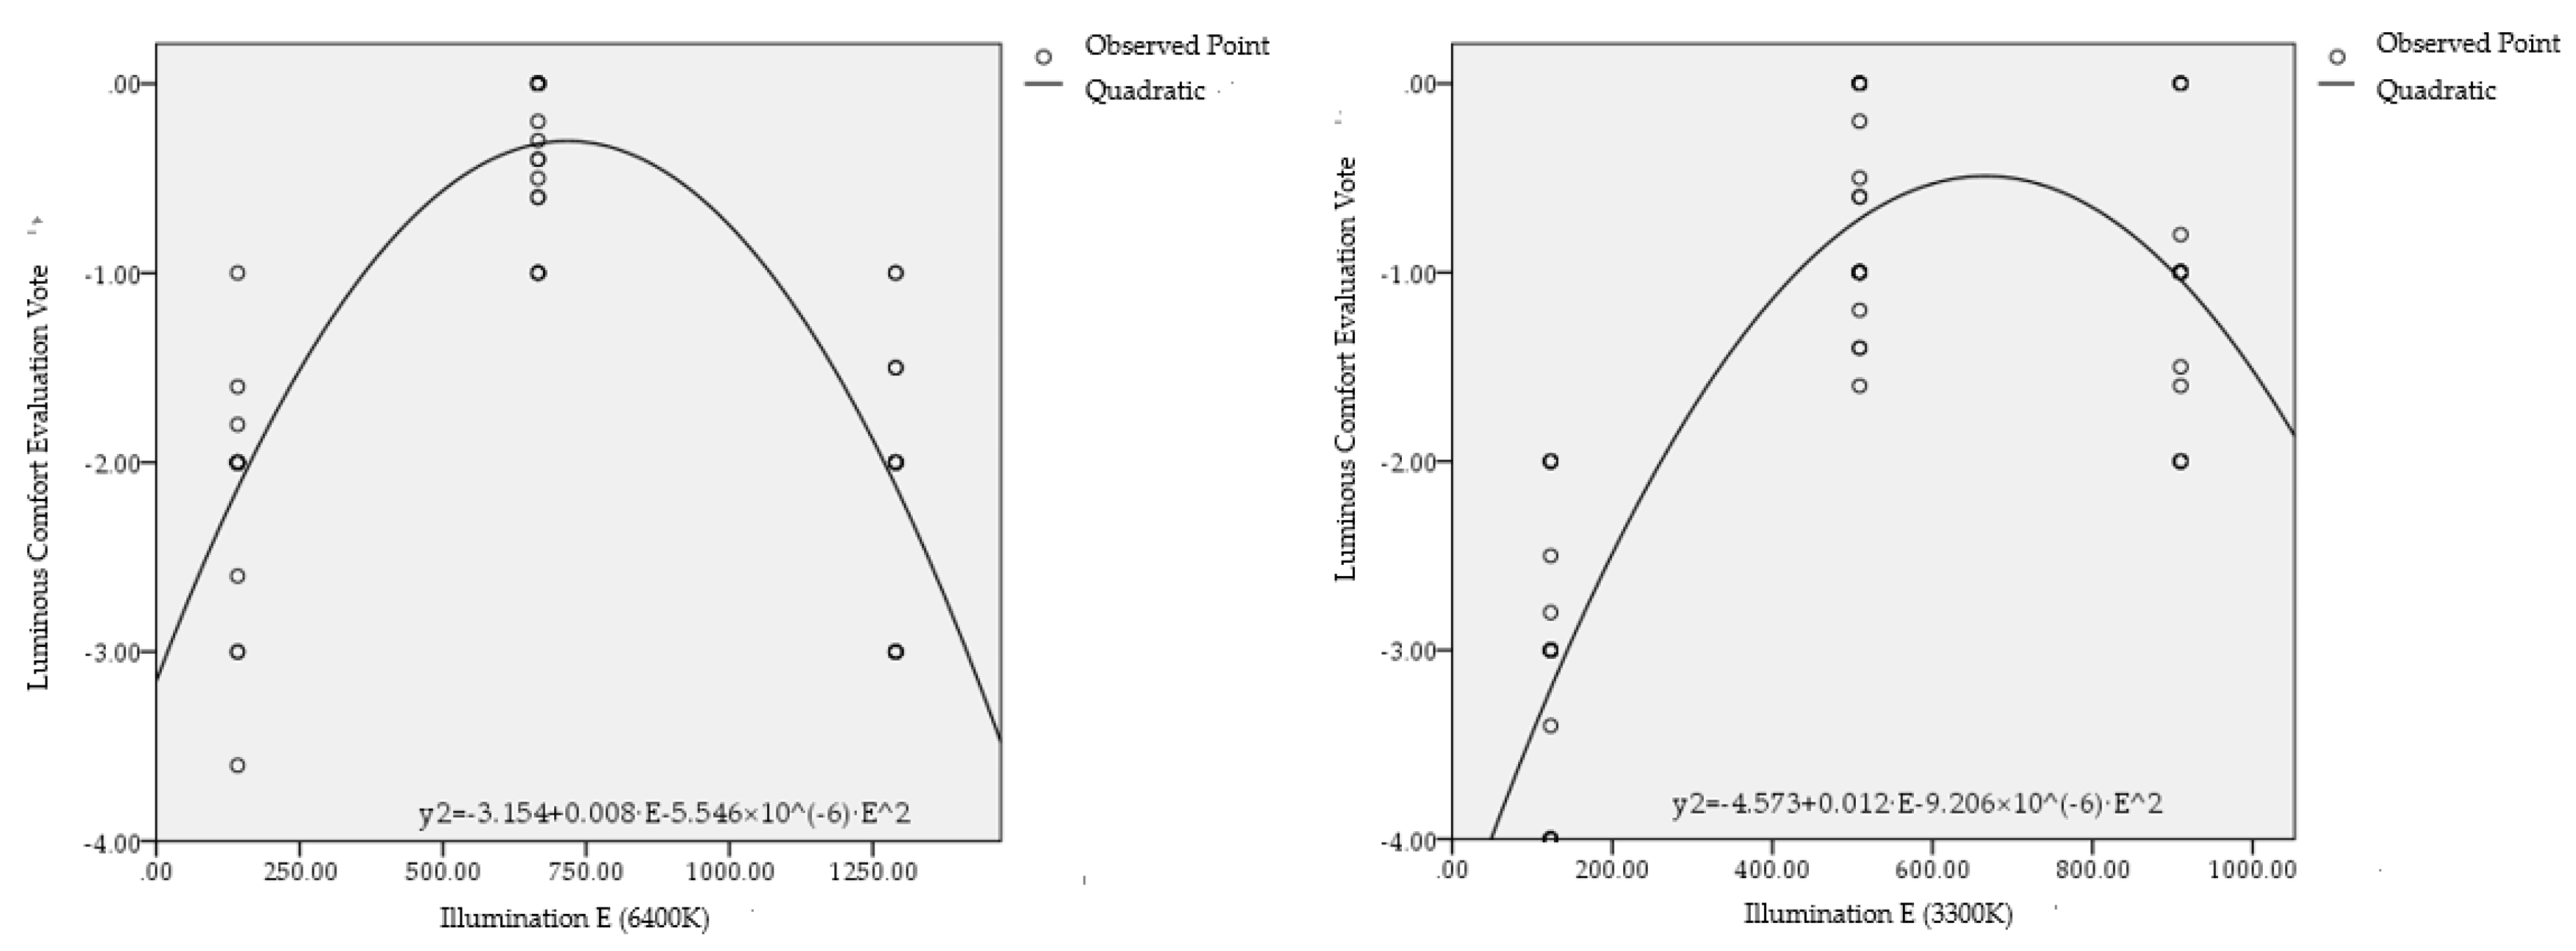
Figure 7.
Sound level meter.
Figure 8.
Acoustic comfort evaluation vote.
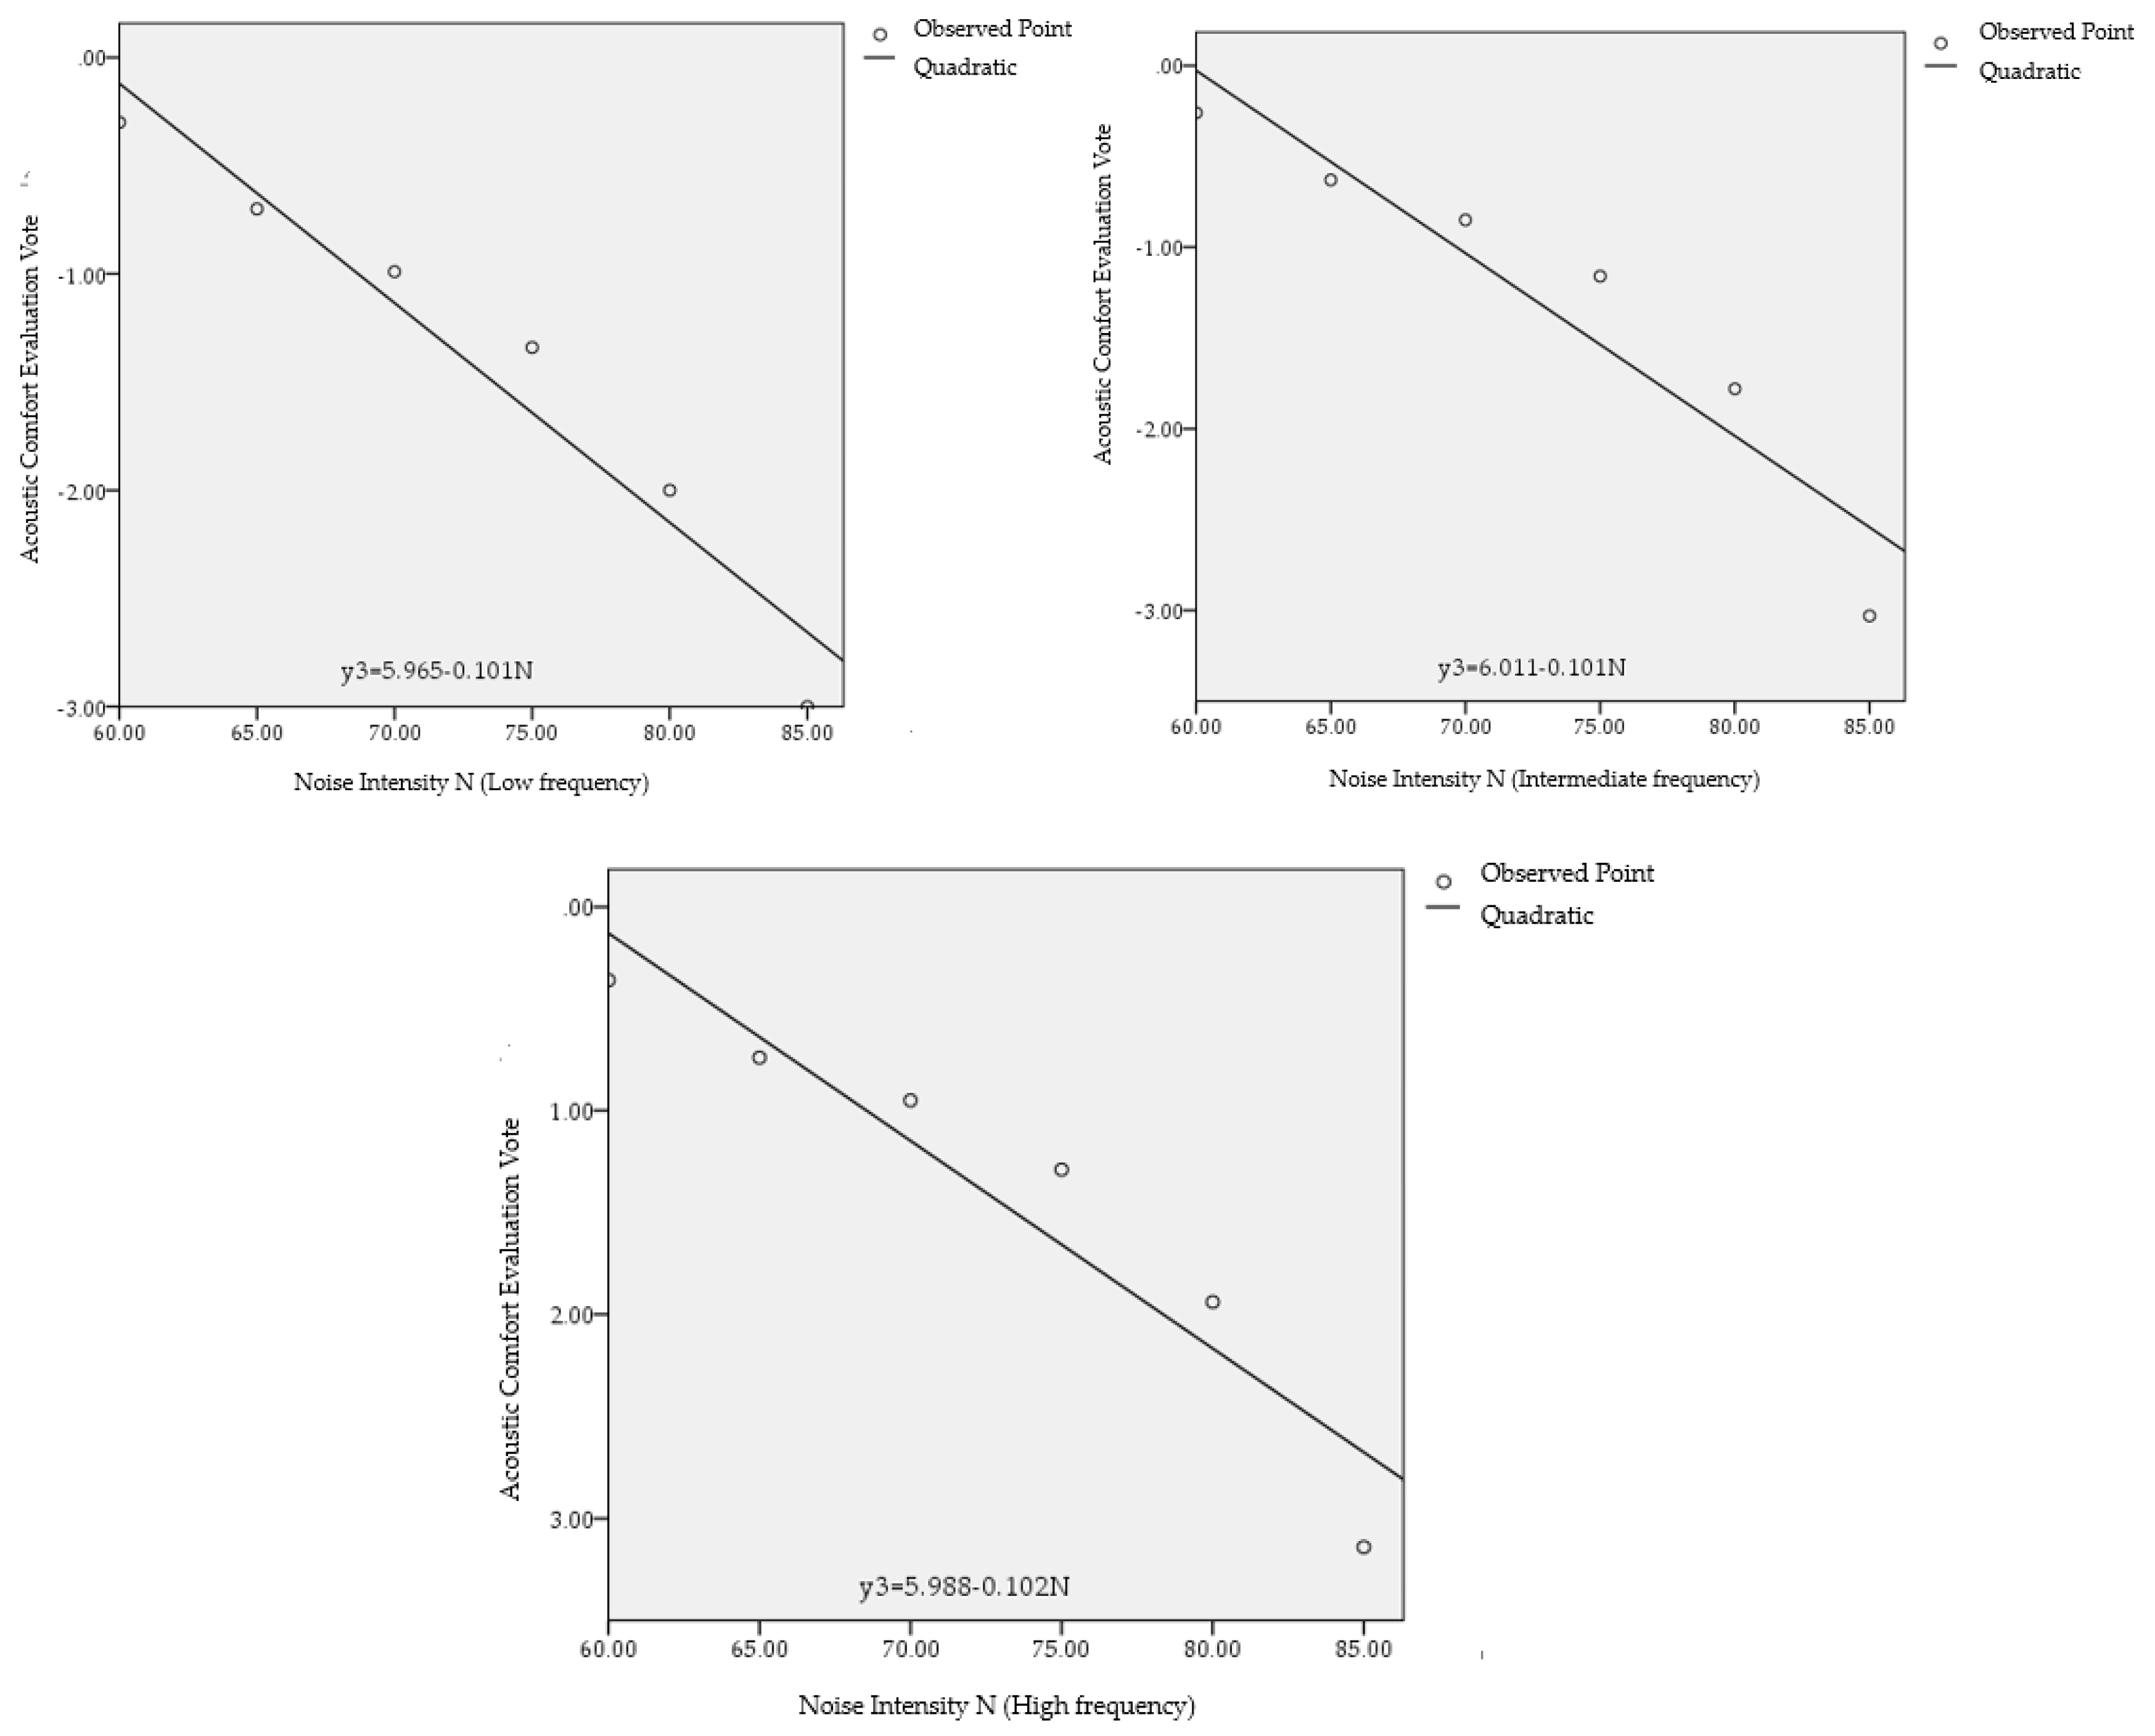
Figure 9.
Non-dimensional function curve of thermal comfort (Winter/Summer).

Figure 10.
Non-dimensional function curve of luminous comfort (3300 K/6400 K).

Figure 11.
Non-dimensional function curve of acoustic comfort (low frequency/intermediate frequency/high frequency).
Figure 11.
Non-dimensional function curve of acoustic comfort (low frequency/intermediate frequency/high frequency).
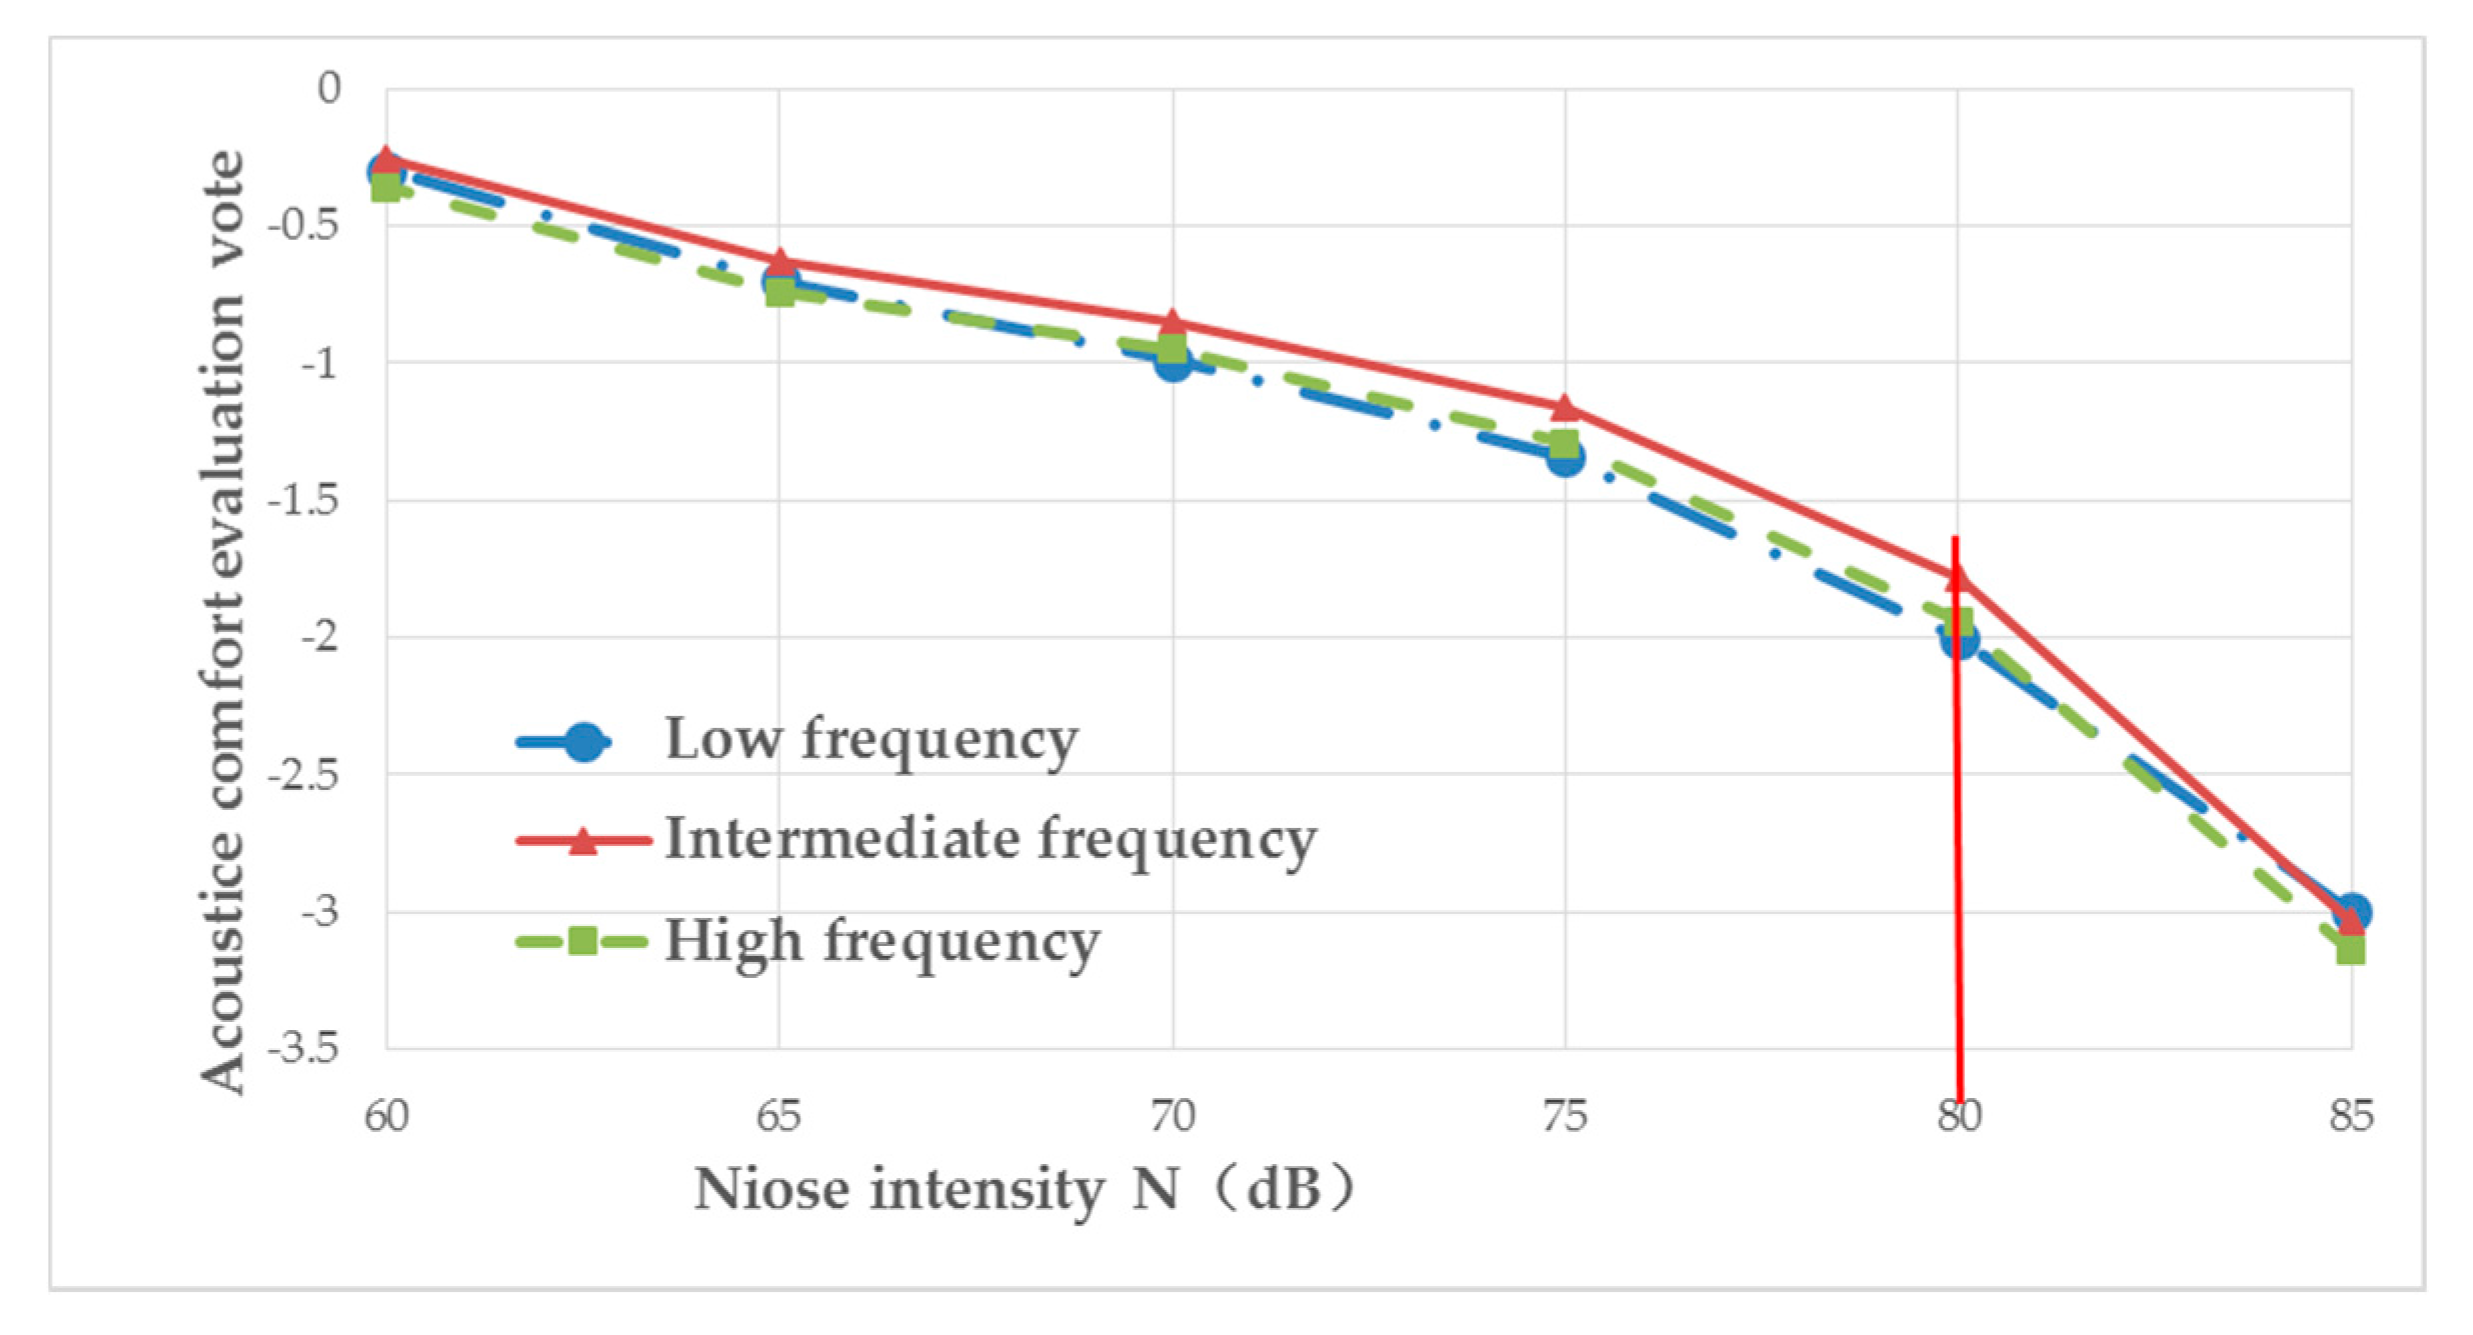
Figure 12.
The corresponding predicted overall comfort vote (POCV) value of noise and illumination at different temperature: (a) Winter; (b) Summer.
Figure 12.
The corresponding predicted overall comfort vote (POCV) value of noise and illumination at different temperature: (a) Winter; (b) Summer.
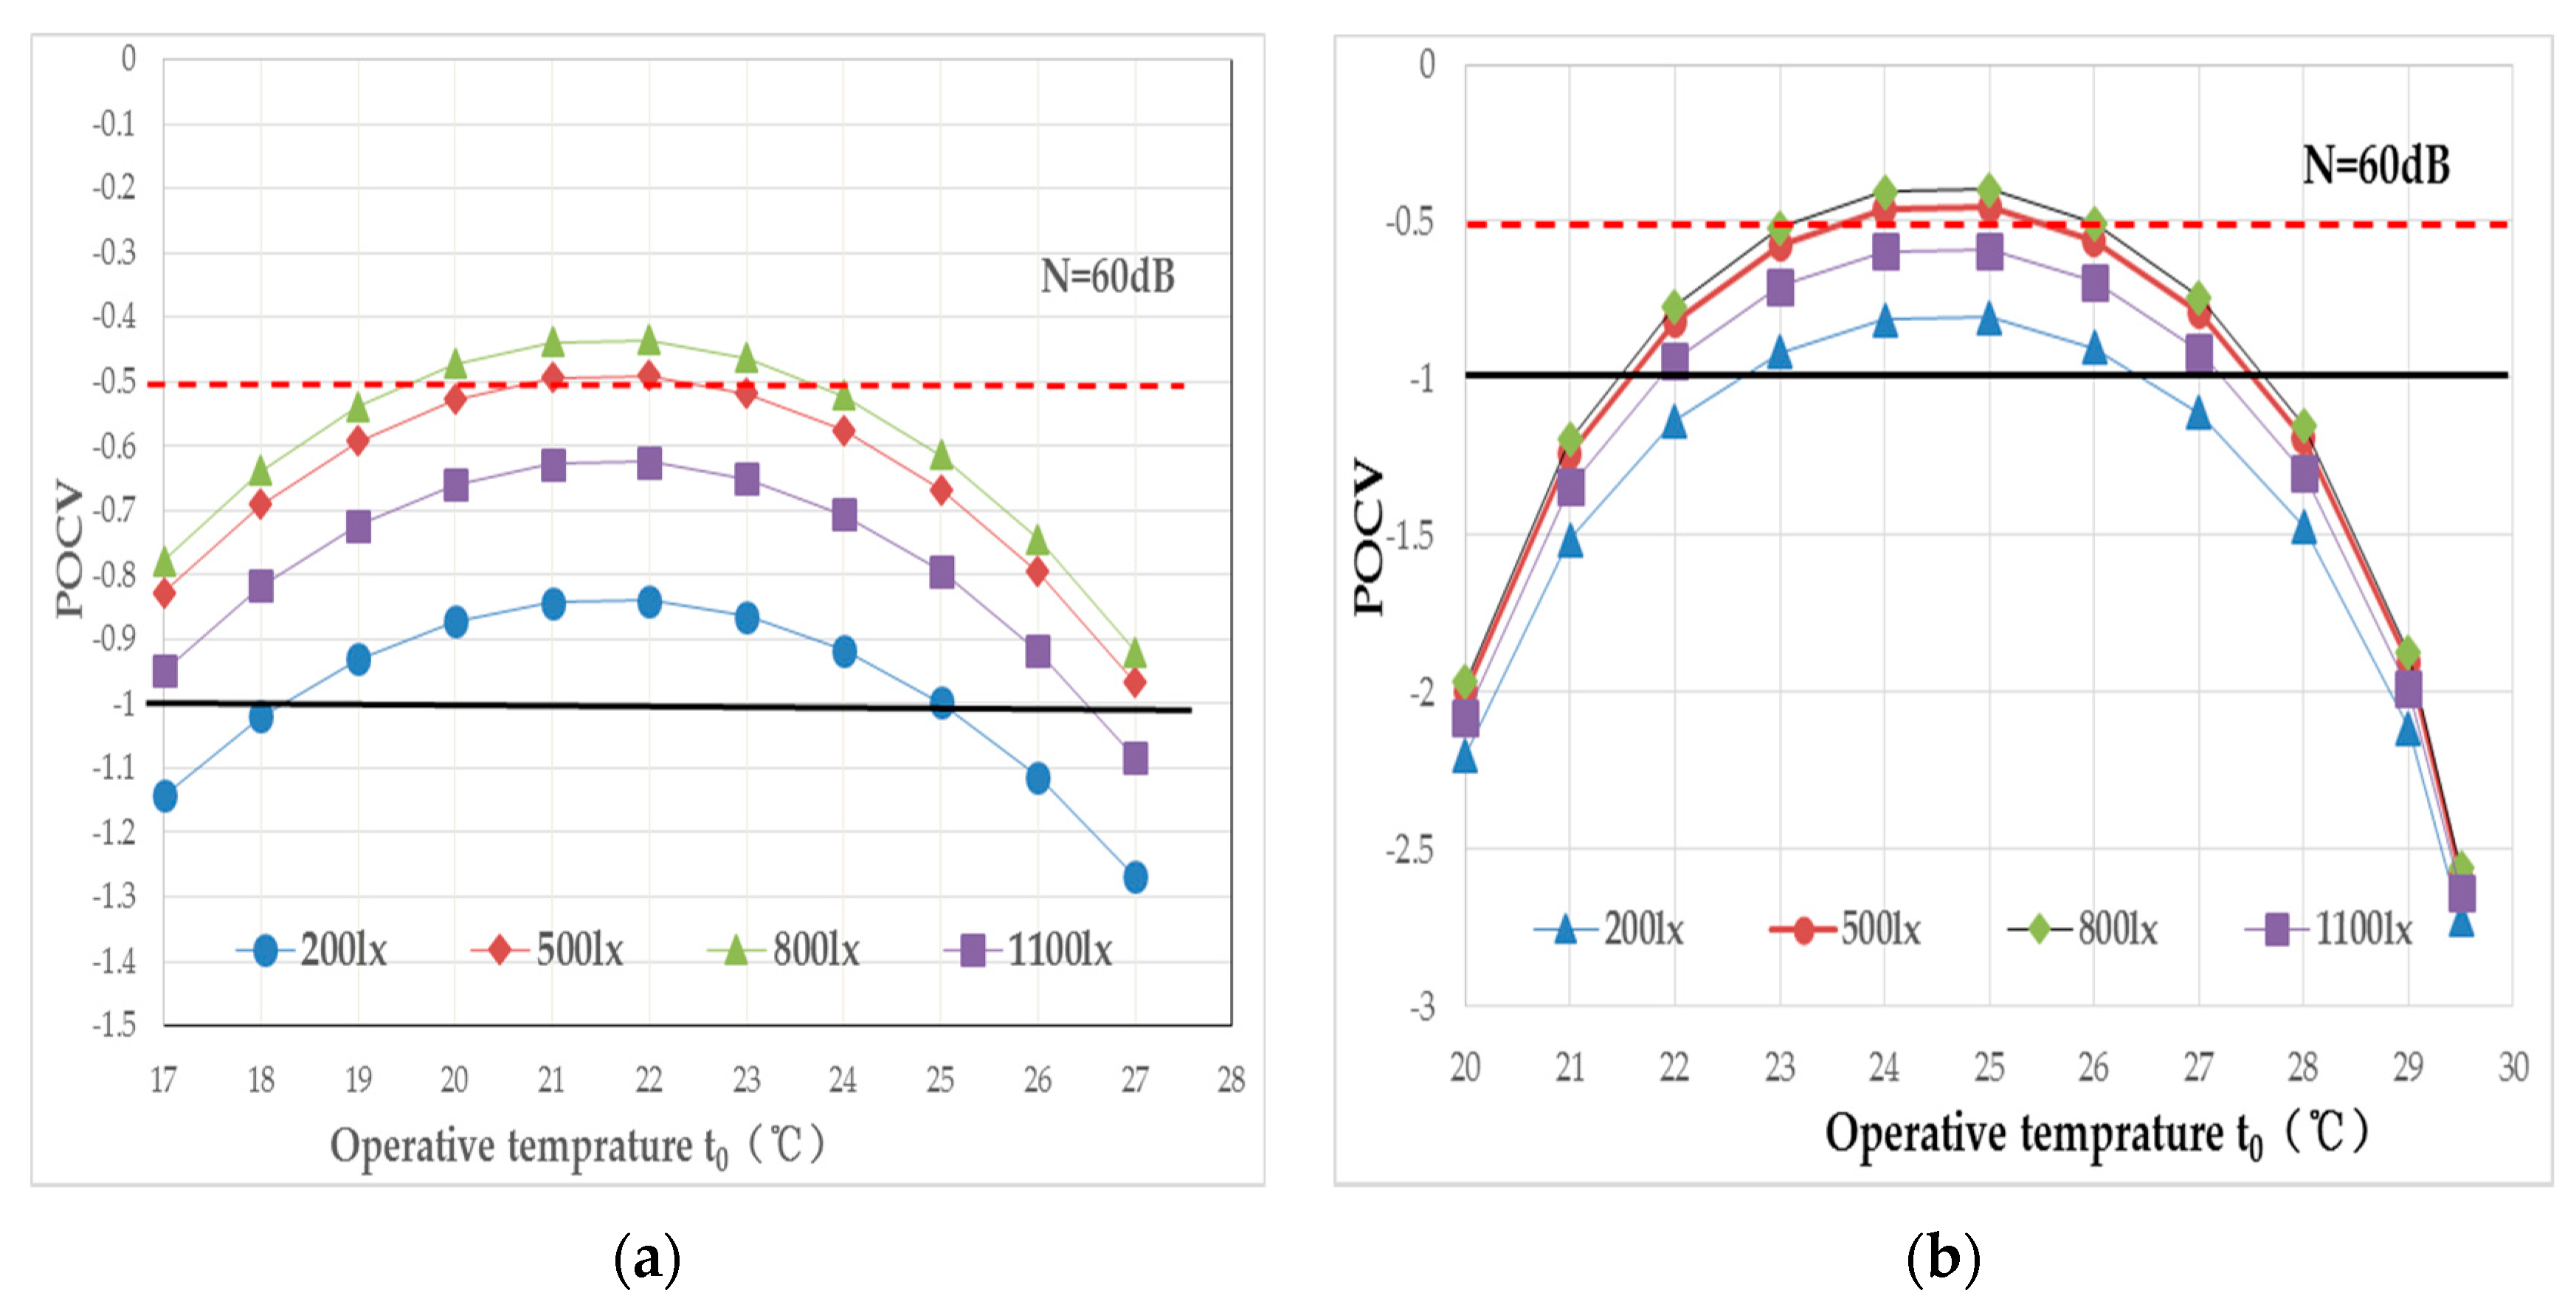
Figure 13.
The corresponding POCV value of operative temperature and noise at different illumination: (a) Winter; (b) Summer.
Figure 13.
The corresponding POCV value of operative temperature and noise at different illumination: (a) Winter; (b) Summer.
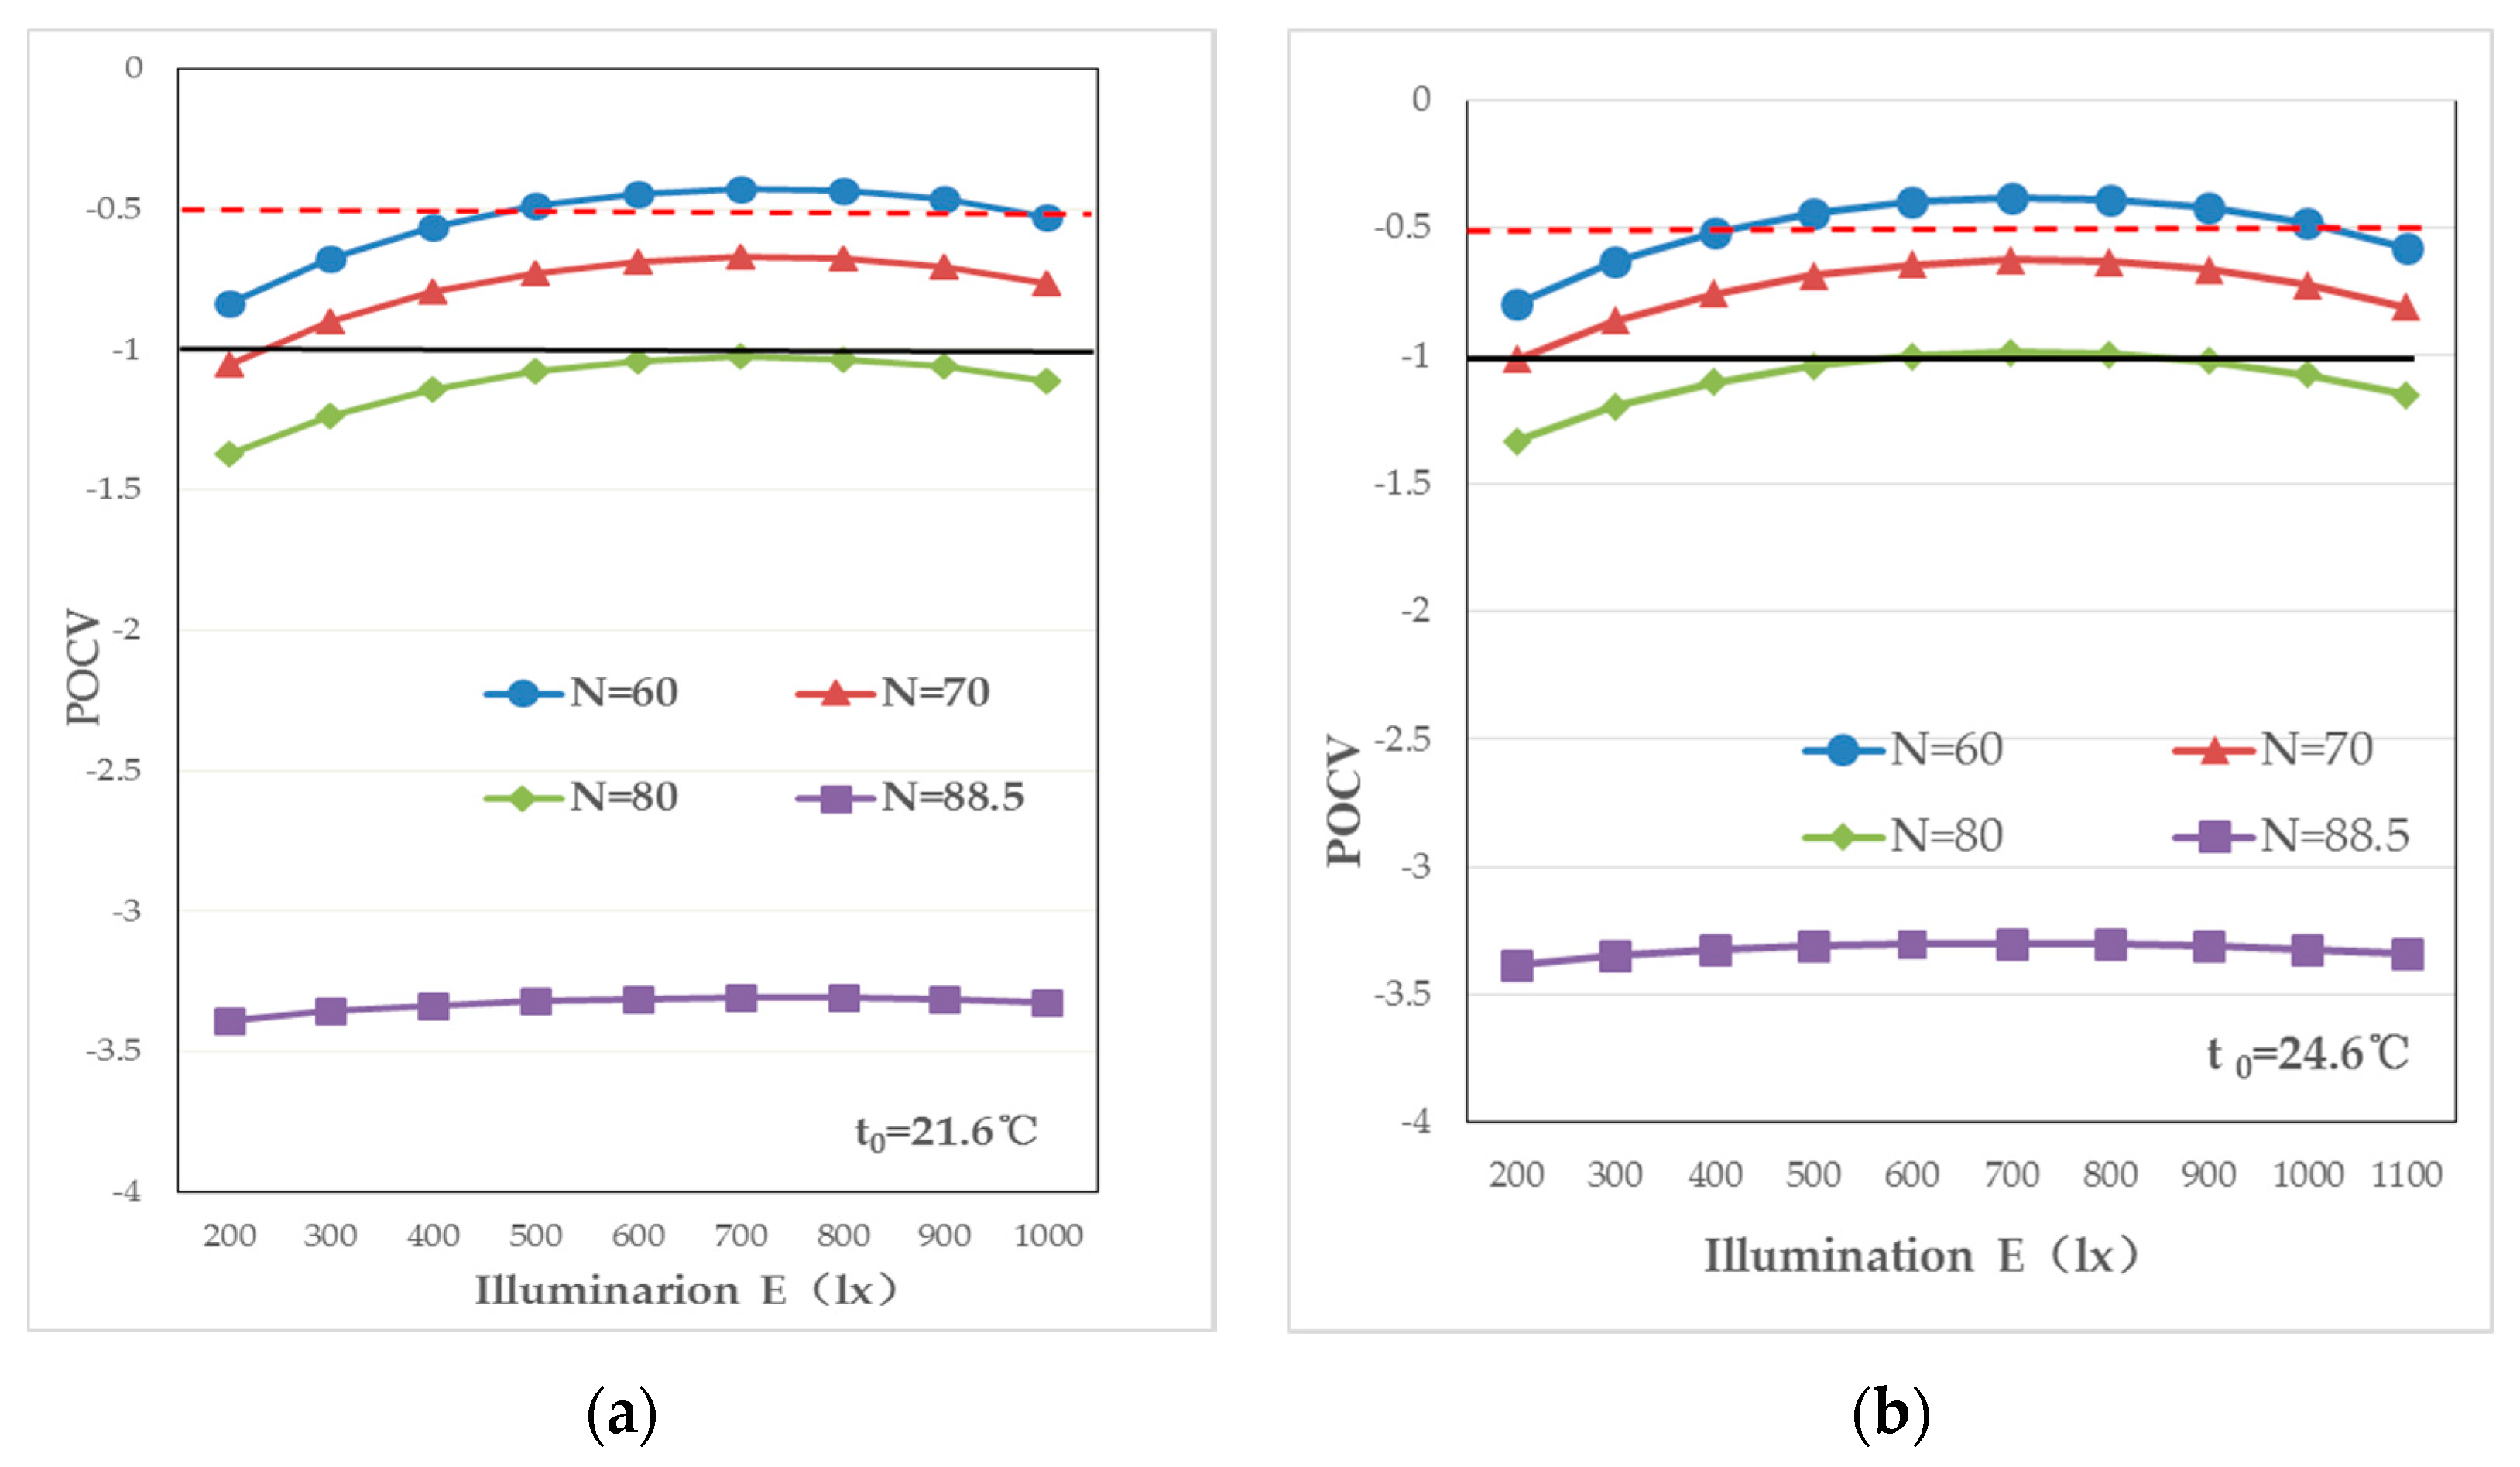
Figure 14.
Corresponding POCV value of temperature and illumination at different noises intensity: (a) Winter; (b) Summer.
Figure 14.
Corresponding POCV value of temperature and illumination at different noises intensity: (a) Winter; (b) Summer.


Table 1.
The evaluation index of thermal environment, luminous environment, acoustic environment, and overall environment correspond to the comfort of physical stimulation.
Table 1.
The evaluation index of thermal environment, luminous environment, acoustic environment, and overall environment correspond to the comfort of physical stimulation.
| Cx | 0 | −1 | −2 | −3 | −4 |
|---|---|---|---|---|---|
| Thermal Comfort | Comfort | Slightly Uncomfort | Uncomfort | Very Uncomfort | Unbearable |
| Luminous Comfort | Neutral | Slightly Brighter (Dim) | Bright (Dark) | Very Bright (Dark) | Unbearable Bright (Dark) |
| Acoustic Comfort | Comfort | Slightly Uncomfort | Uncomfort | Very Uncomfort | Unbearable (Caused by noise) |
| Overall Comfort | Comfort | Slightly Uncomfort | Uncomfort | Very Uncomfort | Unbearable |
Note: the above evaluation index value can be taken to a decimal point.
Table 2.
Piecewise function of non-dimensional acoustic environment.
| Noise Intensity | ||
|---|---|---|
| <80 dB | >80 dB | |
| Low frequency | y3 = 4.590–0.081 N | y3 = 14–0.2 N |
| Intermediate frequency | y3 = 4.062–0.071 N | y3 = 18.22–0.25 N |
| High frequency | y3 = 4.138–0.074 N | y3 = 17.26–0.24 N |
Table 3.
Weight allocation of two pairwise comparison and importance ratio Cij.
| Binary Weight Difference | Weight of i | Weight of j | Cij |
|---|---|---|---|
| 0 | 50 | 50 | 1 |
| 30 | 65 | 35 | 1.8571 |
| 50 | 75 | 25 | 3 |
| 90 | 95 | 5 | 19 |
Table 4.
The judgment matrix.
| B1 | B2 | B3 | |
|---|---|---|---|
| B1 | 0.5 | 0.61 | 0.57 |
| B2 | 0.39 | 0.5 | 0.46 |
| B3 | 0.43 | 0.54 | 0.5 |
Table 5.
Calculation results of row column geometric mean contrast legal value.
| Heat | Light | Sound | Row Geometric Mean | ||
|---|---|---|---|---|---|
| heat | 0.5 | 0.61 | 0.57 | 0.5581 | 0.41779 |
| light | 0.39 | 0.5 | 0.46 | 0.4476 | 0.26757 |
| sound | 0.43 | 0.54 | 0.5 | 0.4878 | 0.31464 |
| Column geometric mean | 0.437691 | 0.5481484 | 0.5080045 |
Table 6.
Model verification data results.
| TCEV | LCEV | ACEV | C0 | POCV | |
|---|---|---|---|---|---|
| Male | −1 | −0.5 | 0 | −1 | −0.70608209 |
| −1 | 0 | −1 | −1 | −0.89439556 | |
| −1.9 | −1.1 | −0.3 | −1.2 | −1.35157722 | |
| −1 | −2 | 0 | −1 | −1.11519633 | |
| Female | −2 | −1 | −0.5 | −3 | −1.42942293 |
| −2 | 0 | 0 | −1 | −1.12996168 | |
| −2 | −2 | −0.8 | −1.5 | −1.72986429 | |
| −3.1 | −1 | −1.2 | −2.3 | −2.28345767 | |
| −3 | −1 | −1 | −2 | −2.16684508 |
C0 stands for overall comfort evaluation value.
Table 7.
Correlation analysis results.
| Sample Number | Pearson | Kendall | Spearman |
|---|---|---|---|
| 9 | 0.639 | 0.730 ** | 0.853 ** |
Note: ** When the confidence level is 0.01, the correlation is significant.
© 2017 by the authors. Licensee MDPI, Basel, Switzerland. This article is an open access article distributed under the terms and conditions of the Creative Commons Attribution (CC BY) license (http://creativecommons.org/licenses/by/4.0/).
Share and Cite
MDPI and ACS Style
Guo, T.; Hu, S.; Liu, G. Evaluation Model of Specific Indoor Environment Overall Comfort Based on Effective-Function Method. Energies 2017, 10, 1634. https://doi.org/10.3390/en10101634
AMA Style
Guo T, Hu S, Liu G. Evaluation Model of Specific Indoor Environment Overall Comfort Based on Effective-Function Method. Energies. 2017; 10(10):1634. https://doi.org/10.3390/en10101634
Chicago/Turabian StyleGuo, Tieming, Songtao Hu, and Guodan Liu. 2017. "Evaluation Model of Specific Indoor Environment Overall Comfort Based on Effective-Function Method" Energies 10, no. 10: 1634. https://doi.org/10.3390/en10101634
Note that from the first issue of 2016, this journal uses article numbers instead of page numbers. See further details here.