5.1. Thermal Performance Evaluation of the RFIRHP
In this study, the thermal performance of three types of RFIRHPs with different filler materials of the internal void space of the RFIRHP was compared and evaluated using the results from the experiment in which a cooling plate was used to solve the lower-part thermal insulation problem of the RFIRHP. The steady-state experiment was conducted according to the methodology of the experiment; the mean value of the measured values at each measuring point during the steady-state for over 12 h were considered as the experimental results.
As can be seen from the experimental results, all experiments satisfied the target condition that was required in the experiment (
Table 2 and
Table 3). In addition, under the control of the heat production system, all experiments satisfied the target condition and maintained their steady state for over 12 h. The heat balance calculation based on the experimental configuration shows that the heat balance that was removed from the upper and lower cooling plates compared to the amount of heat supplied to the sample panel satisfies the heat balance from −1.6 W to +0.9 W in all experiments (
Table 3). Based on these results, it can be confirmed that the experiments in steady-state condition satisfying the target condition were correctly performed for all cases.
To evaluate the efficiency of a radiant panel, two criteria are simultaneously considered, namely the upward thermal output and the downward thermal output of the panel, for the same heat supply. When the same amount of heat is supplied to various types of radiant panels, the higher the thermal output of a panel toward the direction of the room-to-be-heated and the lower the downward thermal output, the more efficient that radiant panel will be evaluated as, and the more advantageous in terms of energy conservation it will be considered. Therefore, the EN 1264 standard recommends more than 90% efficiency of the radiant heating panel. The thermal performance of each type of RFIRHP that has been evaluated in this study was compared with all other thermal performances in terms of efficiency of the panel. The efficiency of the panel,
(%), is the ratio of the thermal output to the room to be heated to the total heat supplied to the panel, and may be described using the following equation:
The values of 0.0926
and 0.1667
were used for the upper and lower surface heat transfer resistances of the RFIRHP, respectively [
13]. As a result of evaluating the thermal performance of three types of RFIRHP, the efficiency of the sample panel that was not filled with a material (Alt1) was found to be the best, with an efficiency of 70.1% (
Table 4). The highest efficiency of the sample panel without any filler materials at the internal void space of the RFIRHP, is attributed to the fact that the air inside the raised floor acts as an insulation that is the same as that of the still air. On the other hand, the sample panel that was filled with perlite (Alt2) was evaluated to present the lowest efficiency (61.7%) among the three considered types of sample panels. In general, perlite is a material that is used for filling of the internal void space of the raised floor, in order to improve the experience of walking. Furthermore, perlite is considered to be a heat-insulating material. However, as a result of the evaluation through this experiment, when perlite was used as a filler material for the lower insulation of the RFIRHP, the filled perlite did not demonstrate a sufficiently satisfactory performance as an insulation. In contrast, when the panel was filled with urethane foam (Alt3), the efficiency was 69.3%, which is superior compared to that of the perlite.
The efficiency of the three types of RFIRHP is less than approximately 70%, even for the panel that was not filled with a material, rated as the best among the tested sample panels. The efficiency is below the value of 90% recommended by the existing standards. The sample panel filled with urethane foam had a thermal conductivity that was expected to satisfy the recommended efficiency. Nevertheless, it did not meet the recommended value, and showed even lower efficiency compared to that of the Alt1 panel, which was not filled with a material.
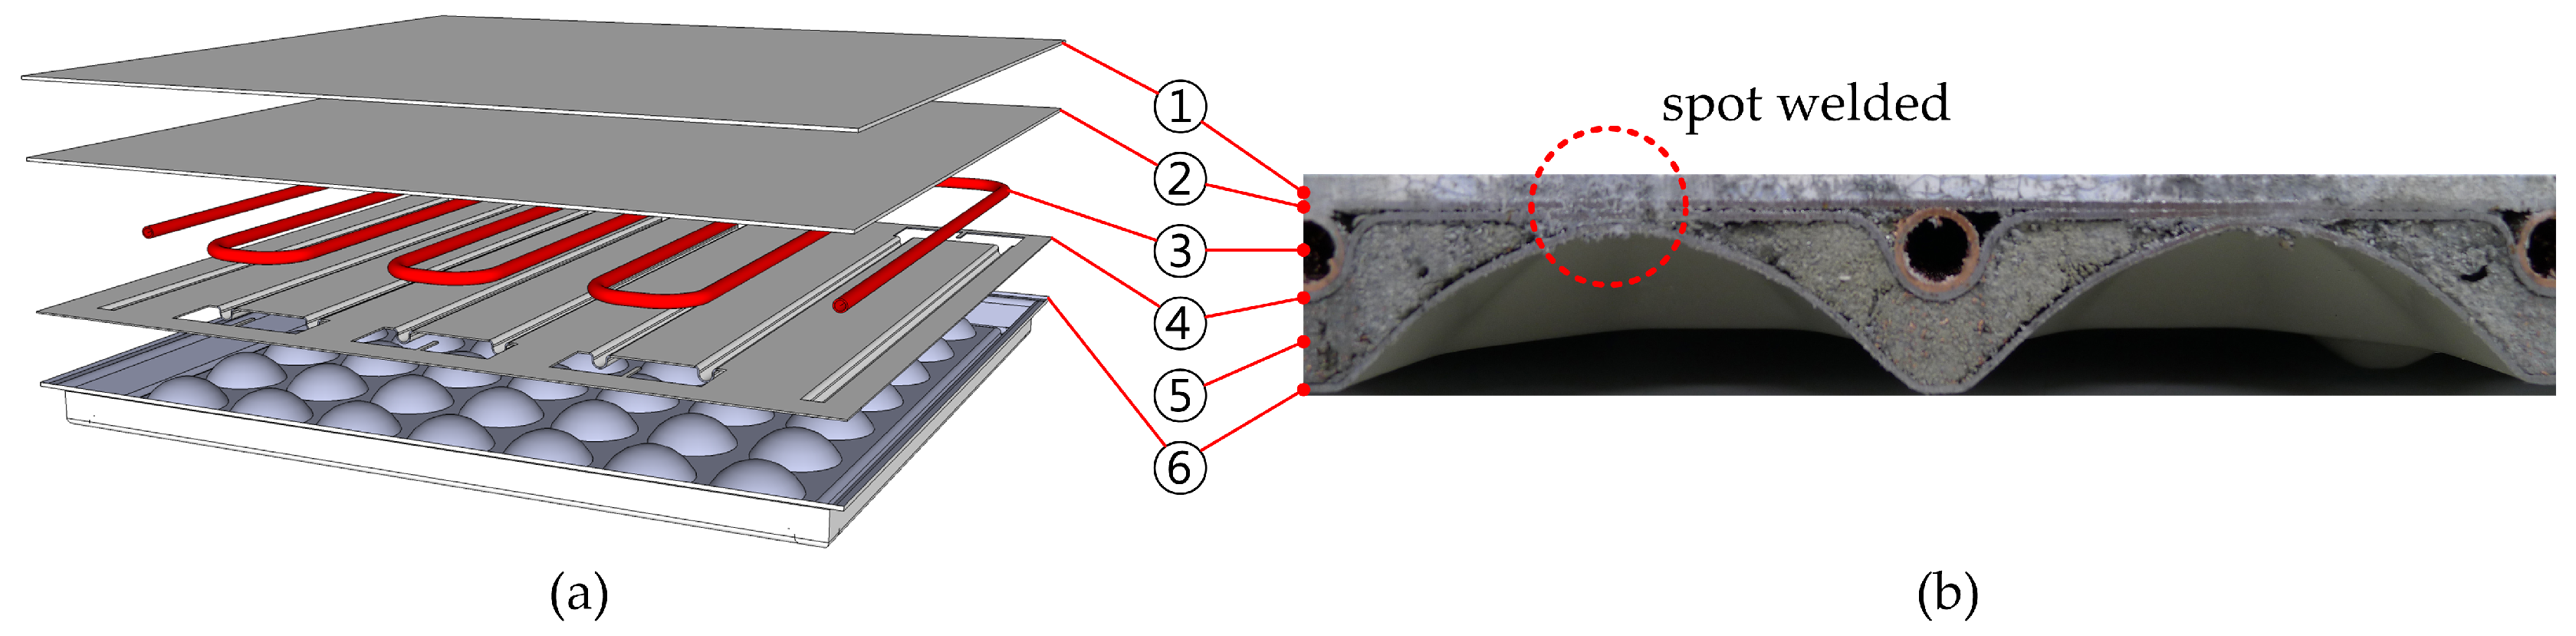
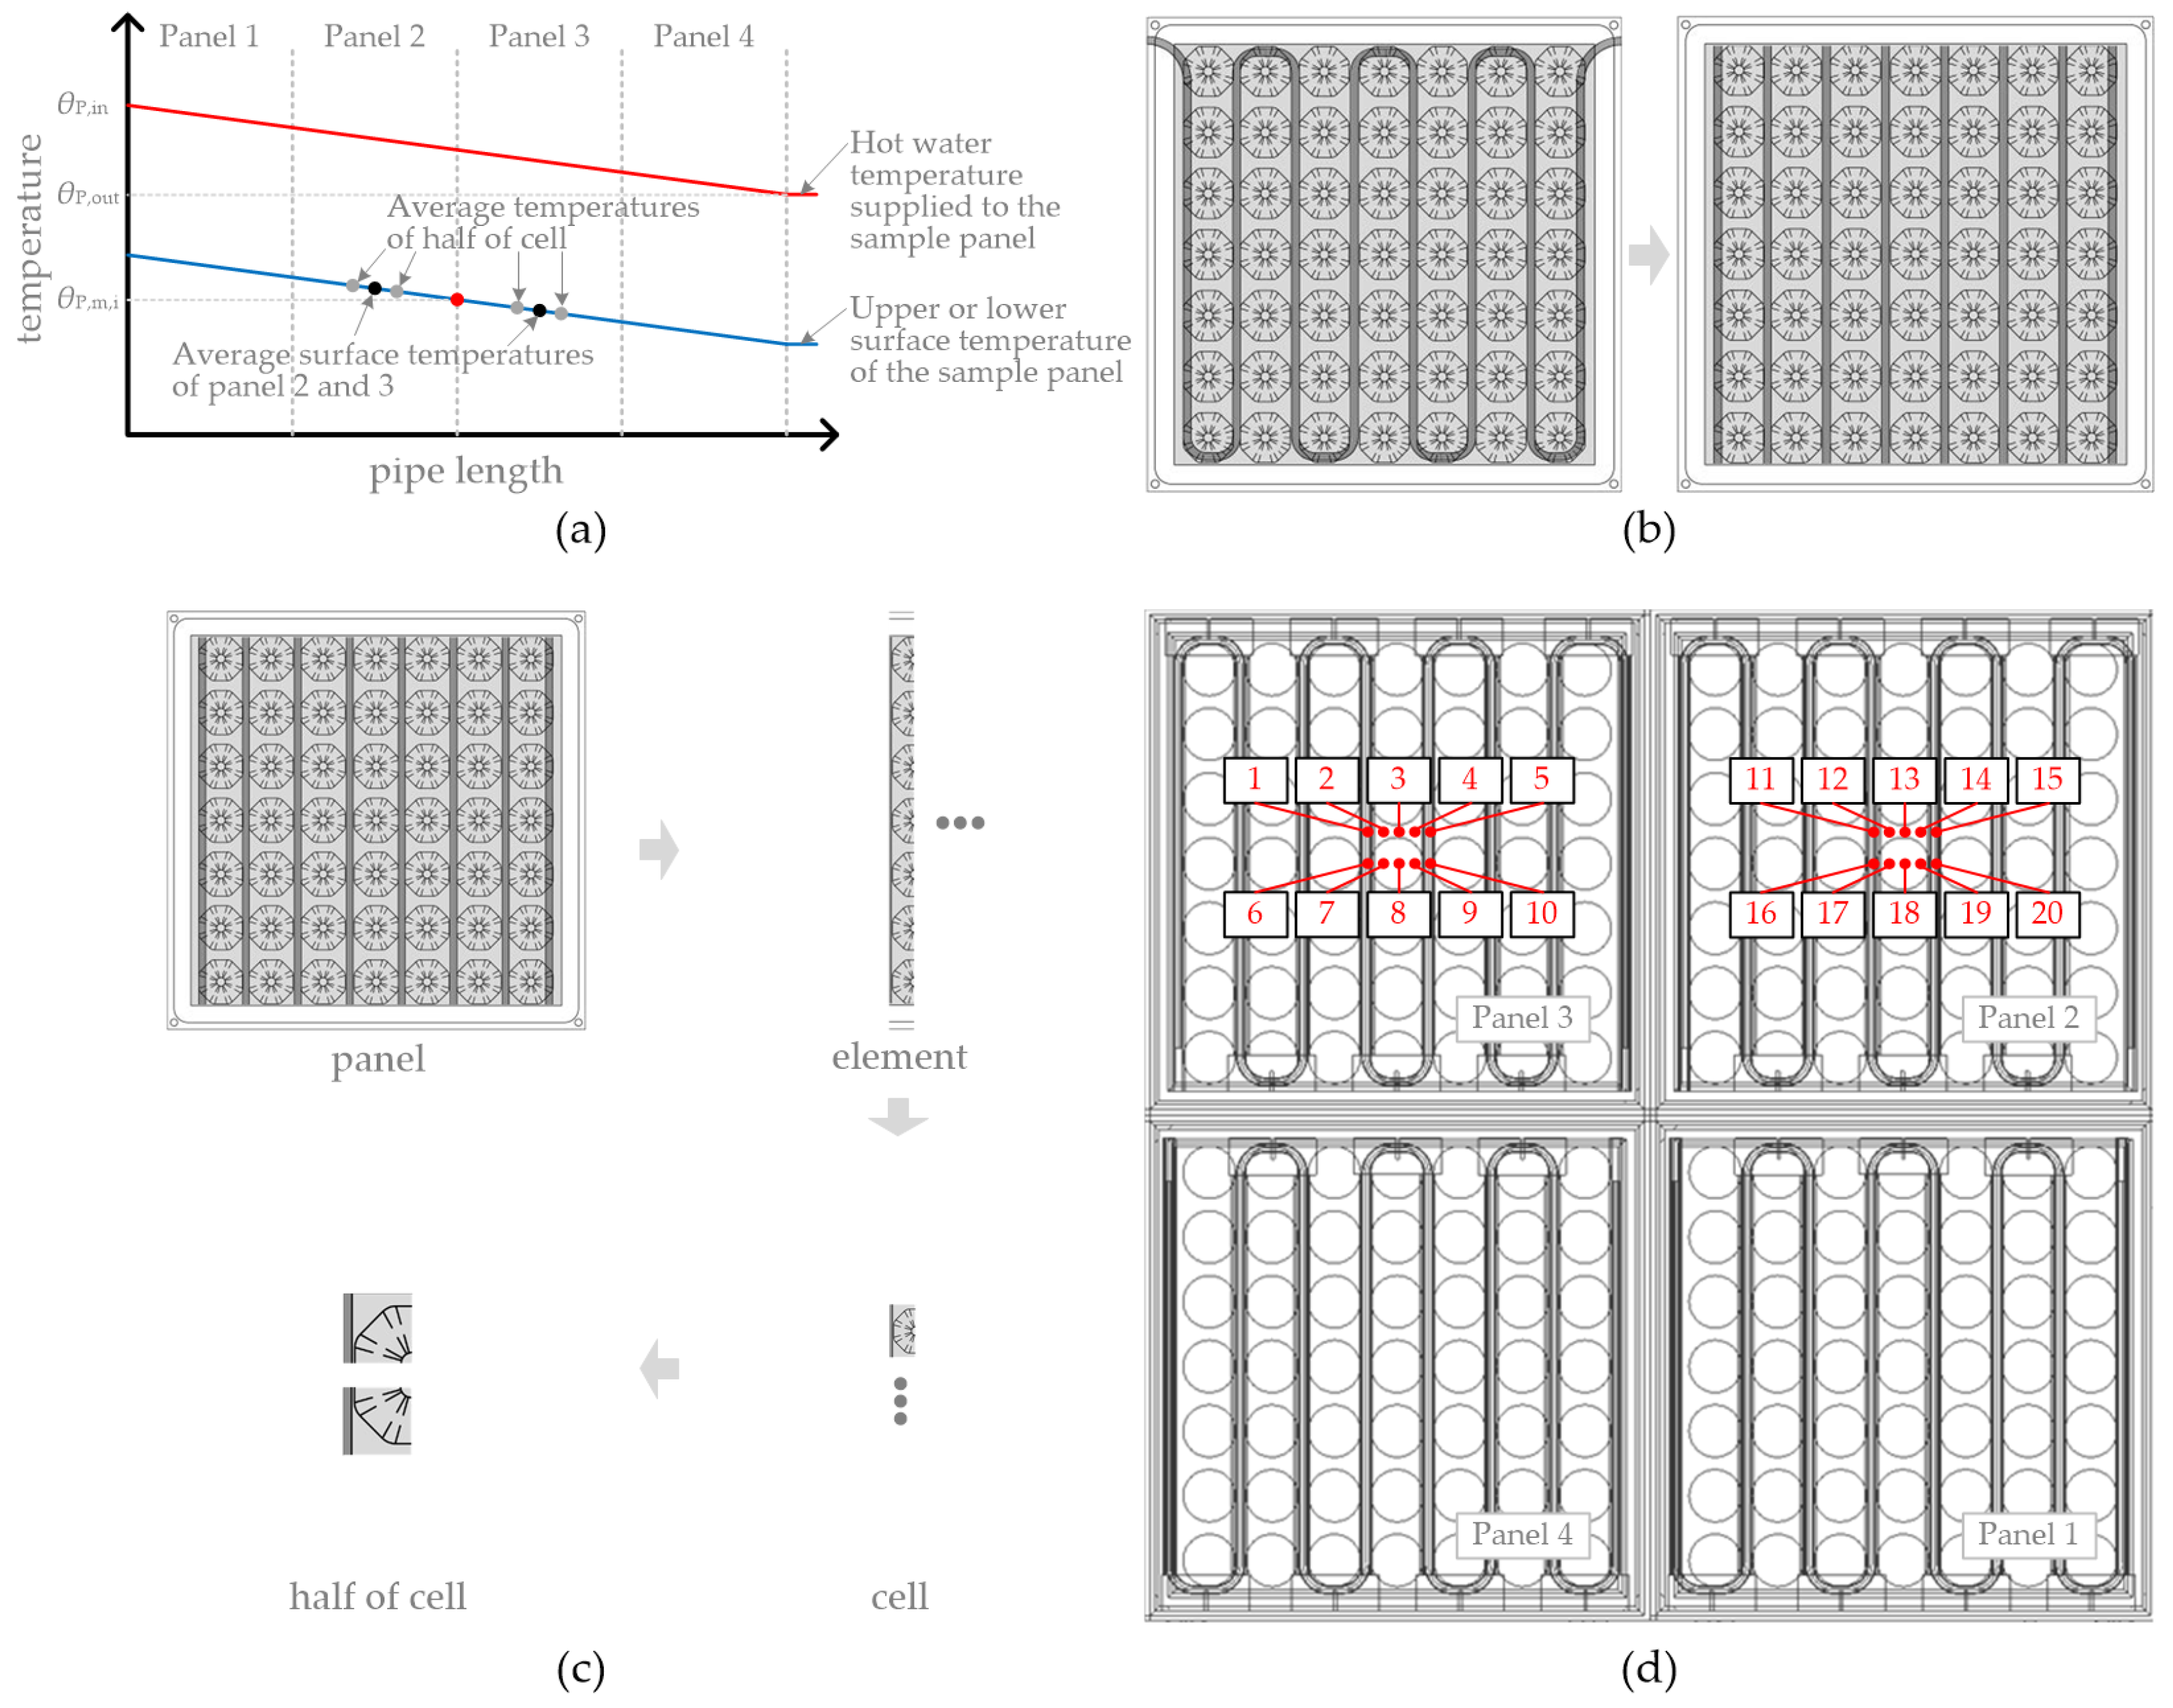
The raised floor that was used for the sample panels in this experiment was spot welded at the top and at the bottom panel surfaces owing to structural problems (
Figure 1b). The contact portion served as a thermal bridge to increase the downward thermal output of the panel. Therefore, it is necessary to review the design of the RFIRHP to eliminate this type of thermal bridge.
Apart from the fact that the efficiency of the panel that is recommended by the existing standards was not satisfied, there is a possibility that the downward thermal output of the RFIRHP was re-emitted to the upper part of the panel because of the interaction with the building structure below the radiant panel. Therefore, it is necessary to review the lower-part thermal insulation that is required for the RFIRHP, together with the influence of the downward thermal output on the facilities inside the raised floor.
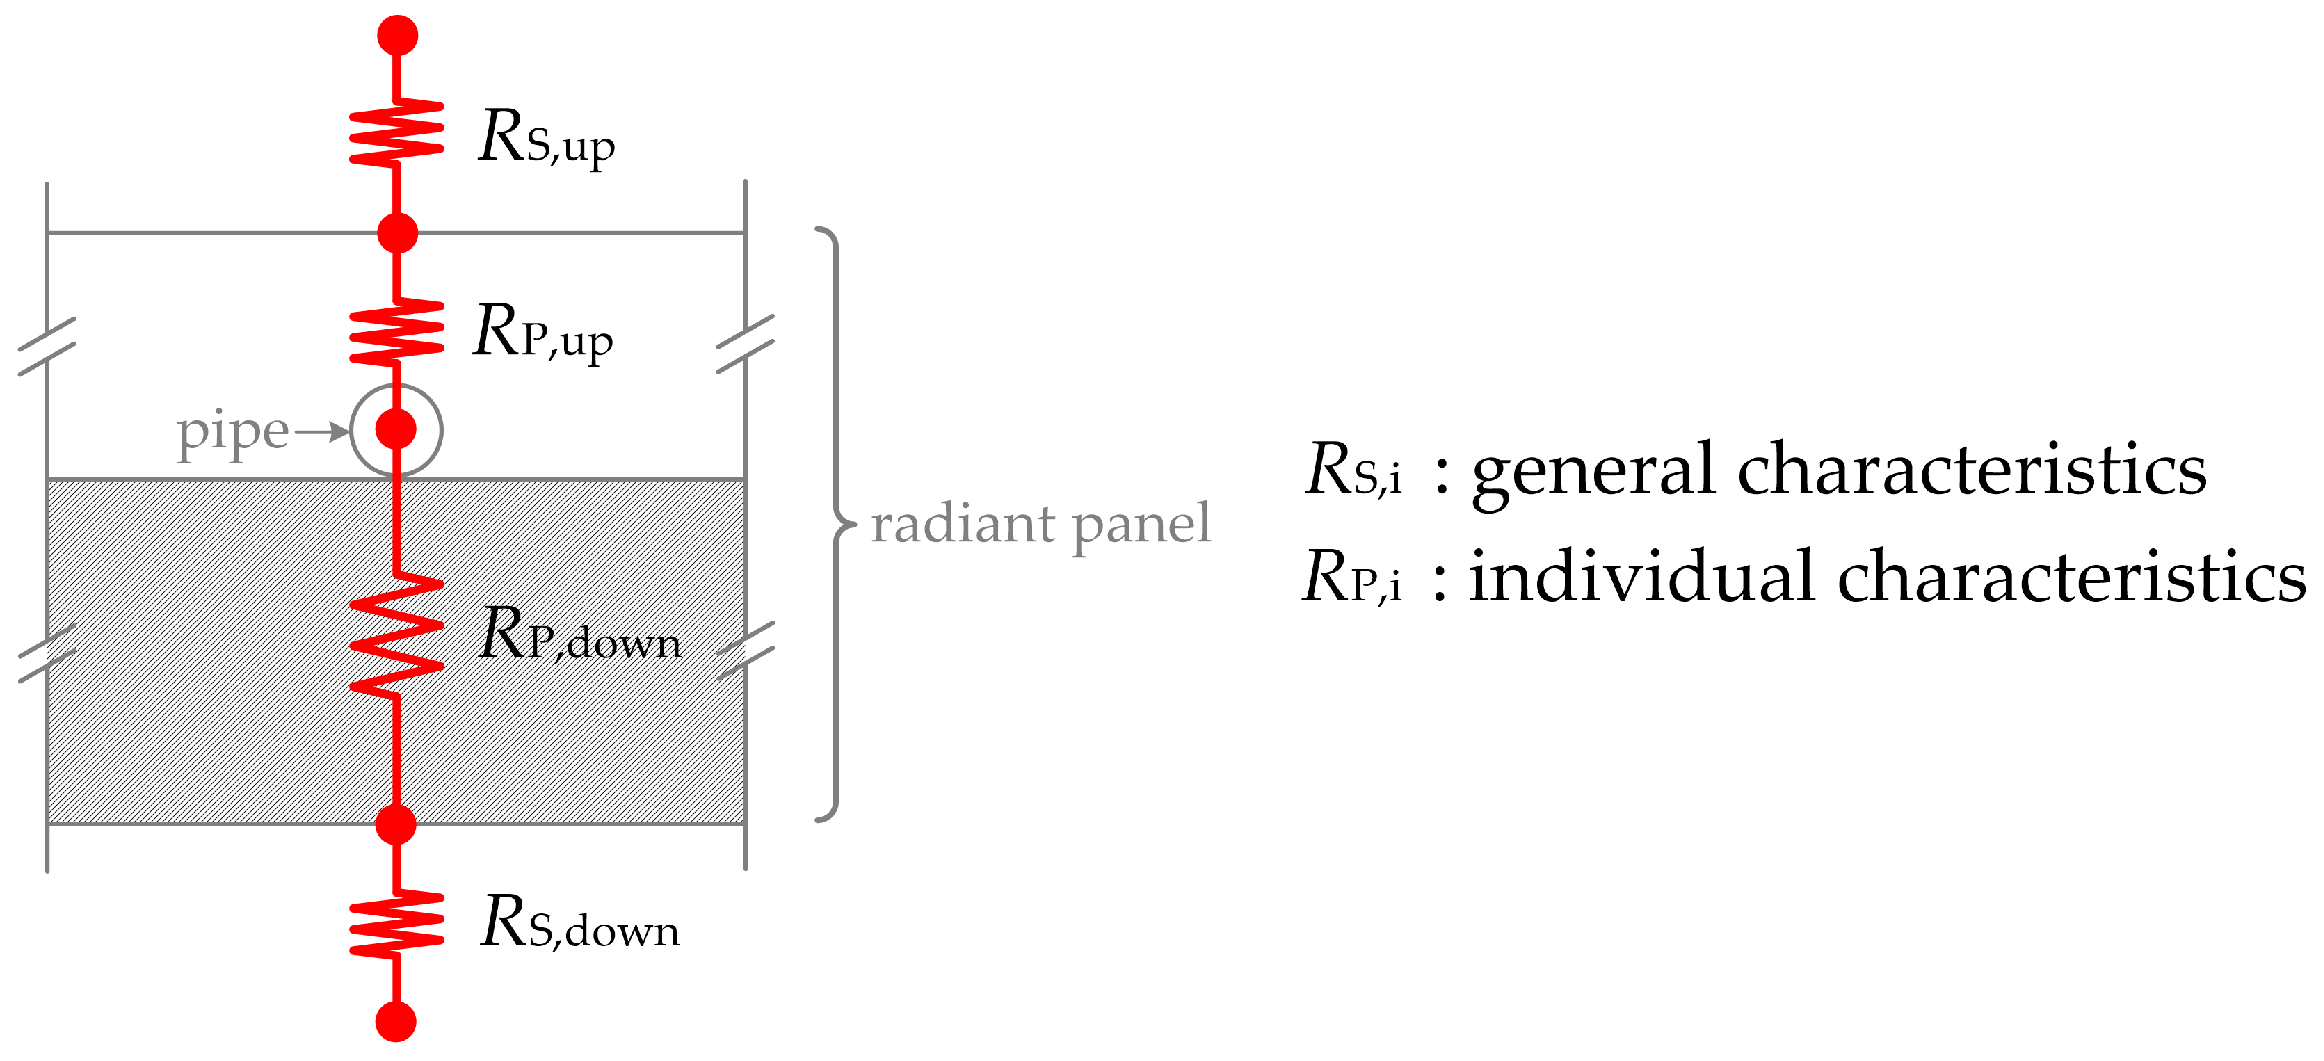
The structure and shape of the RFIRHPs that were evaluated in this study were the same for all cases; only the filler inside the panel was different. Therefore, the structure, layers, and materials, from the hot water to the upper surface of the panel of all sample panels were the same. Nevertheless, as a result of the experiment, the upward heat transfer resistance of each panel,
, presented a significant difference (
Table 4). This occurred because of the uncertainty in the assembly process of each sample panel, which was due to the resistance generated at the contact surfaces between the respective layers of the panel. Even for the same radiant panels, and under the same environmental conditions, there may be differences in the thermal output due to the uncertainty that may arise in the assembly process.
This can be an issue for the mass production performed after the thermal performance evaluation of the radiant panels, since the certification and the thermal output are determined by the specifications of the product. In general, product manufacturers devote significant attention to the sample panels submitted for testing and certification, in order to get a certification with the best specifications for their products. However, in the mass production process that follows, there is a high possibility that the attention devoted to the product production will decline. There is a relatively high possibility that the prefabricated radiant panels such as RFIRHPs will differ in performance when comparing products with the same design. This is due to the uncertainty in the assembly process, as discussed above. It can be a problem if there is a difference between the specifications and the performance of the actual products. Therefore, these questions deserve special attention during the assembling and production of panels.
As one example, the upper- and lower-surface heat transfer resistances of the radiant panel (upper 0.0926
, lower 0.1667
) [
13] were added to the upward and downward heat transfer resistances of the sample panel that was filled with urethane foam (Alt3), respectively. The upper characteristic curve (
) and the lower characteristic curve (
) of the sample panel that was filled with urethane foam (Alt3) is derived as follows:
This characteristic curve can be used to design the radiant system to yield the same characteristic curve as the one calculated via the method of the existing standard. For example, if the design set temperature is assumed to be 20
, the maximum thermal output of the panel would be 97.1
based on the experimental results; thus, the maximum supply water temperature of this panel would be 32.5
, according to Equation (
10). In addition, the characteristic curves can be used in the design of the radiant system, in terms of determining the maximum supply flow rate by using the upward and downward thermal output of the panel when determining the supply–return water temperature difference.
5.2. Comparison of the Results from the Modified Method and the Existing Method
In this study, the experiment was performed under the same target condition as the existing method to compare the results of the modified method with those of the existing method. Therefore, based on the results of the experiments performed in this study, we can obtain the experimental results of the existing standard by employing the existing method via Equations (
2)–(
4).
By adding the heat transfer resistance of the heat transfer layer (0.0985
) that was used in the experiment to upward heat transfer resistance of the radiant panel that resulted from the modified method, it is possible to derive the same characteristic curve as that derived from the experimental results of the EN 1264 standard.
Table 5 shows the gradient of the characteristic curve of the RFIRHP as derived from modified method, and the gradient of characteristic curve as calculated by employing the method of the EN 1264 standard.
By comparing the gradient of the characteristic curve that occurred from the two methods, we may observe that the gradient of the characteristic curve calculated by the existing method was 7.2–14.9% greater than that derived from the modified method. This means that the thermal performance of the radiant heating panel that was derived from the existing method is higher than the thermal performance of the radiant heating panel that was derived from the modified method by a maximum of 14.9% in the case of the panel evaluated in the present experiment.
This difference in the results is attributed to the heat transfer resistance of the heat transfer layer that was used in the experiment. In the experiment of the present study, the heat transfer resistance of the heat transfer layer was measured via the plate heat flux method prior to the main experiment for the RFIRHP, and the value was 0.0985
.
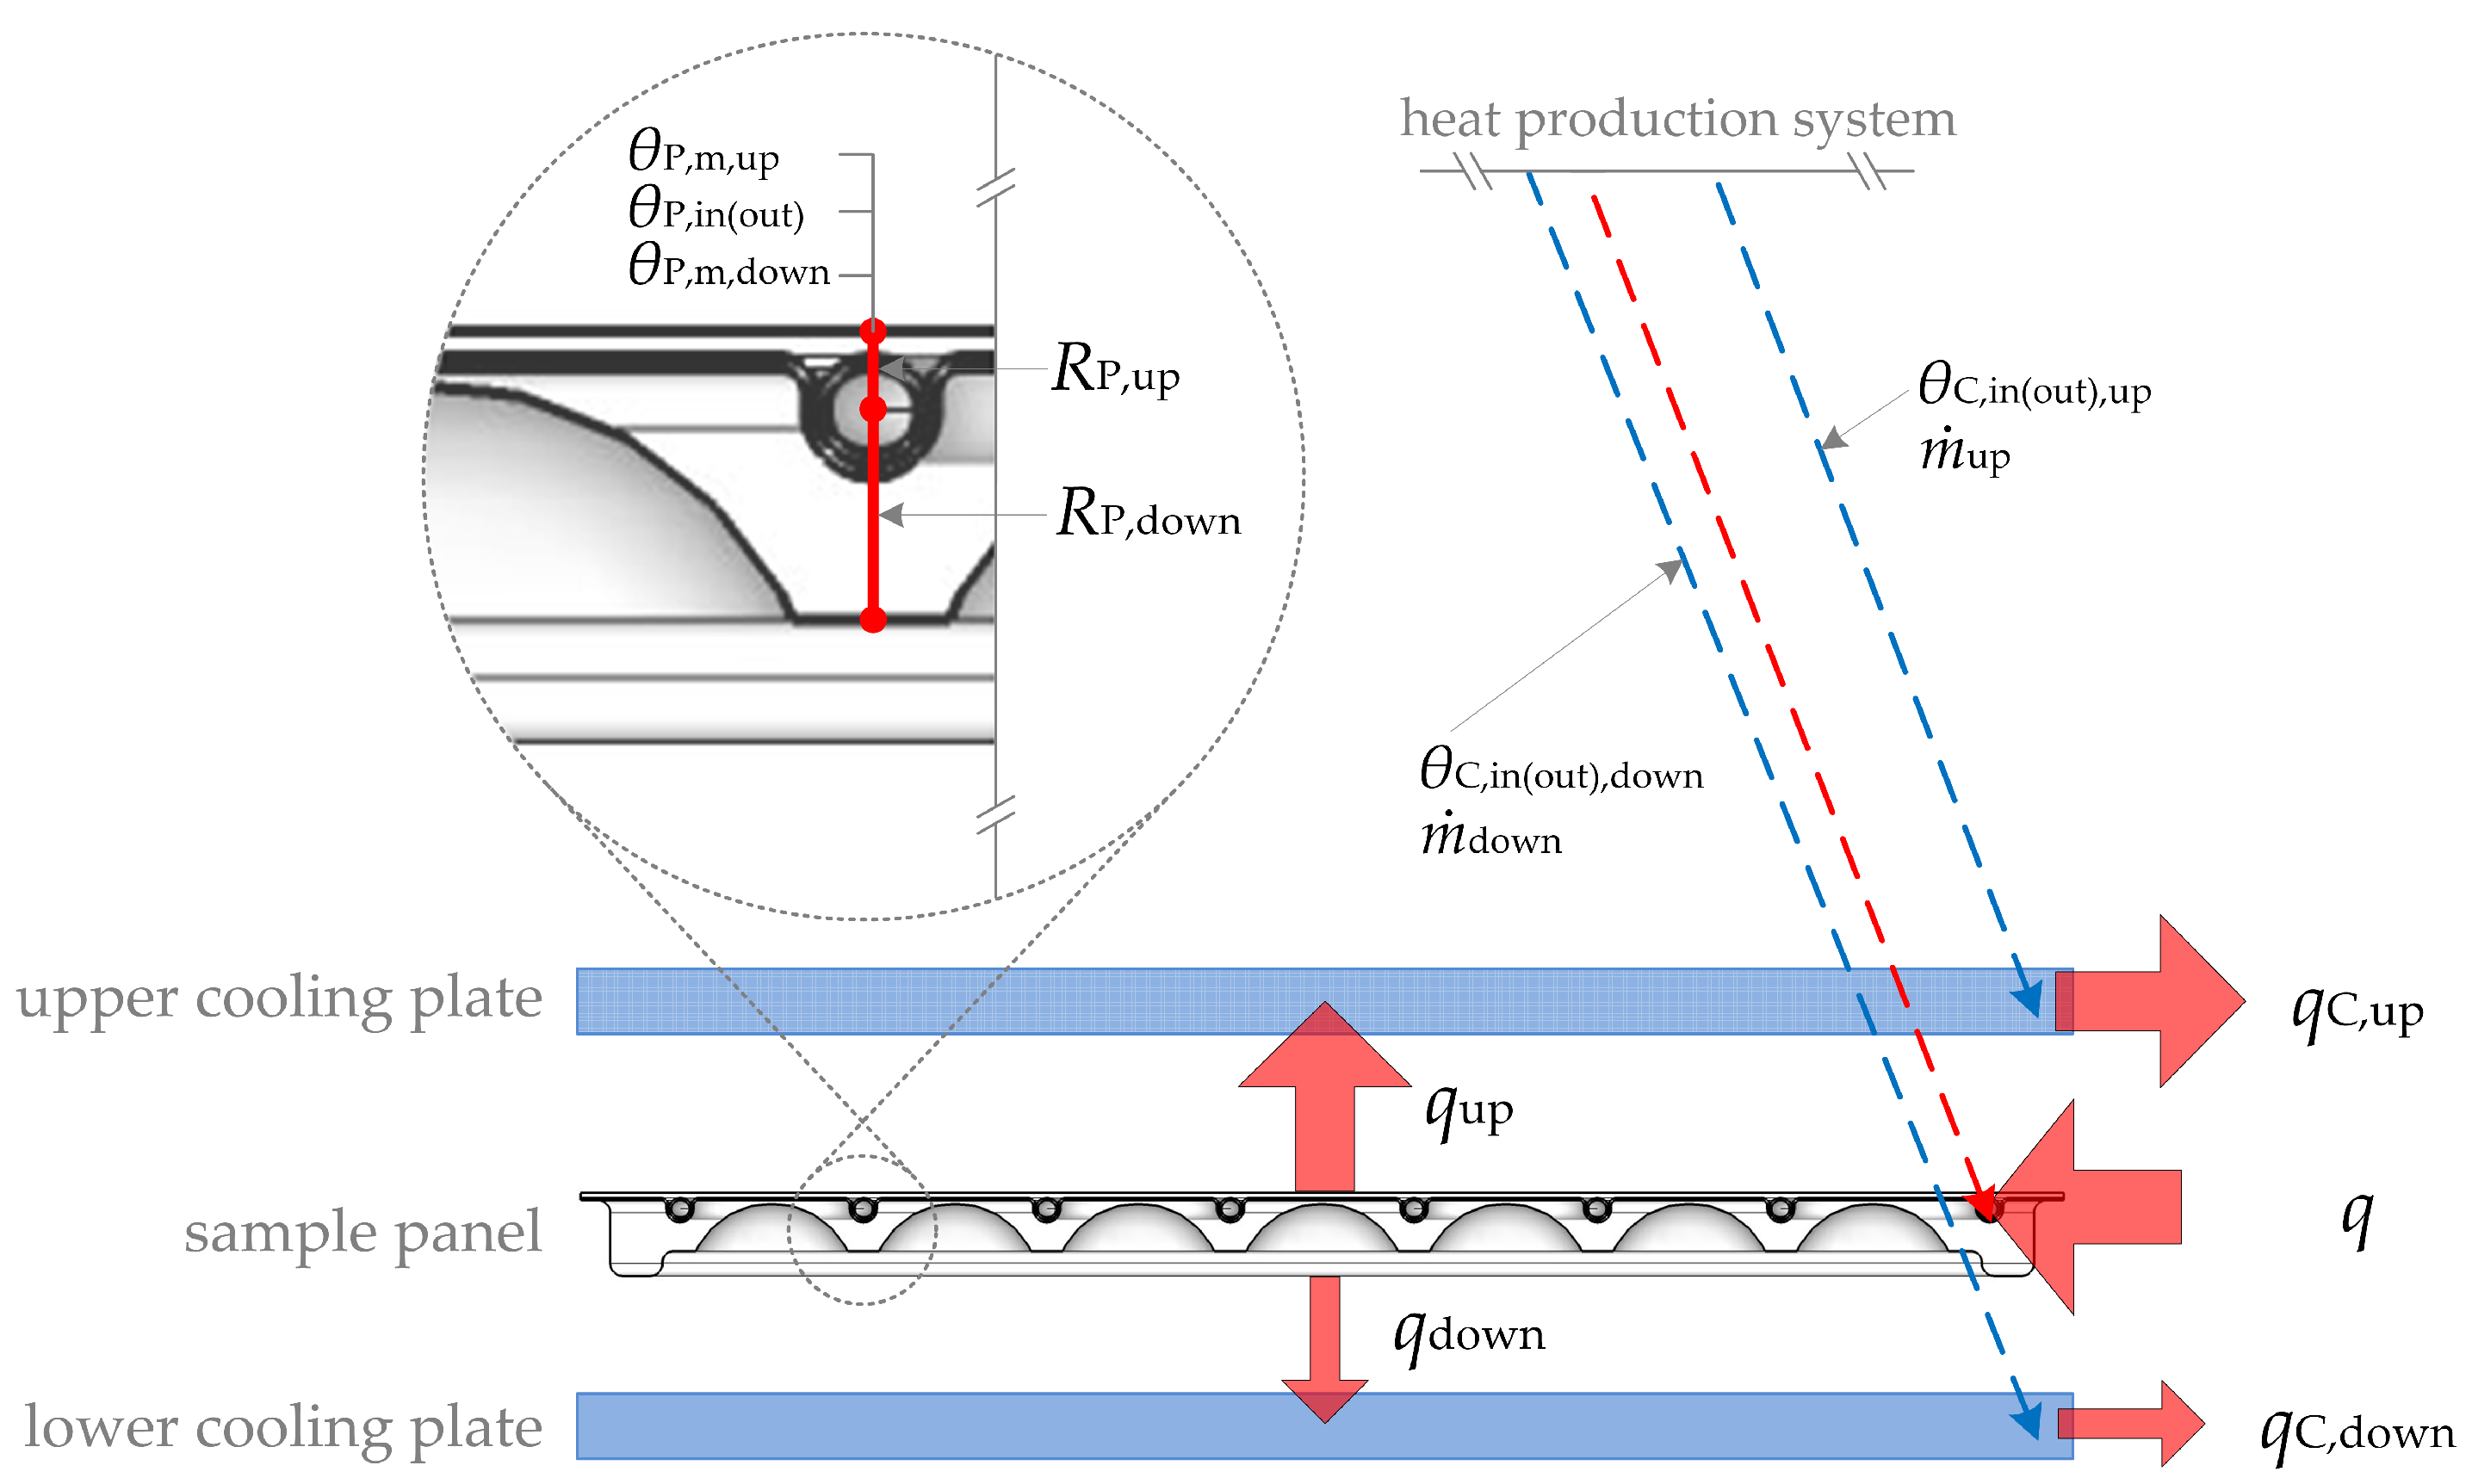
Table 6 lists the results of the recalculated heat transfer resistance of the heat transfer layer of each experiment using the resulting upward thermal output of the radiant panel (
), and difference between the lower surface temperature of the cooling plate (
) and the upper mean surface temperature of the sample panel (
).
The heat transfer resistance of the heat transfer layer that was applied to each experiment was 0.0985 ; however, the recalculated heat transfer resistance of the heat transfer layer based on the experimental results was 0.1096–0.1582 . The recalculated heat transfer resistance of the heat transfer layer using the resulting experimental data is higher than the heat transfer resistance of the heat transfer layer that was applied in the experiment because of the contact resistance generated on the contact surface between the heat transfer layer and the cooling plate, and between the heat transfer layer and the sample panel.
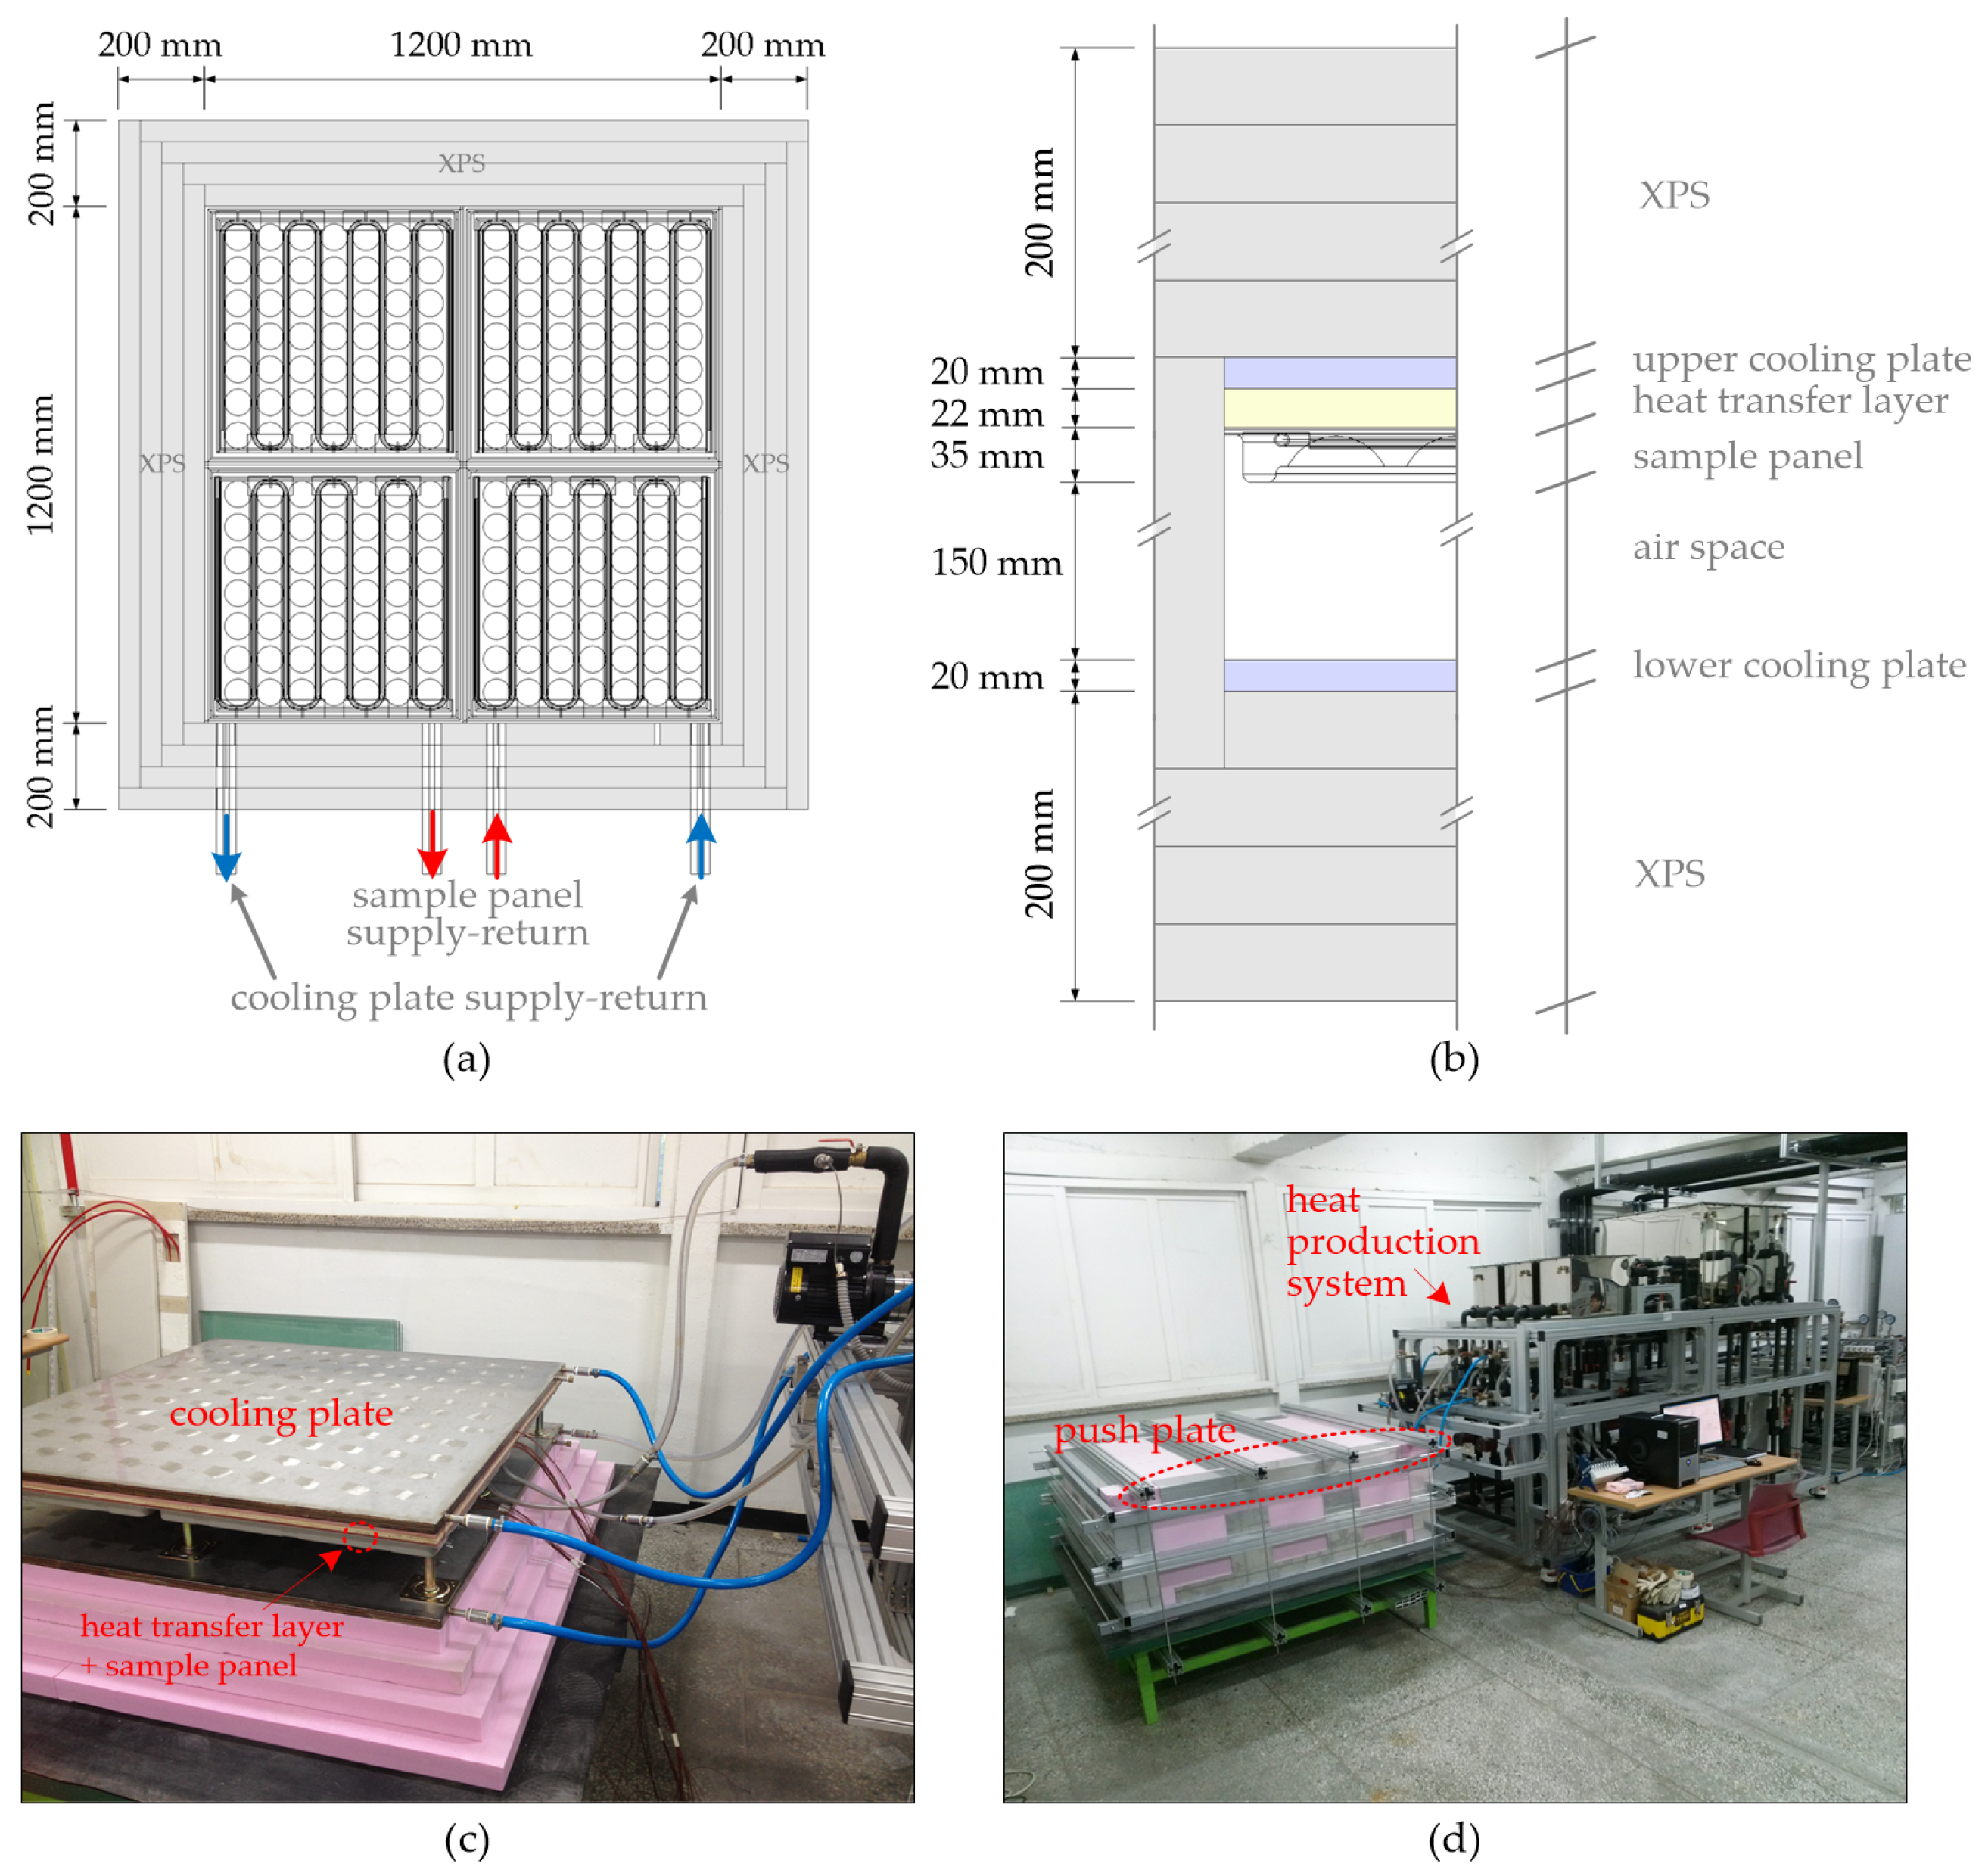
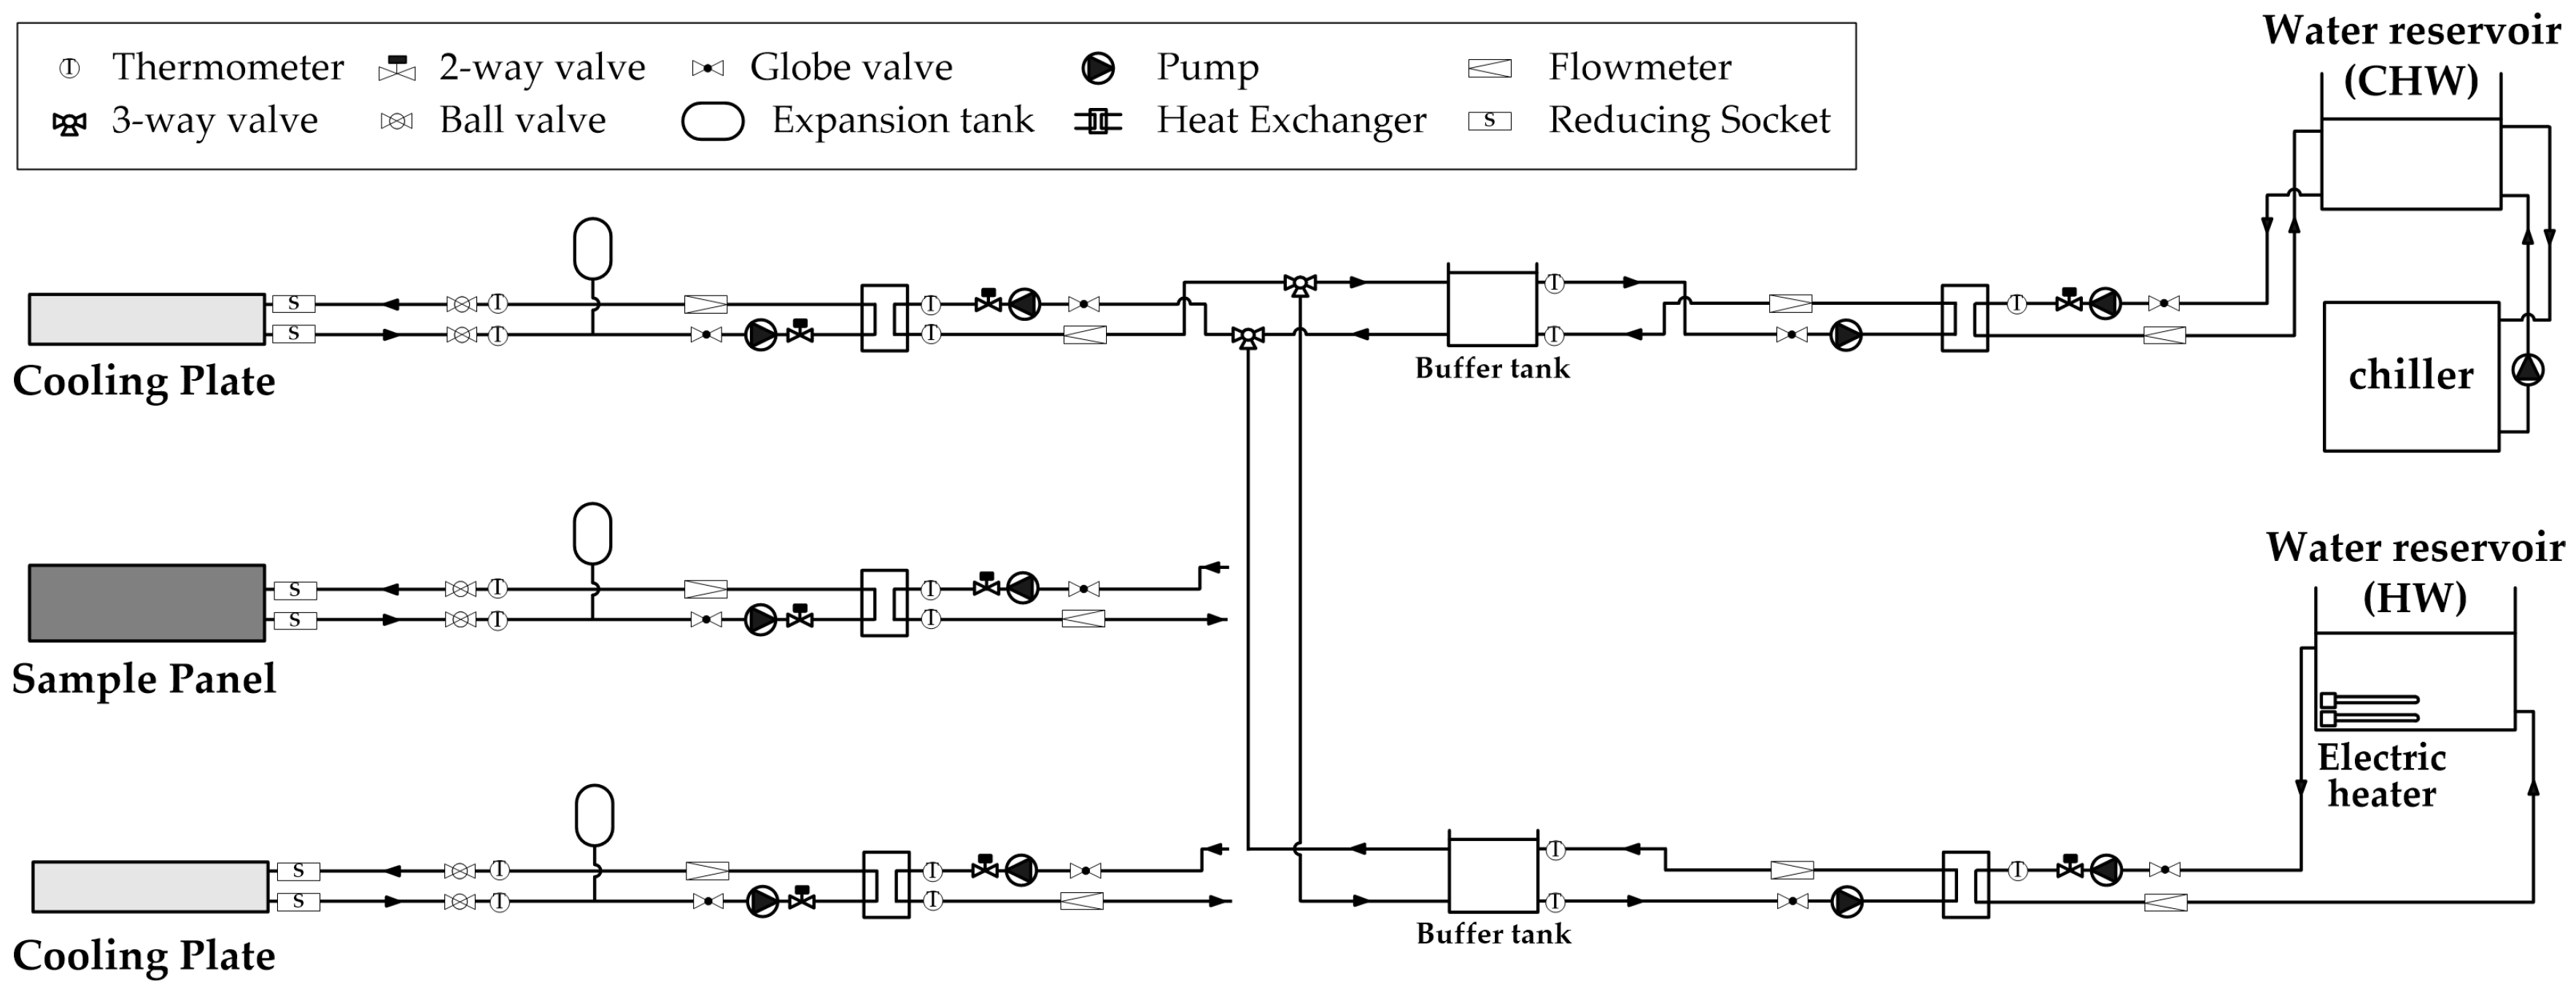
In this study, the application of the heat transfer layer was carefully considered based on the recognition of the problem of contact resistance. In the experiment performed in this study, it was highly important to set up the experimental configuration in a manner that contact resistance of the heat transfer layer would not occur; hence, as shown in the
Figure 5d, the push plate was designed and compressed with strong force in the vertical direction. Nevertheless, such contact resistance occurred.
The difference between the gradient of the characteristic curve calculated via the modified method and the gradient of the characteristic curve calculated via the existing method was caused by the difference in the heat transfer resistance of the heat transfer layer that was actually applied in each experiment. The contact resistance at the interface between the heat transfer layer and another part of the structure caused uncertainty and affected the reproducibility of the experiment recommended by the existing method. Therefore, in order to facilitate accuracy and reproducibility of the experimental results obtained by the existing methods, it is necessary to avoid the creation of interface resistance between the layers of the experimental configuration. The push plate used in this study is not sufficient for this purpose, hence alternatives should be provided, such as the application of a conductive paste/grease similar to that used in temperature sensors and heat flux plates.
To verify the repeatability and reproducibility of the modified method, additional experiments were conducted by modifying the boundary conditions of the experiment. The target conditions—except for the maximum surface temperature of the radiant panel,
, of the additional experiments—were the same as those in the previous experiment. In the additional experiments, the maximum surface temperature of the radiant panel was modified from 29
to 35
, and the results are listed in
Table 7,
Table 8 and
Table 9.
As a result of the additional experiment, the upper and lower thermal resistances of the radiant panels () and the efficiencies of the panels () were very similar to those of the previous experiment, although the boundary conditions of the experiment were changed.
The modified method proposed in this study can evaluate the downward thermal output of radiant panel, as well as render the boundary condition of the experiment more flexible than that of the existing method. In addition, the modified method showed that the experimental results were not influenced by the heat transfer resistance of the heat transfer layer, and that the repeatability and reproducibility of the experiment is ensured, whereas the existing method affects the experimental results by means of the heat transfer resistance of the heat transfer layer.
5.3. Uncertainty Analysis
Uncertainty analysis (the analysis of uncertainties in experimental measurements) is required for a proper evaluation of experimental data. In this study, uncertainty analysis is performed using the method descried by Holman [
15]. Assume that the variable
is a function of the independent variables
,
,
, ⋯,
. If the uncertainties in the independent variables
,
,
, ⋯,
are all given with same odds, then the uncertainty in the resulting variable
is calculated by the following Equation (
11):
The error analysis used to estimate the maximum uncertainty in the experimental results, was performed by using Equation (
11). In this study, the temperature and flow rates were measured at 5 s intervals using appropriate instruments, as discussed previously. A mean value at each measuring points was computed by averaging the 8640 measured values, obtained during a 12 h steady-state condition, and these mean values are considered as the experimental results. Therefore, in our study, the maximum uncertainty of the experimental results is
for the temperature, and 0.01% for the flow rate. We show that the maximum uncertainty has the quantity, with an acceptable uncertainty, 0.5% for
, 1.2% for
, and 1.2% for
, respectively.


