Numerical Study of the Gas-Liquid Two-Phase Flow in a Self-Designed Mixer for a Ga-R113 MHD System


Abstract
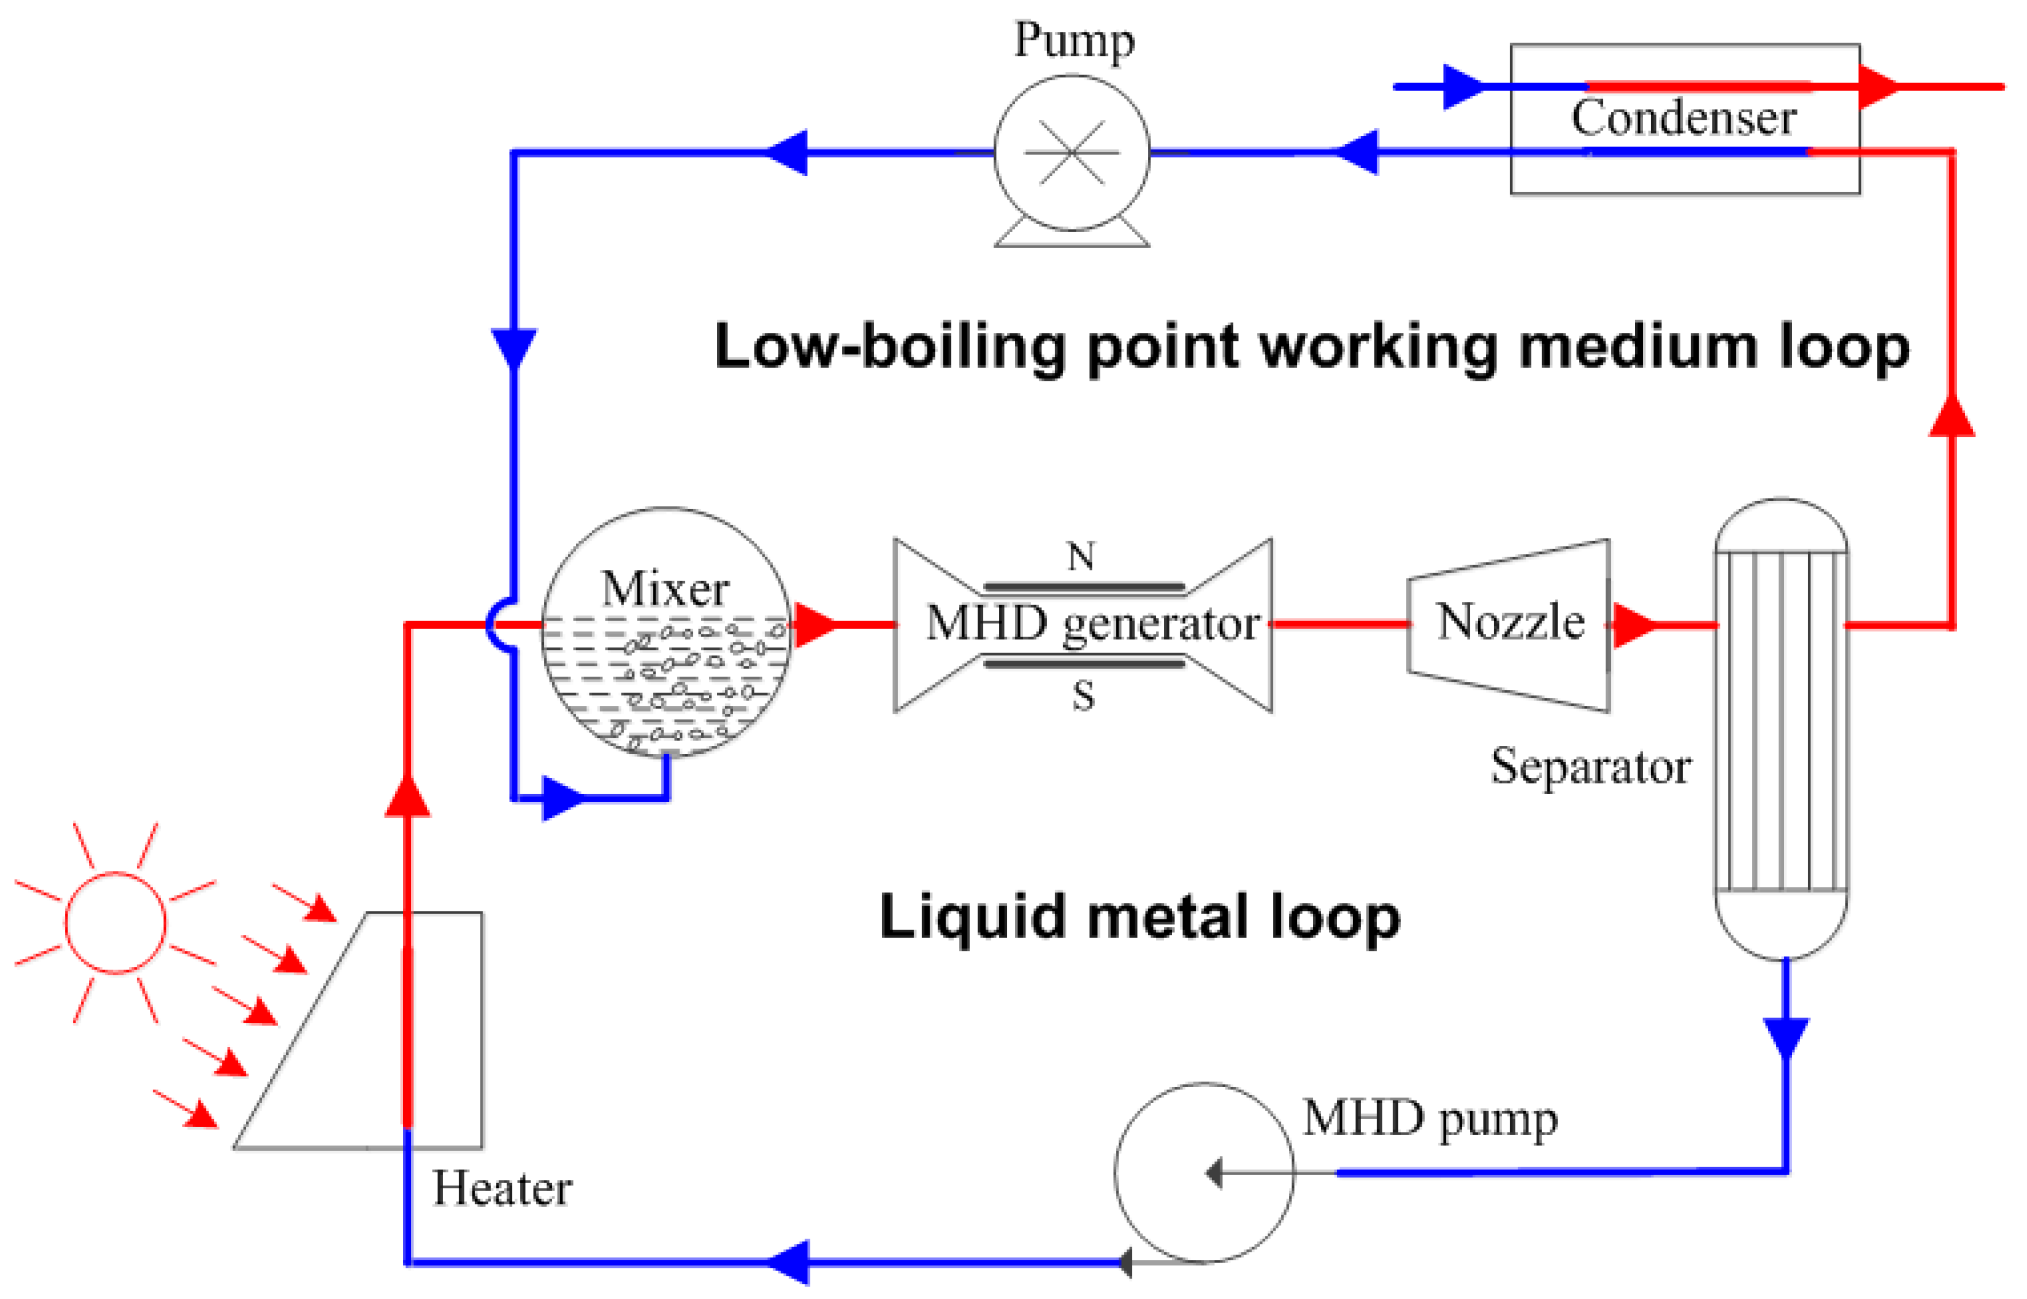
:1. Introduction
2. Modelling
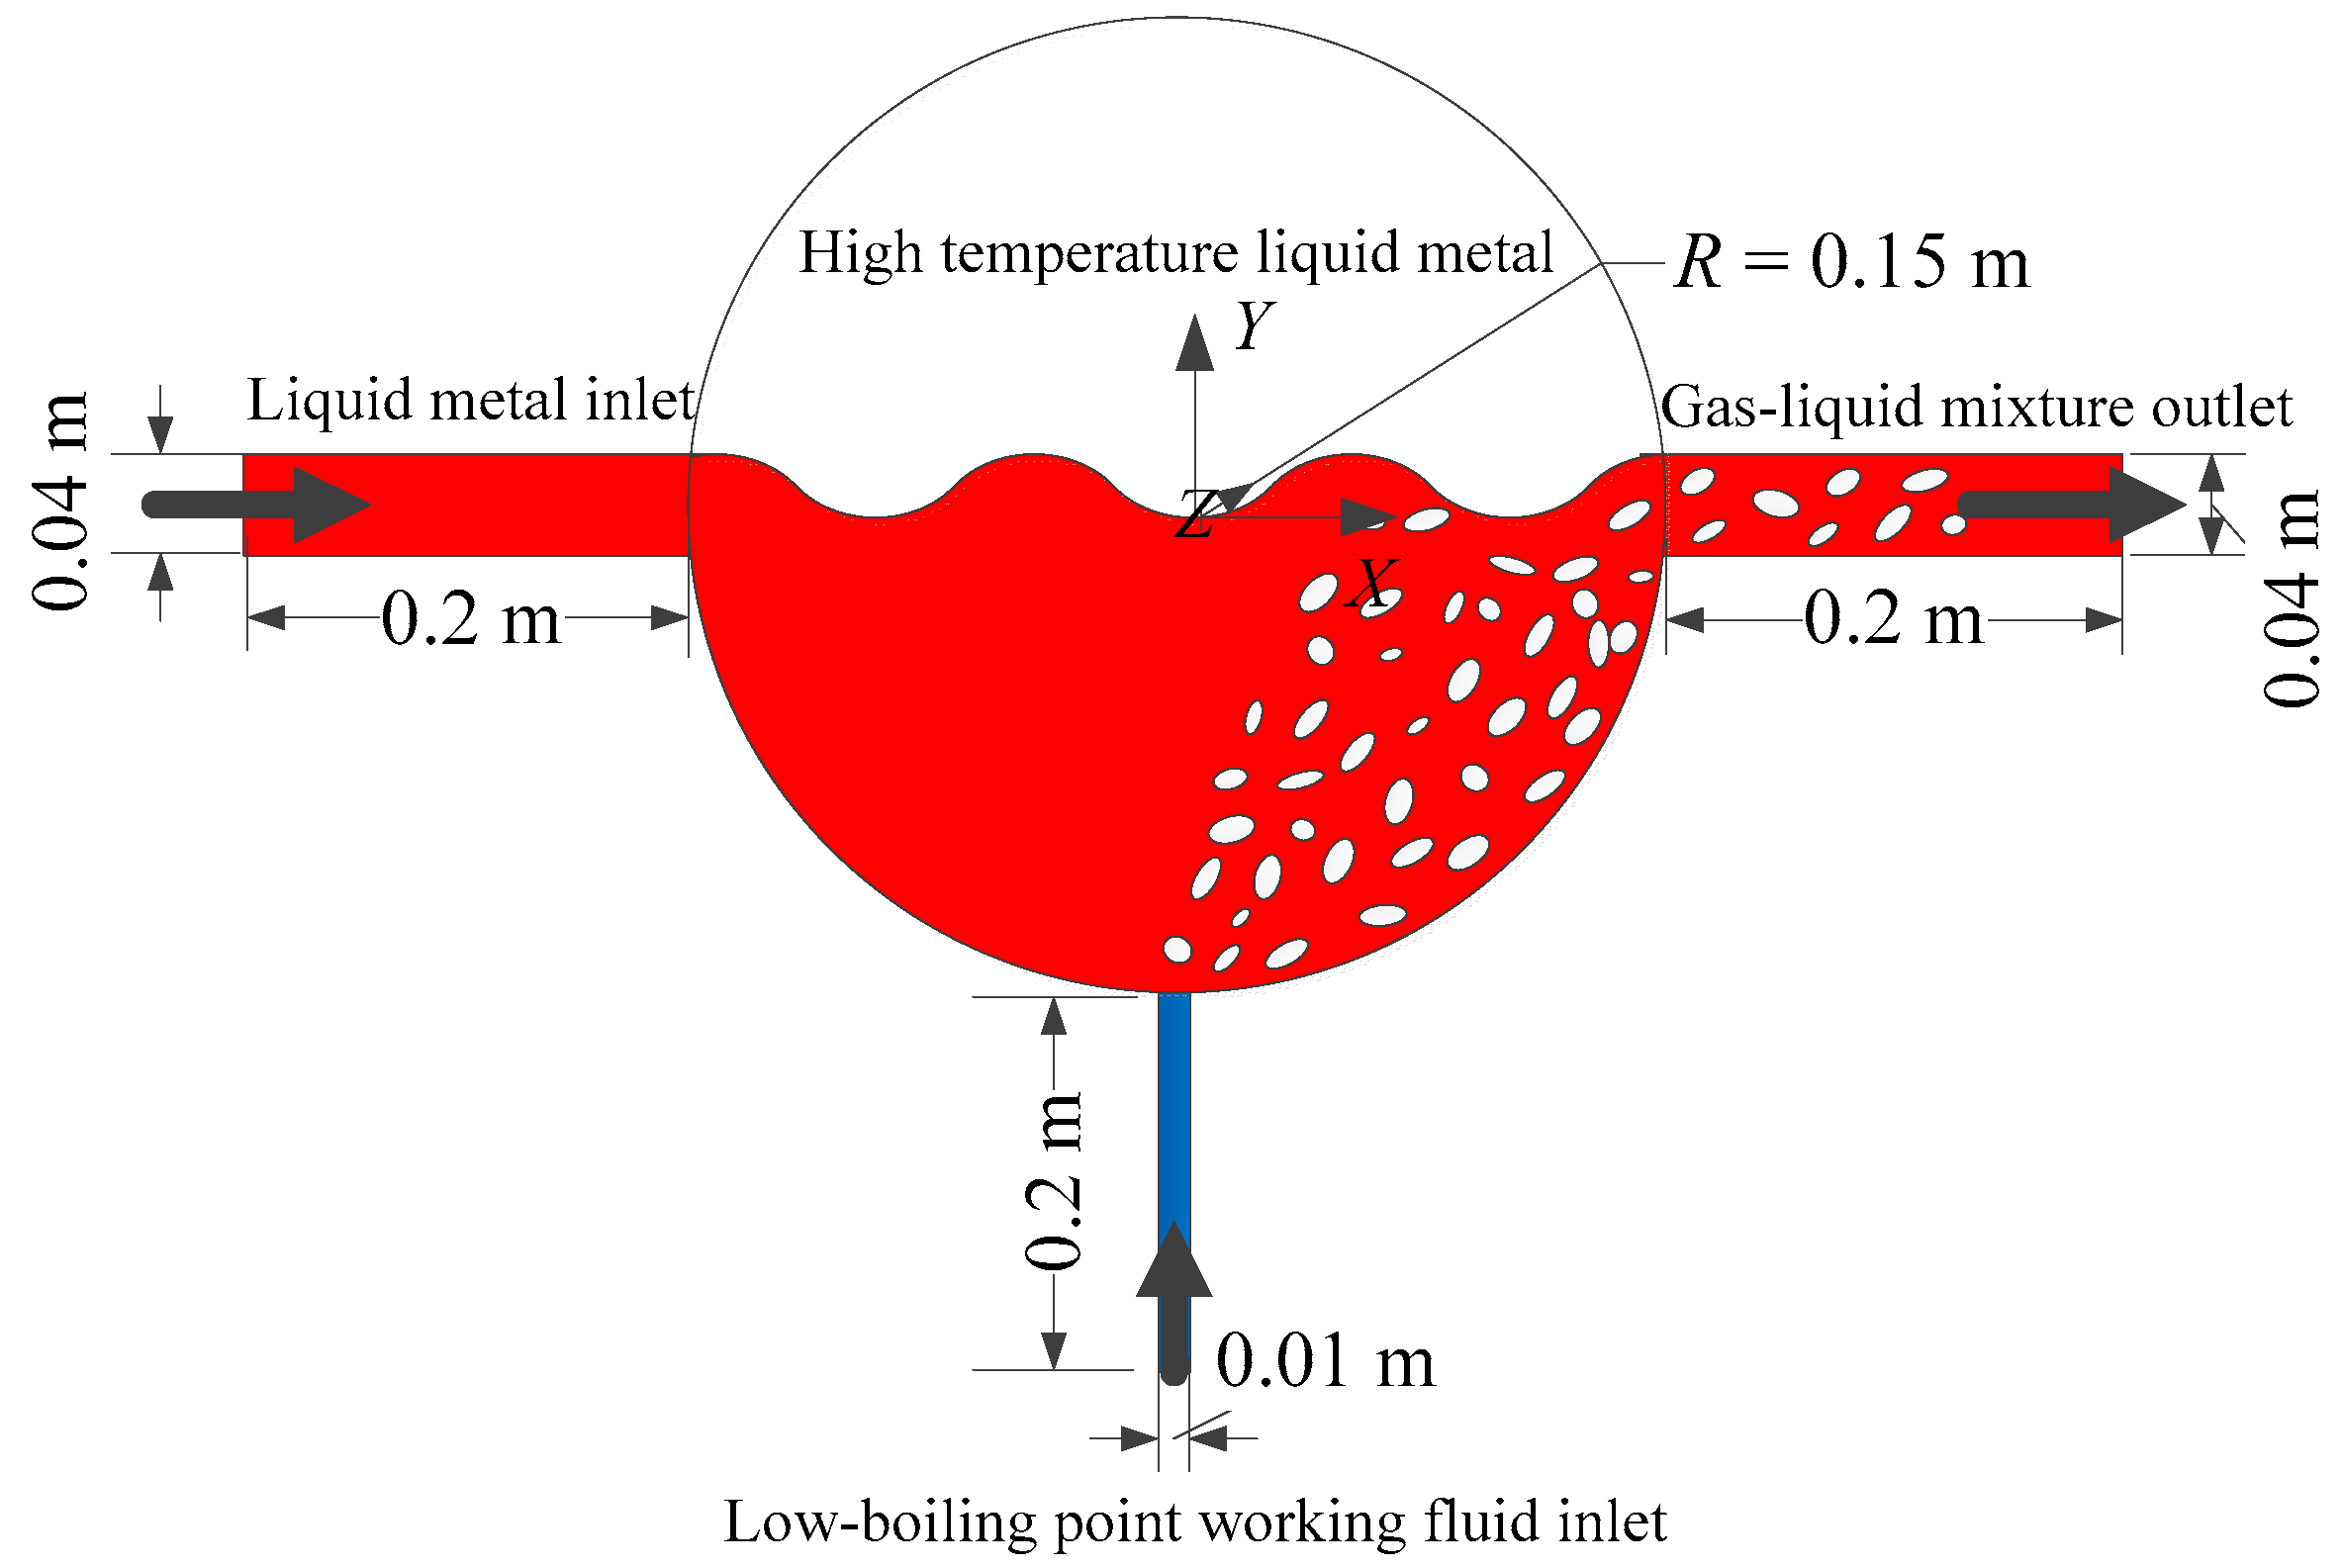
2.1. Model Set-Up
2.2. Numerical Model
2.2.1. Governing Equations
- (1)
- Continuity Equation
- (2)
- Momentum Equationwhere is the mass-averaged velocity , is the mixture density , n is the number of phases, is the body force, αk is the volume fraction of phase k, μm is the viscosity of the mixture , and is the drift velocity of phase k.
- (3)
- Energy EquationEk is the energy of phase k; S′ is the volumetric heat sources; and keff is the effective thermal conductivity , where kk is the thermal conductivity of phase k and kt is the turbulent thermal conductivity.
- (4)
- Volume fraction equation of the second phase
2.2.2. Boundary Conditions
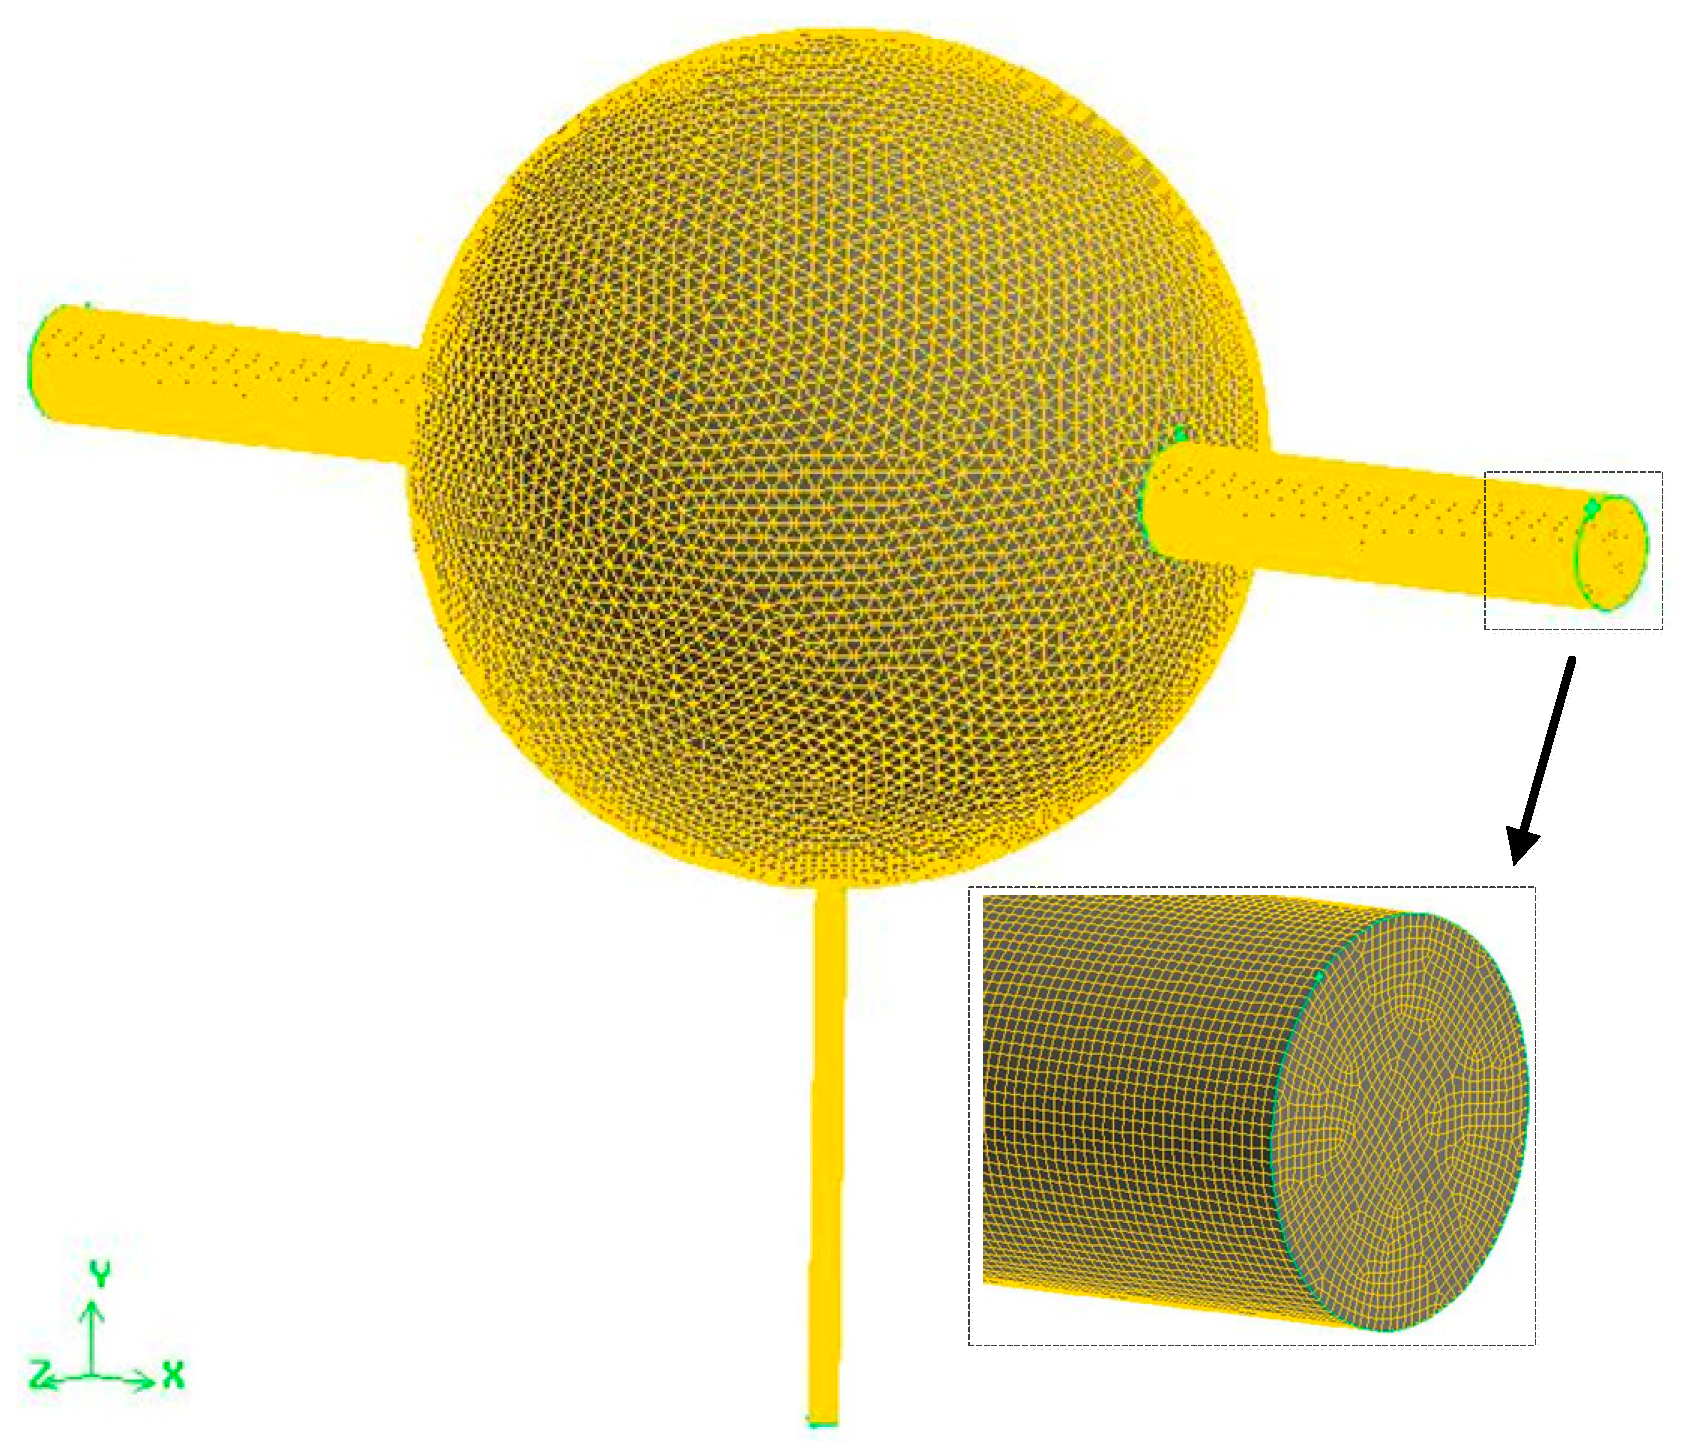
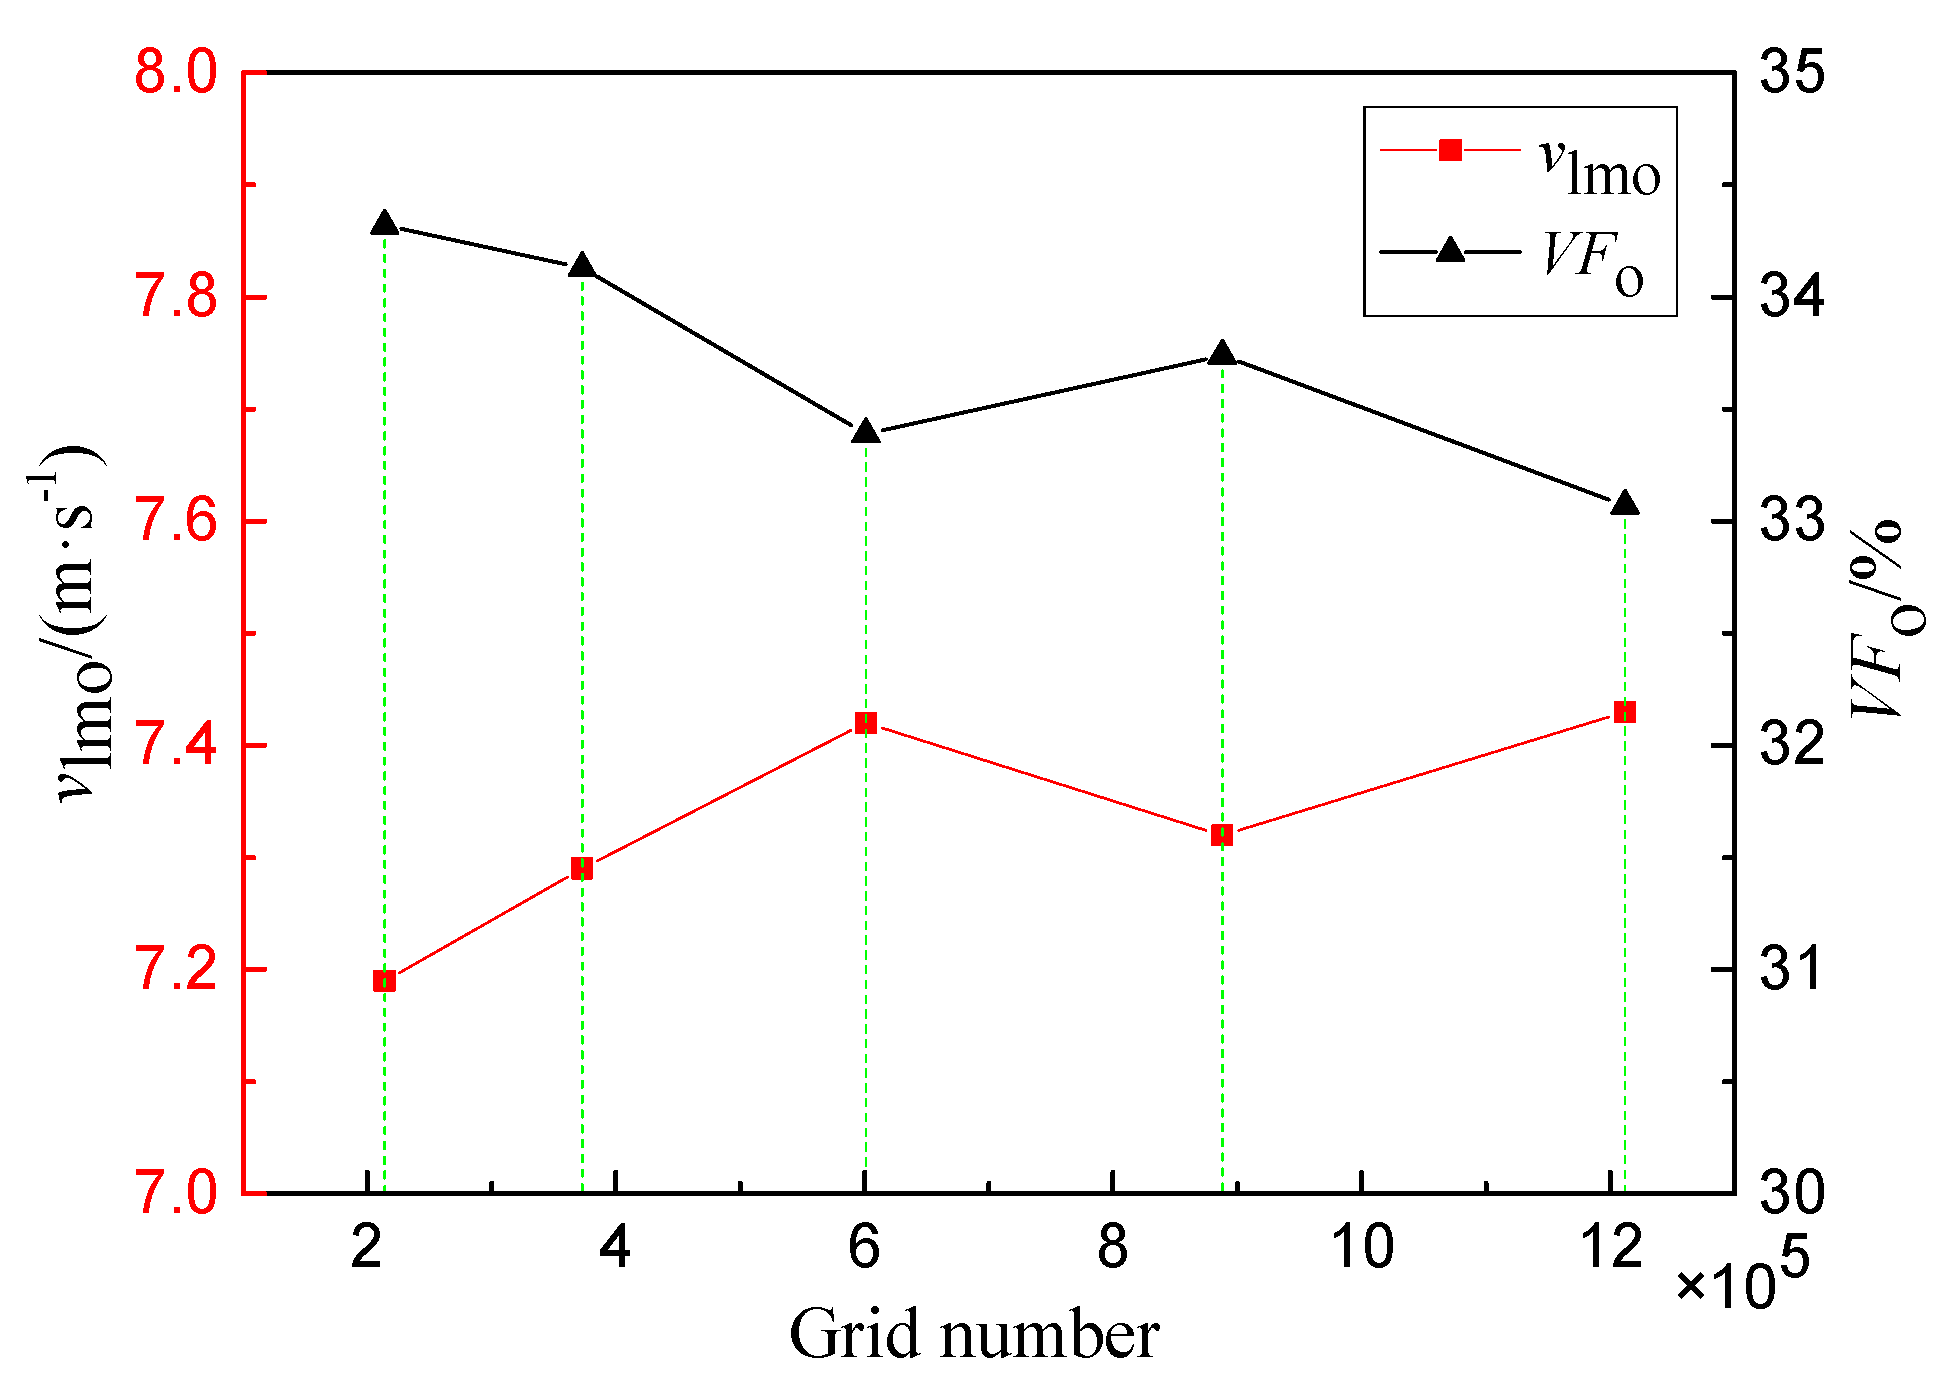
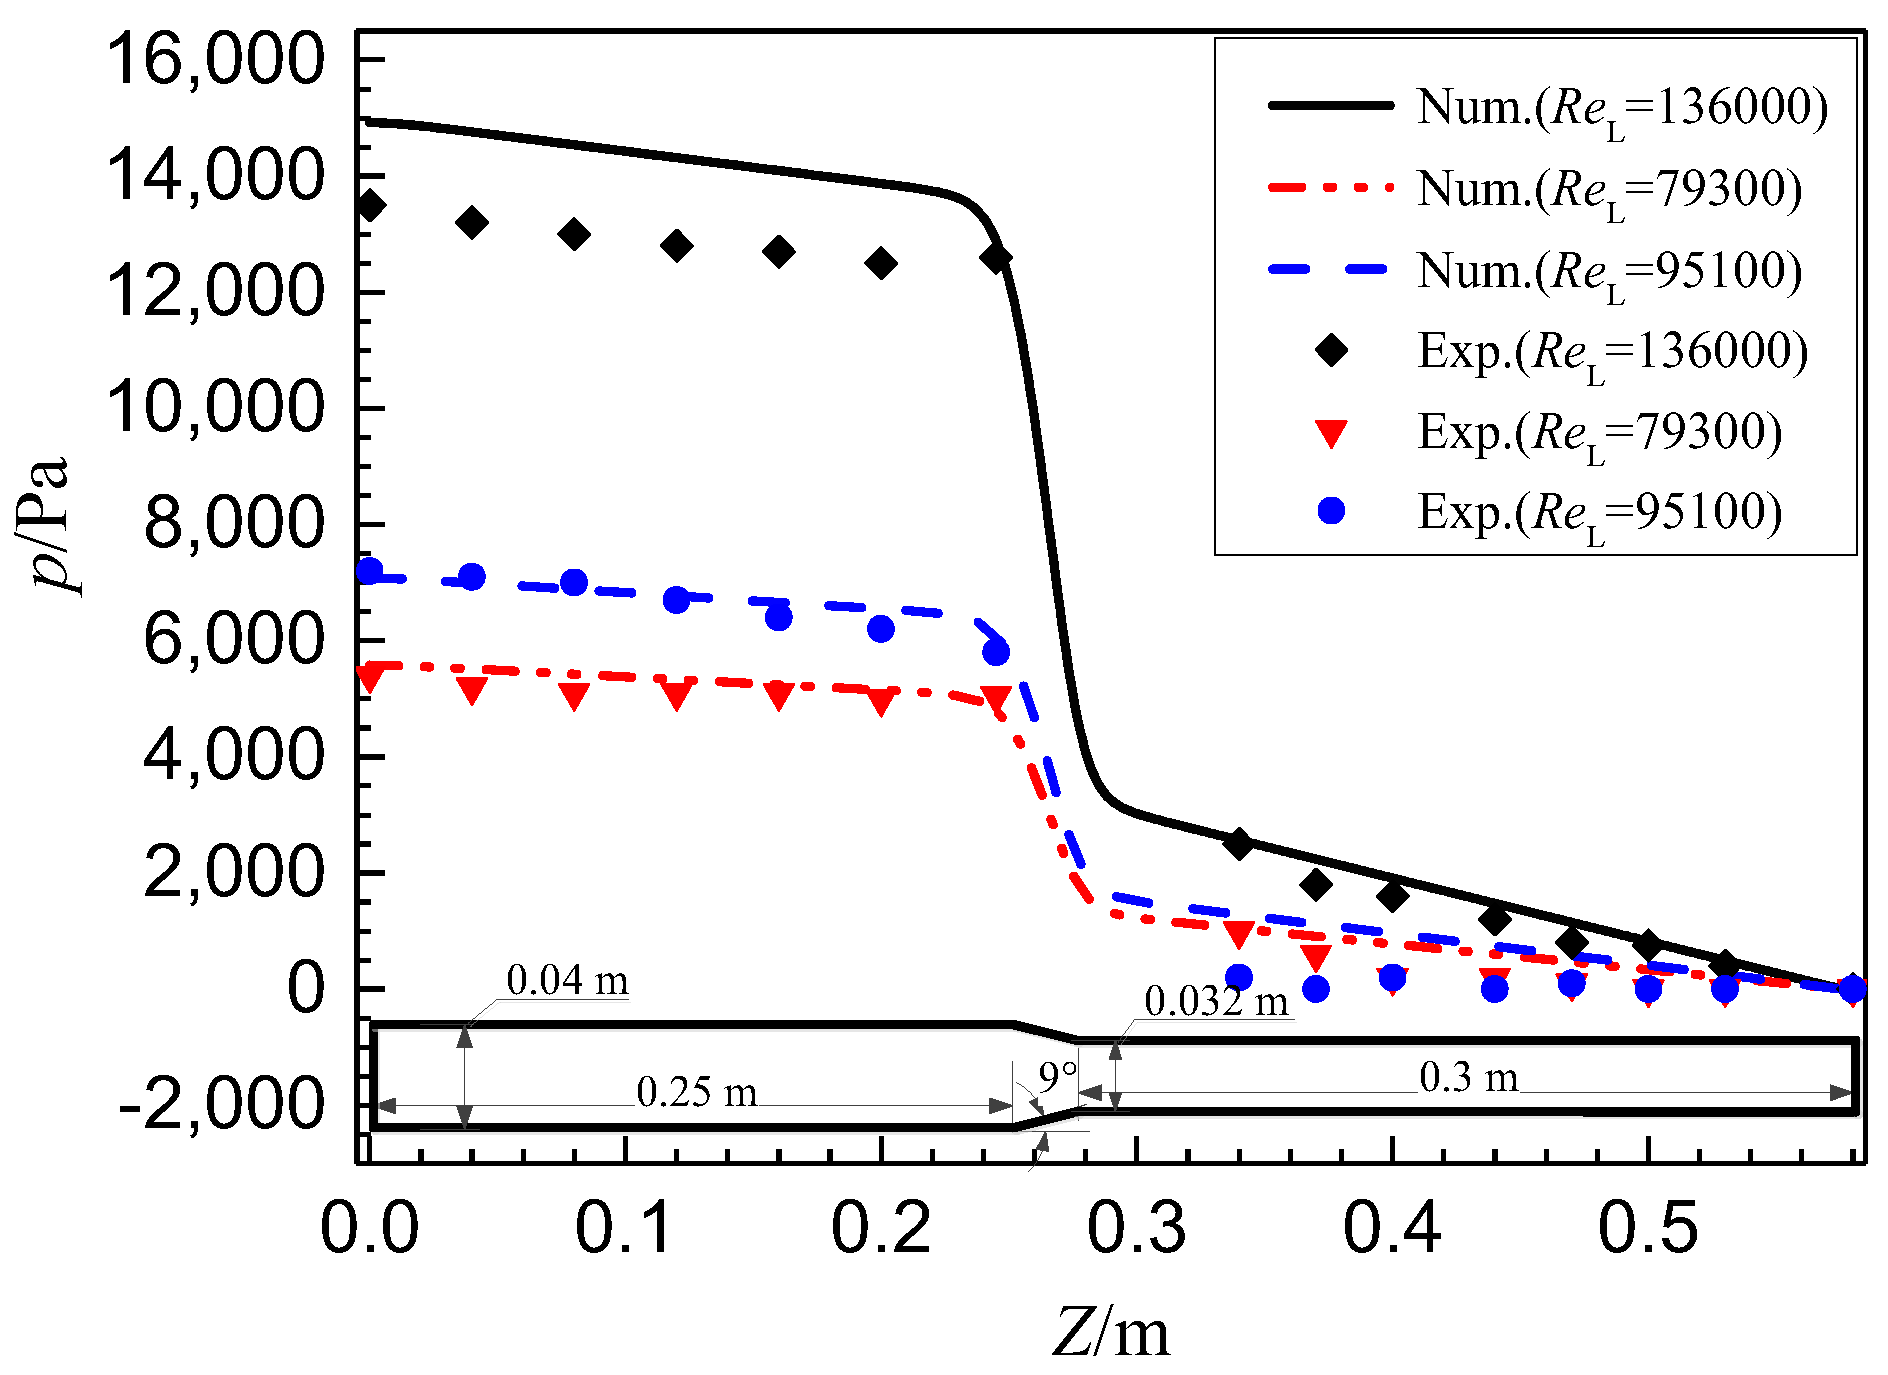
2.2.3. Independence Verification
3. Results and Discussion
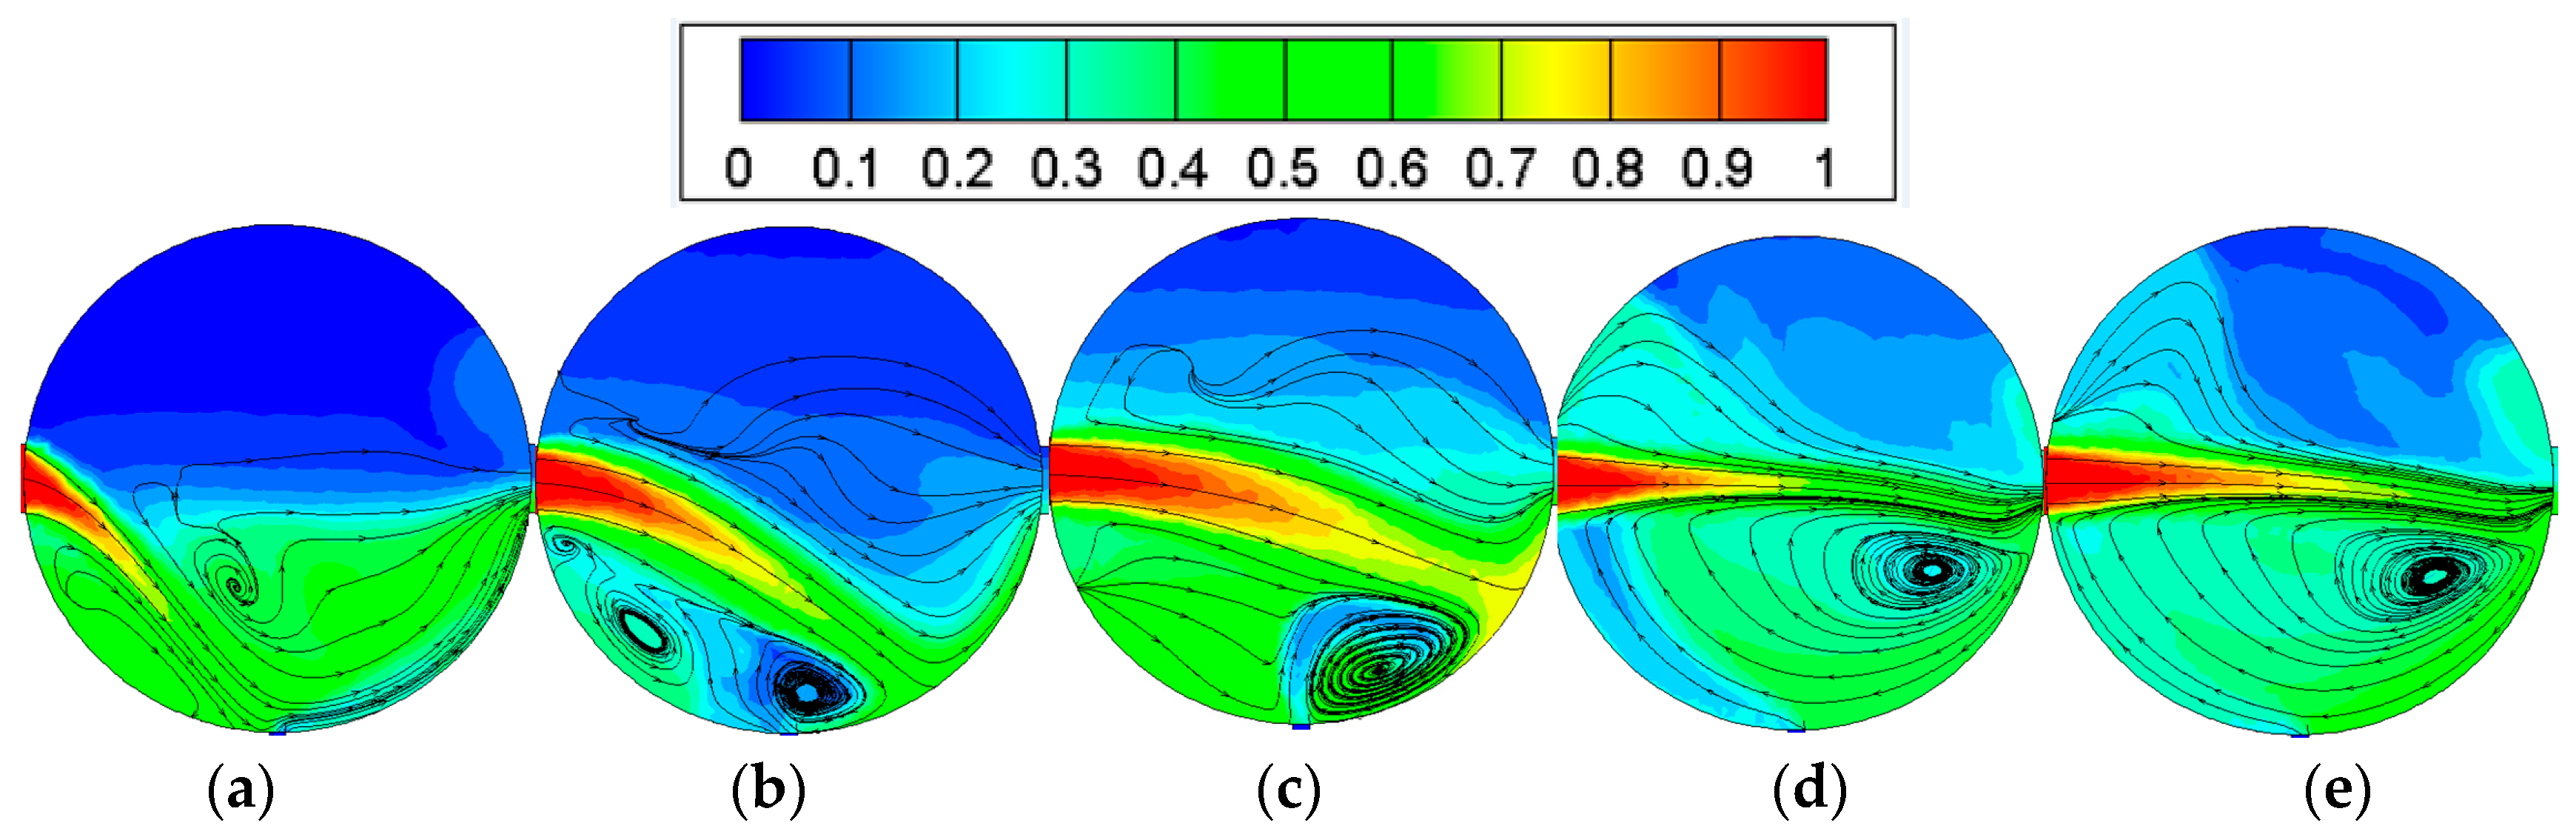
3.1. Effects of vlmi
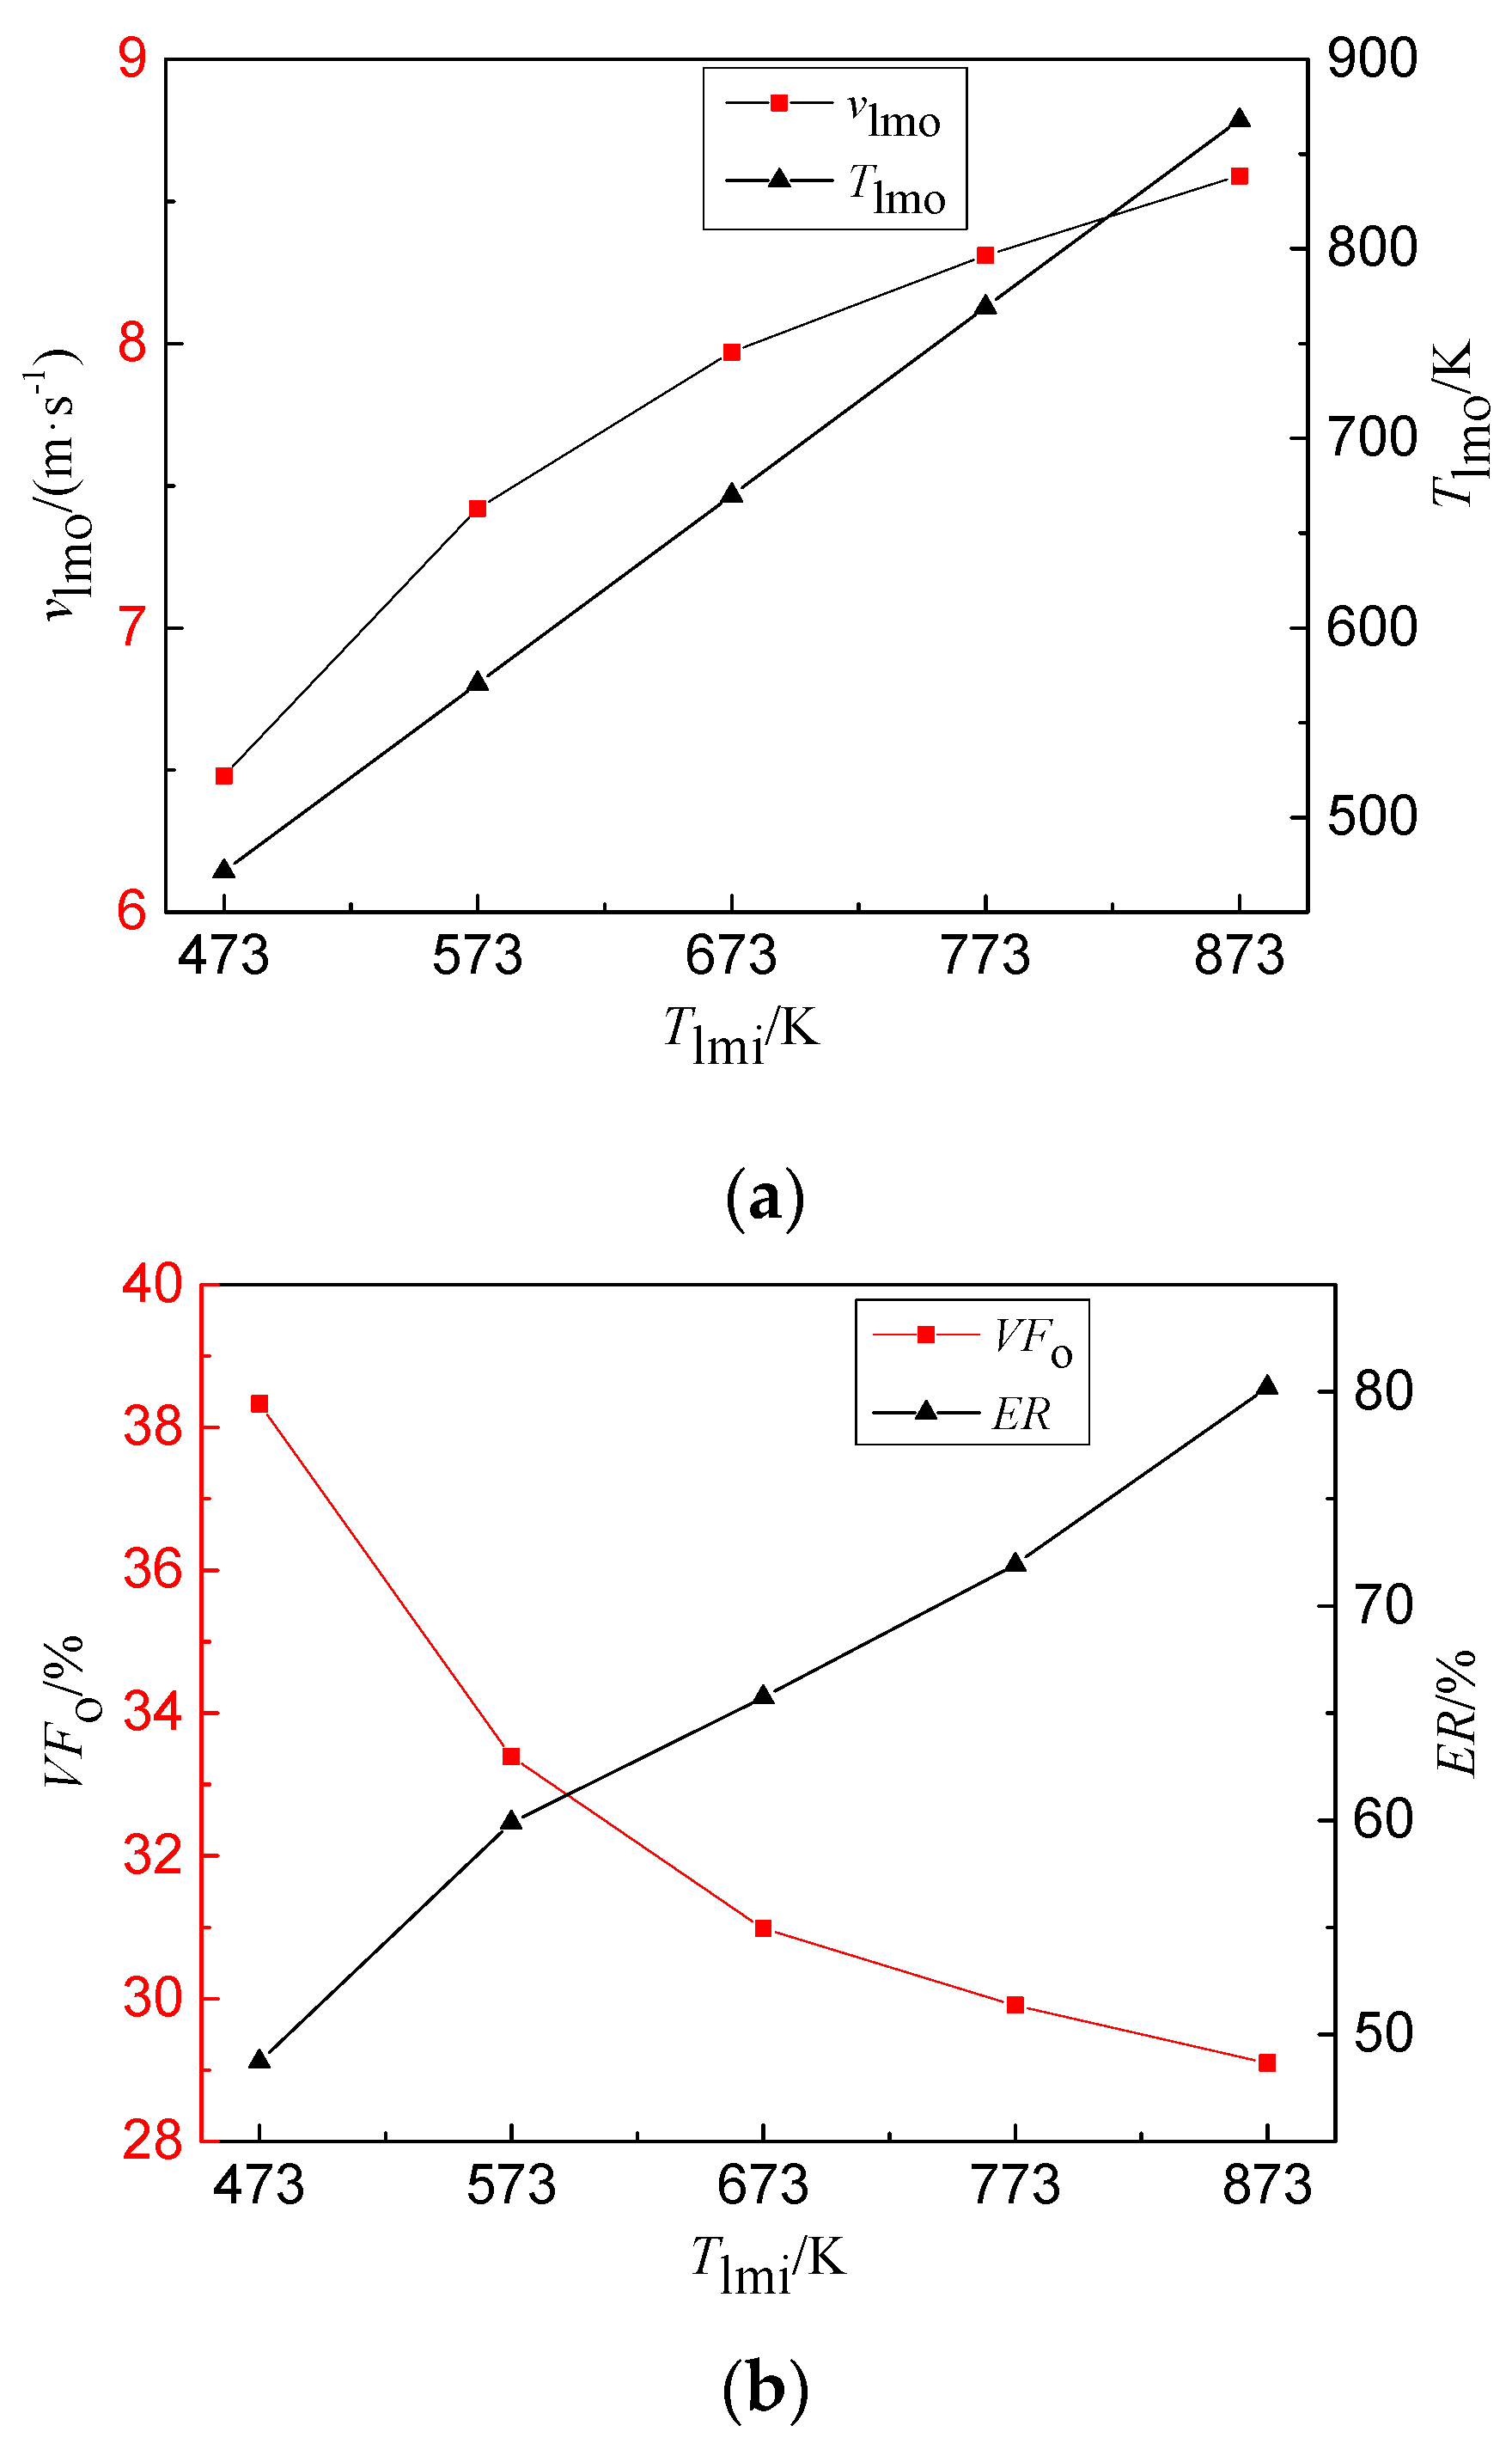
3.2. Effects of Tlmi
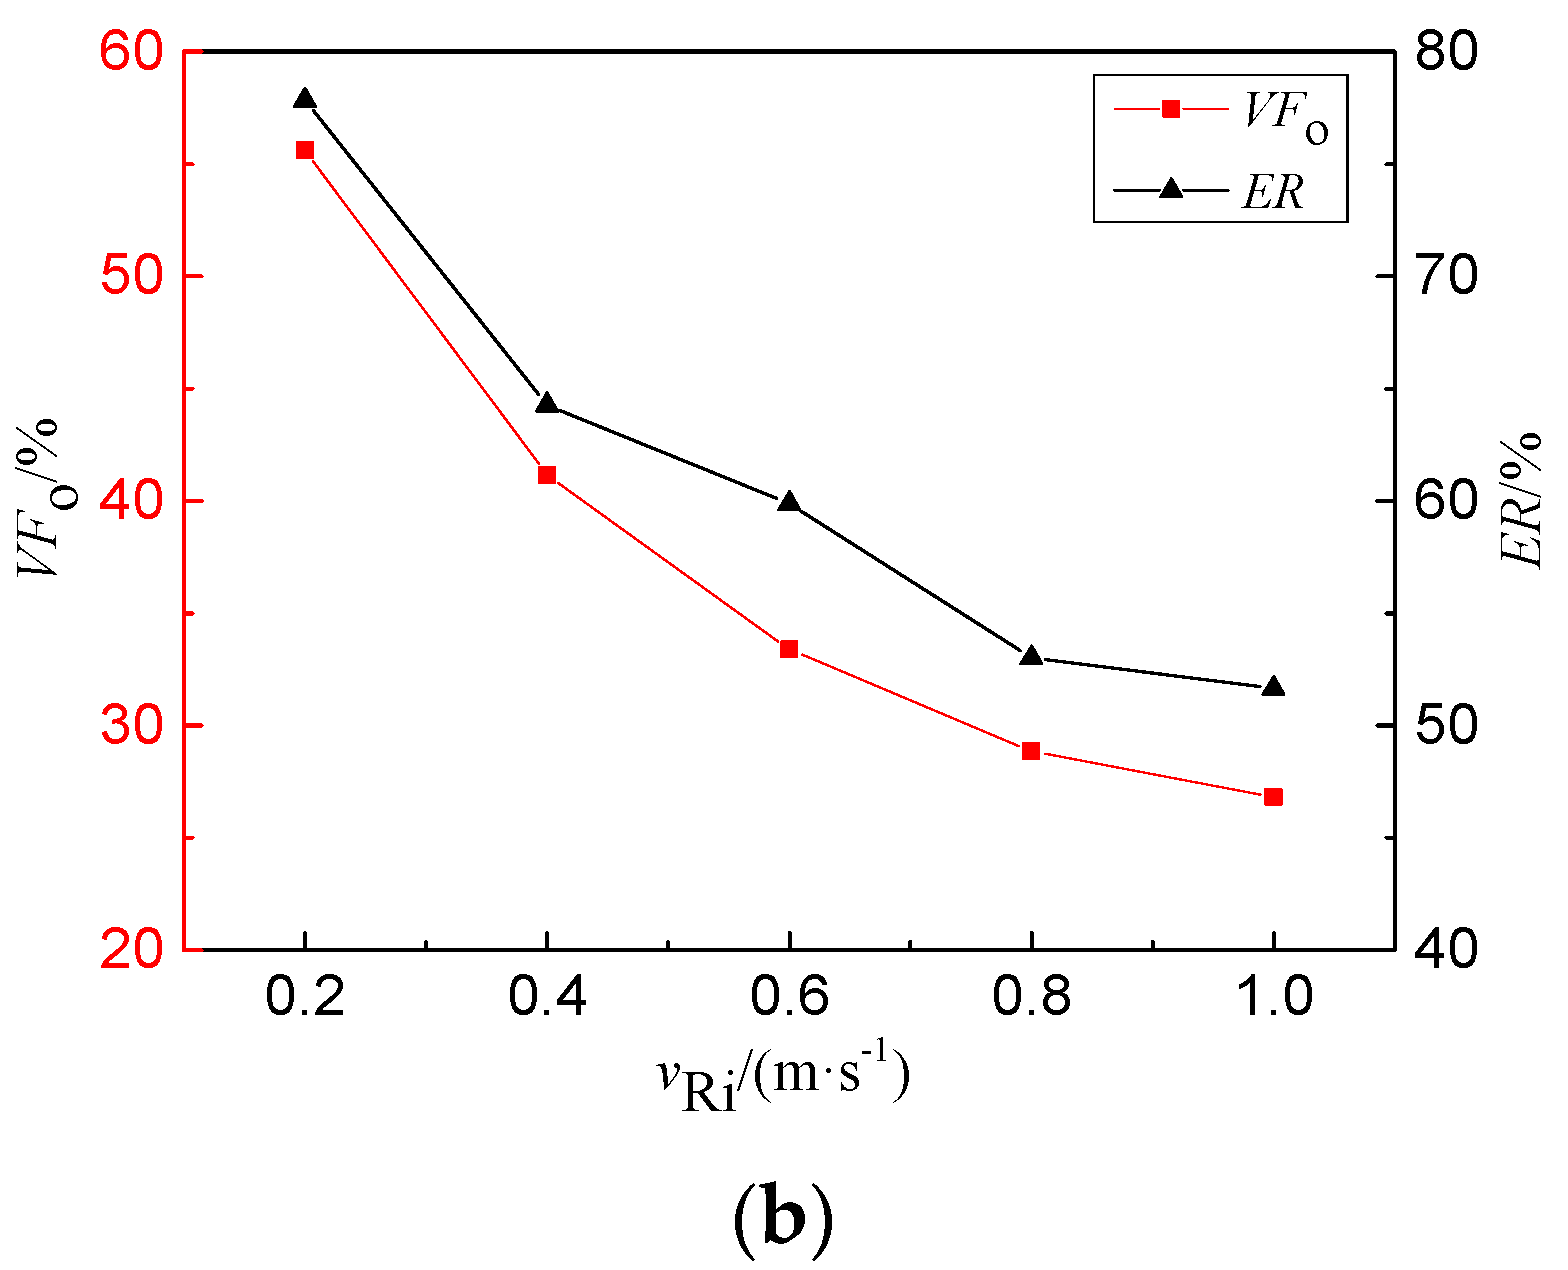
3.3. Effects of vRi
3.4. Effects of TRi
4. Conclusions
- (1)
- The evaporation area enlarges with the inlet velocity of liquid Ga (vlmi), which is beneficial to R113 evaporation.
- (2)
- Generally, increasing vlmi plays a positive role in the gas-liquid flow characteristics, because vlmo, VFo and ER increase with vlmi. However, an excessively higher vlmi will result in an overload on the pump power, and consequently reduce the whole efficiency. The suggested range for vlmi is 1.8 m·s−1 to 2.4 m·s−1.
- (3)
- The inlet temperatures of liquid Ga (Tlmi) and R113 (TRi) have similar impacts on the gas-liquid mixing and flow characteristics. With Tlmi or TRi increasing, vlmo, Tlmo, and ER rise, while VFo declines. As the thermodynamic fluid, a higher inlet velocity of R113 (vRi) will, on one hand, obtain a higher vlmo; on the other hand, it will reduce Tlmo, ER, and VFo.
- (4)
- It is suggested that VFo be kept above a certain value. Otherwise an undesirable annular flow pattern may be formed, which has a detrimental impact on the power-generating process by detaching the liquid metal from the electrodes.
- (5)
- It is advised that future research work be centered on experimental investigations, microscopic bubble motions, economic performance, and commercialized operations in this field.
Acknowledgments
Author Contributions
Conflicts of Interest
Nomenclature
| Symbols | ||
| E | energy | J·kg−1 |
| ER | evaporation rate | % |
| body force | N | |
| gravitational acceleration | m·s−2 | |
| k | thermal conductivity | W·m−1·K−1 |
| n | number of phases | |
| p | pressure | Pa |
| R | radius | m |
| Re | Reynolds number | |
| r | the factor of phase change | s−1 |
| S | source term | kg·m−3·s−1 or kJ·m−3·s−1 |
| S′ | volumetric heat sources | W·m−3 |
| t | time | s |
| T | temperature | K |
| v | velocity | m·s−1 |
| mass-average velocity | m·s−1 | |
| VF | volume fraction of liquid metal | % |
| X | axis X | m |
| Y | axis Y | m |
| Z | axis Z | m |
| Greek symbols | ||
| α | volume fraction | % |
| ΔH | latent heat | kJ·kg−1 |
| ρ | density | kg·m−3 |
| μ | viscosity | kg·m−1·s−1 |
| Subscripts | ||
| b | boiling point | |
| dr | drift | |
| E | energy | |
| eff | effective | |
| i | inlet | |
| k | phase k | |
| l | liquid | |
| lm | liquid metal | |
| M | mass | |
| m | mixture | |
| o | outlet | |
| R | R113 | |
| t | turbulence model | |
References
- Koltsaklis, N.E.; Kopanos, G.M.; Georgiadis, M.C. Design and operational planning of energy networks based on combined heat and power units. Ind. Eng. Chem. Res. 2014, 53, 16905–16923. [Google Scholar] [CrossRef]
- Lu, P.; Zheng, X.Y.; Yang, P.J.; Fang, L.L.; Huang, H.L. Numerical investigation into the vapor-liquid flow in the mixer of a liquid metal magneto-hydro-dynamic system. RSC Adv. 2017, 7, 35765–35770. [Google Scholar] [CrossRef]
- Sakai, T.; Matsumoto, M.; Murakami, T.; Okuno, Y. Numerical simulation of power generation characteristics of a disk MHD generator with high-temperature inert gas plasma. Electr. Eng. Jpn. 2012, 179, 23–30. [Google Scholar] [CrossRef]
- Tanaka, M.; Aoki, Y.; Zhao, L.; Okuno, Y. Experiments on high-temperature xenon plasma magnetohydrodynamic power generation. IEEE Trans. Plasma Sci. 2016, 44, 1241–1246. [Google Scholar] [CrossRef]
- Komatsu, F.; Tanaka, M.; Murakami, T.; Okuno, Y. Experiments on high-temperature inert gas plasma MHD electrical power generation with hall and diagonal connections. Electr. Eng. Jpn. 2015, 193, 17–23. [Google Scholar] [CrossRef]
- Li, Y.W.; Zhang, B.L.; Gao, L.; Duan, C.D.; Zhang, L.; Wang, Y.T.; He, G.Q. Research on generation and control of high temperature gas in MHD power generation. J. Propuls. Technol. 2017, 38, 1419–1426. [Google Scholar]
- Tanaka, M.; Murakami, T.; Okuno, Y. Plasma characteristics and performance of magnetohydrodynamic generator with high-temperature inert gas plasma. IEEE Trans. Plasma Sci. 2014, 42, 4020–4025. [Google Scholar] [CrossRef]
- Kayukawa, N. Open-cycle magnetohydrodynamic electrical power generation: A review and future perspectives. Prog. Energy Combust. Sci. 2004, 30, 33–60. [Google Scholar] [CrossRef]
- Wu, Q.; Schubring, D.L.; Sienicki, J.J. Feasibility analysis of two-phase MHD energy conversion for liquid metal cooled reactors. Nucl. Eng. Des. 2007, 237, 2114–2119. [Google Scholar] [CrossRef]
- Prinz, S.; Bandaru, V.; Kolesnikov, Y.; Krasnov, D.; Boeck, T. Numerical simulations of magnetohydrodynamic flows driven by a moving permanent magnet. Phys. Rev. Fluids 2016, 1. [Google Scholar] [CrossRef]
- Sivakumar, R.; Vimala, S.; Sekhar, T.V.S. Influence of induced magnetic field on thermal MHD flow. Numer. Heat Transf. A 2015, 68, 797–811. [Google Scholar] [CrossRef]
- Kakarantzas, S.C.; Benos, L.T.; Sarris, I.E.; Knaepen, B.; Grecos, A.P.; Vlachos, N.S. MHD liquid metal flow and heat transfer between vertical coaxial cylinders under horizontal magnetic field. Int. J. Heat Fluid Flow 2017, 65, 342–351. [Google Scholar] [CrossRef]
- Rizzo-Sierra, J.A.; Lopez-Hernandez, O.I. Numerical study on the magnetohydrodynamics of an oscillatory flow under inductionless and core-side-layer approximations. Rev. Mex. Fis. 2016, 62, 369–380. [Google Scholar]
- Bakalis, P.A.; Hatzikonstantinou, P.M. Effect of curvature and magnetic field on MHD flow of a liquid metal in a curved annular duct. Int. J. Numer. Methods Heat Fluid Flow 2015, 25, 1818–1833. [Google Scholar] [CrossRef]
- Takahashi, R.; Matsuo, M.; Ono, M.; Harii, K.; Chudo, H.; Okayasu, S.; Ieda, J.; Takahashi, S.; Maekawa, S.; Saitoh, E. Spin hydrodynamic generation. Nat. Phys. 2016, 12, 52–56. [Google Scholar] [CrossRef]
- Schwarz, S.; Froehlich, J. Numerical study of single bubble motion in liquid metal exposed to a longitudinal magnetic field. Int. J. Multiph. Flow 2014, 62, 134–151. [Google Scholar] [CrossRef]
- Li, W.; Lu, P.; Zheng, X.W.; Huang, H.L. Numerical simulation of working fluid effects on two-phase flow in lmmhd power generation system. J. Jiangsu Univ. (Nat. Sci. Ed.) 2017, 38, 434–439. [Google Scholar]
- Fluent Inc. Fluent User’s Guild; Fluent Inc.: Lebanon, NH, USA, 2006. [Google Scholar]
- Lee, W.H. A Pressure Iteration Scheme for Two-Phase Flow Modeling; Hemisphere: Washington, DC, USA, 1980. [Google Scholar]
- Ahmadpour, A.; Noori Rahim Abadi, S.M.A.; Kouhikamali, R. Numerical simulation of two-phase gas—Liquid flow through gradual expansions/contractions. Int. J. Multiph. Flow 2016, 79, 31–49. [Google Scholar] [CrossRef]
- Wallis, G.B. One-Dimensional Two-Phase Flow; McGraw-Hill: New York, NY, USA, 1969. [Google Scholar]


| Physical Properties | Liquid Gallium |
|---|---|
| Molar mass (g·mol−1) | 69.723 |
| Density (kg·m−3) | 5904 |
| Melting point (K) | 303 |
| Heat capacity (J·kg−1·K−1) | 383.52 |
| Heat conductivity (W·m−1·K−1) | 58 |
| Viscosity (kg·m−1·s−1) | 1.94 × 10⁻³ |
| Physical Properties | R113 | R113 g |
|---|---|---|
| Molar mass (g·mol−1) | 187.376 | 187.376 |
| Density (kg·m−3) | 1565 | 7.38 |
| Boiling point (K) | 321 | — |
| Latent heat of vaporization (kJ·kg−1) | 146.7 | — |
| Heat capacity (J·kg−1·K−1) | 912 | 673 |
| Heat conductivity (W·m−1·K−1) | 0.0657 | 0.0778 |
| Viscosity (kg·m−1·s−1) | 4.97 × 10⁻⁴ | 1.08 × 10⁻⁵ |
| Standard-state enthalpy (J·kmol−1) | −8 × 10⁸ | −6.95 × 10⁸ |
© 2017 by the authors. Licensee MDPI, Basel, Switzerland. This article is an open access article distributed under the terms and conditions of the Creative Commons Attribution (CC BY) license (http://creativecommons.org/licenses/by/4.0/).
Share and Cite
Lu, P.; Zheng, X.; Fang, L.; Huang, H.; Xu, S.; Yu, Y. Numerical Study of the Gas-Liquid Two-Phase Flow in a Self-Designed Mixer for a Ga-R113 MHD System. Energies 2017, 10, 1629. https://doi.org/10.3390/en10101629
Lu P, Zheng X, Fang L, Huang H, Xu S, Yu Y. Numerical Study of the Gas-Liquid Two-Phase Flow in a Self-Designed Mixer for a Ga-R113 MHD System. Energies. 2017; 10(10):1629. https://doi.org/10.3390/en10101629
Chicago/Turabian StyleLu, Peng, Xingwen Zheng, Lulu Fang, Hulin Huang, Shu Xu, and Yezhen Yu. 2017. "Numerical Study of the Gas-Liquid Two-Phase Flow in a Self-Designed Mixer for a Ga-R113 MHD System" Energies 10, no. 10: 1629. https://doi.org/10.3390/en10101629
APA StyleLu, P., Zheng, X., Fang, L., Huang, H., Xu, S., & Yu, Y. (2017). Numerical Study of the Gas-Liquid Two-Phase Flow in a Self-Designed Mixer for a Ga-R113 MHD System. Energies, 10(10), 1629. https://doi.org/10.3390/en10101629