4.1. Energy Use Efficiency
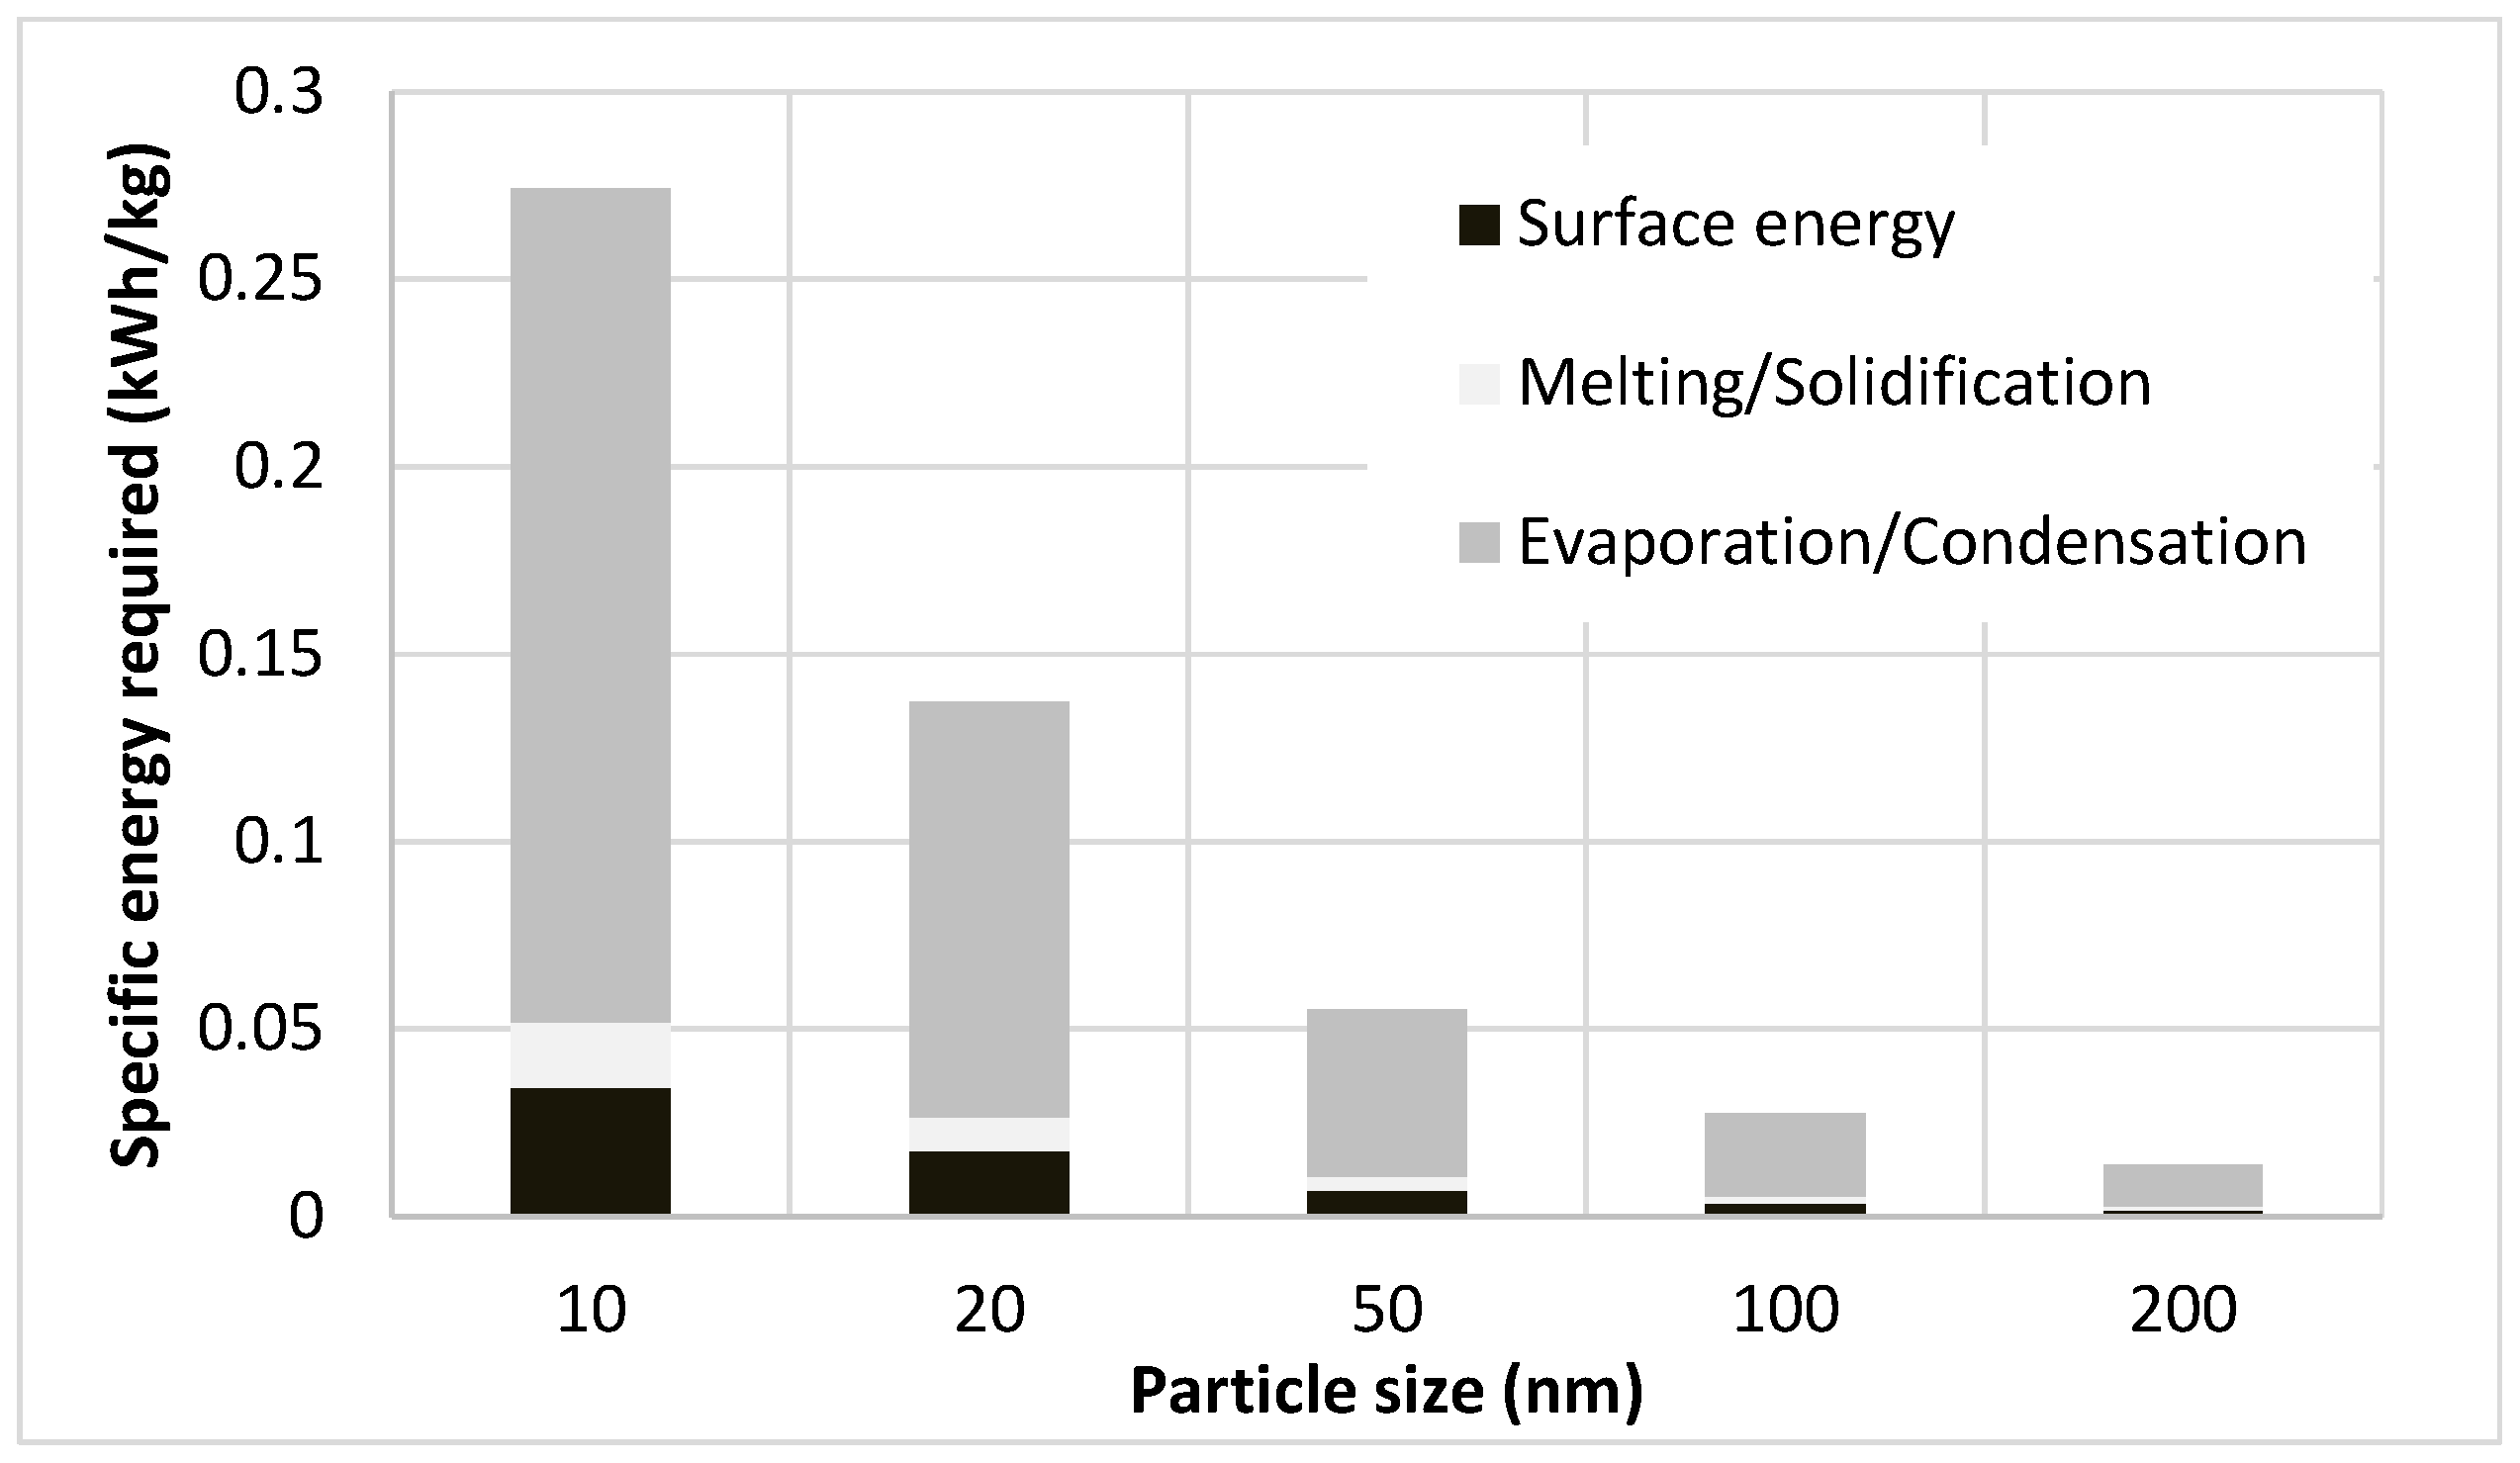
Referring to the exergy analysis given above (Equations (1)–(4)): calculating the electrical energy input requirements for copper NP, for example, (γ (T
mb) = 1.576 J/m
2, b = −0.338 mJ/m
2·K, d = 0.283 nm, P = 1.497 nm, T° = 298 K) gives the results as given in
Figure 4, for five different NP sizes. Thus, the thermal effects give a much larger contribution to the energy input requirements than the actual creation of surface energy. Moreover, the calculated value is several orders of magnitude lower than experimental values: for ~80 nm copper NP [
14] recently reported a specific electricity consumption of 179 kWh/kg. A similar difference was found for other metals, motivating the energy use assessment reported here, including the measurements at the mOSU set-up at UDE.
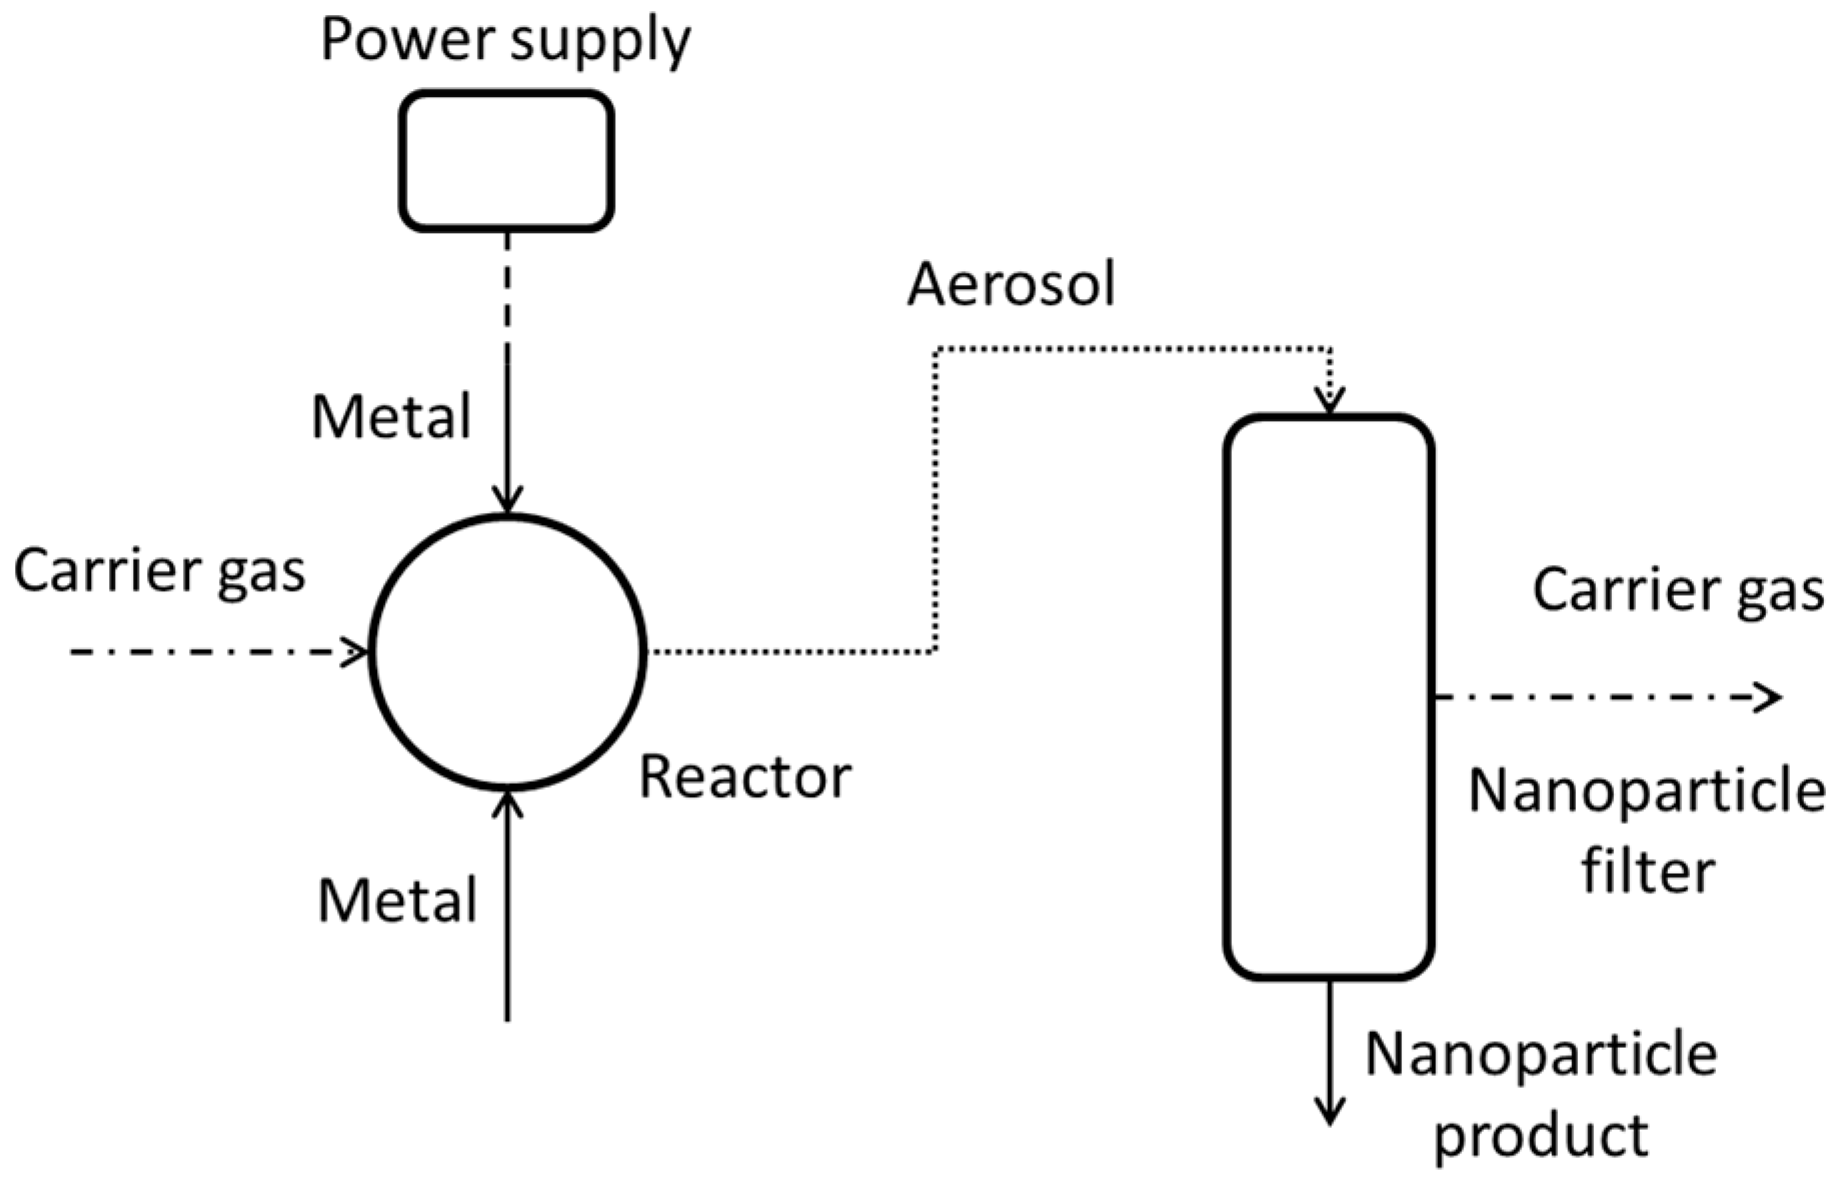
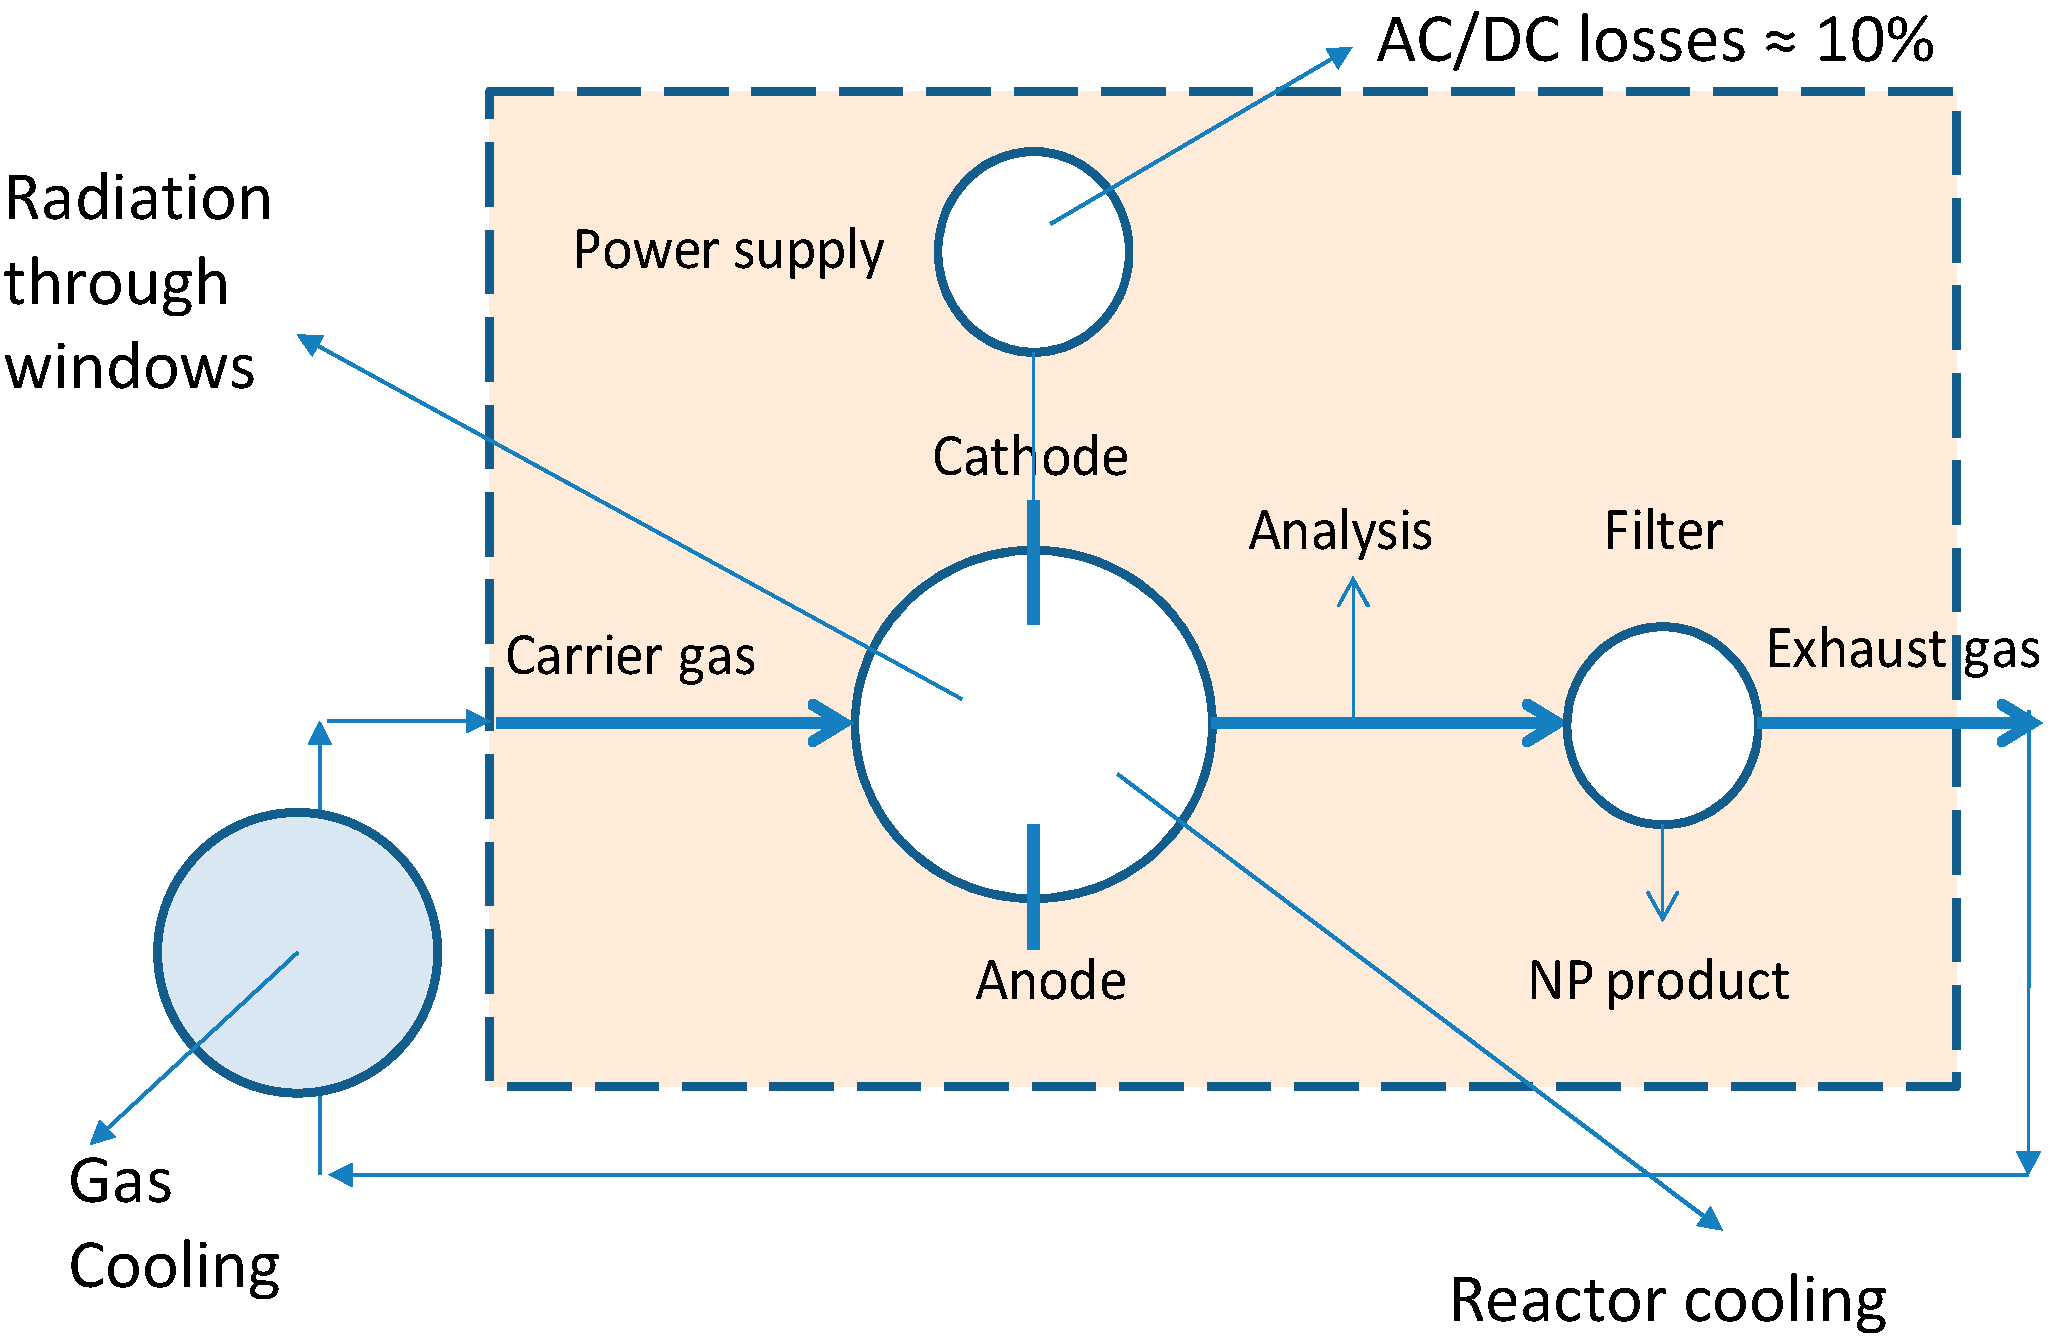
The measured SEC for all of the tests carried out by all project teams are 2–4 orders of magnitude, depending on NP size, larger than what would be expected by the exergy analysis as given above. In order to find out reasons for this, the heat and power loss of the setups was studied. During two test campaigns at the UDE 2 × 8 mOSU facility measurements of temperatures and electrical input were made. The goal was to determine how the electrical energy input eventually leaves the system as, for example, cooling heat. The layout of the process from the viewpoint of these assessments is given in
Figure 5.
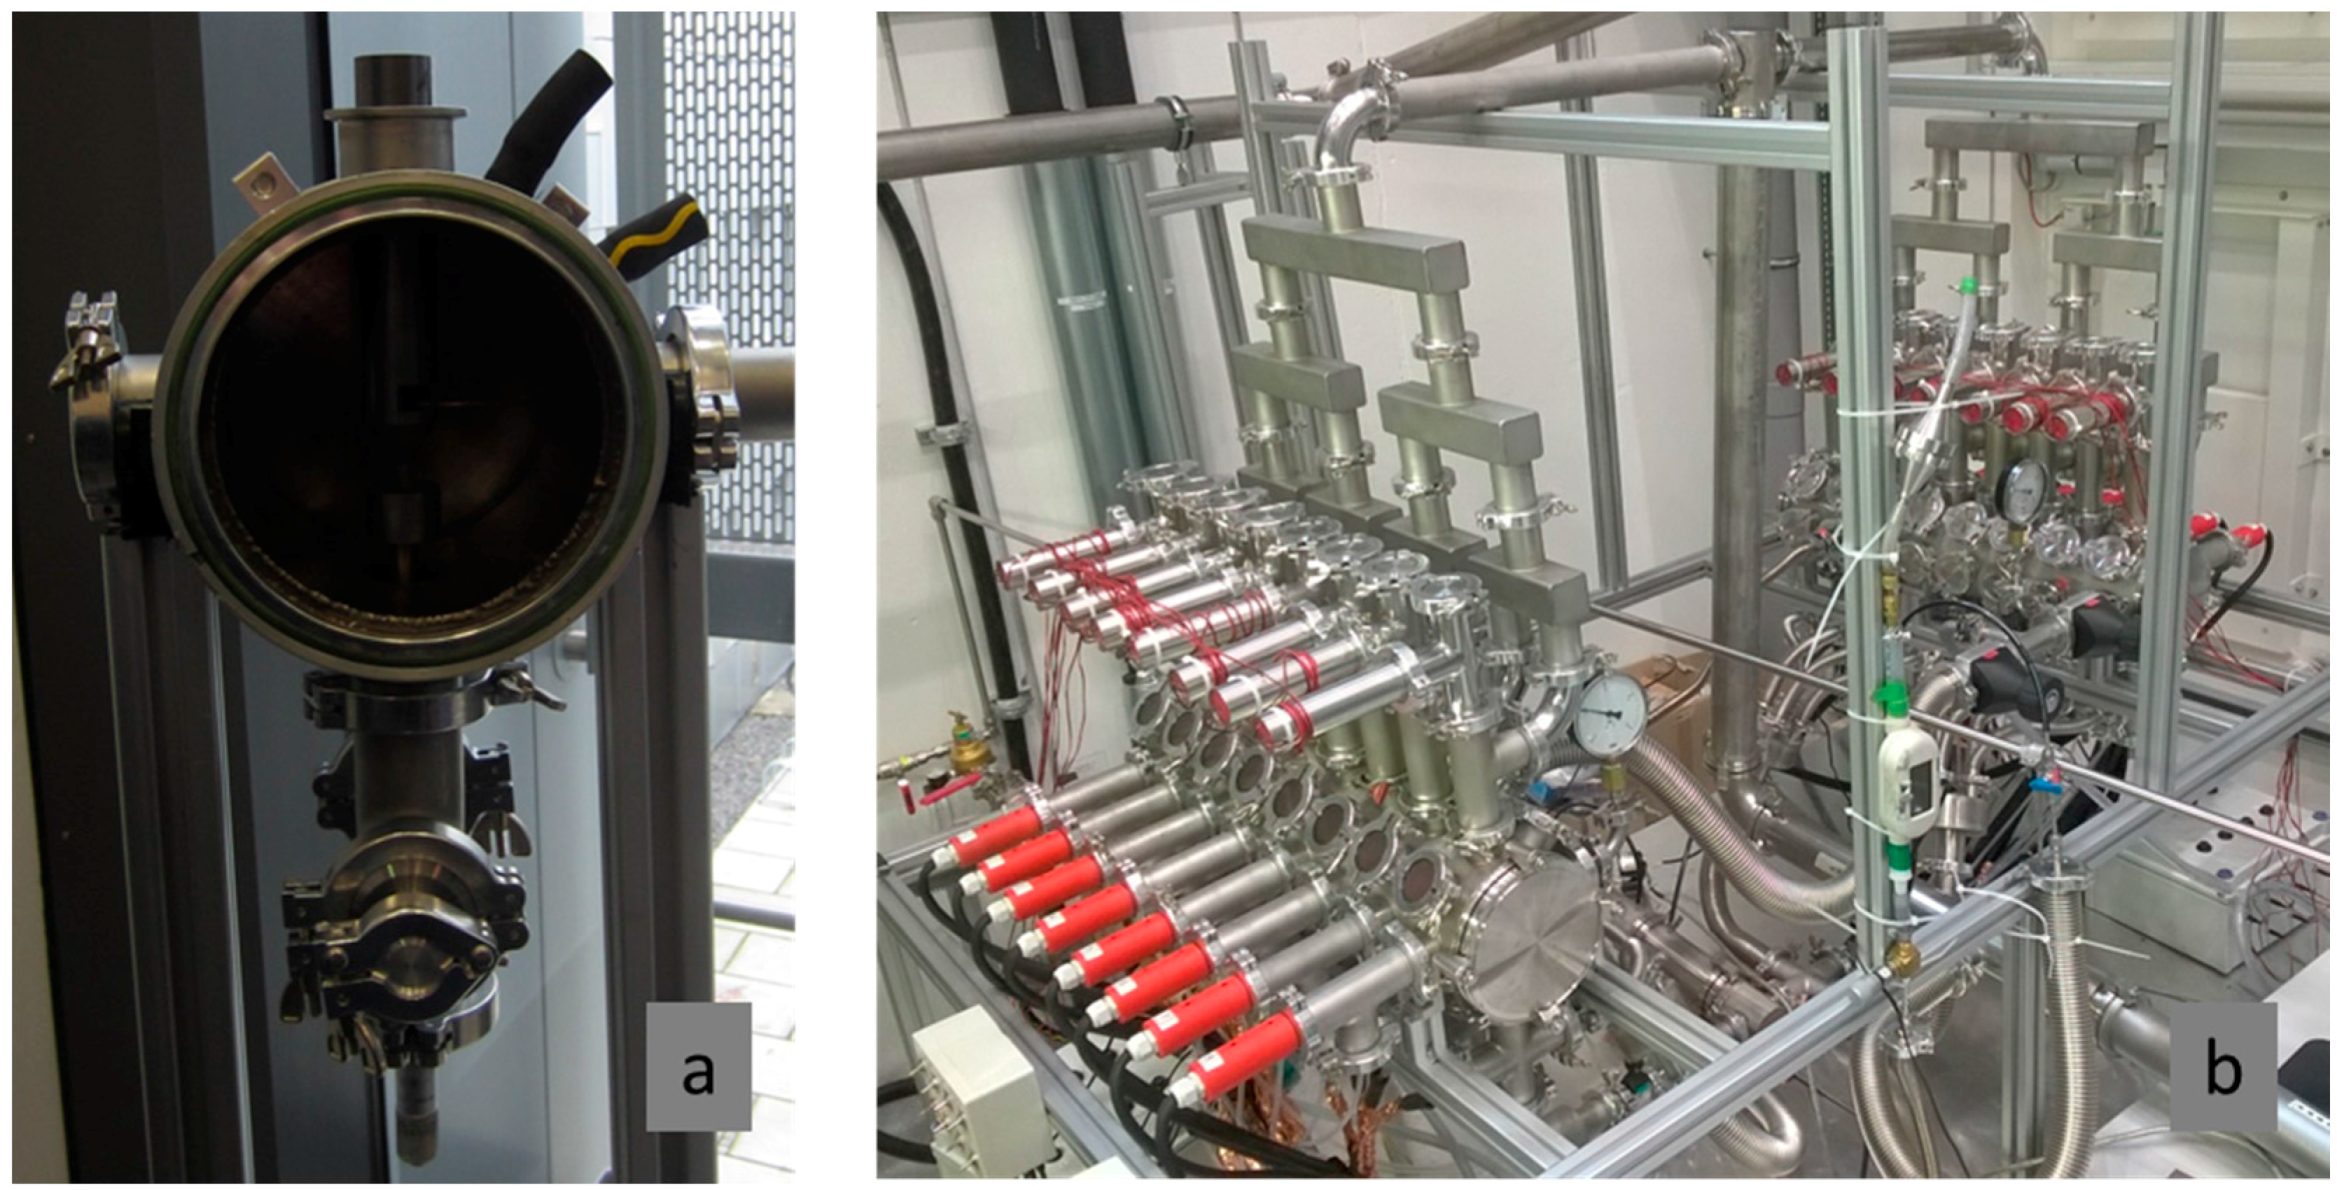
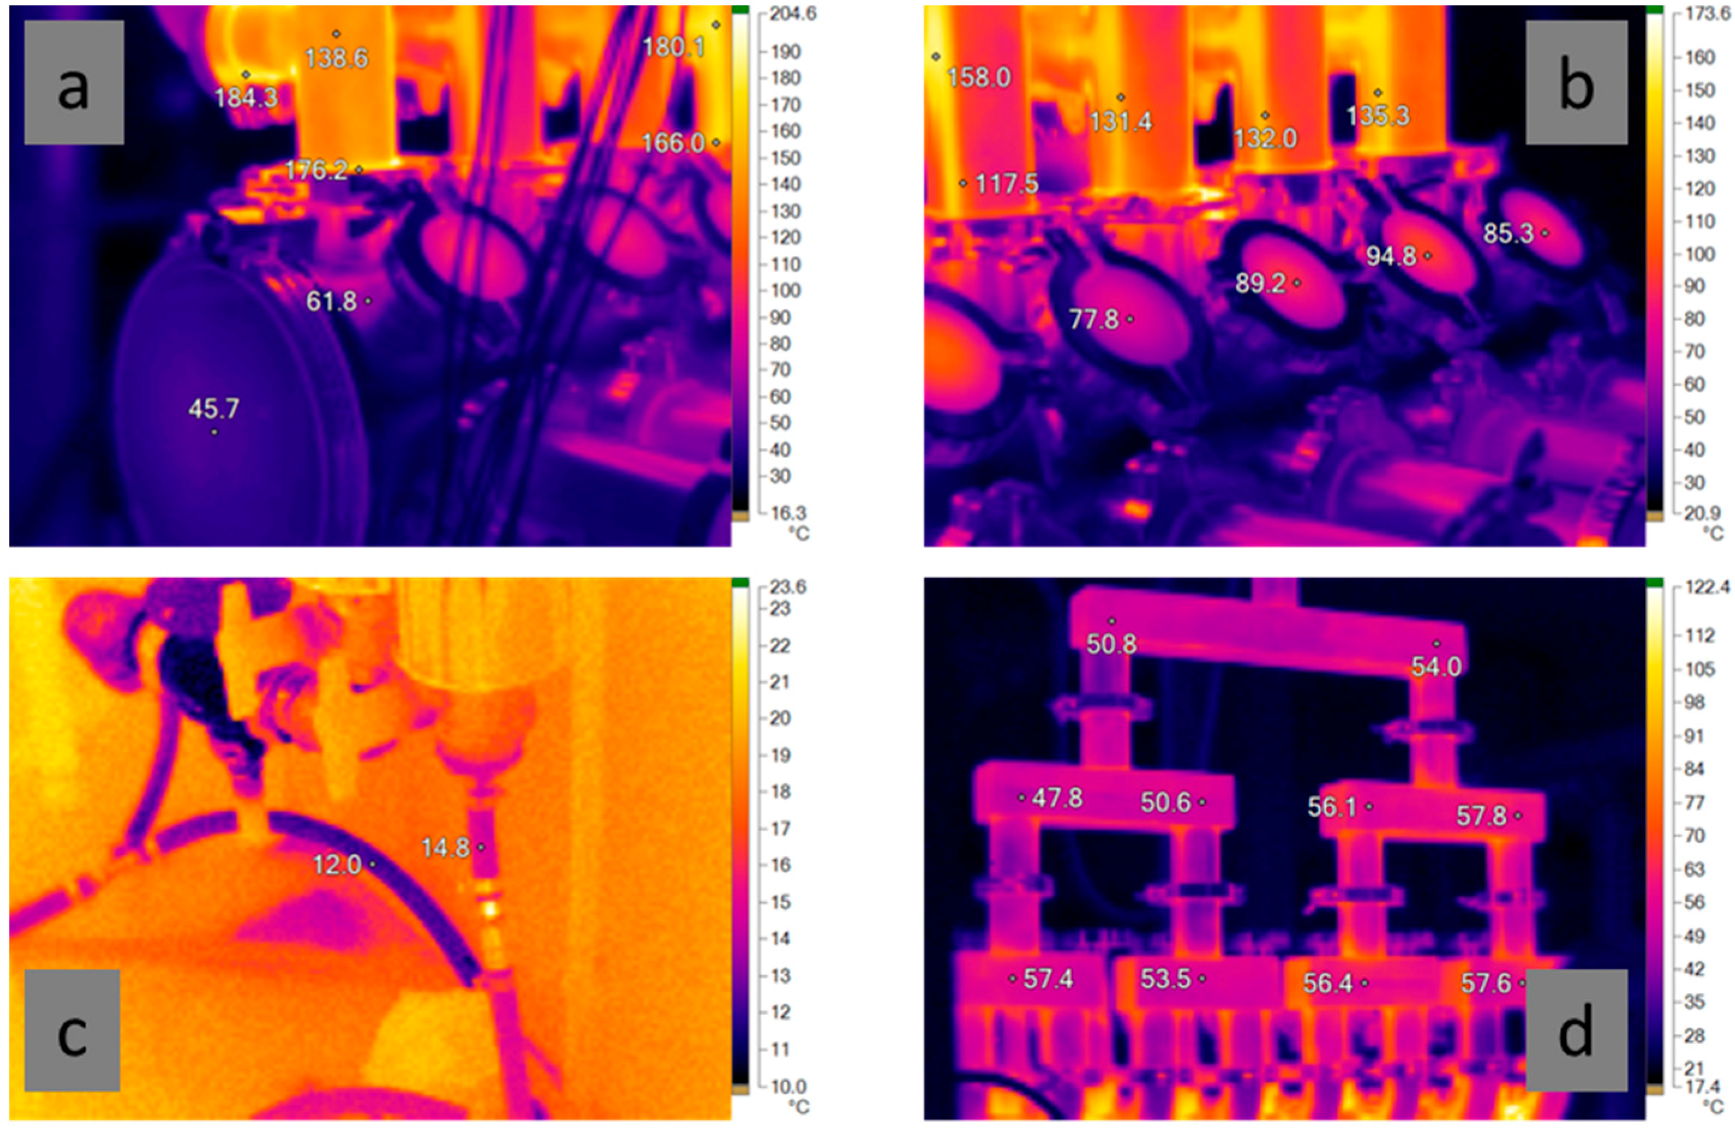
During the first test, while producing Cu NP (at ~4.6 g/h) using one mOSU consisting of eight OSU, temperatures were measured using an infrared (IR) camera (Ti9, Fluke, Everett, WA, USA) and an infrared thermometer (Quicktemp 860-T2, Testo, Lenzkirch, Germany), respectively. The flow and temperatures of in- and outgoing cooling water was recorded during roughly 2 h using a flow and temperature instrument on the cooling water hose, until a steady state appeared to have been reached. M. Stein at UDE (personal communication) suggested that a thermal steady state (constant temperature) is for most of the stainless steel components reached after 45–90 min.
Figure 6 shows a few examples of IR temperature recordings made during the mOSU tests. As seen in
Figure 6a,b the reactor housing is significantly cooler, thanks to the water cooling, than the uncooled reactor outlets. The reactor housing is between 40–70 °C and the viewing windows at 75–95 °C while the outlets are well over 100 °C, in some places closer to 200 °C. As shown in
Figure 6c the temperature rise of the cooling water was only a few degrees. After leaving the reactor housing the gas rapidly cools to around 55 °C in the gas collection tubing as seen in
Figure 6d.
For the electric input of 1810 W per arc unit, giving a combined electric input of 14,480 W for the mOSU, 10% will be dissipated as AC/DC transformer losses while 17–34% (300–600 W per OSU) was taken out of the system by the cooling water. Convective + radiative losses were estimated at 22 + 2%, respectively, based on measurements of temperatures and ventilation air flows in the laboratory combined with system size data and literature expressions for calculating heat transfer rates (e.g., [
28]). This gives an overall energy balance closure of 55–70%, noting that the system did probably not reach a thermal steady state while many (metal) parts were still heating up. Unfortunately, no information could be obtained for the recycled gas cooling water unit. Also the gas (at ~70 L/min per OSU) from the mOSU half consisting of eight OSUs in operation was mixed (and cooled) downstream of the production chamber with gas flowing through the other mOSU (8 OSUs) that were not in use. The gas flowing through the unused mOSU is cooler as no arc discharge is taking place that would introduce energy into the chambers.
Therefore, a second test was made, operating 6 + 4 OSU of the 2 × 8 mOSU unit again producing Cu NP. The total gas flow was 1600–1700 L/min (~100 L/min per OSU). According to the cooling water temperatures, ~255 W per OSU cooling corresponds to 14% of the arc power supply energy use, significantly lower than the first test. Unfortunately, the power consumption of the gas circulation pump could not be determined. Nonetheless, it was confirmed that most (more than 99%) input energy (electricity) used leaves the system as heat via various cooling systems. After all, there was no mass leaving the system and only a fraction of the input energy was used to produce the NP surface area, as discussed above.
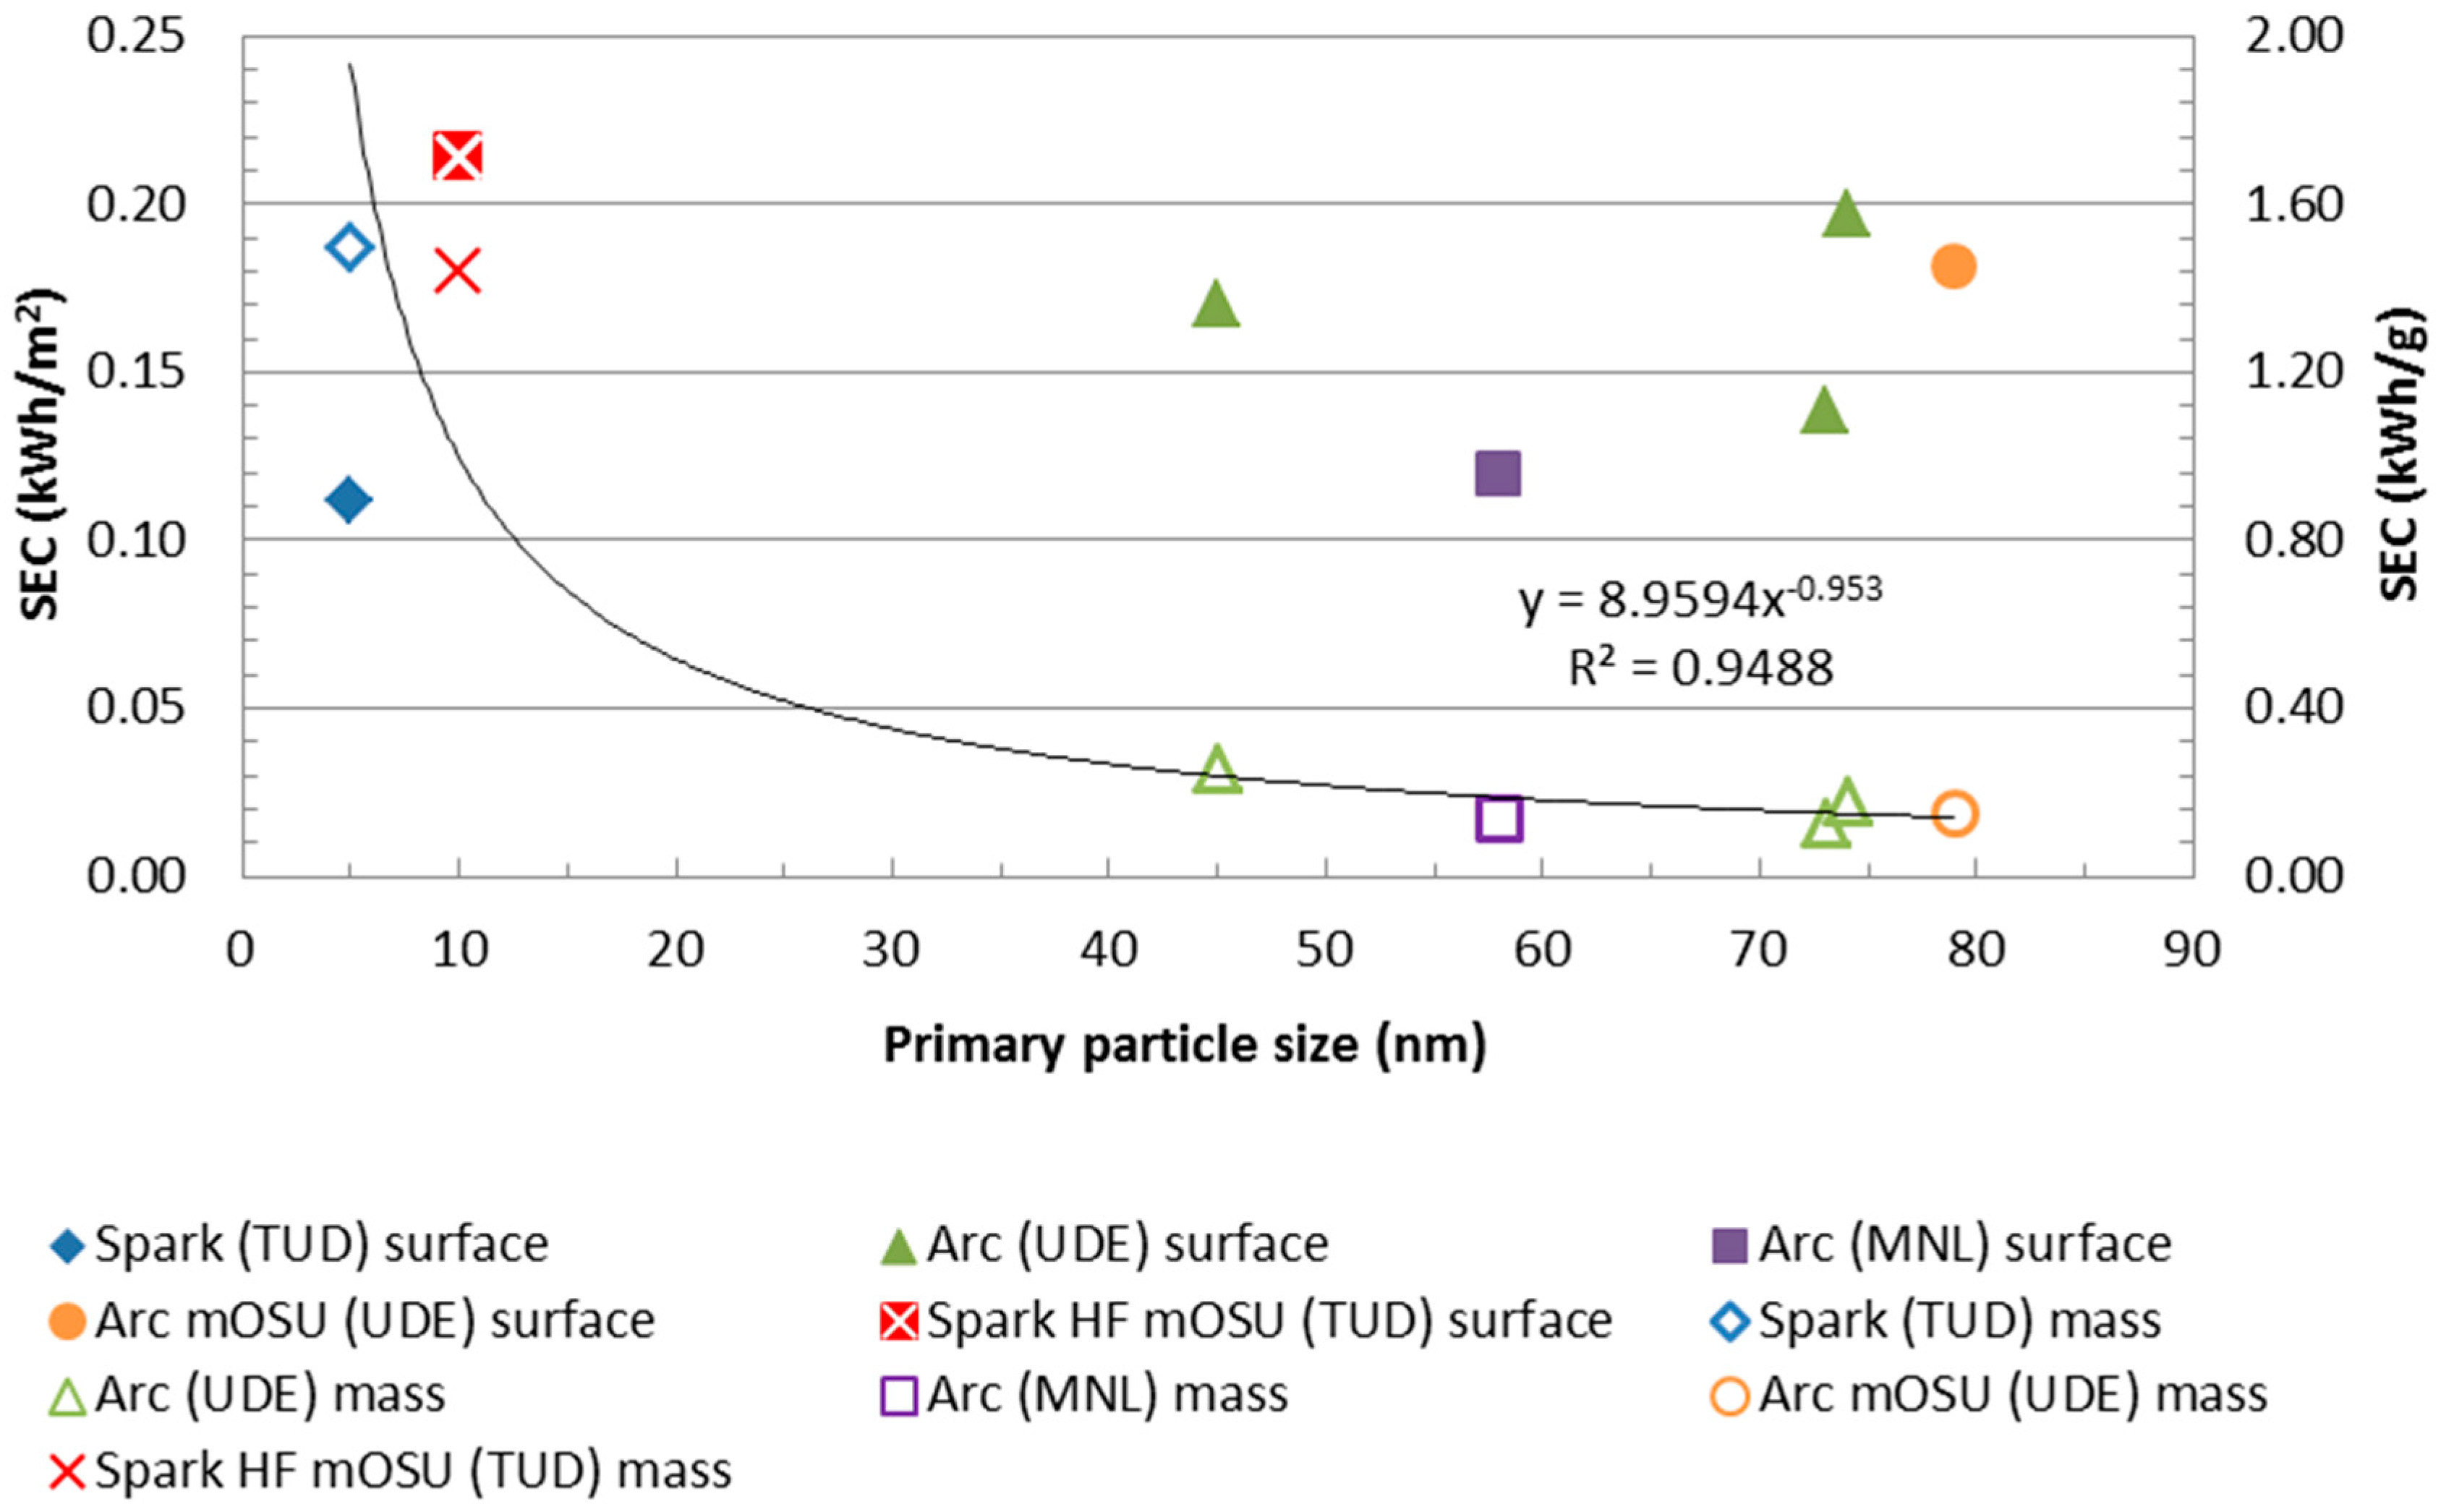
Previously the power consumption of the electrical discharge evaporation and condensation process for producing the NPs was evaluated based on the SEC per NP mass. Another way to compare the power demand for the process is to compare the electricity use per generated primary particle surface area.
The SEC per surface area appears to be hardly a function of primary particle size. As can be seen in
Figure 7 the SEC per NP mass is similar for particles the size of 45 to 80 nm while the SEC for the 5 nm particles was significantly higher: this can be explained using the exergy analysis as decribed in
Section 2.1. There seems to be a clear correlation in the SEC needed to produce one gram of NP as can be seen by the trend line in the figure. The regression coefficient, R
2, for the correlation is good being 0.95 for a power law correlation (less good correlations were obtained with other few-parameter expressions). For the SEC per produced NP surface area no good correlation could be found, the closest fit giving an R
2 of only 0.02.
4.2. LCA and Production Scale-Up
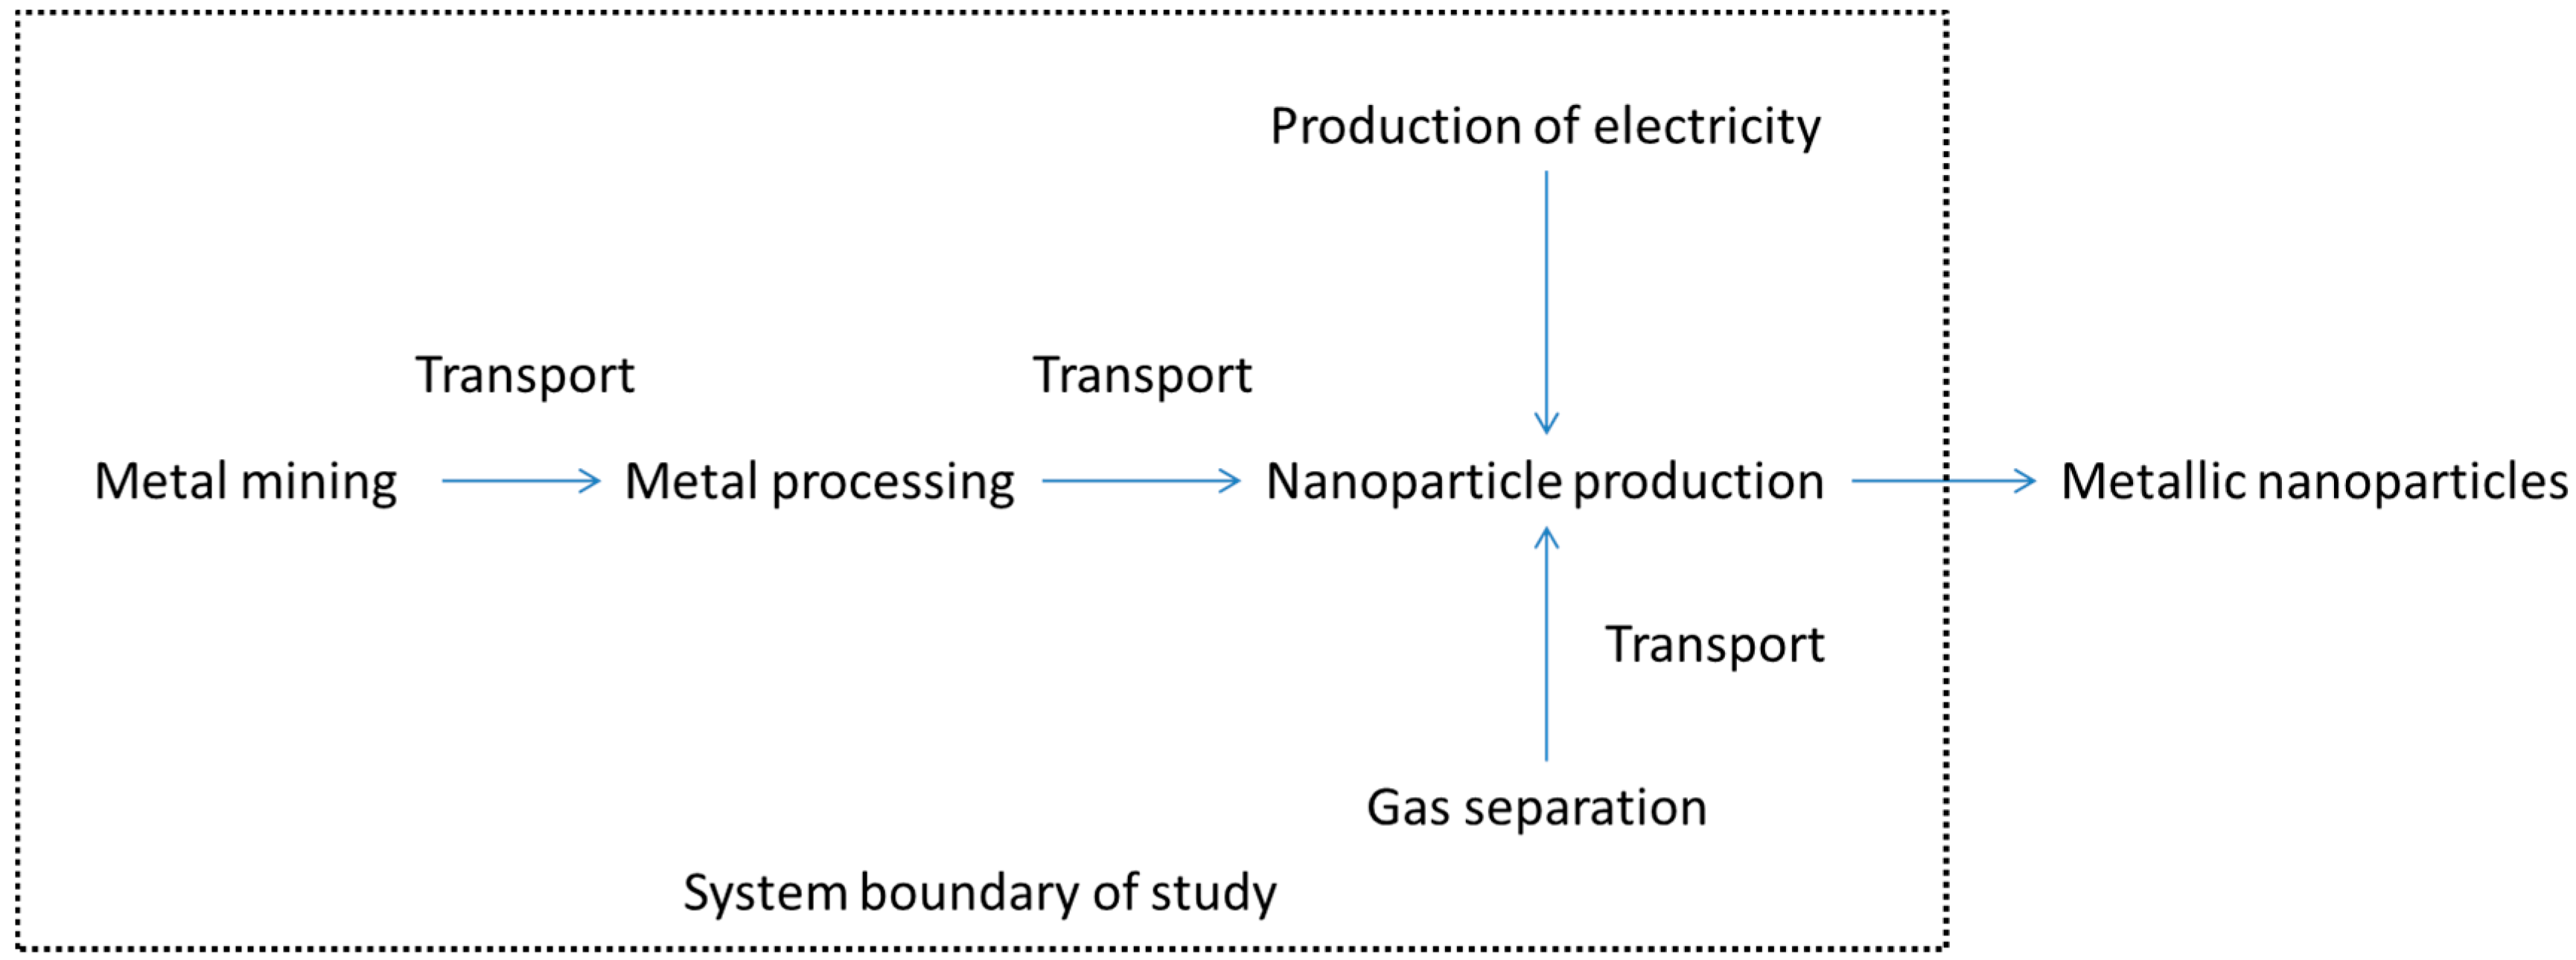
Experimental data from a series of tests performed using the mOSU setup (2 × 8 OSUs) at UDE was analysed and used to calculate the environmental impact for the particles as a function of the number of OSUs used. The input and outputs of the study can be seen in
Table 4 and are based on
Table 2. For all cases the feedstock is copper and the carrier gas is nitrogen. Production and transportation of the metal and gas are included and taken into consideration as discussed in
Section 2.3. The table only shows the input and outputs for four out of fifteen points used in the LCA. Values for the remaining points are in-between values given. The electricity used in the study is according to the EU-27 consumer grid mix, under 1 kV.
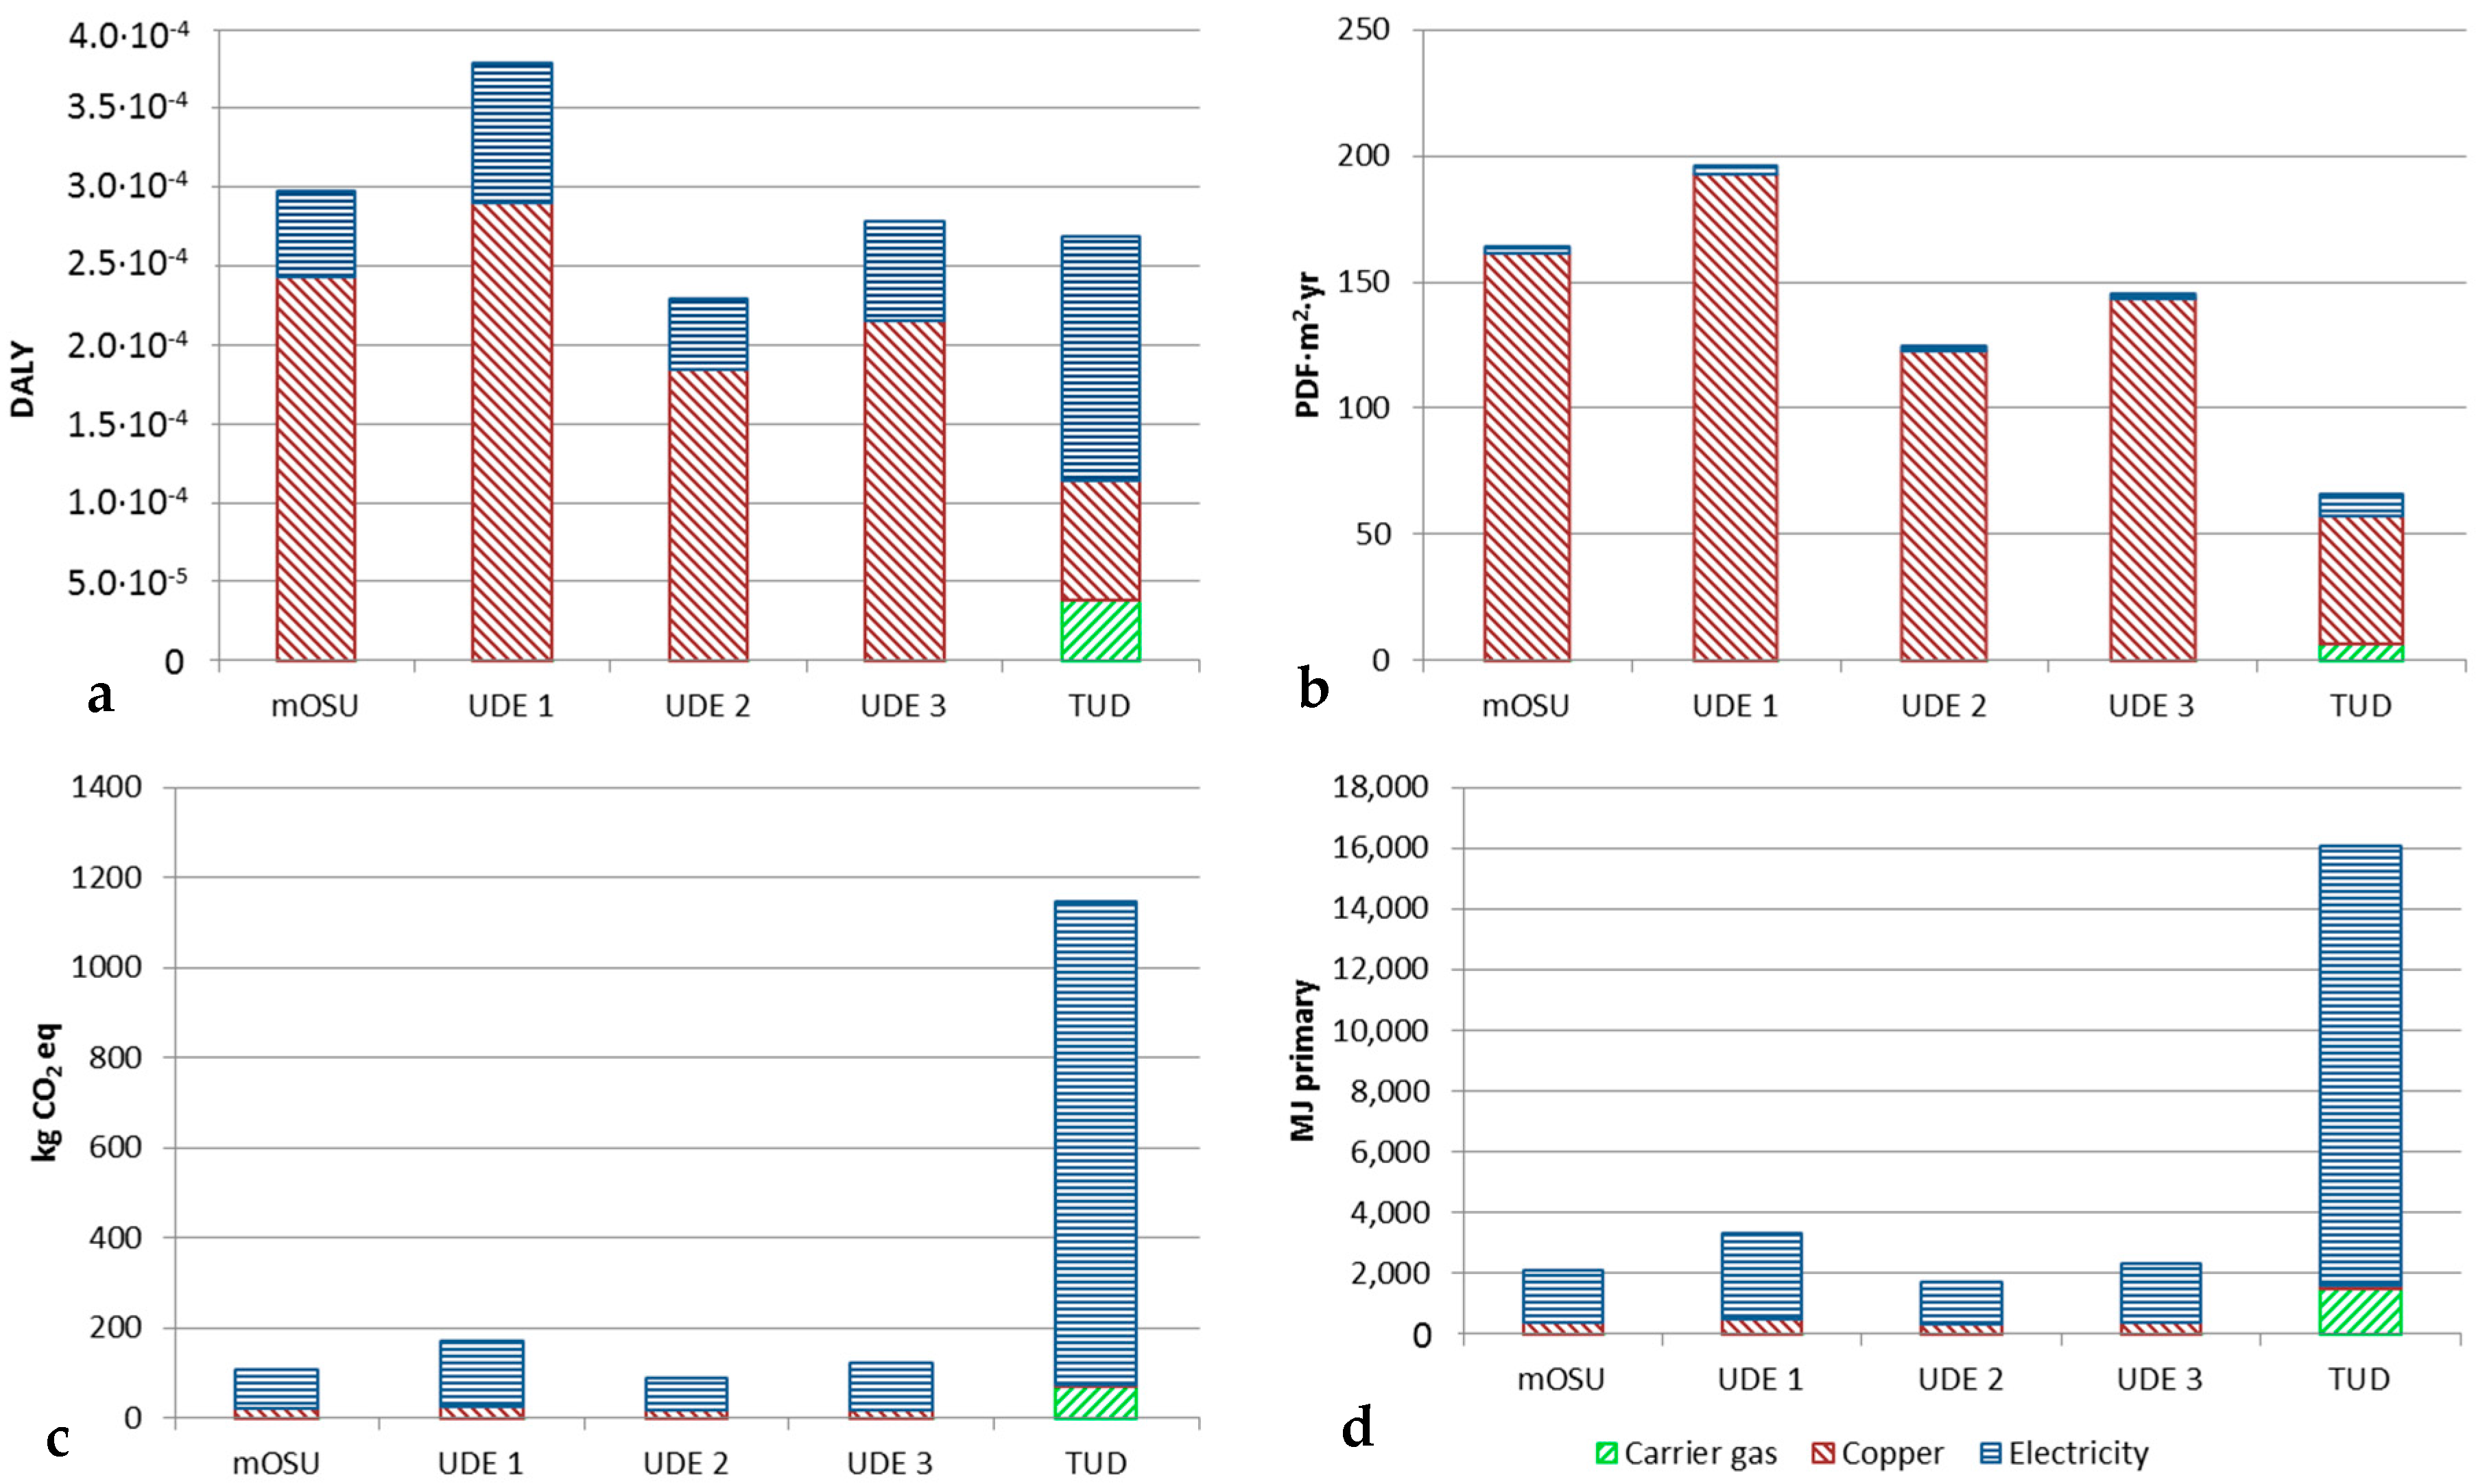
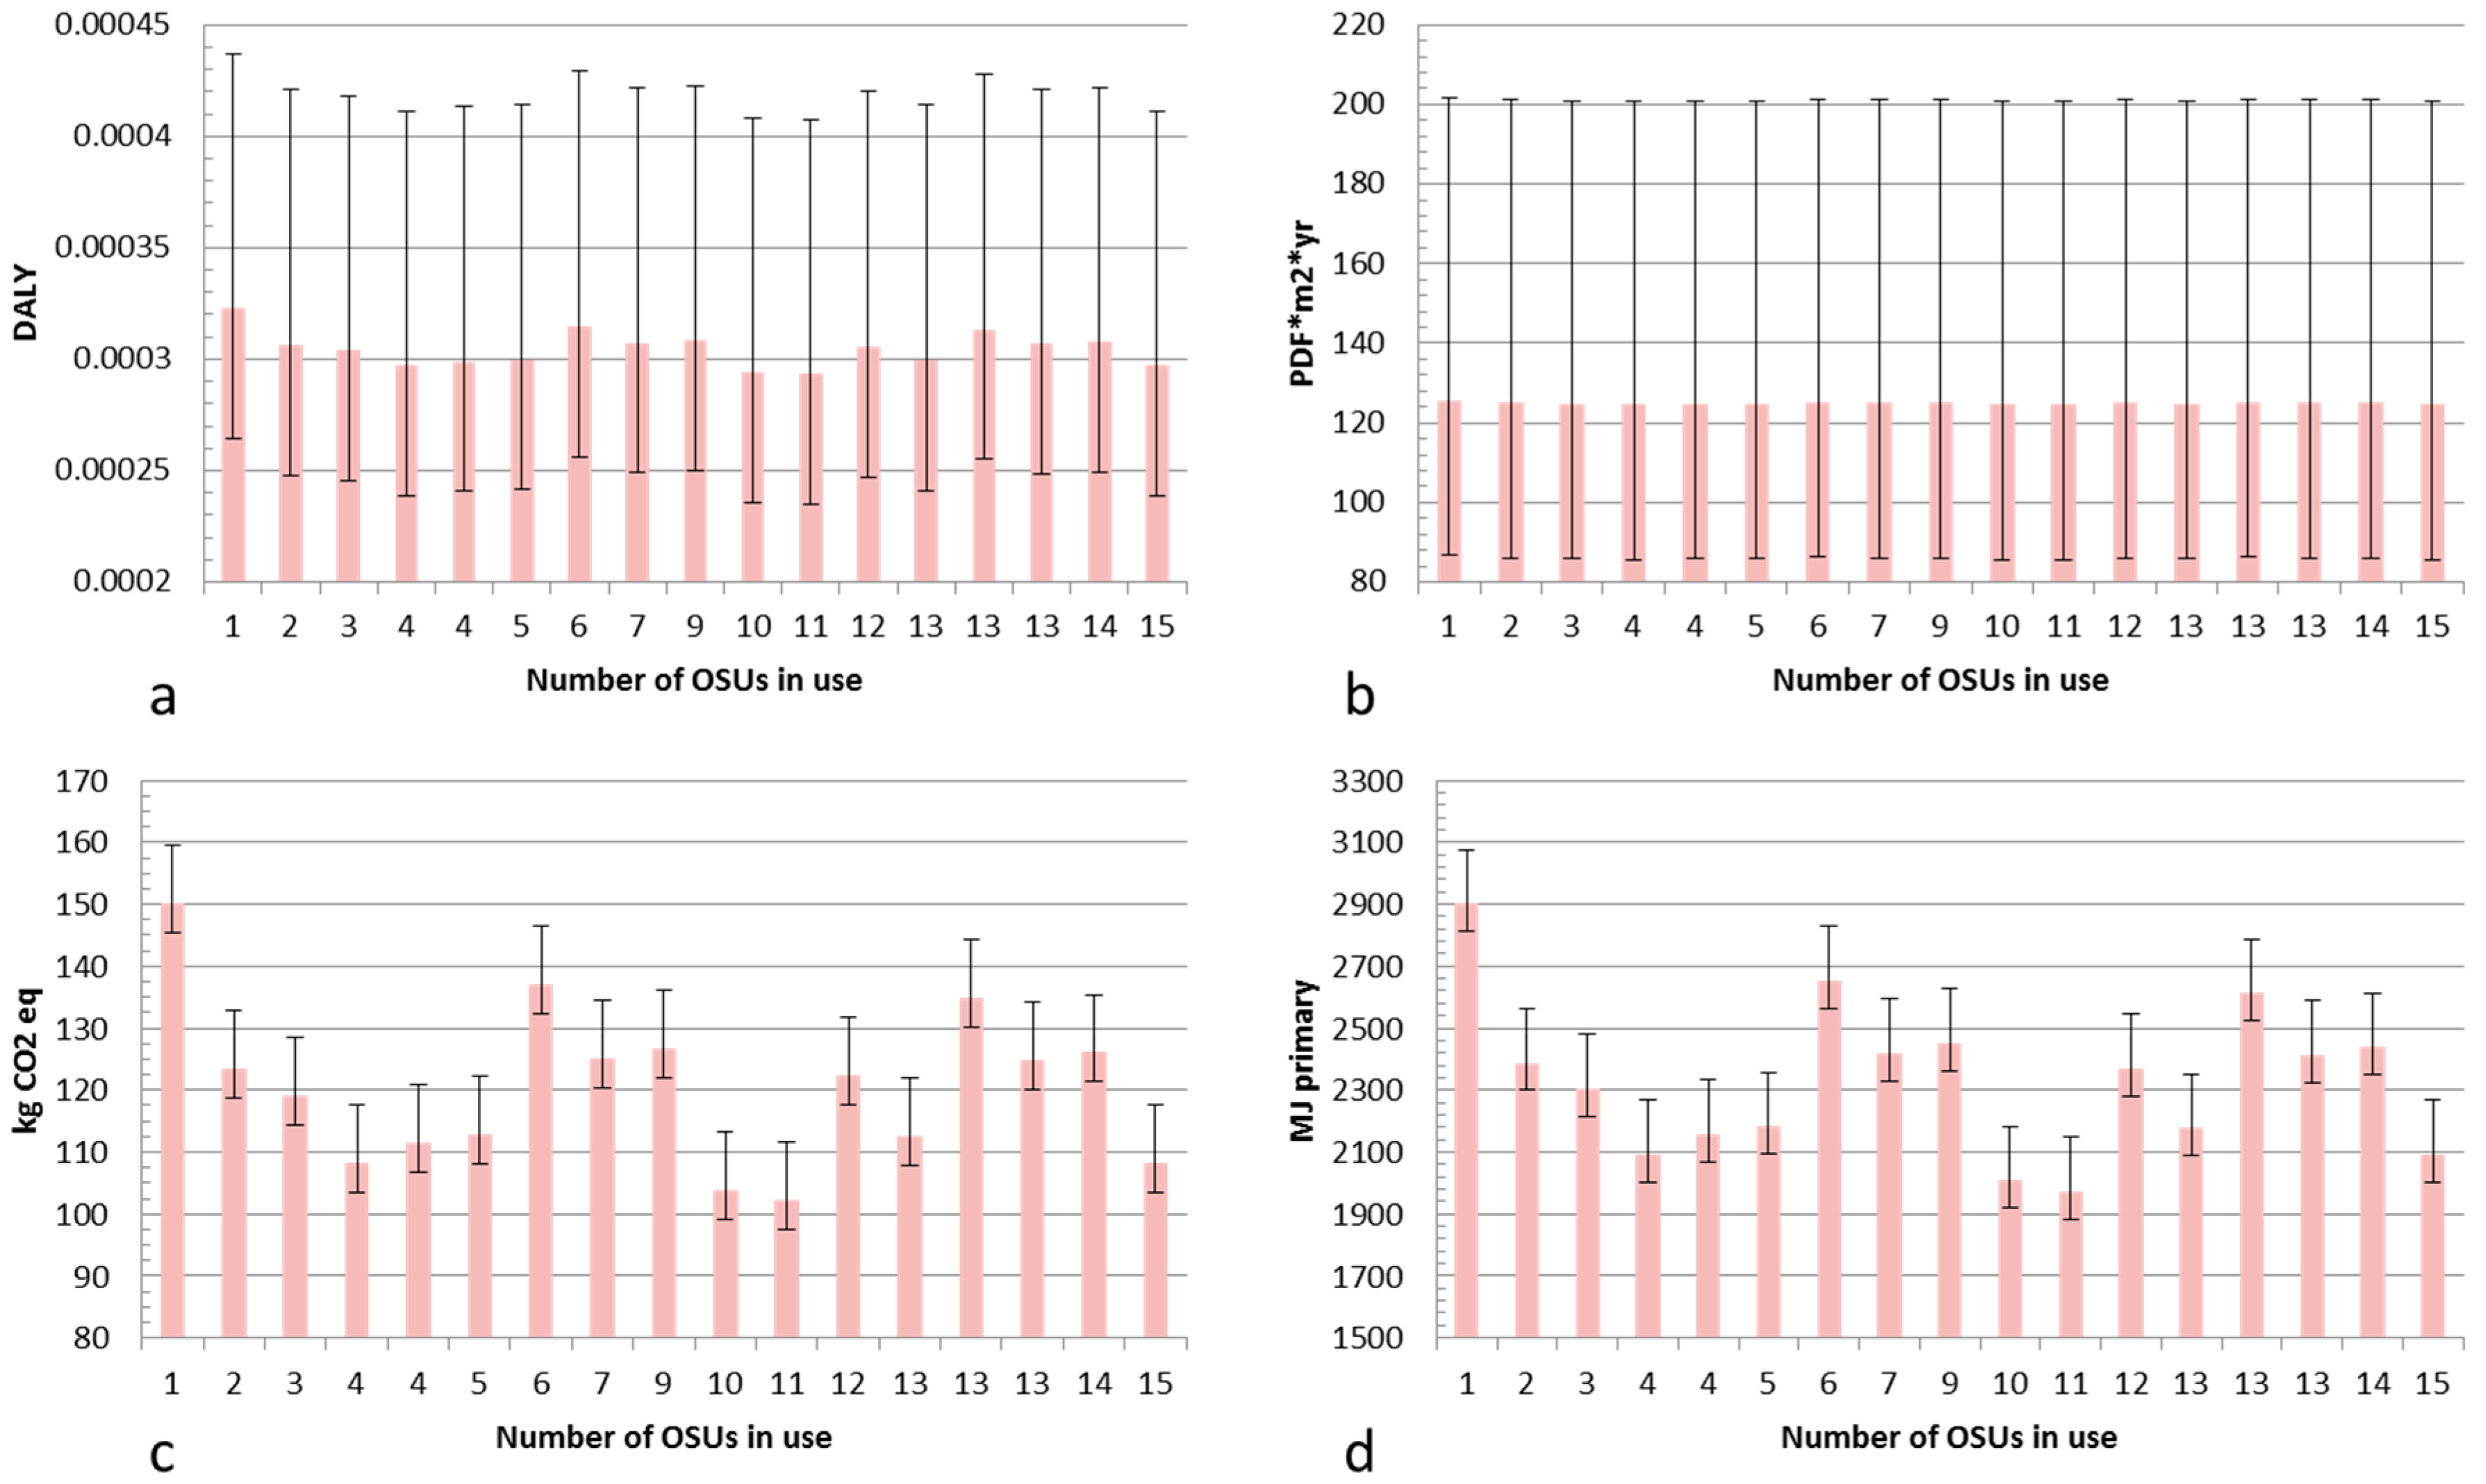
The LCA results for Cu NPs produced using an mOSU with arc discharge evaporation are shown in
Figure 8. The results are given for a material yield (production efficiency) of 25% while the “error bars” show the impact for particles produced with an NP material yield ranging from 17% (bar upwards error) to 32% (bar downwards). These material yields were chosen as they show attainable yields for a mOSU based on experimental data (17% and 25%) and a good yield for a single OSU setup (32%). Most of the experiments carried out gave product yields close to 25% with significantly higher or lower yields were achieved in only a few cases. Therefore, the bars in
Figure 8 are given for a yield of 25%.
As can be seen in
Figure 8a–d the environmental impact is not dependent on the number of OSUs in use but rather on other factors. The lowest impact was from NPs produced using 11 OSUs as in that test the SEC was the lowest at 143 kWh/kg NP while it was the highest with only one OSU with an SEC of 208 kWh/kg NP. The variation in material yield has a significant impact on the life cycle impact for the particles in both the Human Health and Ecosystem Quality categories while the impact is smaller in the Global Warming and Resource Depletion categories. Apparently, the additional tubing in the mOSU setup give rise to material losses that result in a higher life cycle impact compared to an OSU. This can be seen in
Table 1 when comparing the collection efficiency of the OSU and mOSU.
Table 5 shows the environmental impact of the three main contributors, i.e., the carrier gas, the copper metal and the electricity used in the process. As seen, the copper metal contributes most in the Human health and Ecosystem quality categories while the electricity dominates the environmental impact in the Climate change and Resource depletion categories.
When it comes to the scale-up by parallelization from OSU to mOSU: as mentioned above there is no significant difference between the SEC for Cu NP production. Assuming that this holds likewise for the other metals it makes the LCA study outcome fully dependent on the metal-to-NP production efficiency. The feeding rate of Cu to the mOSU, equal to the evaporation rate can be estimated (based on the outcome of experimental work) to be equal to 4× the above-mentioned production of 4.17 g/h per OSU, hence, about 16 g/h per OSU. No Ag or Zn NPs were produced with UDE’s 2 × 8 mOSU and therefore a similar evaluation cannot be given for Ag and Zn as for Cu.
The life cycle impact for Cu NPs produced in arc OSU and mOSUs as well as in a spark OSU could be calculated and compared. In both arc setups nitrogen was used as carrier gas while argon gas was used in the spark setup. The spark setup with argon can be compared with the arc setups in order to see how the carrier gas and discharge modes affect the environmental impact of the NP production processes. The inputs and outputs of the study are given in
Table 6. For the data marked mOSU and UDE EU-27 consumer grid mix was assumed for the electricity while Dutch consumer grid mix electricity was assumed for the TUD tests.
Figure 9 shows the life cycle impact for one experiment with a mOSU using 15 OSUs, three experiments with arc OSUs and one experiment with a spark OSU. The arc OSU and mOSU experiments were carried out by UDE while the spark OSU experiment was done at TUD. As can be seen the life cycle impact in the Human Health category is similar for all five experiments. In the Ecosystem Quality category the impact of the NPs produced with the spark method is smaller than for the arc methods. In both the Climate Change and Resource Depletion categories the life cycle impact of the spark process is significantly larger as a result of the much higher SEC for producing NP in argon, giving smaller NP than in nitrogen. The impact of carrier gas production itself is clearly visible for argon but not for for nitrogen but this does not give a significantly different overall result. A higher product yield for the TUD spark process compared to the UDE arcs explains the smaller environmental footprint for producing the input copper material for the spark unit.
Scale-up from OSU to mOSU showed no significant differences in SEC, as was shown in
Table 1, apparently reducing scale-up to a linear addition, which implies “adding up” OSUs or mOSUs until the required production rate is obtained [
4]. While the SEC of the power supplies for each arc is independent of scale for the design of the system, it is very important for the metal-to-NP production efficiency and electricity use for gas circulation. For all three metals Ag, Cu and Zn much can be gained if electricity consumption (i.e., cooling needs) can be reduced. For silver, however, it may be challenging to be competitive with conventional (wet chemistry) NP production, due to the high SEC for producing Ag NP with the arc or spark process. Nonetheless, the use of an arc or spark discharge system offers the opportunity of substituting for the use complex chemicals in wet routes, as we analysed and reported earlier [
27].
The life cycle impact contributions for NP metal production using an arc discharge depends on SEC and consumption of carrier gas (in this study a 99.5% recycling efficiency is assumed), besides the life cycle impact for producing the input metal which is independent of the scale of NP production. The other contribution to life cycle impact is the type of carrier gas used which will affect NP particle size and production rate: for nitrogen the life cycle impact contribution will be of the order of a few % whilst for argon that could increase to 20% for Cu NP (based on experience at project partner MNL).
4.3. Commercial Product Application of Metallic NPs
An important part of the BUONAPART-E project was to find and study applications for the produced NPs. Three such applications were studied in greater detail: silver NPs in textiles for anti-bacterial properties, copper NPs as nanofluid dispersion in water for iron- and steelmaking cooling application and zinc NPs mixed into poly propylene (PP) plastic as to enhance flame retarding properties, respectively. The life cycle impact of these product applications has recently been presented in detail elsewhere by Slotte and Zevenhoven [
29].
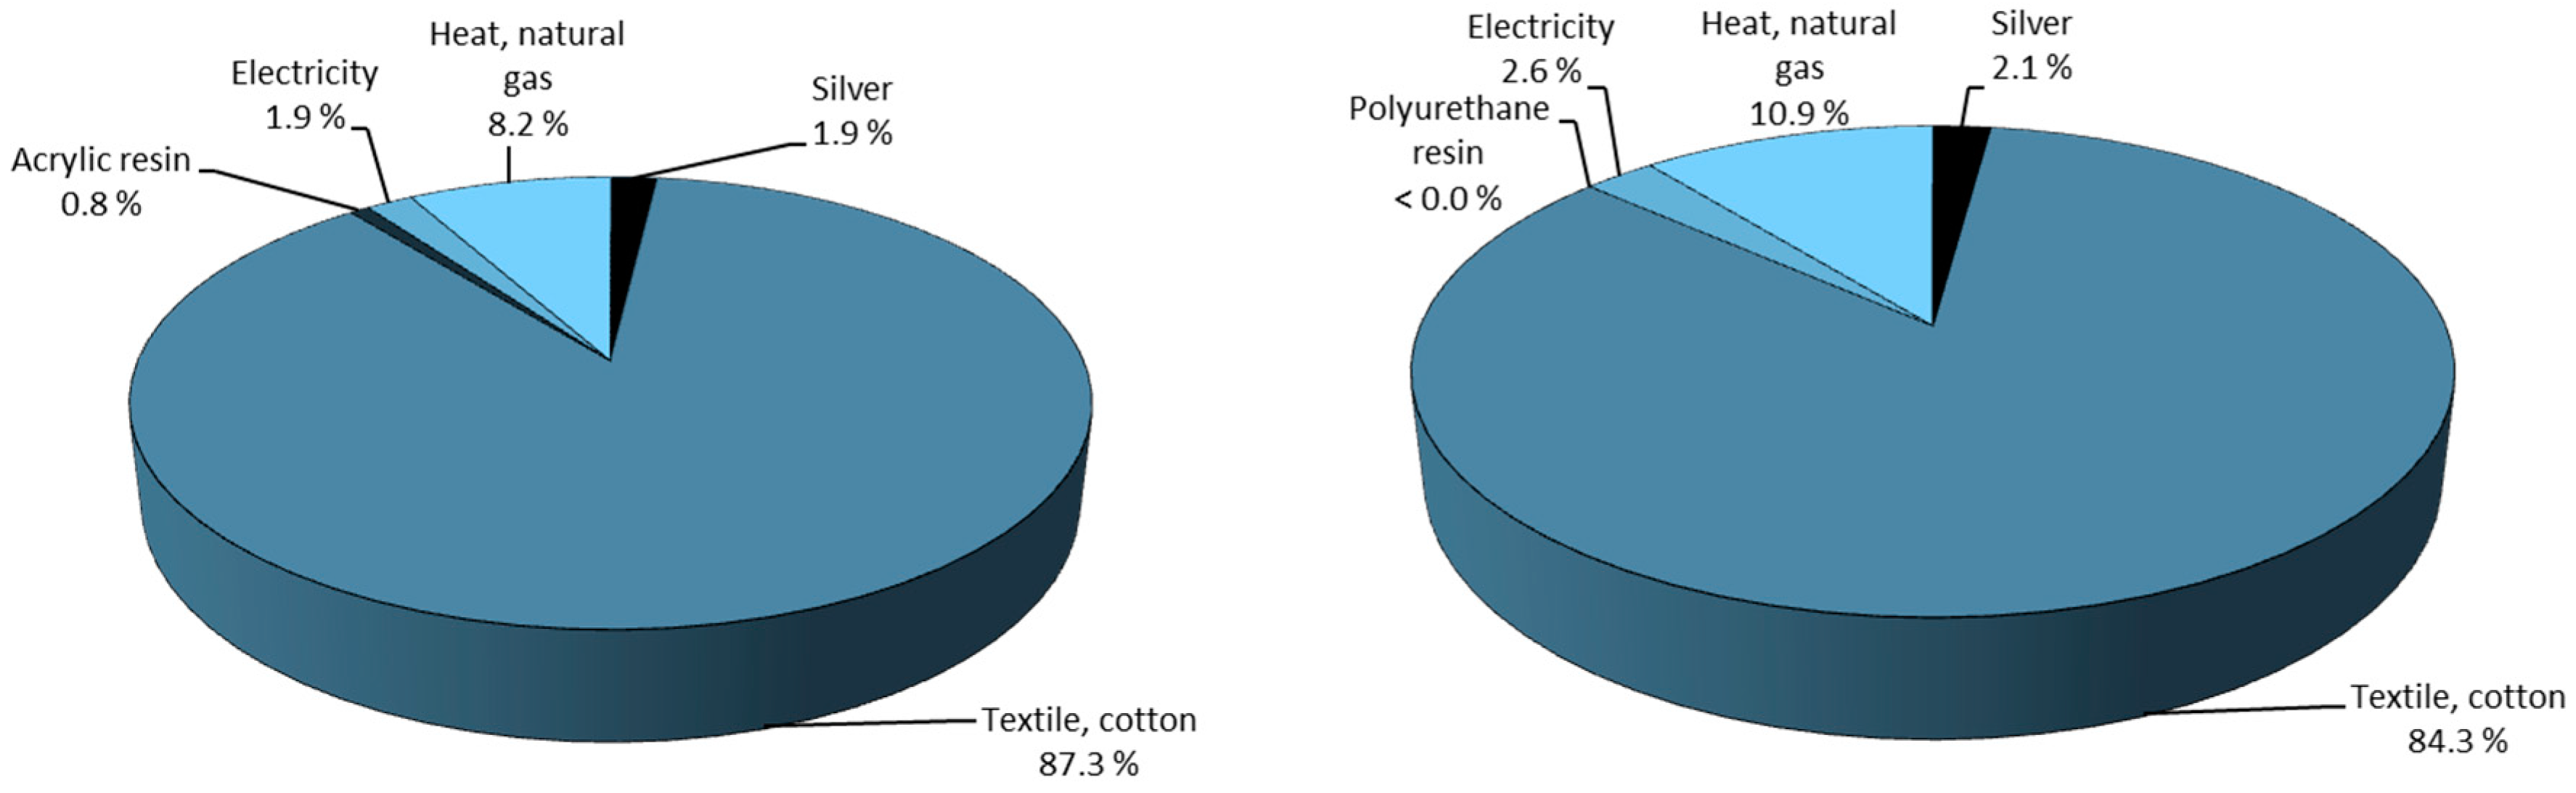
To illustrate this, the life cycle impact breakdown for the production of silver nano-coated cotton textile for medical applications using acrylic or polyurethane resin is given in
Figure 10. As shown, the majority of the environmental impact comes from the production of cotton textile while the production of the silver NPs only makes up for 2%. Slotte and Zevenhoven concluded that the CO
2 equivalent emissions for both the arc process are comparable to those presented by Walser et al. [
30] for T-shirts treated with silver NPs.
Treating one T-shirt required 0.021 g nano-Ag and gave a global warming impact of 0.20 kg CO
2 equivalents. Production of the Ag NP-containing resin containing the same amount of Ag NP produced by the arc process released 0.0000577 kg CO
2 equivalents. The impact of producing the resin coating for the cotton textile has a significantly lower impact compared to the T-shirt coatings. It shows that when considering the contribution to global warming the impact of the production method for the Ag NP and the paste used to bind the NP to the textile, the electrical discharge method has a lower impact than the method described by Walser et al. Regardless of this it is important to point out that the environmental impact of Ag NP treated textiles primarily depends on the Ag loading of the textile as shown by Hicks et al. [
31] and Hicks and Theis [
32].


