Article

On the Energy Efficiency of Dual Clutch Transmissions and Automated Manual Transmissions

1
Department of Mechanical Engineering Sciences, University of Surrey, Guildford GU2 7XH, UK
2
McLaren Automotive Ltd, Woking GU21 4YH, UK
3
Oerlikon Graziano S.p.A., 10098 Rivoli, Italy
*
Author to whom correspondence should be addressed.
Energies 2017, 10(10), 1562; https://doi.org/10.3390/en10101562
Submission received: 29 July 2017 / Revised: 4 September 2017 / Accepted: 14 September 2017 / Published: 11 October 2017
(This article belongs to the Section F: Electrical Engineering)

Abstract

:
The main benefits of dual clutch transmissions (DCTs) are: (i) a higher energy efficiency than automatic transmission systems with torque converters; and (ii) the capability to fill the torque gap during gear shifts to allow seamless longitudinal acceleration profiles. Therefore, DCTs are viable alternatives to automated manual transmissions (AMTs). For vehicles equipped with engines that can generate considerable torque, large clutch-slip energy losses occur during power-on gear shifts and, as a result, DCTs need wet clutches for effective heat dissipation. This requirement substantially reduces DCT efficiency because of the churning and ancillary power dissipations associated with the wet clutch pack. To the knowledge of the authors, this study is the first to analyse the detailed power loss contributions of a DCT with wet clutches, and their relative significance along a set of driving cycles. Based on these results, a novel hybridised AMT (HAMT) with a single dry clutch and an electric motor is proposed for the same vehicle. The HAMT architecture combines the high mechanical efficiency typical of AMTs with a single dry clutch, with the torque-fill capability and operational flexibility allowed by the electric motor. The measured efficiency maps of a case study DCT and HAMT are compared. This is then complemented by the analysis of the respective fuel consumption along the driving cycles, which is simulated with an experimentally validated vehicle model. In its internal combustion engine mode, the HAMT reduces fuel consumption by >9% with respect to the DCT.

1. Introduction

Energy consumption reduction is an important target for the automotive industry, given the progressive introduction of stringent CO2 emission regulations [1]. In recent years, significant progress has been made, e.g., through the development of downsized engines [2], engine start-and-stop functions [3] and electrified or fully electric drivetrain layouts [4,5,6,7]. However, important fuel consumption reductions can also be achieved through the implementation of energy-efficient transmission layouts, which are the focus of this study.
Transmission systems with automated gearshifts have become a customer requirement for driving comfort in premium passenger cars. Conventional automatic transmissions (ATs) have lower efficiency than manual transmissions (MTs), mainly because of the viscous shear losses in the torque converter. According to Kulkarni et al. [8], AT efficiency can be up to 86%, while MT efficiency can reach 97%. Automated manual transmissions (AMTs) have comparable efficiencies to MTs, but they are affected by the torque gap during gear shifts when the single clutch is disengaged to allow synchronisation. As the torque gap is no longer acceptable to customers of premium passenger cars, AMTs are progressively disappearing from the market.
Dual clutch transmissions (DCTs) accomplish seamless automated gearshifts, while providing higher efficiency than ATs. Although the original DCT concept dates back to the work of Kegrésse [9], one of the earliest practical designs was presented in Webster [10], detailing the mass reduction benefits with respect to ATs, and the process of clutch-to-clutch gearshifts. However, DCT efficiency deteriorates in high performance vehicles, in which the power-on gear shifts tend to generate significant heat in the dual clutch pack. Effective heat dissipation requires the adoption of wet clutches, rather than the dry clutches typical of more common vehicle applications. Wet clutches are characterised by significant power dissipations caused by clutch churning, cooling and microslip.
In recent years, drivetrain electrification has provided alternative methods for torque gap reduction during automated gearshifts, e.g., by using the electric motor (EM) to fill in the torque gap caused by a disengaged clutch in layshaft transmissions, without the need for a DCT. This solution makes AMT layouts again viable for premium passenger cars.
Several studies have discussed the topic of transmission efficiency. Van Dongen [11] shows that in layshaft transmissions efficiency is an increasing function of input torque. Greenbaum et al. [12] confirm this trend, and point out that the input torque is more influential than the input speed, although churning losses are greater at high speed. Furthermore, transmission efficiency usually increases with oil temperature because of the reduction in oil viscosity [12]. The detailed analysis in Hohn et al. [13] suggests that it would be technically possible to halve the power losses of production transmissions; however, the development work of the automotive industry on the topic has been rather conservative.
The specific design of the transmission layout, components, and auxiliary systems determines the magnitude of the power losses, and their correlation with the operating conditions. Items such as the friction seals, bearings, synchronisers, oil pumps and scavenge area, along with the choice of gear ratios, affect transmission efficiency. Despite the existence of a relatively wide literature discussing the overall efficiency and the individual power loss contributions of automotive transmissions, to the knowledge of the authors there is an important gap with respect to: (i) the analysis of the relative significance of the different sources of power loss for specific transmissions; and (ii) the experimental comparison of the efficiency of different transmission layouts.
The novel objectives of this study are:
  • The discussion of the relative significance of the individual power loss contributions of a specific DCT with wet clutches, through the analysis of simulation-based power loss maps and energy losses along driving cycles.
  • The description of a novel hybridised AMT layout, referred to as HAMT in the remainder, designed with the scope of eliminating the energy efficiency shortcomings of the DCT.
  • The experimental measurement and comparison of the efficiency maps of the case study DCT and HAMT.
  • The analysis of the fuel savings along driving cycles, achievable with the HAMT operating in its internal combustion engine (ICE) mode.
The paper is organised as follows: Section 2 outlines the case study vehicle and transmission layouts. Section 3 describes the transmission power loss model, and the experimentally validated vehicle simulation model. Driving cycle simulation results are analysed for the case study DCT, and used to justify the HAMT design. The experimental test procedures for measuring the efficiency characteristics of the DCT and HAMT are explained in Section 4. Finally, Section 5 compares the two transmissions in terms of: (i) experimental efficiency maps; and (ii) fuel consumption along driving cycles simulated by using the measured efficiency maps.

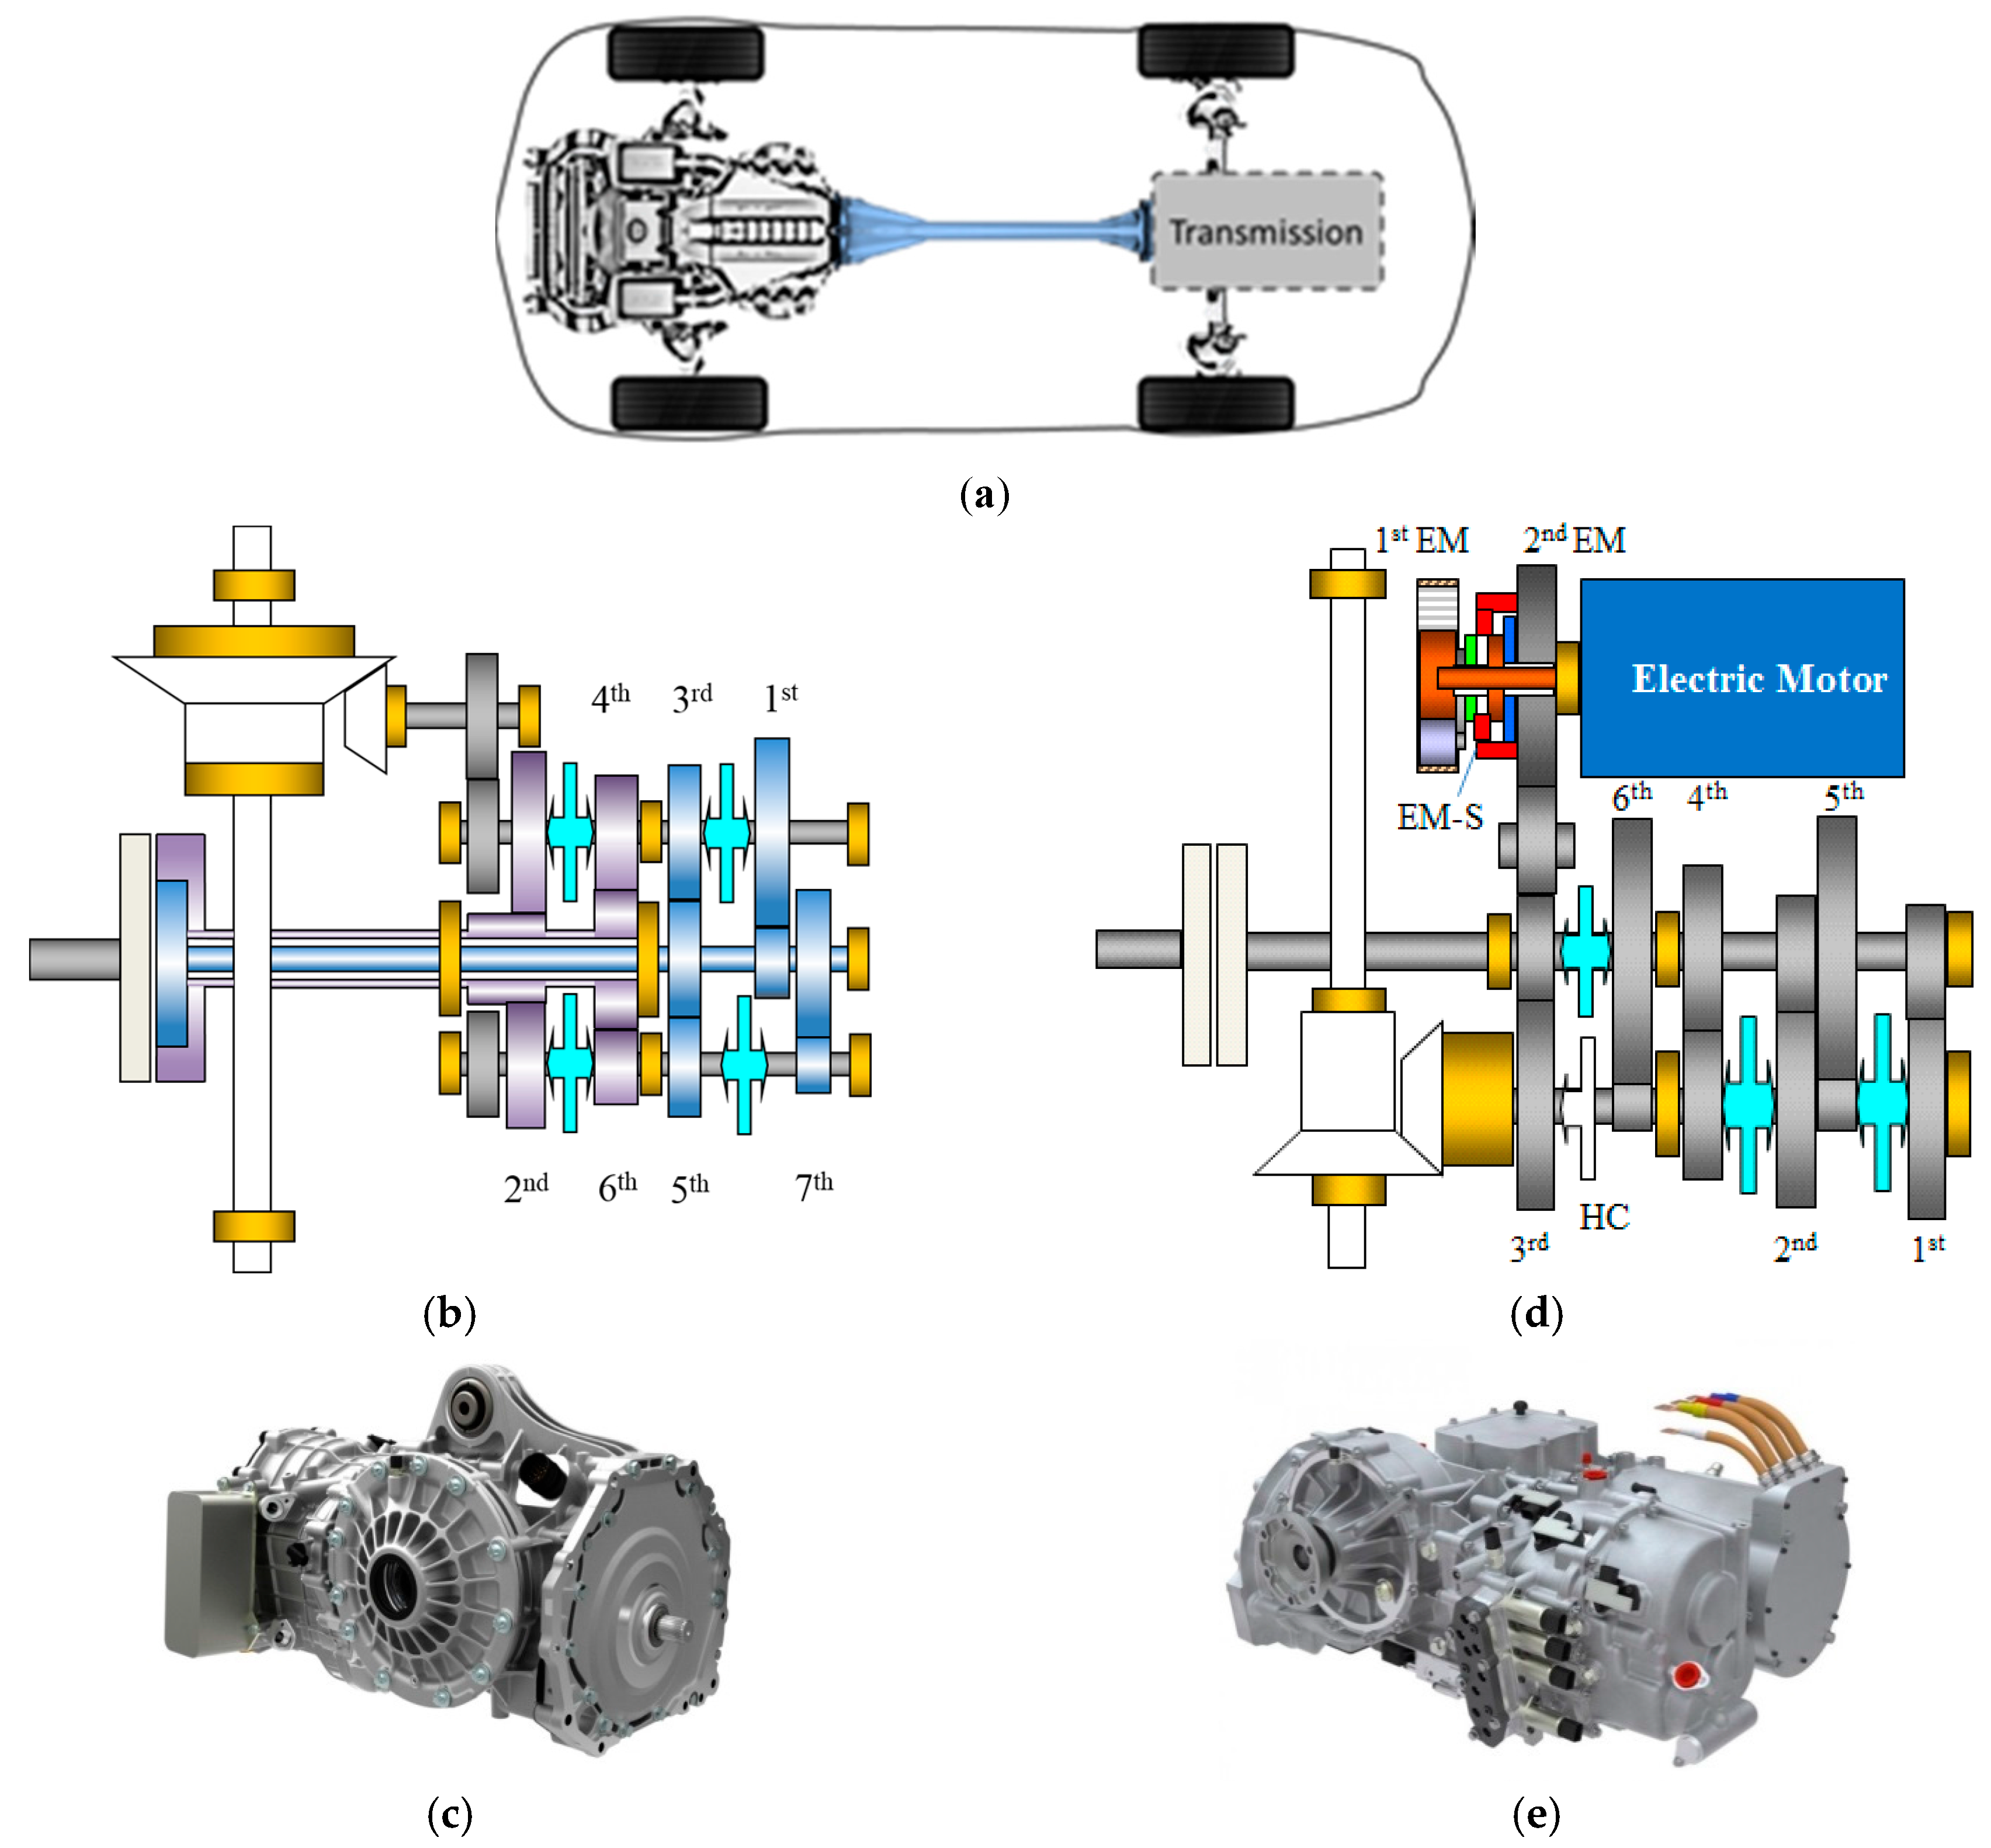
2. Case Study Vehicle and Transmissions

The case study vehicle (Figure 1a) is a high-performance rear-wheel drive passenger car, with a front longitudinal ICE connected by a driveshaft to the clutches, transmission, constant velocity joints, and half-shafts located on the rear axle. The main vehicle parameters are reported in Table 1.
Figure 1b–e show the case study transmission layouts. In particular, Figure 1b describes the seven-speed DCT by Oerlikon Graziano SpA [14] (see also Figure 1c), which includes two co-axial wet clutches. Wet clutches—rather than dry clutches—are adopted on the specific DCT because of the high values of maximum transmissible torque, yielding considerable power dissipation during clutch-to-clutch gear shifts. However, wet clutches introduce additional complexity and power losses, which are mainly associated with the dedicated cooling circuit and clutch pack churning.
The DCT consists of: (i) an inner input shaft, which carries the odd gears (first, third, fifth and seventh); (ii) an outer input shaft, which carries the even gears (second, fourth and sixth) and reverse gear; (iii) two secondary shafts connected to the respective primary shaft through the synchroniser of the engaged gear, and to the gearbox output shaft through a fixed gear ratio; (iv) two wet clutches, connecting the ICE and the driveshaft to a transmission input shaft; and (v) an open differential, connected to the gearbox output shaft and the constant velocity joints.
In terms of ancillaries, the case study DCT includes two gerotor pumps [15]: (i) a pump connected to the input shaft, which serves the actuation circuits of the synchronisers and clutches. This pump is also responsible for cooling the clutch assembly. This is obtained by means of oil flow rate regulation through an external water–oil heat exchanger; and (ii) a significantly smaller pump connected to the secondary shaft, which lubricates and cools the transmission.
The HAMT (Figure 1d,e) has six gears (ICE gears in the remainder) that are associated with the ICE, and two gears (EM gears) that are associated with the EM. The reduction of the number of the ICE gears in comparison with the DCT was assessed through simulations during the design of the HAMT, to decrease its mass and complexity without affecting its functionality along driving schedules and acceleration tests. The ICE gear ratios were selected through a simulation-based optimisation, which will be the object of further publications. The ICE gear actuation system is characterised by the typical set-up of conventional AMTs, with electro-hydraulically controlled synchronisers and a dry clutch. In fact, the absence of clutch-to-clutch gear shifts in the HAMT allows for a reduction of the clutch slip power losses, and thus the installation of a dry clutch, rather than the wet clutches of the DCT. In the HAMT, the lubrication pump is connected to the input shaft, while the actuation pump is driven by an EM that is powered by the 12V vehicle battery only when needed, in order to reduce fuel consumption.
On the EM side of the HAMT, the first EM gear is obtained with a planetary gear set, a sequence of two gear drops, and a hybrid coupling (HC) implemented through a dog clutch, which connects the transmission output shaft with the third ICE gear. The second EM gear is achieved with a dog clutch that connects the EM to the sequence of two gear drops and the HC. An electro-mechanical EM gear selector (EM-S in Figure 1d), based on a dog-clutch coupling, is used for the selection of the first EM gear, second EM gear and EM neutral gear (N). Since the synchronisation process for the EM gear shifts can be implemented through the EM torque to control the EM speed in closed-loop during the inertia phase (see a similar controller in De Pinto et al. [16]), a mechanical synchroniser is not needed.
The HAMT can operate in six modes:
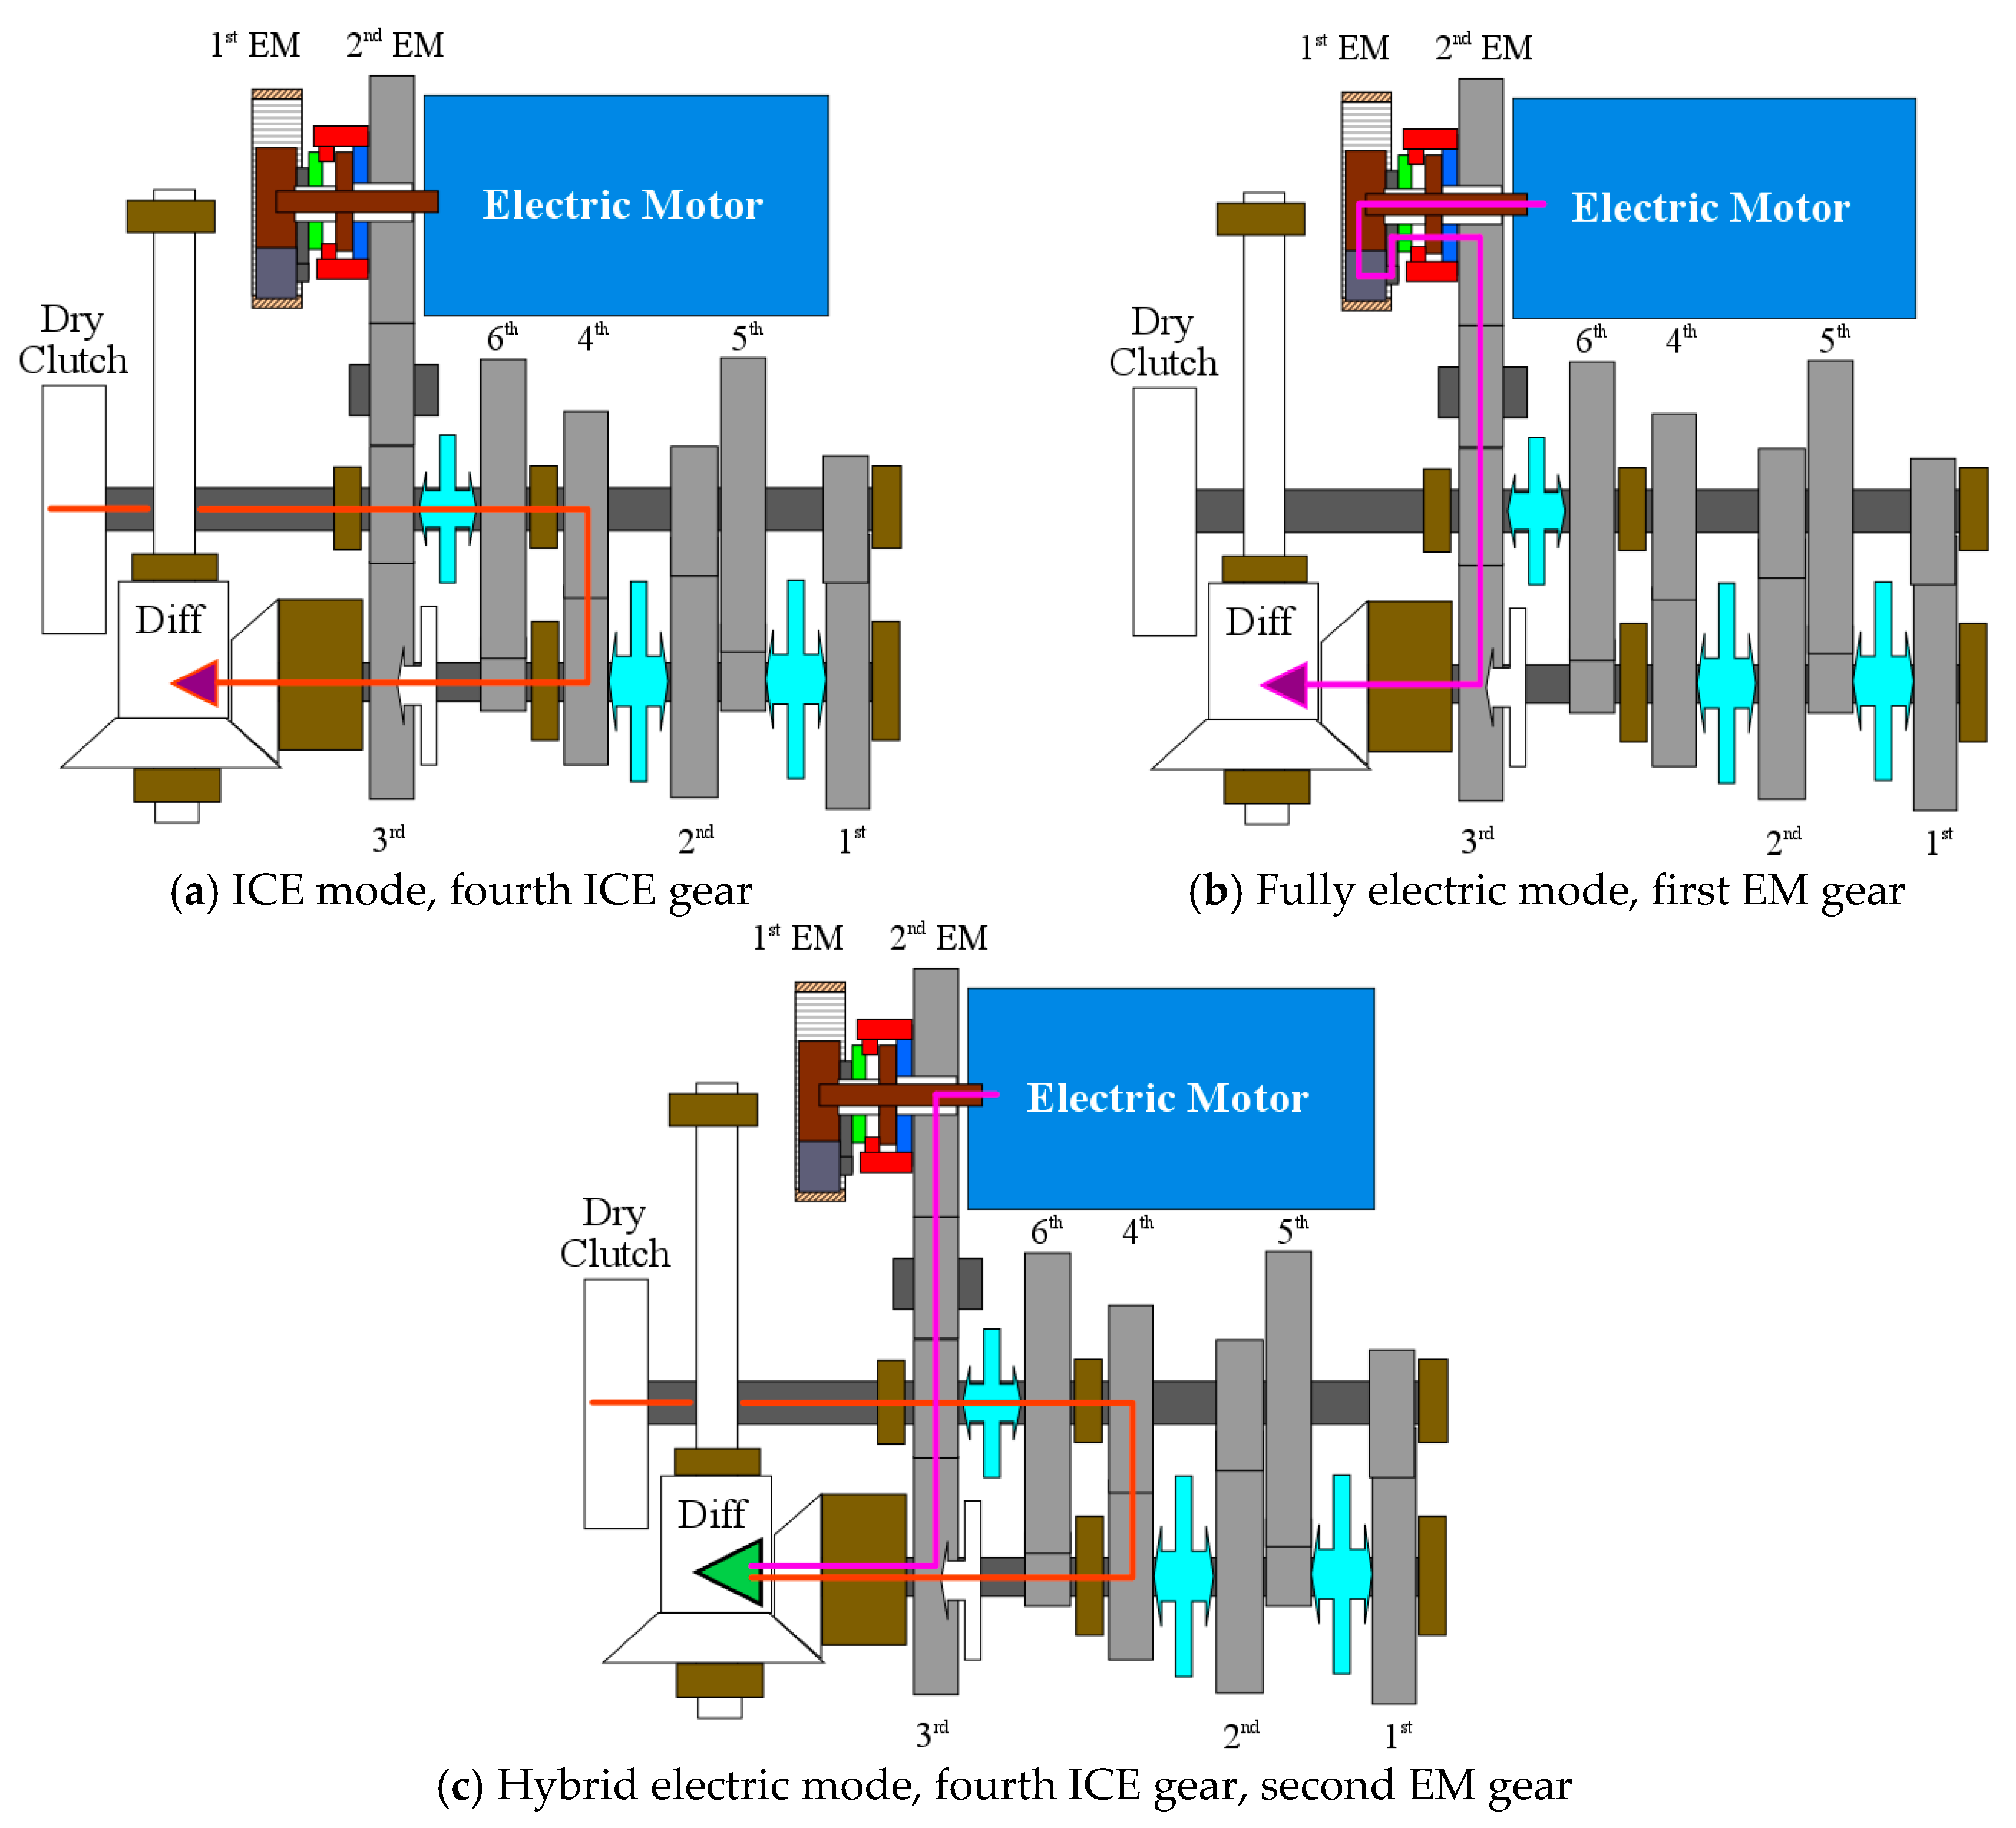
  • ICE mode: the ICE provides the traction torque, and the EM is optionally used only for torque-fill during gear shifts. If the electric motor drive has a failure, the HAMT operates like a common AMT.
  • Fully electric mode: the EM provides the entire wheel torque, with the exclusion of the friction brake contribution. This mode is suitable for urban driving and low-speed vehicle operation, e.g., initial launch at low torque demands in the first EM gear.
  • Hybrid electric mode: the wheel torque is provided by the ICE and EM working in parallel (parallel hybrid electric layout). Reduced fuel consumption and emissions are achieved with an appropriate power split strategy (not covered by this study) aimed at minimising the average ICE brake specific fuel consumption in traction. At the moment, the EM gear shifts are limited to this mode, with the upshifts being actuated at a vehicle speed of ~100 km/h. Future developments will include the implementation of EM gearshift maps, e.g., based on energy efficiency considerations, such as those proposed by the same authors elsewhere [17].
  • Reverse gear mode: the EM applies a negative torque through the first EM gear ratio, for the reverse gear operation of the vehicle.
  • Cranking from stop and recharge mode: the HC is disengaged and the EM is used either to crank the engine or as an ICE-driven generator to recharge the battery.
  • Cranking from EM mode: the clutch is used to crank the engine from an initial condition in which the vehicle is in fully electric mode.
The status of each HAMT actuator for the six HAMT modes is reported in Table 2. Figure 2 includes the HAMT diagrams in ICE mode, fully electric mode, and hybrid electric mode, with the corresponding representations of the power flow in traction conditions.
During the gear shifts on the ICE side of the drivetrain, the EM is used to compensate for the reduction of the torque transmitted by the HAMT clutch. The reduction would normally provoke a wheel torque fluctuation, i.e., a torque gap, during the gear shift, and be perceived by the vehicle occupants as a swift oscillation of the longitudinal vehicle acceleration. The appropriate control of the EM torque can ‘fill in’ the wheel torque gap. The mathematical description of the HAMT torque-fill function is provided by Gavgani et al. [18,19], including gearshift simulations and experiments. De Pinto et al. [16] present torque-fill controllers in electrified drivetrains, including gearshift performance indicators calculated during experimental gearshifts without and with EM torque-fill.

3. DCT Power Loss Analysis

Section 3.1 presents the steady-state transmission power loss model of this study. An extract of the resulting DCT power loss maps is analysed in Section 3.2. In Section 3.3, an experimentally validated vehicle model, including the DCT power loss maps of Section 3.2, is employed to simulate driving cycles and deduce the relative significance of the different DCT power loss contributions. This detailed transmission energy loss analysis is used to justify the HAMT design.

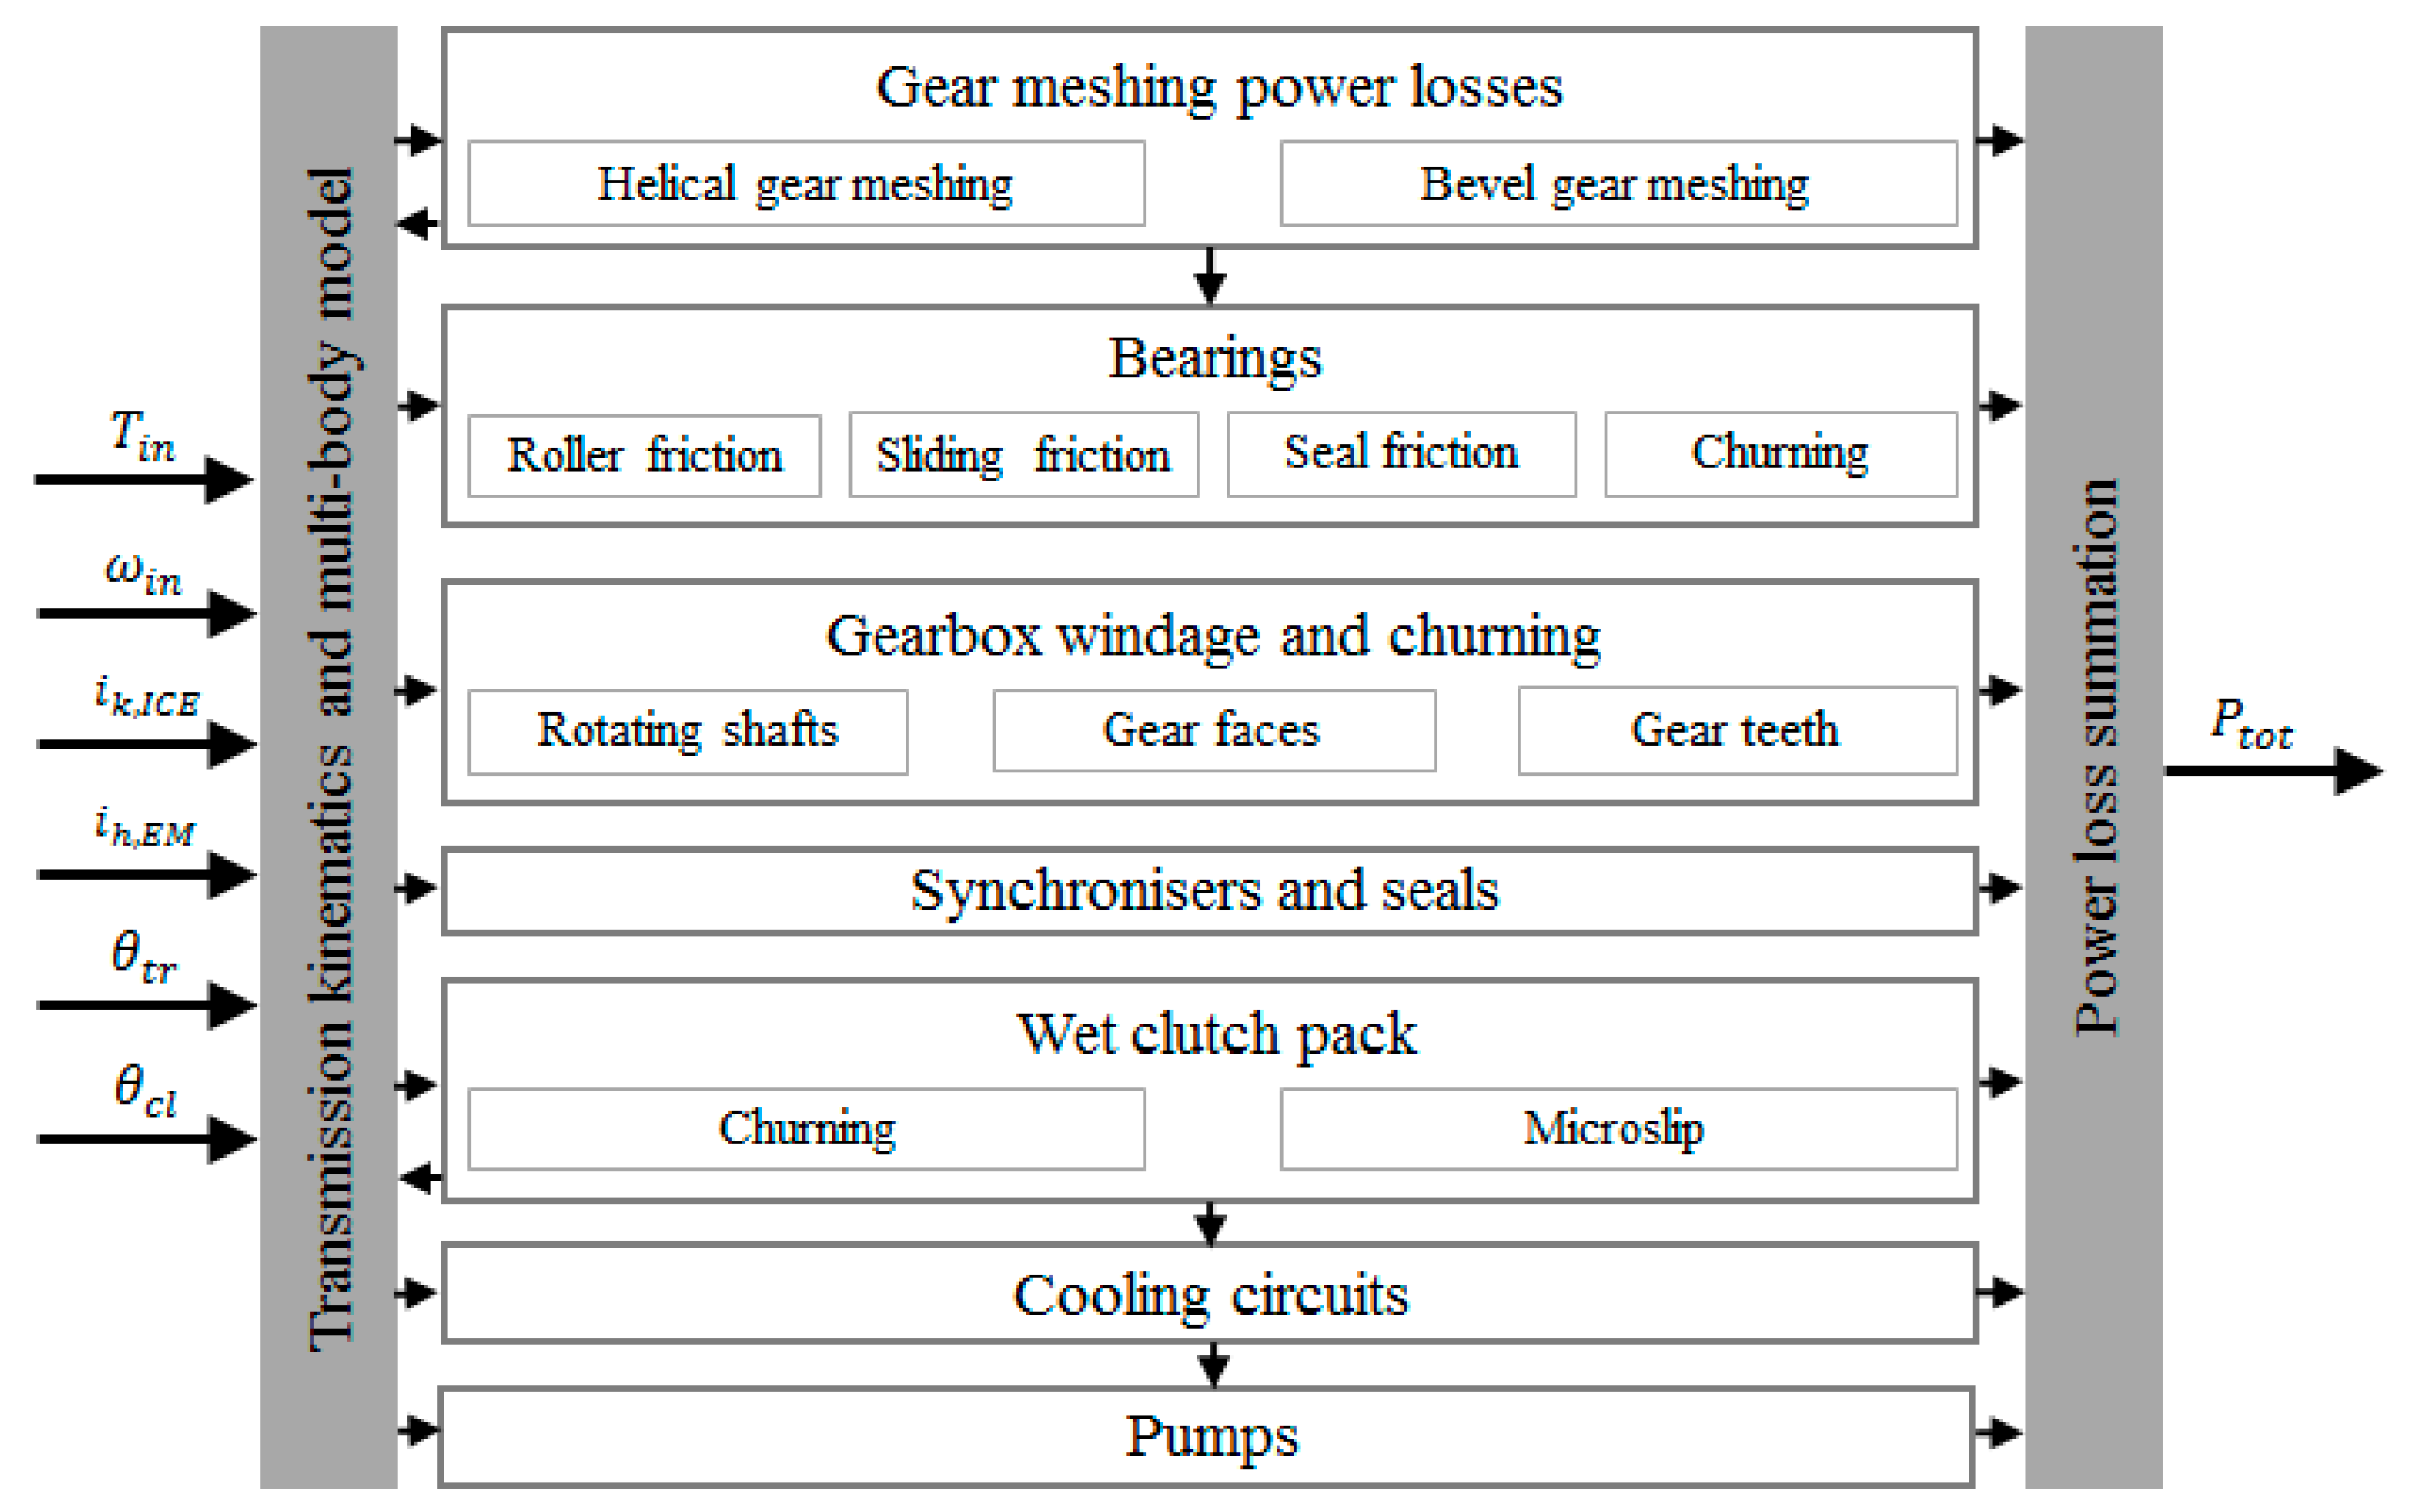
3.1. Transmission Power Loss Model

Oerlikon Graziano SpA has developed an in-house mathematical model that estimates the transmission power loss contributions in steady-state conditions (see references [20,21,22,23,24,25,26,27,28,29,30,31,32,33,34,35] for the relevant literature on the topic). Based on the transmission design parameters, the model generates the transmission power loss maps as functions of the input torque, input speed, and operating temperatures of the transmission and clutch lubricant. The maps can be adopted for transmission design optimisation and driving cycle simulation. The model is based on: (i) a set of theoretical and empirical formulas, derived from the historical data base of the company, which is essential for a good fit between simulations and experiments; (ii) data from experimental tests internally carried out on transmission components; and (iii) maps provided by the component suppliers.
The model structure reported in Figure 3 can account for the following power loss contributions, depending on the specific transmission configuration:
  • Gear meshing power losses, P g = P g , h + P g , b . The power losses caused by the helical gear meshing, P g , h , and bevel gear meshing, P g , b , are expressed in accordance with the British Standard [20] (for alternative equivalent formulations, see also Hohn et al. [13] and Fernandes et al. [21]).
  • Bearing power losses, P b . These losses are caused by load-independent and load-dependent friction torque contributions. This study uses the model of SKF [22] to calculate the friction torque, M b , i , of the i -th bearing (in the remainder the subscript i indicates a generic transmission component):
    M b , i =   M r r , i + M s l , i + M s e a l , i + M c h , i
    where M r r , i is the roller friction torque, M s l , i is the sliding friction torque, M s e a l , i is the bearing seal friction torque, and M c h , i is the churning friction torque. Since the transmission shafts are often statically indeterminate, and the stiffness of the bearings is rarely provided by the manufacturers, a specific multibody software tool was developed by Oerlikon Graziano SpA to estimate the axial bearing load and stiffness, depending on the installation set-up on the transmission shafts (see also Sorniotti et al. [23]). The tool outputs are used for the calculation of the load-dependent bearing friction losses. Similar tools are available from bearing manufacturers [24].
  • Synchroniser and seal power losses, P s & s = P s y n c h r o + P s e a l . The synchroniser power loss values, P s y n c h r o , i , are based on the experimentally measured drag torque characteristics of the specific synchronisers. The power loss of the i –th oil seal, P s e a l , i , facing the respective rotating part of the transmission [25], is modelled as:
    P s e a l , i = T s , i ω s , i = s i D s , i ω s , i
    where T s , i is the seal drag torque, linearly proportional to the corresponding shaft diameter, D s , i . The coefficient s i depends on the seal material [26].
  • Gearbox windage and churning losses, P w & c , g . In accordance with the British Standard [20], these are modelled as the sum of: (i) the power losses associated with the rotating shafts, P w & c , s ; (ii) the power losses associated with the faces of the gears, P w & c , g f , which are assumed to behave like discs; and (iii) the power losses associated with the teeth of the gears, P w & c , g t . In practice, only the availability of previous experimental results, as is the case in this study, allows for accurate model parameterisation.
  • Wet clutch churning power losses, P c , w c [27,28]. During the engaged gear operation of the DCT, either clutch (i.e., the disengaged one) is characterised by a slip condition. This generates a drag torque, which is caused by the shear associated with the oil between the plates. The drag torque increases with the number, radius, lubrication flow rate of the clutch discs, and decreases with disc clearance and lubricant viscosity. Kitabayashi et al. [27] provide a surface tension model that matches well with the experimentally measured drag torque at low slip speeds. In these conditions, the centrifugal force is negligible with respect to the viscous effects, and the drag torque linearly increases with slip speed. For high speeds, the thickness of the oil film is reduced by the centrifugal effect, which decreases the drag torque [29], thus making it a non-linear function of slip speed. A model formulation for high-speed operation is presented Yuan et al. [30]. In this study, the churning power loss map of the wet clutch assembly is based on the experimental data from the component supplier.
  • Microslip power losses of the engaged wet clutch, P m s , e w c . Microslip is the angular speed difference, ω e w c , between the plates of the wet clutch of the engaged gear. In a wet clutch system, the engaged clutch microslip is often continuously regulated by the transmission control unit, which dampens the torsional dynamics of the drivetrain, and thus improves vehicle drivability. In the usual operating conditions of the specific DCT, ω e w c is of 5–20 rpm, and the associated power loss is:
    P m s , e w c = T e w c ω e w c
    where T e w c is the engaged clutch torque.
  • Cooling circuit power losses, P c c . These are calculated as the product of the oil flow rate and the respective pressure drop through the cooling circuit, where the latter is experimentally measured.
  • Pump power losses, P p . In general, the efficiency of a pump can be expressed as the product of its volumetric and mechanical efficiencies [31]. However, in practice, transmission pumps are often continuously mechanically driven. They produce a significant power loss even when they generate low or even zero hydraulic power. For this reason, rather than using efficiencies, the model directly calculates the pump power losses from experimental maps provided by the respective suppliers.
The previous contributions are summed together to provide the total transmission power loss (Figure 3). For example, for the case study DCT, the total power loss, P t o t , D C T , is:
P t o t , D C T = P g + P b +   P s & s + P w & c , g + P c , w c + P m s , e w c + P c c , w c + P p , w c & a c t + P p , t c
where P c c , w c , P p , w c & a c t , and P p , t c are respectively the power losses of: (i) the cooling circuit of the wet clutches, which are reported separately given the focus on the wet clutch contributions; (ii) the pump for the cooling circuit of the wet clutches and for the electro-hydraulic actuation system of clutches and synchronisers; and (iii) the transmission cooling circuit (which is independent from the cooling circuit of the wet clutches) with the respective pump.

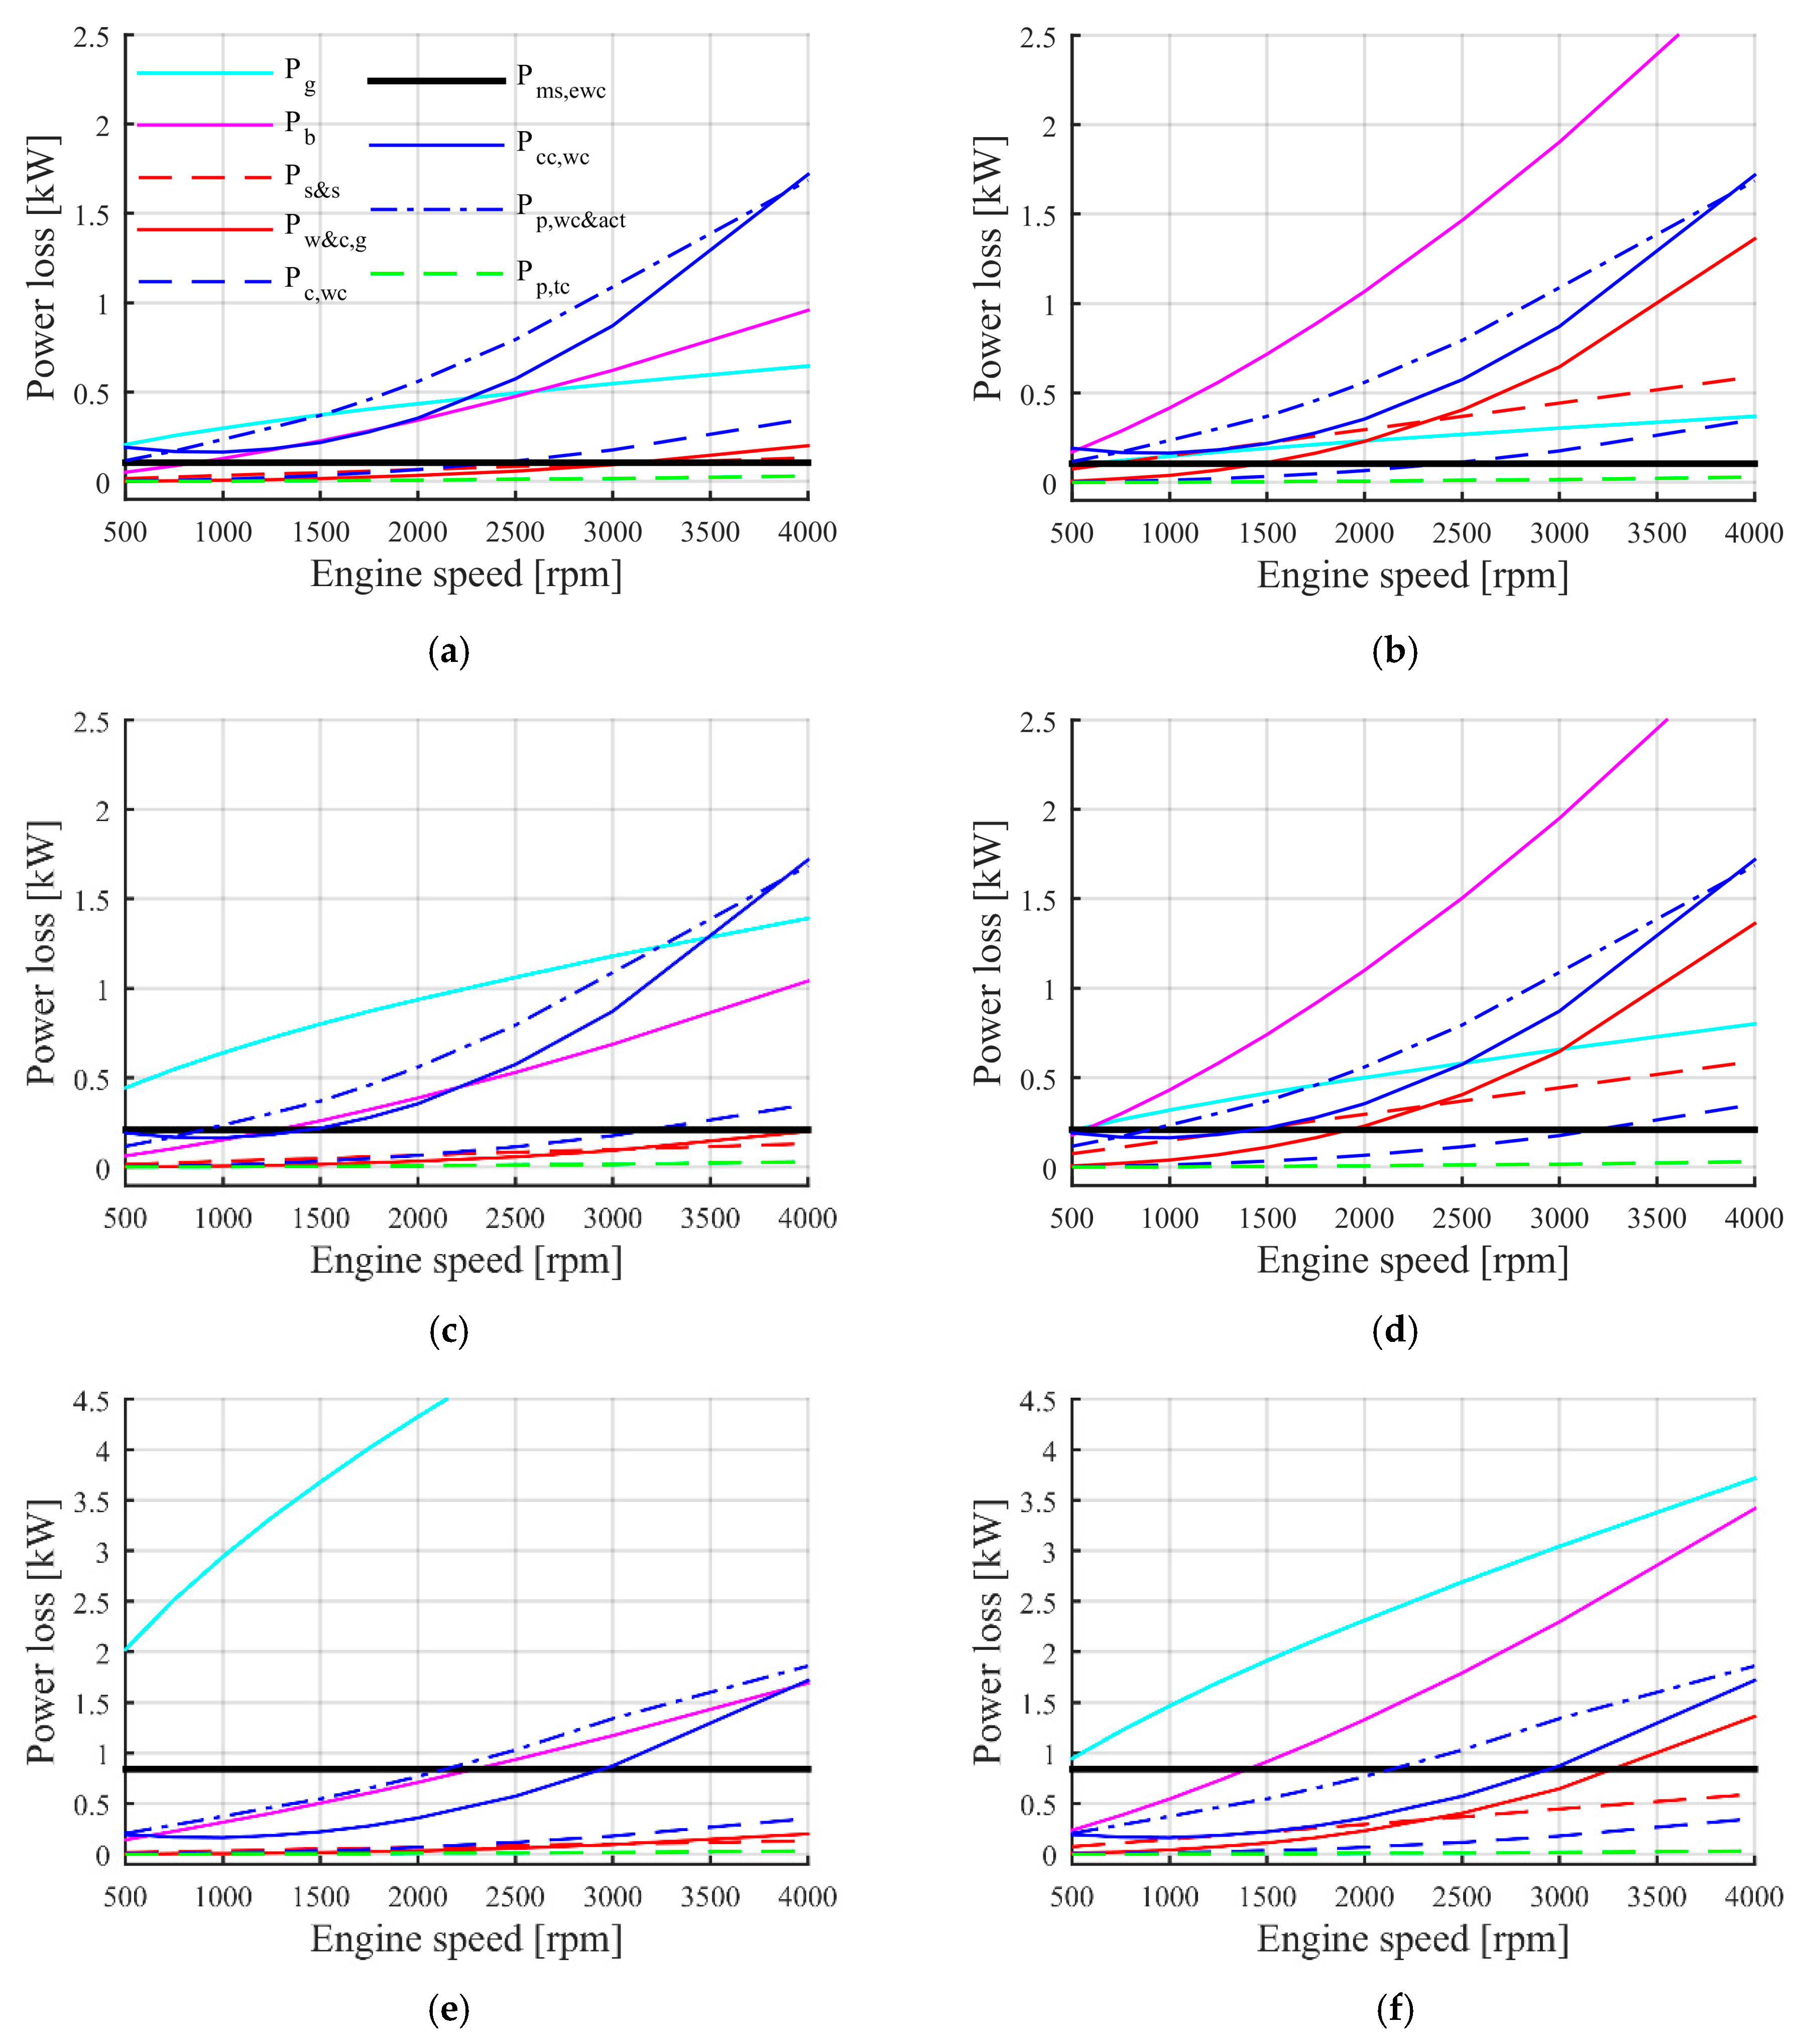
3.2. DCT Power Loss Maps

Based on the model of Section 3.1, Figure 4 shows the DCT power losses as functions of engine speed for the first gear (Figure 4a,c,e) and the seventh gear (Figure 4b,d,f), under the assumption of a 20 rpm constant microslip value of the engaged clutch. For the same engine torque and speed, the bearing, churning and windage, synchroniser and seal power loss contributions are larger in the seventh gear, because of the higher angular speed of the transmission output. For a given engaged gear, the gear meshing and microslip power losses significantly increase with the transmitted torque (compare Figure 4a with Figure 4c,e, and Figure 4b with Figure 4d,f). The results show the importance of the power loss contributions purely related to the wet clutches, namely P c , w c + P m s , e w c + P c c , w c . For example, at T i n = 100 Nm and ω i n = 1500 rpm, they amount to 23.6% and 19.9% of the total transmission power loss in the first and seventh gear, respectively, while at 3000 rpm they correspond to 28.5% and 20.8% of the total transmission power loss. On top of this, the wet clutches are responsible for the majority of the P p , w c & a c t contribution, which corresponds to 18.8% (first gear) and 15.9% (seventh gear) of the total transmission power loss at 100 Nm and 1500 rpm, and 24.6% and 18.0% at 100 Nm and 3000 rpm.
The important conclusion is that the elimination of the wet clutch alone could bring a power loss decrease between 30% and 40% in the specific operating points. Nevertheless, as the relative significance of the different sources of transmission power loss is a function of the operating conditions, the actual impact of the wet clutches on the vehicle fuel consumption in typical driving schedules is assessed by including the detailed transmission power loss maps in a vehicle simulation model, which is the topic of Section 3.3.

3.3. DCT Power Loss Contributions during Driving Cycles

A Matlab–Simulink backward-facing simulation model [36,37] was implemented to estimate the vehicle fuel consumption and the DCT power loss contributions along a selection of driving cycles, namely: (i) the New European Driving Cycle (NEDC); (ii) the Federal Test Procedure 75 (FTP-75); (iii) the Supplemental Federal Test Procedure (US06); and (iv) the Worldwide harmonised Light vehicles Test Procedures for high power vehicles (WLTP cl3).
The model relies on two main assumptions: (i) the reference vehicle speed, V v e h , can be continuously achieved; and (ii) the gear shifts occur instantaneously without energy dissipations. Gavgani et al. [18,19] describe the details of the actual gear shift process for the DCT and HAMT. Assumptions (i) and (ii) do not imply significant errors in the fuel consumption results for the specific high-performance vehicle application. The detailed analysis of the level of approximation of assumption (ii) will be reported in future papers.
V v e h , defined in accordance with the selected driving cycle, is used to calculate the required drivetrain torque at the wheel, T d :
T d = R w ( 1 2 ρ   C d r a g S   V v e h 2 + tan h ( k h y p e r V v e h ) ( f 0 + f 2   V v e h 2 ) m g + m a p p d V v e h d t )
The hyperbolic tangent function allows for the simulation of the zero-speed phases of the driving cycle, i.e., no traction torque is needed to keep the vehicle at standstill on a road with zero longitudinal grade. The apparent vehicle mass, m a p p , takes into account the mass moment of inertia of the main rotating parts of the drivetrain in the selected gear:
m a p p = m + 4 J w R w 2 + J I C E + J c l u t c h R w 2   i k , I C E 2
By neglecting tyre slip (which is a reasonable approximation in driving cycles, see also the specific power loss studies in Pennycott et al. [38] and De Novellis et al. [39]) and considering the engaged wet clutch microslip, the angular speed of the ICE is:
ω I C E = ω w i k , I C E + ω e w c
The ICE torque, T I C E , is estimated by equating the power at the DCT primary shaft, T I C E ( ω I C E ω e w c ) = T I C E ω w i k , I C E , to the sum of the required drivetrain power, P d   = T d   ω w = T d   V v e h / R w (assumption of negligible longitudinal tyre slip), and the relevant DCT power loss, P t o t , D C T , w / o m s :
T I C E = P d   + P t o t , D C T , w / o m s V v e h R w i k , I C E
P t o t , D C T , w / o m s = P t o t , D C T P m s , e w c excludes the microslip power losses, since these occur between the ICE and the DCT primary shaft. P t o t , D C T , w / o m s is stored in a look-up table, and is a function of input torque, speed, and DCT lubricant temperature ( θ t r ), which is generated by the model of Section 3.1.
The brake specific fuel consumption of the ICE, b I C E , was experimentally measured during ICE tests carried out by the industrial partners of the project, thus obtaining a map, b I C E ( ω I C E , T I C E , θ I C E ) , which is a function of engine speed, torque, and temperature, and is partially reported in Figure 5. The fuel mass flow rate, m ˙ I C E , and volume consumption per unit distance, V I C E , d ( t ) , are computed from b I C E and the engine power demand, P I C E = T I C E ω I C E :
{ m ˙ I C E = b I C E ( ω I C E , T I C E , θ I C E ) P I C E V I C E , d = m ˙ I C E ρ f u e l   V v e h
From V I C E , d , the CO2 emissions can be estimated with the appropriate conversion factor (~2.35 kg of CO2 per litre of consumed petrol, according to the analysis and recommendations of the National Highway Traffic Safety Administration [40] and the Environmental Protection Agency [41]).
The model also includes the look-up tables with the individual DCT power loss contributions of Equation (4), which make it a novel and important design tool to predict the sensitivity of the fuel consumption along driving cycles with respect to individual transmission design modifications. The temperature profiles of the ICE coolant, transmission lubricant, and clutch lubricant are either directly imposed, e.g., from experimentally measured time histories, or are calculated by the internal thermal model included in the vehicle simulator.
The simulator was experimentally validated through driving cycle tests, which were executed on the rolling road facility located at the MIRA proving ground (UK). For example, Figure 6 reports the simulation and experimental data for the instantaneous and cumulated fuel consumption of the case study vehicle with the DCT along the NEDC. The results show a 0.5% difference between the final cumulative fuel consumption values, i.e., 1145 g for the model compared to the 1151 g for the real vehicle, which makes the simulation model suitable for the scope of this study. The operating points of the ICE during the NEDC are reported in Figure 5. The consideration of the actual transmission performance during the driving schedules, rather than the more conventional analysis based on the efficiency maps, is particularly relevant for the specific high-performance vehicle. In fact, its ICE and transmission tend to work within a very limited torque and speed range, with a distribution of the DCT power loss contributions that can differ quite significantly from its average value for the whole range of possible operation. Despite the NEDC being characterised by an unrealistic speed profile, it was verified that similarly limited ranges of engine speed and torque are achieved for the whole selection of driving schedules of this study. This behaviour does not represent a limitation of the analysis, since the vehicle will be actually driven in such conditions for most of its operation in real traffic. At this level of vehicle performance, the full engine capability tends to be used only when the vehicle is driven on a test track. The underutilisation of the transmission is typical of this vehicle category, and poses a specific challenge in sizing the components and ancillary systems without compromising energy efficiency.
Figure 7 reports the DCT energy loss distribution among the transmission components for the four considered driving cycles. The results are expressed as a percentage of the total DCT energy loss:
E l o s s , j = 100 t i n i t i a l t f i n a l P j ( t ) d t t i n i t i a l t f i n a l P t o t , D C T ( t ) d t
where P j indicates a generic DCT power loss contribution among those in Equation (4). Despite the different speed and acceleration profiles of the simulated driving cycles, the DCT energy loss distribution remains nearly similar. The bearing losses represent the most significant contribution, followed by the pump for wet clutch cooling and actuation circuit supply. Major power losses are associated with the wet clutches and their ancillaries, i.e., clutch churning, clutch microslip, clutch cooling, and the clutch pump. The wet clutches alone ( P c , w c + P m s , e w c + P c c , w c contribution) are responsible for 20% (for the WLTP and US06 driving cycles) to 25% (for the FTP-75) of the total DCT energy loss, while the energy losses caused by P p , w c & a c t range from 16% (for the US06) to 23% (for the FTP-75) of the total. For example, in the FTP-75, the sum of all of the clutch-related contributions, including the cooling pump of the clutch, amounts to nearly 48% of the total DCT energy loss. The conclusion of this analysis is that the elimination of the wet clutch-related losses would substantially reduce the overall transmission power loss, even more significantly than according to the discussion in Section 3.2.
This justifies the HAMT design, with: (i) the presence of a single dry clutch not requiring any cooling circuit, therefore eliminating the P c , w c + P m s , e w c + P c c , w c contribution; and (ii) the adoption of an electrically-driven pump for the actuation circuit of clutch and synchronisers. The pump is active only when needed to charge the high-pressure accumulator, with a negligible energy loss with respect to the continuously running DCT pump, which has to provide a permanent oil flow rate to cool the wet clutch pack.

4. Experimental Transmission Tests

4.1. Experimental Set-up

The transmission test rig of the Centre for Automotive Engineering of the University of Surrey was used to measure the DCT and HAMT efficiency maps in steady-state conditions. The experimental set-up (Figure 8) consists of:
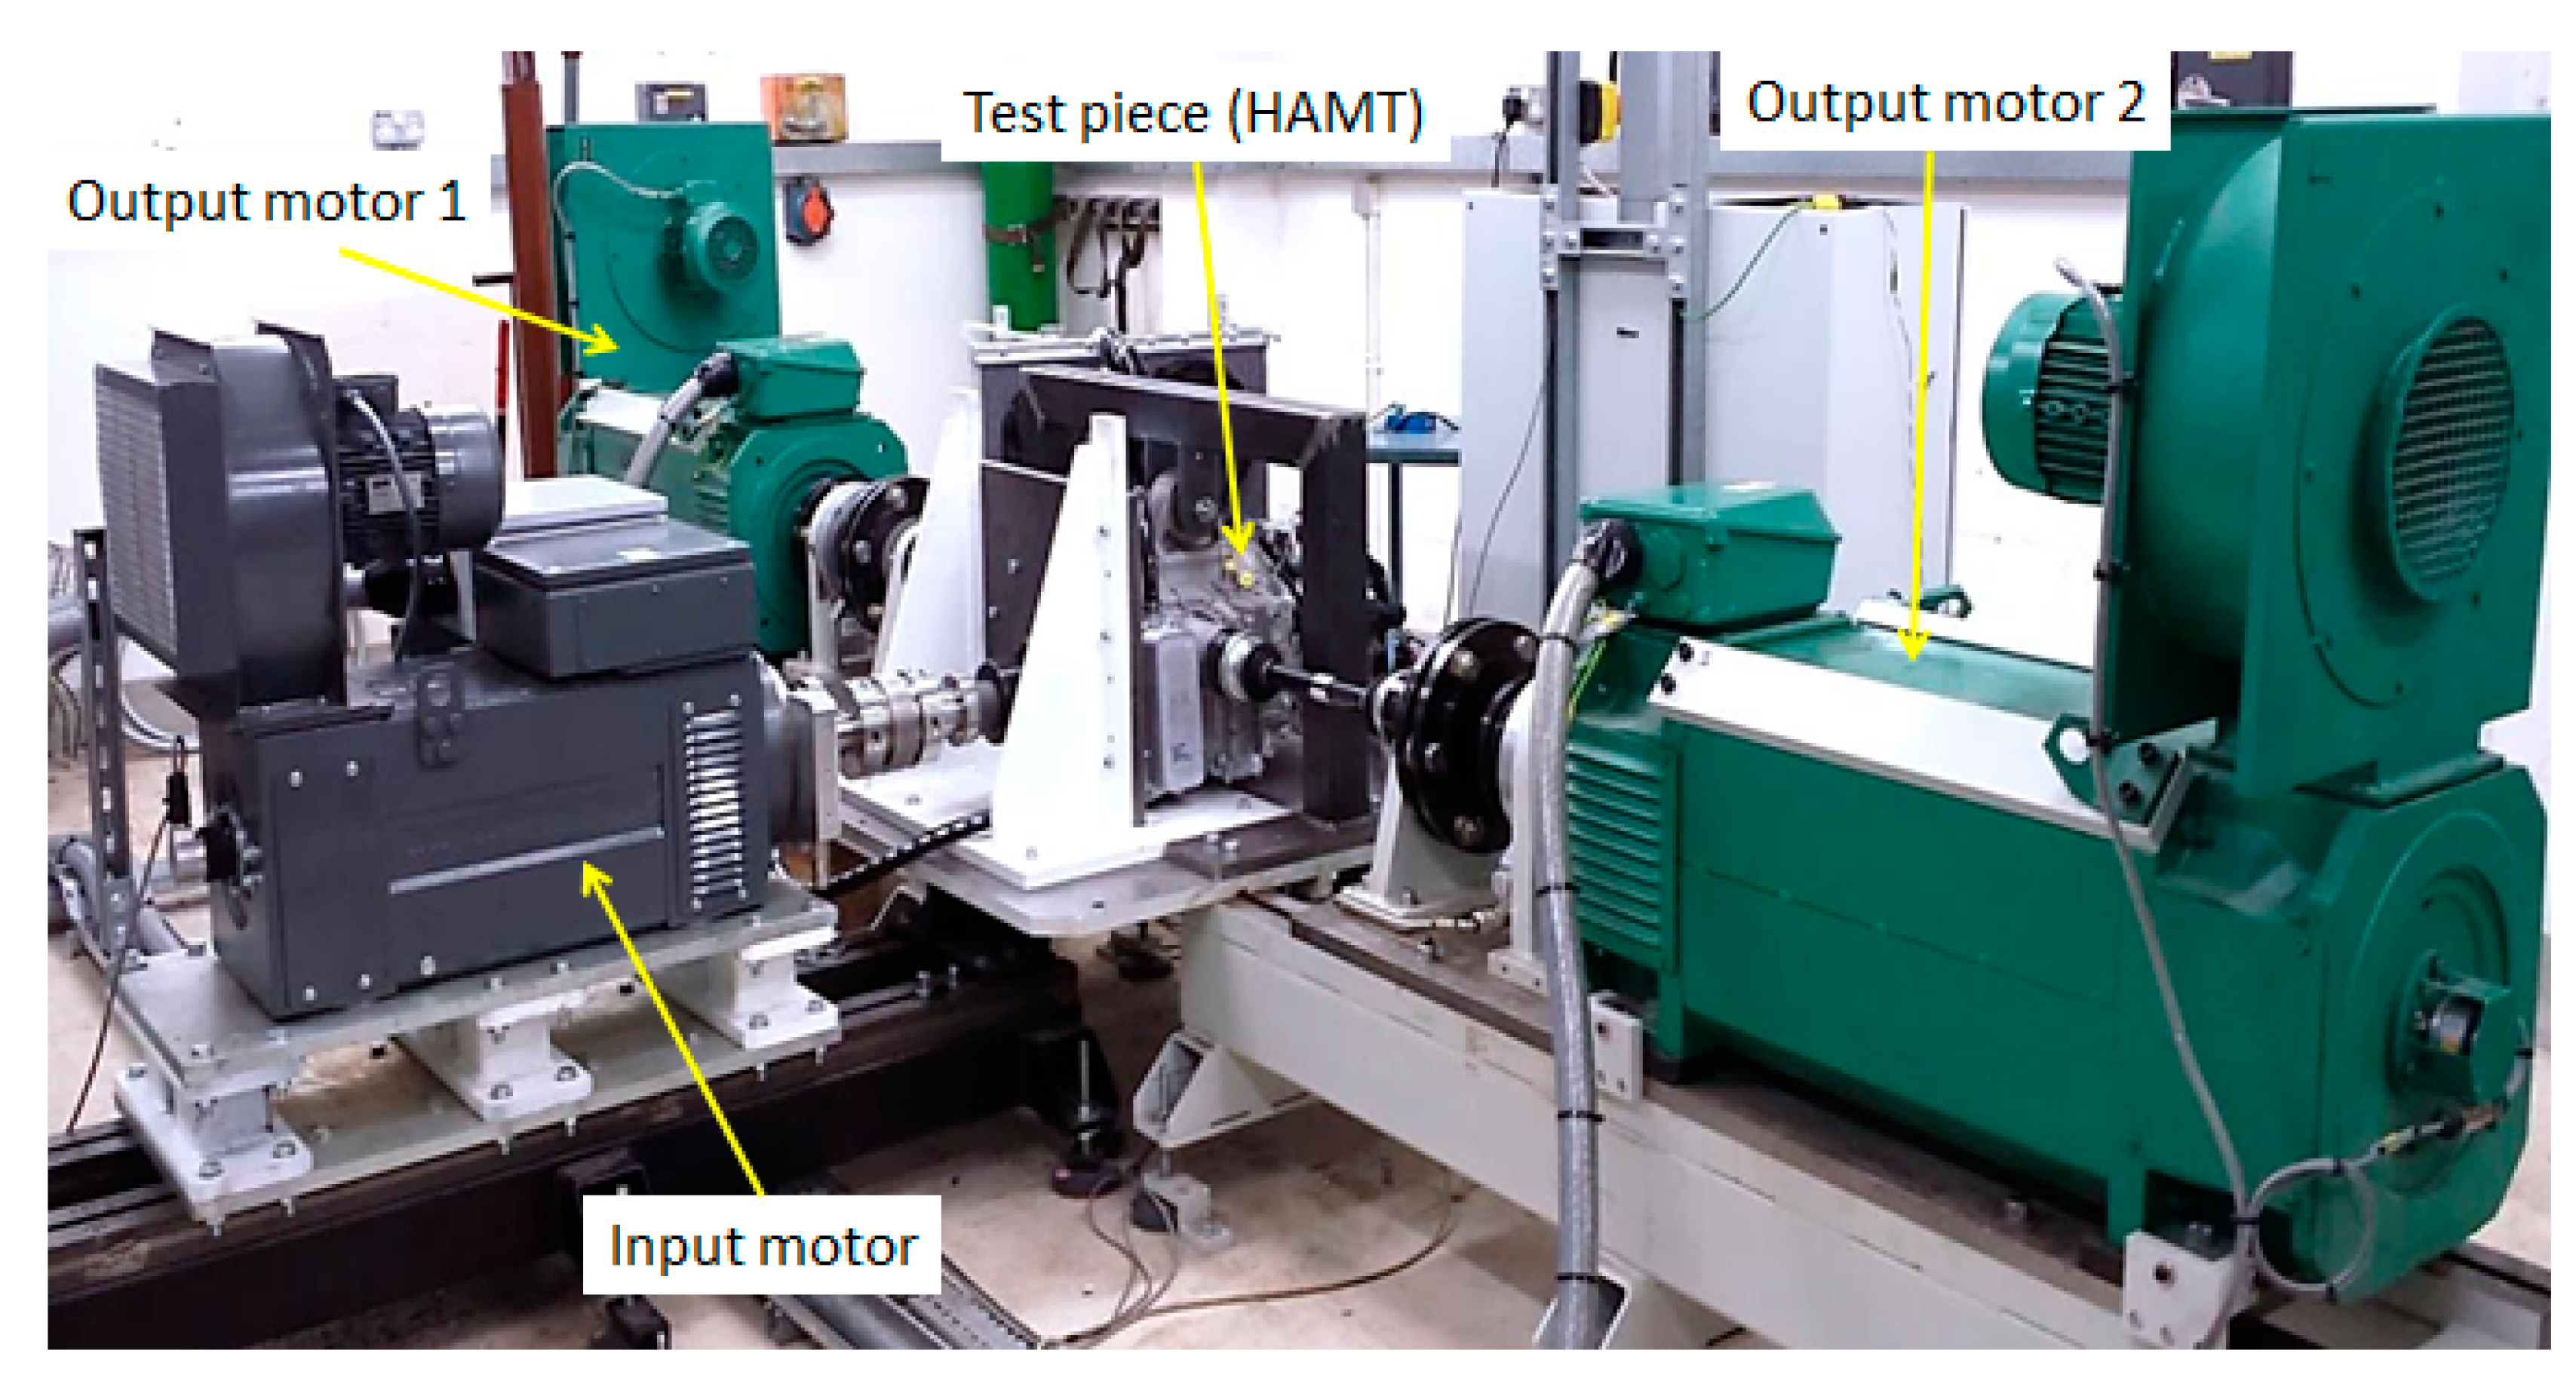
  • The test piece, i.e., the DCT or the HAMT, including constant velocity joints, half-shafts, and the Transmission Control Unit (TCU).
  • The electric motor drives of the rig. The test rig includes a 160 kW/550 Nm electric motor and two 90 kW/1925 Nm electric motors, which are mechanically connected to the transmission input and outputs, respectively, to emulate the ICE and the road load. The input and output torques and speeds are measured by torque sensors and encoders located at each motor interface.
  • The cooling and heating system for the thermal control of the test piece. The system includes a pump, two resistive water heaters with a total power of 9 kW, a low-power radiator with two fans, a larger deionised water-to-water heat exchanger connected to a 45 kW water chiller, and two on/off valves, one of which controls the water flow rate to the heating devices, and the other one controls the flow rate to the cooling devices. The water chiller and the heat exchanger are used to cool down the water during the tests at particularly low temperature (down to 20 °C). The cooling system pumps deionised water directly into the transmission heat exchanger. The transmission lubricant temperature is controlled through the pump flow rate, while the heaters are regulated by an on/off control strategy.
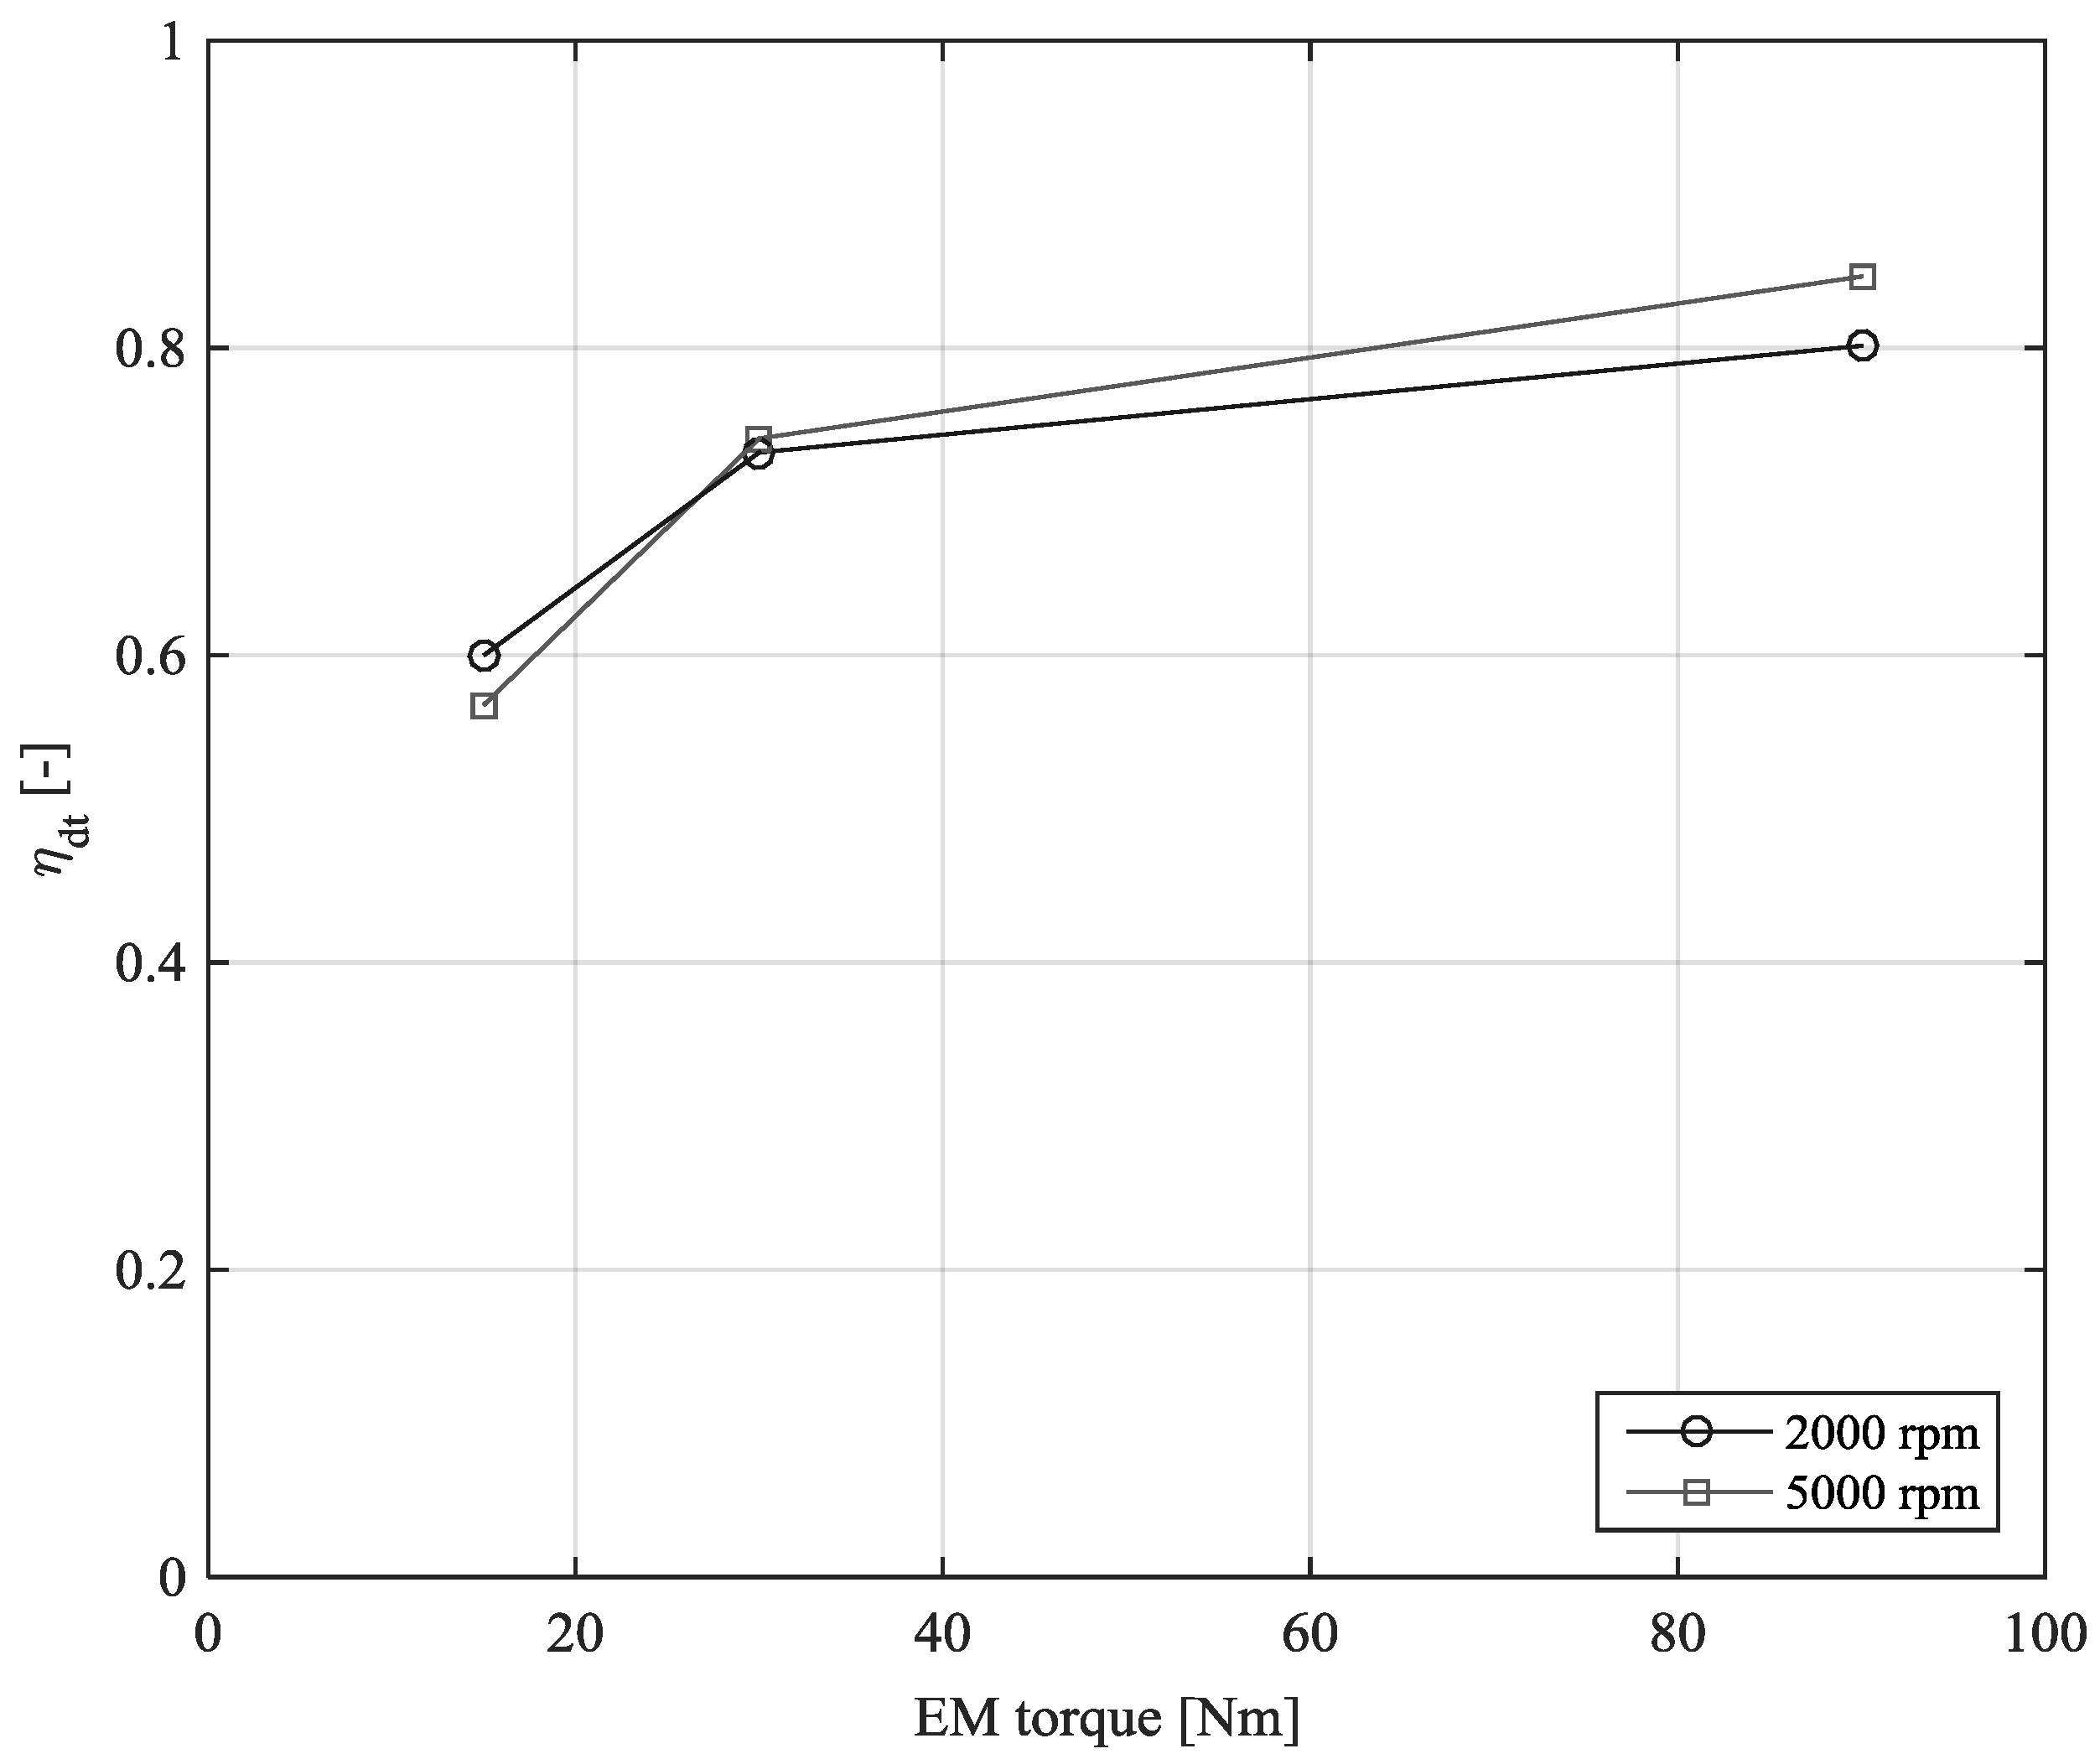
  • A DC power supply for the inverter of the HAMT EM, used during the efficiency tests of the electric part of the HAMT.
  • A real-time control system, including a dSPACE MicroAutoBox DS1401 (dSPACE GmbH, Paderborn, Germany) board and a STARS/SPARC system by Horiba (Horiba, Kyoto, Japan). In the specific tests of this study, the input motor, i.e., either the electric motor of the rig or the HAMT EM, was controlled in torque, and the output motors were controlled in speed.
The experimental equipment does not include any extra coupling or joint that could cause additional power losses between the torque sensor and the transmission input shaft. Moreover, the output torque values are measured directly at the wheel hubs. As a consequence, the measurement is not affected by the mechanical layout of the transmission test rig, but includes the power losses of the couplings, such as the constant velocity joints, which are actually installed on the vehicle.

4.2. Test Procedure

The test procedure of this study follows the general guidelines of the SAE [42]. The transmissions were tested in conditions similar to those of actual vehicle operation, i.e., with the same inclination angle as on the vehicle, without differential lock, with the half-shafts with the same angles as on the actual vehicle at the nominal payload, and with the activated microslip controller of the wet clutches in the DCT case. The procedure is as follows:
  • The temperature of the transmission lubricant is initially set to the reference value through the heating/cooling system of the test rig and a pre-defined heating routine. Then, the lubricant temperature is kept approximately constant (in a range of ±5 °C with respect to the reference value) for the whole duration of the test.
  • The appropriate ICE gear or EM gear is selected.
  • The appropriate clutch (odd or even for the DCT) is engaged.
  • The output motor speeds are set to their target value, and then kept constant by a feedback controller.
  • The input motor torque, i.e., either the torque of the electric motor of the test rig emulating the ICE, or the torque of the HAMT EM, is applied in steps up to its maximum value of interest for the specific speed.
  • Each measurement condition is kept for 30 s, during which the torque and speed values at the drivetrain input and outputs, or the EM drive input power when relevant, are collected through the dSPACE ControlDesk software (dSPACE GmbH, Paderborn, Germany).
  • The input torque is gradually removed.
  • The output speed is progressively decreased to zero.
The experiments were repeated for all gears, a wide range of input speeds, and two lubricant temperatures, i.e., at 30 °C (cold run tests) and 70 °C (hot run tests). Repeatability analyses of the collected data were carried out by back-to-back comparison. The acquired data were post-processed to calculate transmission or electric drivetrain efficiency. In particular, the transmission output power is given by:
P o u t ( t ) = T o u t , l e f t ( t )   ω o u t , l e f t ( t ) + T o u t , r i g h t ( t )   ω o u t , r i g h t ( t )
where the output torques, T o u t , l e f t and T o u t , r i g h t , and angular speeds, ω o u t , l e f t and ω o u t , r i g h t , are measured by the torque flange sensors located at the wheel hubs. In case of DCT testing or HAMT ICE gear testing, the input power, P i n ( t ) , is calculated from the torque and speed measured at the torque flange located between the input motor and the transmission clutch:
P i n ( t ) = T i n ( t ) ω i n ( t )
In case of HAMT testing in fully electric mode, the overall electric drivetrain efficiency is measured, i.e., both the EM drive efficiency and transmission efficiency are included. As a consequence, in this case, the input power is equal to the inverter input power, which depends on the inverter current, I i n v ( t ) , and voltage, V i n v ( t ) :
P i n ( t ) = P i n v ( t ) = I i n v ( t ) V i n v ( t )
The efficiency of the mechanical transmission, η t r , or the efficiency of the HAMT electric drivetrain, η d t , are given by the ratio of the average values of P o u t ( t ) and P i n ( t ) during each phase of constant torque and constant speed:
η t r / d t = P ¯ o u t P ¯ i n = 1 N   n = 1 N P o u t ( t n ) 1 N   n = 1 N P i n ( t n )
where N is the number of measured points.

5. DCT and HAMT Comparison

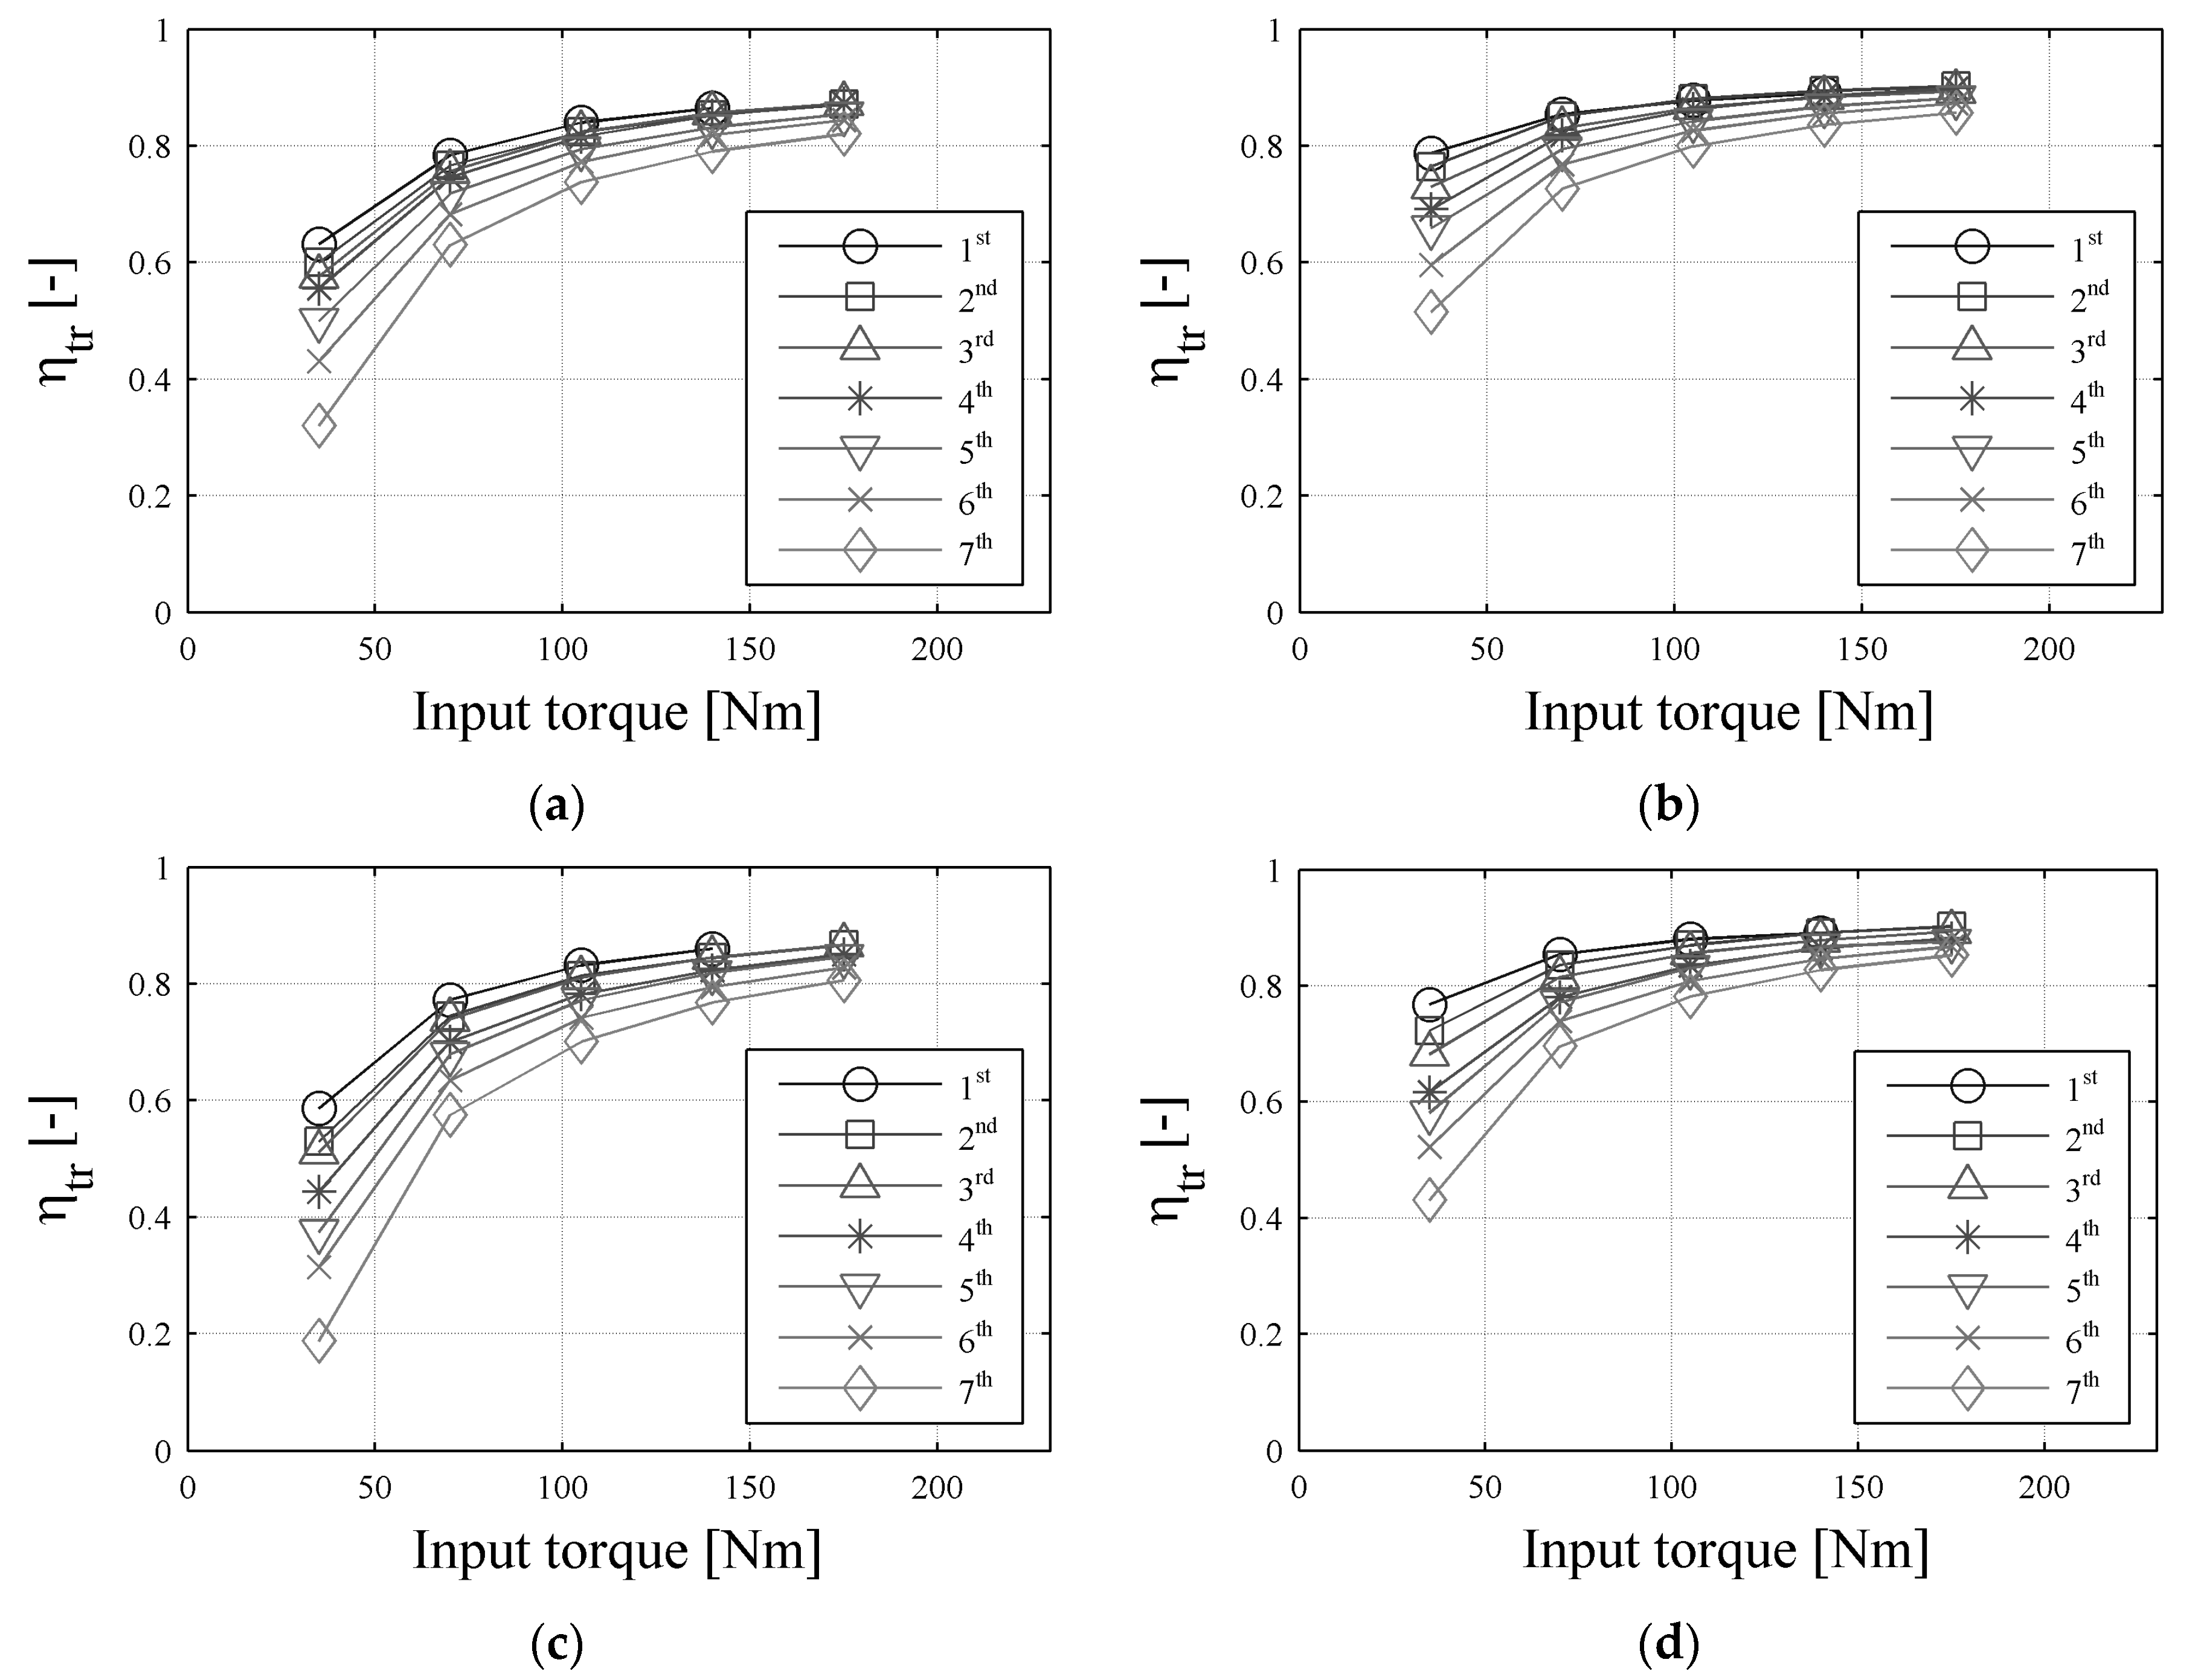
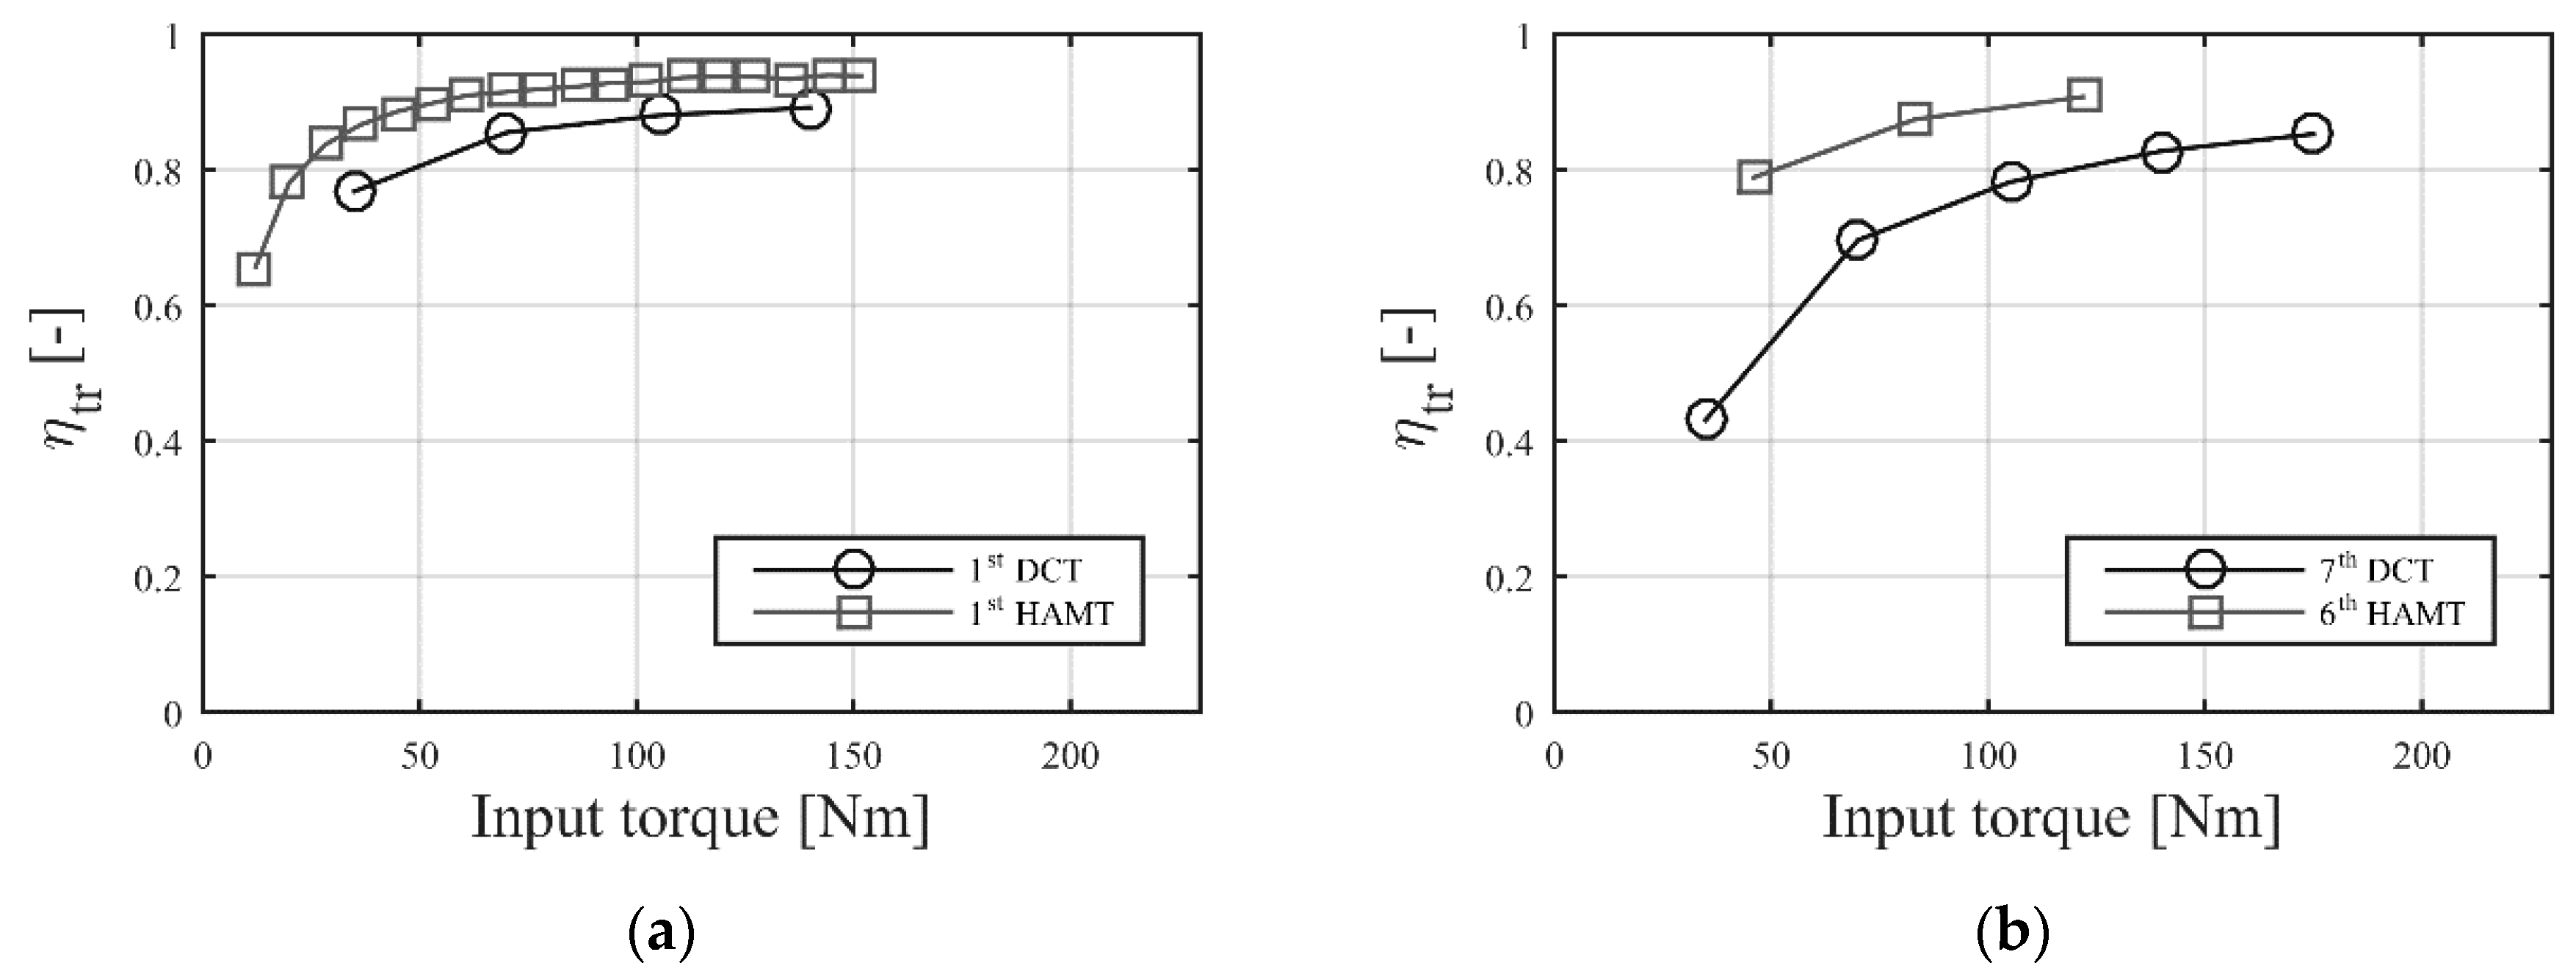
5.1. Experimental Efficiency Maps

Figure 9 reports a sample of the experimental DCT efficiency results for the selected temperatures. In general, the efficiency is an increasing function of input torque, and tends towards ~90% at high torques. On the other hand, the efficiency decreases with input speed. η t r is higher at 70 °C, because of the reduction of lubricant viscosity with temperature. Also, the first gear is the most efficient transmission ratio for all the experimentally measured points.
Figure 10 compares the experimental efficiency maps of the case study DCT and HAMT (in its ICE mode) for the lowest and highest transmission gear ratios, at an input speed of 2000 rpm and 70 °C (note that the DCT has seven gears, while the HAMT has six gears). The shape and trend of the HAMT efficiency map are similar to those of the DCT map. However, the HAMT exhibits consistently higher efficiency values. In general, the efficiency benefit of the HAMT ranges between ~5% and ~9% for input torques >100 Nm. For lower torque values, the difference is even larger. This result is mainly caused by the absence of the wet clutches and clutch pump, where the latter is particularly influential at low input torque. Also, the general mechanical simplicity of the HAMT design contributes to a higher efficiency because of the lower number of components, such as synchronisers and bearings, with their drag torque.
Extracts of the experimentally measured efficiency maps of the electric drivetrain, considering the power losses from the inverter to the wheels, are shown in Figure 11, in which ω E M = 2000 rpm and ω E M = 5000 rpm. At low EM torque values, the efficiency is higher at 2000 rpm, since the mechanical power losses of the drivetrain are increasing functions of speed, and are the prevailing component at low torque. At medium–high motor torque values, the efficiency is higher at 5000 rpm, because of the shape of the efficiency characteristics of the specific electric motor drive, which is the main source of power loss at high torque.

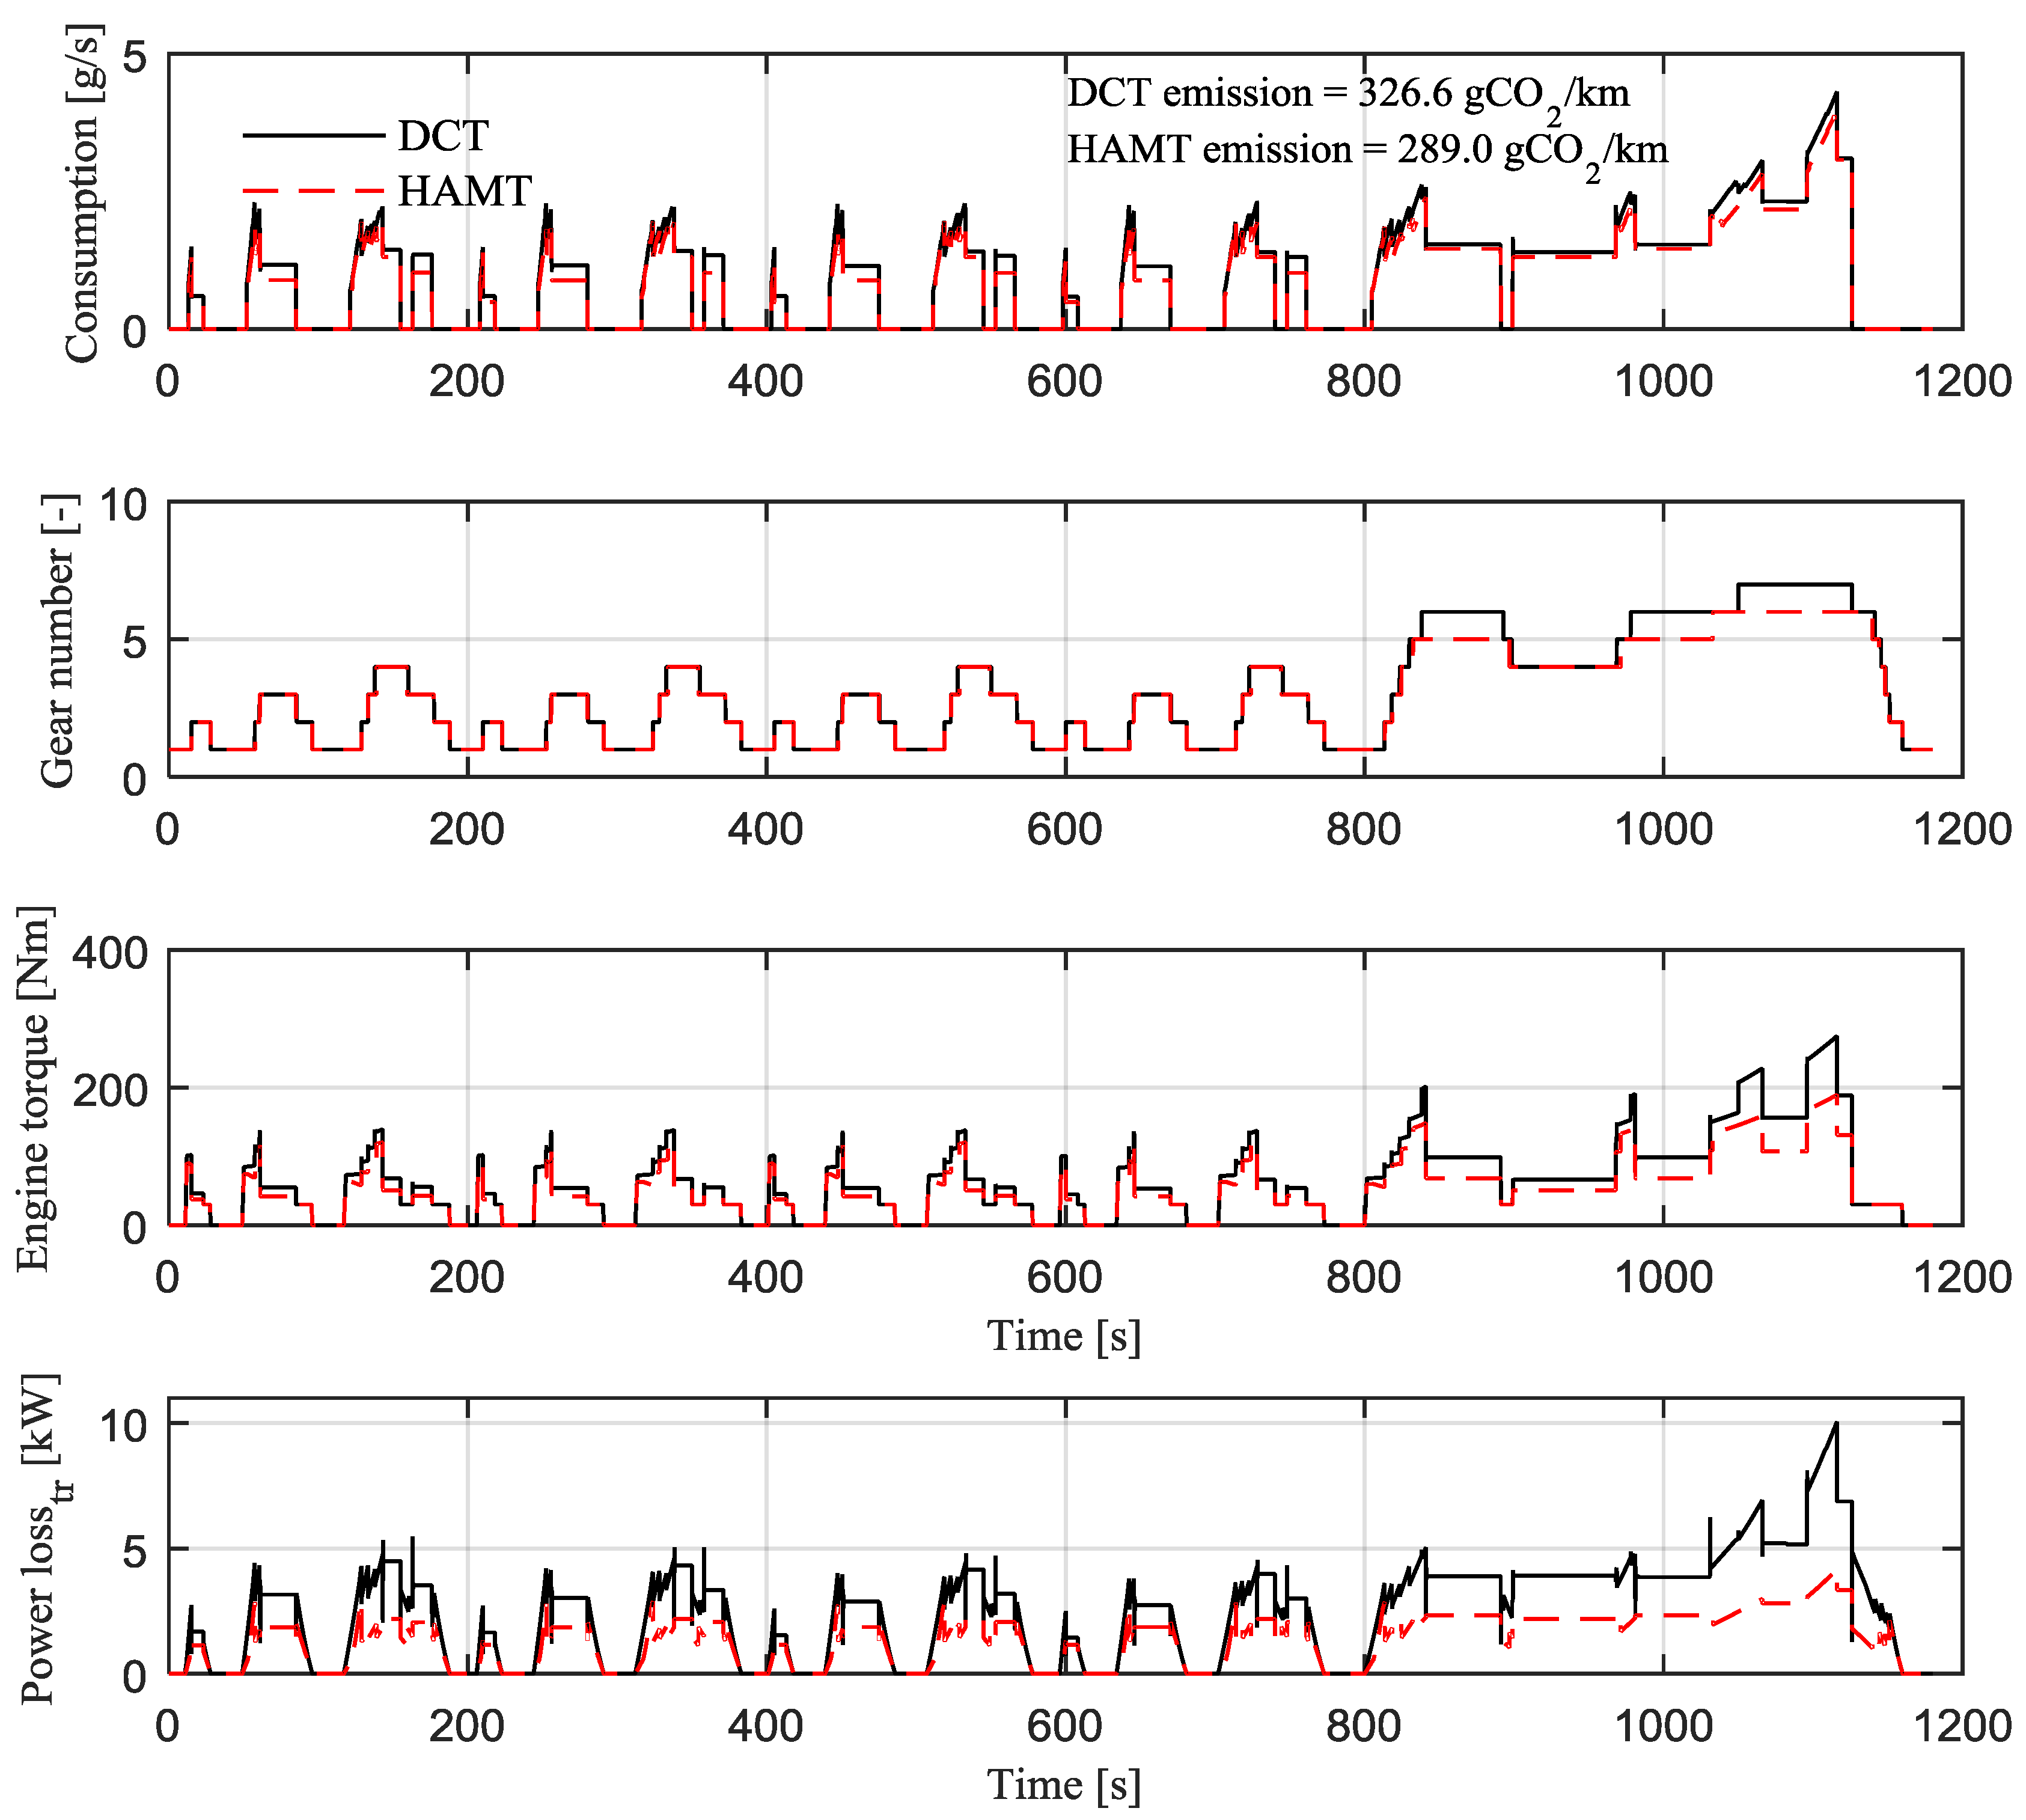
5.2. Driving Cycle Simulation Results

This section assesses the energy consumption reduction achievable through the mechanical power loss decrease associated with the HAMT layout, without considering the further potential benefit of the hybrid mode. To this purpose, the experimental efficiency maps of the case study DCT and HAMT, discussed in Section 5.1, are introduced into the backward-facing simulation model of Section 3, in order to assess the fuel consumption difference for the same vehicle with the two transmissions solely driven by the ICE along the four driving cycles of this study.
The simulations consider the marginal vehicle mass difference between the HAMT and DCT, i.e., ~70 kg of penalty for the HAMT, according to the parameters in Table 1 (note that the HAMT also implies a mass saving—not indicated in the table—in terms of transmission lubricant). This mainly depends on the size of the energy storage unit, based on the integration of a battery and a supercapacitor, to reach high performance both in terms of energy density and power density. Nevertheless, the additional mass of the energy storage and the EM/inverter associated with the HAMT is partially compensated by mass savings (>40 kg) in the mechanical components of the transmission and ancillaries.
The time histories of the instantaneous fuel consumption, gear number, ICE torque, and transmission power loss along the NEDC are shown in Figure 12. The test vehicle includes a start-and-stop system in order to reduce the fuel consumption when the vehicle is at standstill. The fuel consumption related to the engine cranking phases within the operation of the start-and-stop system is neglected in the simulations, and does not significantly affect the results, since the number of engine start/stop transitions is the same for the DCT and HAMT along each driving schedule.
Table 3 reports the average fuel consumption per unit distance, the related CO2 emission per unit distance, and the CO2 emission reduction (in percentage) caused by the HAMT, for each driving cycle. The emission reduction ranges from 9.2% to 11.5%. This considerable saving is achieved as the case study transmissions operate in their very low torque range during the driving schedules, when the difference between DCT and HAMT efficiencies is particularly high. The low torque utilisation is caused by the high performance characteristics of the specific vehicle (see Table 1), with drivetrain components designed for maximum power and input torque levels in excess of 450 kW and 650 Nm, respectively. In low torque conditions, the higher ancillary losses of the DCT are especially penalising. During the analysis of the simulation results, it was verified that the difference in fuel consumption is caused by the reduction (by more than 40%) of the transmission power losses, while the difference in engine efficiency related to the variation of the instantaneous operating points of the ICE has a negligible effect.

6. Conclusions

The paper discussed the relative significance of the individual power loss contributions of a seven-speed dual clutch transmission system with wet clutches, specifically designed for high performance vehicle applications. Based on this analysis, a new transmission with a hybridised automated manual layout, i.e., the HAMT, was proposed, with the aim of providing hybrid electric capability and gearshifts with torque-fill, while significantly reducing the power losses in its internal combustion engine mode with respect to the DCT. The efficiencies of the DCT and HAMT were experimentally measured on a transmission test rig, and the resulting maps were used for vehicle simulations along a selection of four driving cycles. The main conclusions are:
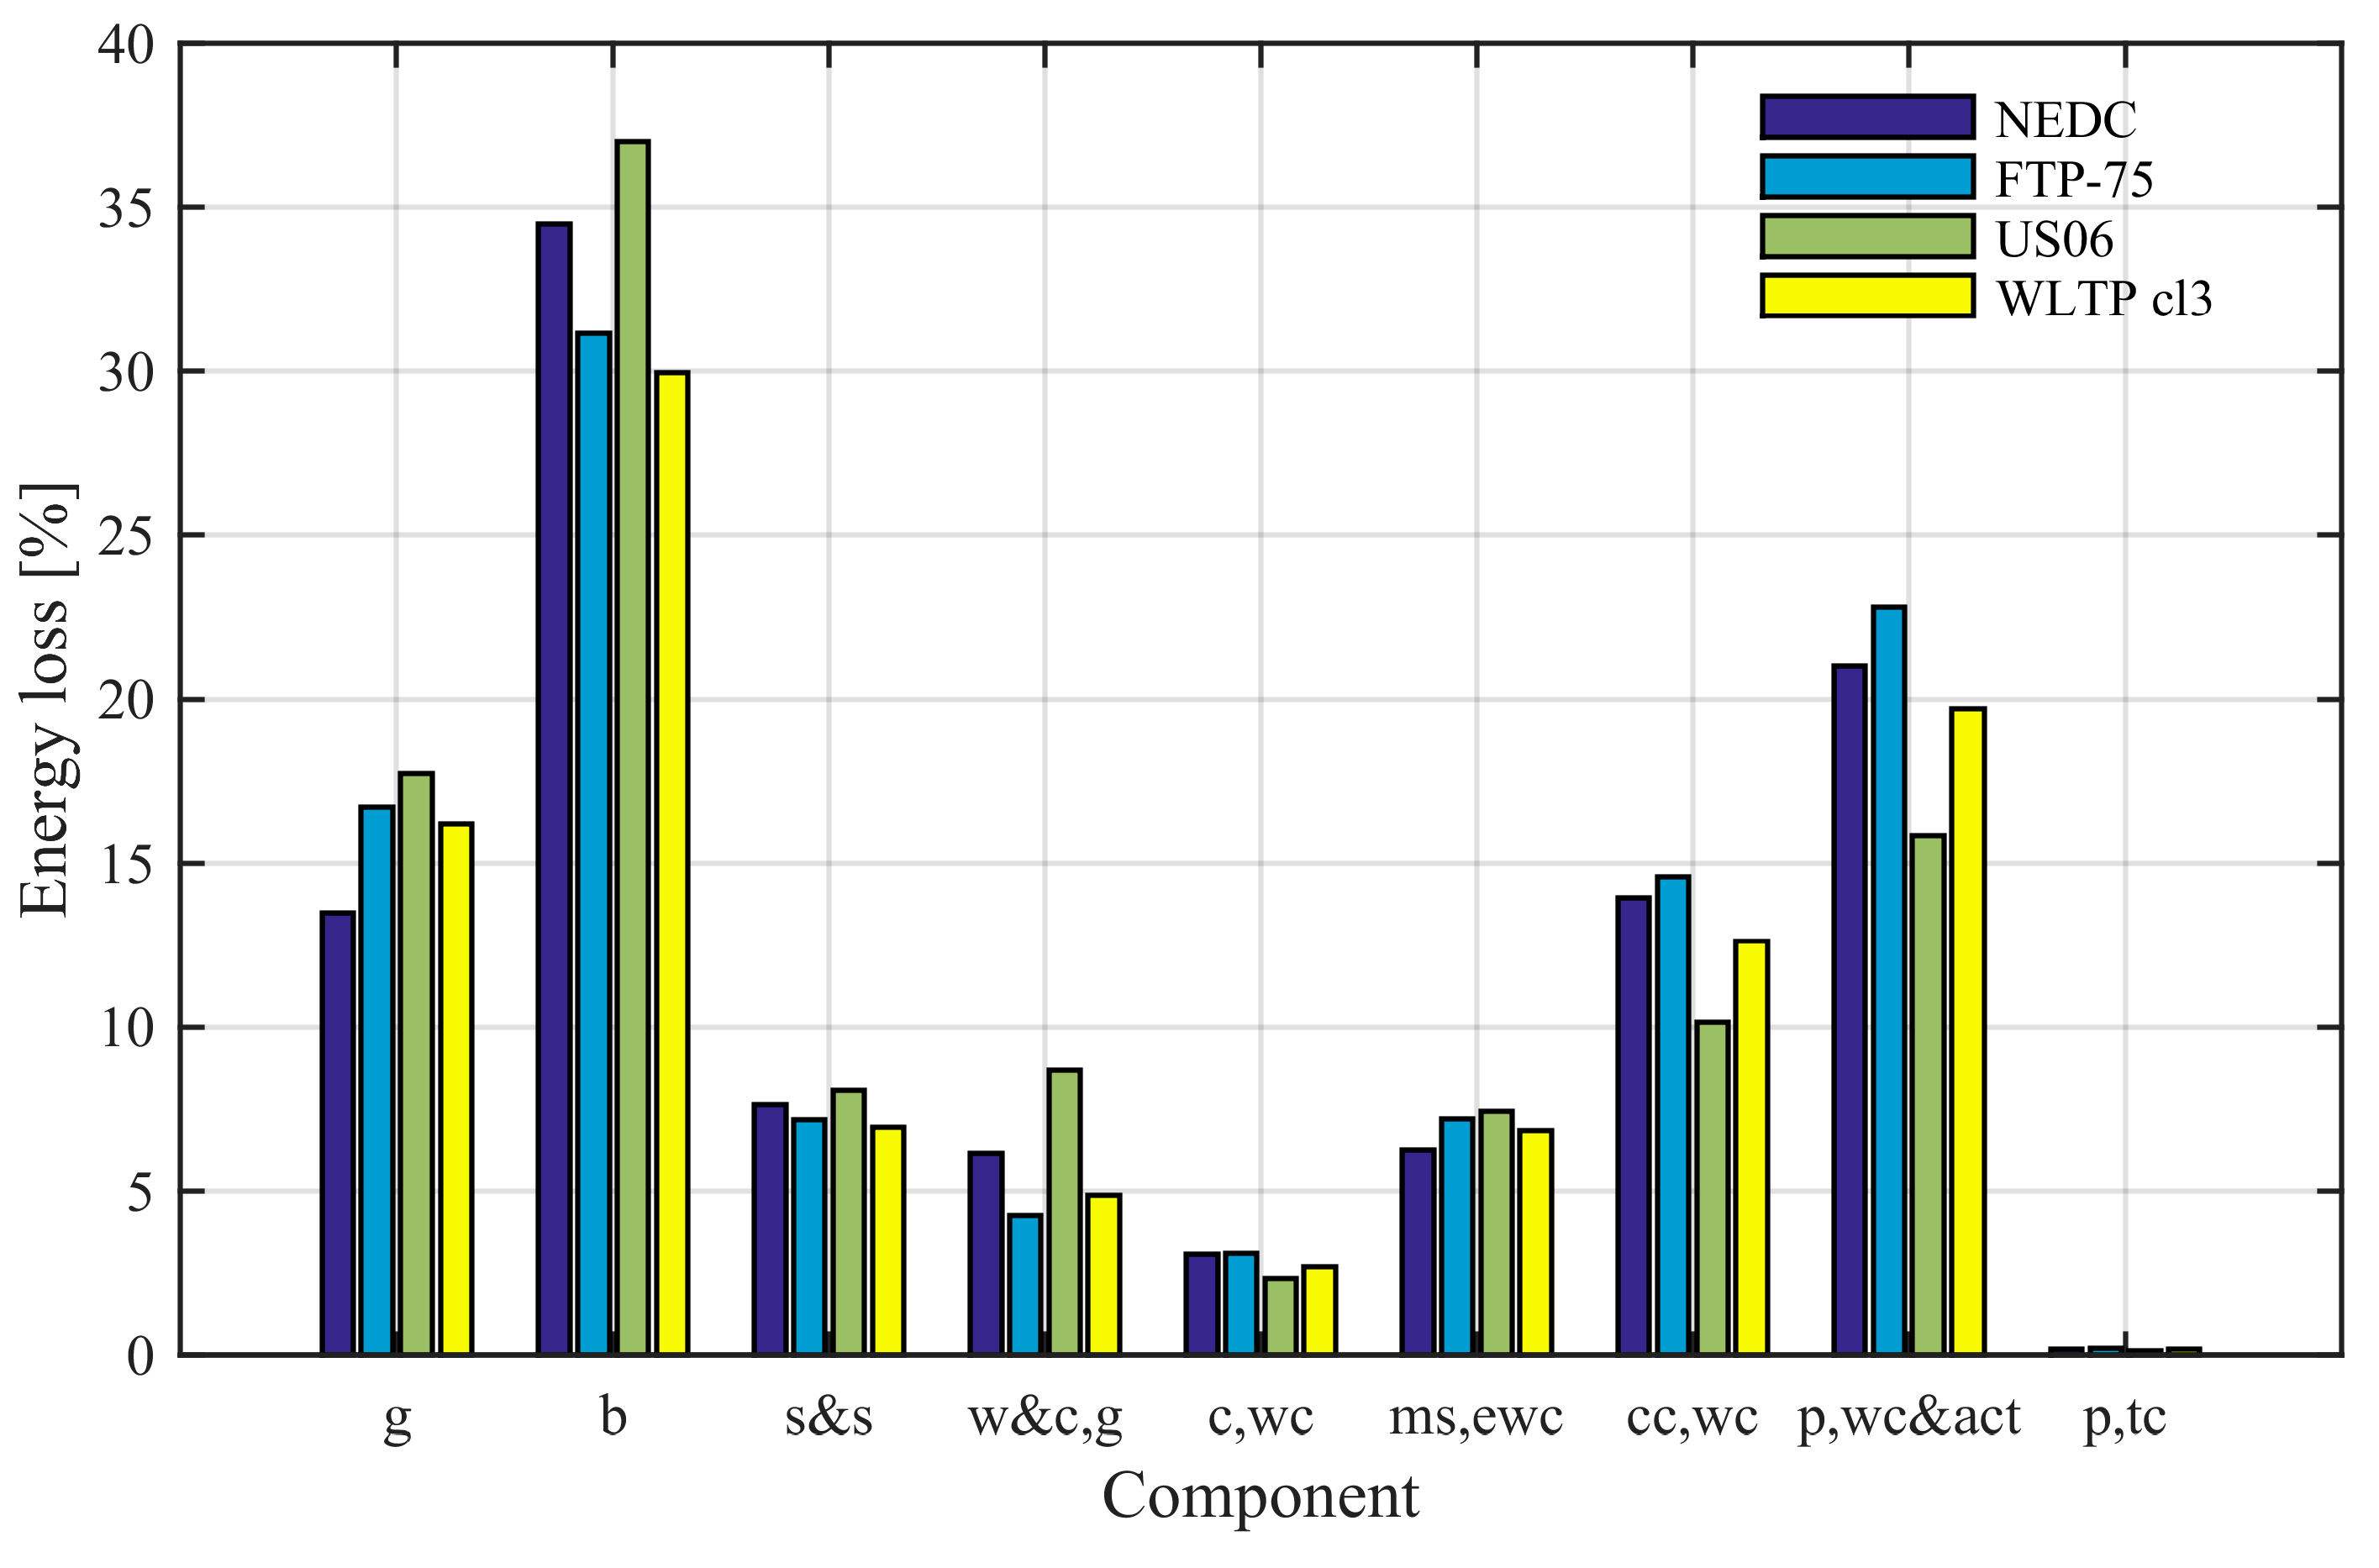
  • The DCT driving cycle simulation results show that the energy losses caused by the wet clutch related components can exceed 40% of the total transmission energy dissipations. This share is particularly high because of the low torque operation of the specific drivetrain during the schedules, with respect to its maximum design values.
  • The described HAMT layout with a single dry clutch avoids most of the clutch power losses because of the absence of clutch churning, clutch microslip, a clutch cooling circuit and a dedicated pump.
  • The experimental efficiency measurements of the two transmissions on a test rig confirmed the higher efficiency of the HAMT with respect to the DCT. In particular, the efficiency increases between 5% and 9% at medium–high input torque values, depending on the selected gear. Larger efficiency improvements are achieved at low torque demands, which are typical of the selected driving cycles because of the reduction of the power losses associated with the ancillary systems in the HAMT. As expected, transmission efficiency increases with temperature for both transmission layouts.
  • The fuel consumption benefit of the HAMT along the selected driving cycles ranges from 9.2% to 11.5% in the ICE mode. Hence, the appropriate energy efficiency-oriented design of the transmission system should become an important point in the drivetrain development process.
Future work will focus on the formal analysis of the individual HAMT power loss contributions, and the assessment and validation of the further fuel consumption reductions associated with the optimal control of the hybrid mode of the HAMT.

Acknowledgments

The authors would like to thank Oerlikon Graziano Spa and Vocis Driveline Controls for the financial and technical support provided throughout the research project.

Author Contributions

Fabio Vacca prepared the original draft of the paper, executed the experimental tests on the transmission rig, developed the vehicle model and ran the simulations. Stefano De Pinto and Ahu Ece Hartavi Karci supported the simulation work. Patrick Gruber and Ahu Ece Hartavi Karci reviewed the draft version of the paper and provided important suggestions for the final version. Fabio Viotto generated the simulated power loss maps of the dual clutch transmission. Carlo Cavallino and Jacopo Rossi provided continuous support to the experimental and modelling activities, and supplied the vehicle test results for simulation model validation. Aldo Sorniotti supervised the whole activity and prepared the revised version of the paper with extensive editing.

Conflicts of Interest

The authors declare no conflict of interest.

List of Symbols

b I C E Brake specific fuel consumption of the internal combustion engine
C d r a g Aerodynamic drag coefficient
D s , i Diameter of the i -th seal
E l o s s , j Energy related to the power loss contribution j
f 0 Rolling resistance coefficient (part independent of vehicle speed)
f 2 Rolling resistance coefficient (part to be multiplied by the square of vehicle speed)
g Gravity
I i n v Inverter input current
i k , I C E Internal combustion engine related transmission ratio for the k -th gear
i 1 , I C E , …, i 7 , I C E Internal combustion engine related transmission ratios for the 1st gear, …, 7th gear, i.e., the ratios between the ICE speed and the differential case speed
i h , E M Electric motor related transmission ratio for the h -th gear
i 1 , E M , i 2 , E M 1st and 2nd electric motor related gear ratios
J c l u t c h Mass moment of inertia of the rotating components of the clutch assembly
J I C E Mass moment of inertia of the rotating parts of the internal combustion engine
J w Wheel mass moment of inertia
k h y p e r Coefficient of the hyperbolic tangent function for modelling tyre rolling resistance at low speed
m Vehicle mass
m a p p Apparent vehicle mass
M b , i Total resistance torque of the i -th bearing
M c h , i Churning friction torque of the i -th bearing
m D C T DCT mass
m E M , H A M T HAMT EM mass
m E S , H A M T HAMT energy storage mass
m H A M T HAMT mass (transmission only)
m ˙ I C E Fuel mass flow rate
m i n v , H A M T HAMT inverter mass
M r r , i Roller resistance torque of the of the i -th bearing
M s e a l , i Friction torque of the seals of the i -th bearing
M s l , i Sliding friction torque of the   i -th bearing
n Index of a measured point
N Number of measurement points during a steady-state efficiency measurement phase
P b Total transmission bearing power loss
P c c Cooling circuit power loss
P c c , w c Power loss of the cooling circuit of the wet clutch pack
P c , w c Churning power loss of the wet clutch pack
P d Drivetrain power
P E M , m a x Peak power of the HAMT EM
P E M , n o m Nominal power of the HAMT EM
P g Total transmission gear meshing power loss
P g , b Bevel gear power loss
P g , h Helical gear power loss
P I C E Power output of the internal combustion engine
P I C E , m a x Maximum power of the internal combustion engine
P i n Transmission input power
P ¯ i n Average transmission input power during a steady-state efficiency measurement phase
P i n v Inverter input power
P j j -th transmission power loss contribution
P m s , e w c Microslip power loss of the engaged wet clutch
P o u t Transmission output power
P ¯ o u t Average transmission output power during a steady-state efficiency measurement phase
P p Pump power loss
P p , t c Power loss of the transmission cooling circuit pump
P p , w c & a c t Power loss of the pump for wet clutch cooling and transmission system actuation
P s e a l Total transmission seal power loss
P s e a l , i Power loss of the i -th seal
P s & s Total transmission seal and synchroniser power loss
P s y n c h r o Total synchroniser power loss (outside the synchronisation phases)
P s y n c h r o , i Power loss of the i -th synchroniser (outside the synchronisation phases)
P t o t Total power loss of a generic transmission
P t o t , D C T Total DCT power loss
P t o t , D C T , w / o m s Total DCT power loss, with the exclusion of the clutch microslip power loss
P w & c , g Total gearbox windage and churning power loss
P w & c , g f Windage and churning power loss associated with the faces of the gears
P w & c , g t Windage and churning power loss associated with the teeth of the gears
P w & c , s Windage and churning power loss associated with the rotating shafts
R w Wheel radius
S Frontal area of the vehicle
s i Coefficient for the estimation of the i -th seal friction torque
t Time
T d Required drivetrain torque at the wheel
T E M , m a x Peak torque of the HAMT EM
T E M , n o m Nominal torque of the HAMT EM
T e w c Engaged wet clutch torque
t f i n a l ,   t i n i t i a l Final and initial times of the driving cycle simulation
T I C E Internal combustion engine torque
T I C E , m a x Maximum torque of the internal combustion engine
T i n Transmission input torque
t n Time of corresponding to the n -th measured point
T o u t , l e f t , T o u t , r i g h t Left and right drivetrain output torques
T s , i Drag torque of the i -th seal
V I C E , d Instantaneous volume fuel consumption per unit distance
V i n v Inverter voltage
V v e h Vehicle speed
Δ ω e w c Slip speed of the engaged wet clutch
η d t Electric drivetrain efficiency (from the inverter to the wheels)
η t r Transmission efficiency
θ c l Wet clutch oil temperature
θ I C E Coolant temperature of the ICE
θ t r Transmission lubricant temperature
ρ Air density
ρ f u e l Fuel density
ω E M Angular speed of the electric motor
ω I C E Angular speed of the internal combustion engine
ω i n Transmission input speed
ω o u t , l e f t , ω o u t , r i g h t Angular speeds at the left and right wheel hubs
ω s , i Relative angular speed between the i -th seal and the corresponding transmission component
ω w Angular wheel speed

References

  1. National Research Council. Cost, Effectiveness, and Deployment of Fuel Economy Technologies for Light-Duty Vehicles; The National Academies Press: Washington, DC, USA, 2015. [Google Scholar]
  2. Johnson, T.V. Diesel emissions in review. SAE Int. J. Engines 2011, 4, 143–157. [Google Scholar] [CrossRef]
  3. Mueller, N.; Strauss, S.; Tumback, S.; Goh, G.C.; Christ, A. Next generation engine start/stop systems: “Free-wheeling”. SAE Int. J. Engines 2011, 4, 874–887. [Google Scholar] [CrossRef]
  4. National Research Council. Assessment of Fuel Economy Technologies for Light-Duty Vehicles; The National Academies Press: Washington, DC, USA, 2011. [Google Scholar]
  5. Tribioli, L. Energy-Based Design of Powertrain for a Re-Engineered Post-Transmission Hybrid Electric Vehicle. Energies 2017, 10, 918. [Google Scholar] [CrossRef]
  6. De Cauwer, C.; Verbeke, V.; Coosemans, T.; Faid, S.; Van Mierlo, J. A Data-Driven Method for Energy Consumption Prediction and Energy-Efficient Routing of Electric Vehicles in Real-World Conditions. Energies 2017, 10, 608. [Google Scholar] [CrossRef]
  7. Bottiglione, F.; De Pinto, S.; Mantriota, G.; Sorniotti, A. Energy Consumption of a Battery Electric Vehicle with Infinitely Variable Transmission. Energies 2014, 7, 8317–8337. [Google Scholar] [CrossRef] [Green Version]
  8. Kulkarni, M.; Shim, T.; Zhang, Y. Shift dynamics and control of dual-clutch transmissions. Mech. Mach. Theory 2007, 42, 168–182. [Google Scholar] [CrossRef]
  9. Schaeffler Automotive Aftermarket GmbH & Co. KG. The Dry Double Clutch. 2014. Available online: http://www.schaeffler.com/remotemedien/media/_shared_media/08_media_library/01_publications/automotiveaftermarket/brochure_1/downloads_5/luk_5/LuK_TecBr_2CT_Basis_LowRes_GB.pdf (accessed on 28 July 2017).
  10. Webster, H. A fully automatic vehicle transmission using a layshaft type gearbox. SAE Int. 1981, 810104. [Google Scholar] [CrossRef]
  11. Van Dongen, L.A.M. Efficiency characteristics of manual and automatic passenger car transaxles. SAE Int. 1982. [Google Scholar] [CrossRef]
  12. Greenbaum, J.; Kluger, M.; Westmoreland, B. Manual transmission efficiency trends and characteristics. SAE Int. 1994. [Google Scholar] [CrossRef]
  13. Hohn, B.R.; Michaelis, K.; Hinterstoißer, M. Optimization of gearbox efficiency. Goriva i Maziva 2009, 48, 462–480. [Google Scholar]
  14. Falzoni, F. Seven-Gear Gearbox for a Motorcar Double Clutch Transmission. U.S. Patent 7,562,598, 21 July 2009. [Google Scholar]
  15. Liu, H.; Lee, J.C.; Yoon, A.; Kim, S.-T. Profile design and numerical calculation of instantaneous flow rate of a gerotor pump. J. Appl. Math. Phys. 2015, 3, 92–97. [Google Scholar] [CrossRef]
  16. De Pinto, S.; Camocardi, P.; Sorniotti, A.; Gruber, P.; Perlo, P.; Viotto, F. Torque-Fill Control and Energy Management for a Four-Wheel-Drive Electric Vehicle Layout with Two-Speed Transmissions. IEEE Trans. Ind. Appl. 2017, 53, 447–458. [Google Scholar] [CrossRef]
  17. Sorniotti, A.; Boscolo, M.; Turner, A.; Cavallino, C. Optimisation of a 2-Speed Gearbox for an Electric Vehicle. In Proceedings of the 2010 Symposium on Advanced Vehicle Control (AVEC), Loughborough, UK, 22–26 August 2010. [Google Scholar]
  18. Gavgani, A.M.; Bingham, T.; Sorniotti, A.; Doherty, J.; Cavallino, C.; Fracchia, M. A parallel hybrid electric drivetrain layout with torque-fill capability. SAE Int. J. Passeng. Cars Mech. Syst. 2015, 8, 767–778. [Google Scholar]
  19. Gavgani, A.M.; Sorniotti, A.; Doherty, J.; Cavallino, C. Optimal gearshift control for a novel hybrid electric drivetrain. Mech. Mach. Theory 2016, 105, 352–368. [Google Scholar] [CrossRef] [Green Version]
  20. British Standards Institute (BSI). ISO/TR 14179–1:2001: Gears—Thermal Capacity—Part 1: Rating Gear Drives with Thermal Equilibrium at 95 °C Sump Temperature; British Standards Institute: London, UK, 2001. [Google Scholar]
  21. Fernandes, C.; Marques, P.M.T.; Martins, R.C.; Seabra, J.H.O. Gearbox power loss. Part II: Friction losses in gears. Tribol. Int. 2015, 88, 309–316. [Google Scholar] [CrossRef]
  22. SKF. I Cuscinetti Volventi, Quaderni di Formazione; Gruppo SKF: Airasca, Italy, 2008. [Google Scholar]
  23. Sorniotti, A.; Sampo’, E.; Velardocchia, M.; Bonisoli, E.; Galvagno, E. Friction inside Wheel Hub Bearings: Evaluation through Analytical Models and Experimental Methodologies. SAE Int. 2007. [Google Scholar] [CrossRef]
  24. Schaeffler Technologies. Bearinx, Herzogenaurach, Germany. Available online: http://www.schaeffler.com/remotemedien/media/_shared_media/08_media_library/01_publications/schaeffler_2/brochure/downloads_1/pbo_de_us.pdf (accessed on 28 July 2017).
  25. Naunheimer, H.; Bertsche, B.; Ryborz, J.; Novak, W. Automotive Transmissions, 2nd ed.; Springer Science & Business Media: Berlin, Germany, 2011; pp. 115–139. [Google Scholar]
  26. Niemann, G.; Winter, H.; Höhn, B.R. Manuale Degli Organi Delle Macchine; Tecniche Nuove: Milan, Italy, 2006. [Google Scholar]
  27. Kitabayashi, H.; Li, C.Y.; Hiraki, H. Analysis of the various factors affecting drag torque in multiple-plate wet clutches. SAE Int. 2003. [Google Scholar] [CrossRef]
  28. Li, H.; Jing, Q.; Ma, B. Modeling and parametric study on drag torque of wet clutch. In Proceedings of the FISITA 2012 World Automotive Congress: Volume 5: Advanced Transmission System and Driveline; Springer: Berlin, Germany, 2013; pp. 21–30. [Google Scholar]
  29. Sung, I.H.; Ryu, J.S. Computational simulation study on the viscous drag of the automotive wet clutch for prediction and control. In Proceedings of the ASME 2015 International Mechanical Engineering Congress and Exposition, Houston, TX, USA, 13–19 November 2015; Advances in Multidisciplinary Engineering. ASME: New York, NY, USA, 2015; Volume 15, p. V015T19A035. [Google Scholar]
  30. Yuan, Y.; Liu, E.A.; Hill, J.; Zou, Q. An improved hydrodynamic model for open wet transmission clutches. J. Fluids Eng. 2007, 129, 333–337. [Google Scholar] [CrossRef]
  31. Bucciarelli, A.; Speich, H. Manuale di Oleodinamica; Tecniche Nuove: Milan, Italy, 2002. [Google Scholar]
  32. Townsend, D. Dudley’s Gear Handbook, 2nd ed.; McGraw Hill: New York, NY, USA, 1992. [Google Scholar]
  33. Schlegel, C.; Hosl, A.; Diel, S. Detailed loss modelling of vehicle gearboxes. In Proceedings of the 7th Modelica Conference, Como, Italy, 20–22 September 2009. [Google Scholar]
  34. Inaguma, Y.; Yoshida, N. Mathematical analysis of influence of oil temperature on efficiencies in hydraulic pumps for automatic transmissions. SAE Int. J. Passeng. Cars Mech. Syst. 2013, 6, 786–797. [Google Scholar] [CrossRef]
  35. Hibi, A.; Ichikawa, T. Mathematical model of the torque characteristics for hydraulic motors. Bull. JSME 1977, 20, 616–621. [Google Scholar] [CrossRef]
  36. Markel, T.; Brooker, A.; Hendricks, T.; Johnson, V.; Kelly, K.; Kramer, B.; O’Keefe, M.; Sprik, S.; Wipke, K. ADVISOR: A systems analysis tool for advanced vehicle modeling. J. Power Sources 2002, 110, 255–266. [Google Scholar] [CrossRef]
  37. Gao, D.W.; Mi, C.; Emadi, A. Modeling and simulation of electric and hybrid vehicles. Proc. IEEE 2007, 95, 729–745. [Google Scholar] [CrossRef]
  38. Pennycott, A.; De Novellis, L.; Gruber, P.; Sorniotti, A. Sources of power loss during torque–vectoring for fully electric vehicles. Int. J. Veh. Des. 2015, 67, 157–177. [Google Scholar] [CrossRef]
  39. De Novellis, L.; Sorniotti, A.; Gruber, P. Wheel torque distribution criteria for electric vehicles with torque-vectoring differentials. IEEE Trans. Veh. Technol. 2014, 63, 1593–1602. [Google Scholar] [CrossRef]
  40. National Highway Traffic Safety Administration. Light-Duty Vehicle Greenhouse Gas Emission Standards and Corporate Average Fuel Economy Standards; Final Rule, Part 2; United States Government: Washington, DC, USA, 2010.
  41. Environmental Protection Agency. Greenhouse Gas Emissions from a Typical Passenger Vehicle; EPA-420-F-14-040a; U.S. Environmental Protection Agency: Ann Arbor, MI, USA, 2014.
  42. SAE International. Manual Transmission and Transaxle Efficiency and Parasitic Loss Measurement; No. J2453; SAE International: Warrendale, PA, USA, 2011. [Google Scholar]
Figure 1. (a) Case study vehicle configuration; (b) DCT layout; (c) 3D model of the DCT; (d) HAMT layout; (e) 3D model of the HAMT.
Energies 10 01562 g001
Figure 2. HAMT schematics in different modes with indication of the respective power flows in traction.
Energies 10 01562 g002
Figure 3. Transmission power loss model structure.
Energies 10 01562 g003
Figure 4. DCT power loss contributions at θ t r = 80 °C: (a) T i n = 50 Nm, first gear; (b) T i n = 50 Nm, seventh gear; (c) T i n = 100 Nm, first gear; (d) T i n = 100 Nm, seventh gear; (e) T i n = 400 Nm, first gear; (f) T i n = 400 Nm, seventh gear.
Energies 10 01562 g004
Figure 5. Experimental b I C E ( ω I C E , T I C E ) map for θ I C E = 90 °C, with indication of the ICE operating points during the NEDC.
Energies 10 01562 g005
Figure 6. Comparison between experimental and simulation fuel consumption results for the case study vehicle equipped with the DCT, along the New European Driving Cycle (NEDC).
Energies 10 01562 g006
Figure 7. Energy loss contributions expressed as a percentage of the overall transmission energy loss during a selection of driving cycles: NEDC, Federal Test Procedure 75 (FTP-75), Supplemental Federal Test Procedure (US06) and Worldwide harmonised Light vehicles Test Procedures for high power vehicles (WLTP cl3). g: gear meshing; b: bearings; s&s: synchronisers and seals; w&c,g: gearbox windage and churning; c,wc: wet clutch churning; ms,ewc: engaged wet clutch microslip; cc,wc: wet clutch cooling circuit; p,wc&act: pump for wet clutch cooling and actuation circuit; p,tc: transmission cooling circuit with respective pump.
Energies 10 01562 g007
Figure 8. The University of Surrey transmission test rig.
Energies 10 01562 g008
Figure 9. Sample of the experimentally measured DCT efficiency values as functions of input torque: (a)   ω i n = 1000 rpm, θ t r = 30 °C; (b) ω i n = 1000 rpm, θ t r = 70 °C; (c)   ω i n = 2000 rpm, θ t r = 30 °C; (d) ω i n = 2000 rpm, θ t r = 70 °C.
Energies 10 01562 g009
Figure 10. Comparison of the experimentally measured efficiencies of the case study DCT and HAMT at ω i n = 2000 rpm and θ t r = 70 °C: (a) first gear; (b) seventh gear (DCT) and sixth gear (HAMT).
Energies 10 01562 g010
Figure 11. Sample of the experimentally measured electric drivetrain efficiency of the case study HAMT in fully electric mode (first EM gear), at ω E M = 2000 rpm and ω E M = 5000 rpm.
Energies 10 01562 g011
Figure 12. Simulation results for NEDC driving cycle; comparison between DCT and HAMT.
Energies 10 01562 g012
Table 1. Main vehicle and transmission parameters.
SymbolNameValueUnit
m Vehicle mass with DCT1673kg
T I C E , m a x Maximum ICE torque683Nm
P I C E , m a x Maximum ICE power480kW
R w Wheel radius0.33m
f 0 Rolling resistance coefficient (speed independent term)0.015-
f 2 Speed related term of the rolling resistance coefficient6.5 × 10−6s2/m2
C d r a g Aerodynamic drag coefficient0.39-
S Frontal area of the vehicle1.92m2
J c l u t c h Clutch mass moment of inertia0.05kg m2
J I C E Engine mass moment of inertia0.12kg m2
J w Wheel mass moment of inertia0.96kg m2
m D C T DCT mass160kg
m H A M T HAMT mass (transmission only)115kg
m E M , H A M T HAMT EM mass25kg
m i n v , H A M T HAMT inverter mass10kg
m E S , H A M T HAMT energy storage mass85kg
T E M , p e a k Peak torque of the HAMT EM198Nm
T E M , n o m Nominal torque of the HAMT EM100Nm
P E M , p e a k Peak power of the HAMT EM120kW
P E M , n o m Nominal power of the HAMT EM90kW
DCTHAMT
i 1 , I C E 1st ICE gear ratio13.16912.647[-]
i 2 , I C E 2nd ICE gear ratio8.6448.498[-]
i 3 , I C E 3rd ICE gear ratio6.3006.226[-]
i 4 , I C E 4th ICE gear ratio4.8924.649[-]
i 5 , I C E 5th ICE gear ratio3.8413.545[-]
i 6 , I C E 6th ICE gear ratio2.9962.729[-]
i 7 , I C E 7th ICE gear ratio2.269NA[-]
i 1 , E M 1st EM gear ratioNA13.89[-]
i 2 , E M 2nd EM gear ratioNA4.54[-]
Table 2. Operating modes of the HAMT and the corresponding status of each actuator (the status of the actuators during gear shifts is not included).
ModeEM StatusICE StatusEM GearICE GearHybrid CouplingDry Clutch
ICEOFFONN1st–6thEngagedClosed
Fully electricONOFF1stNEngagedClosed
Hybrid electricONON1st, 2nd1st–6thEngagedClosed
Reverse gearONOFF1st1stEngagedOpen
Cranking from stop and rechargeONCranking1st3rdDisengagedClosed
Cranking from fully electric modeONCranking1st3rd–6thEngagedClosing
Table 3. Simulation results for the NEDC, FTP75, US06, and WLTP (cl 3) driving schedules.
Driving CycleTransmission SystemConsumption [l/100 km]CO2 Emission [g/km]HAMT Emission Reduction w.r.t. DCT [%]
NEDCDCT13.9326.611.5
HAMT12.3289.0
FTP75DCT13.5317.211.1
HAMT12.0282.0
US06DCT13.1307.89.2
HAMT11.9279.6
WLTP cl3DCT12.9303.110.8
HAMT11.5270.2

