Application of the Sensor Selection Approach in Polymer Electrolyte Membrane Fuel Cell Prognostics and Health Management


Abstract
1. Introduction
2. Development of PEM Fuel Cell Model and Generation of Sensitivity Matrix
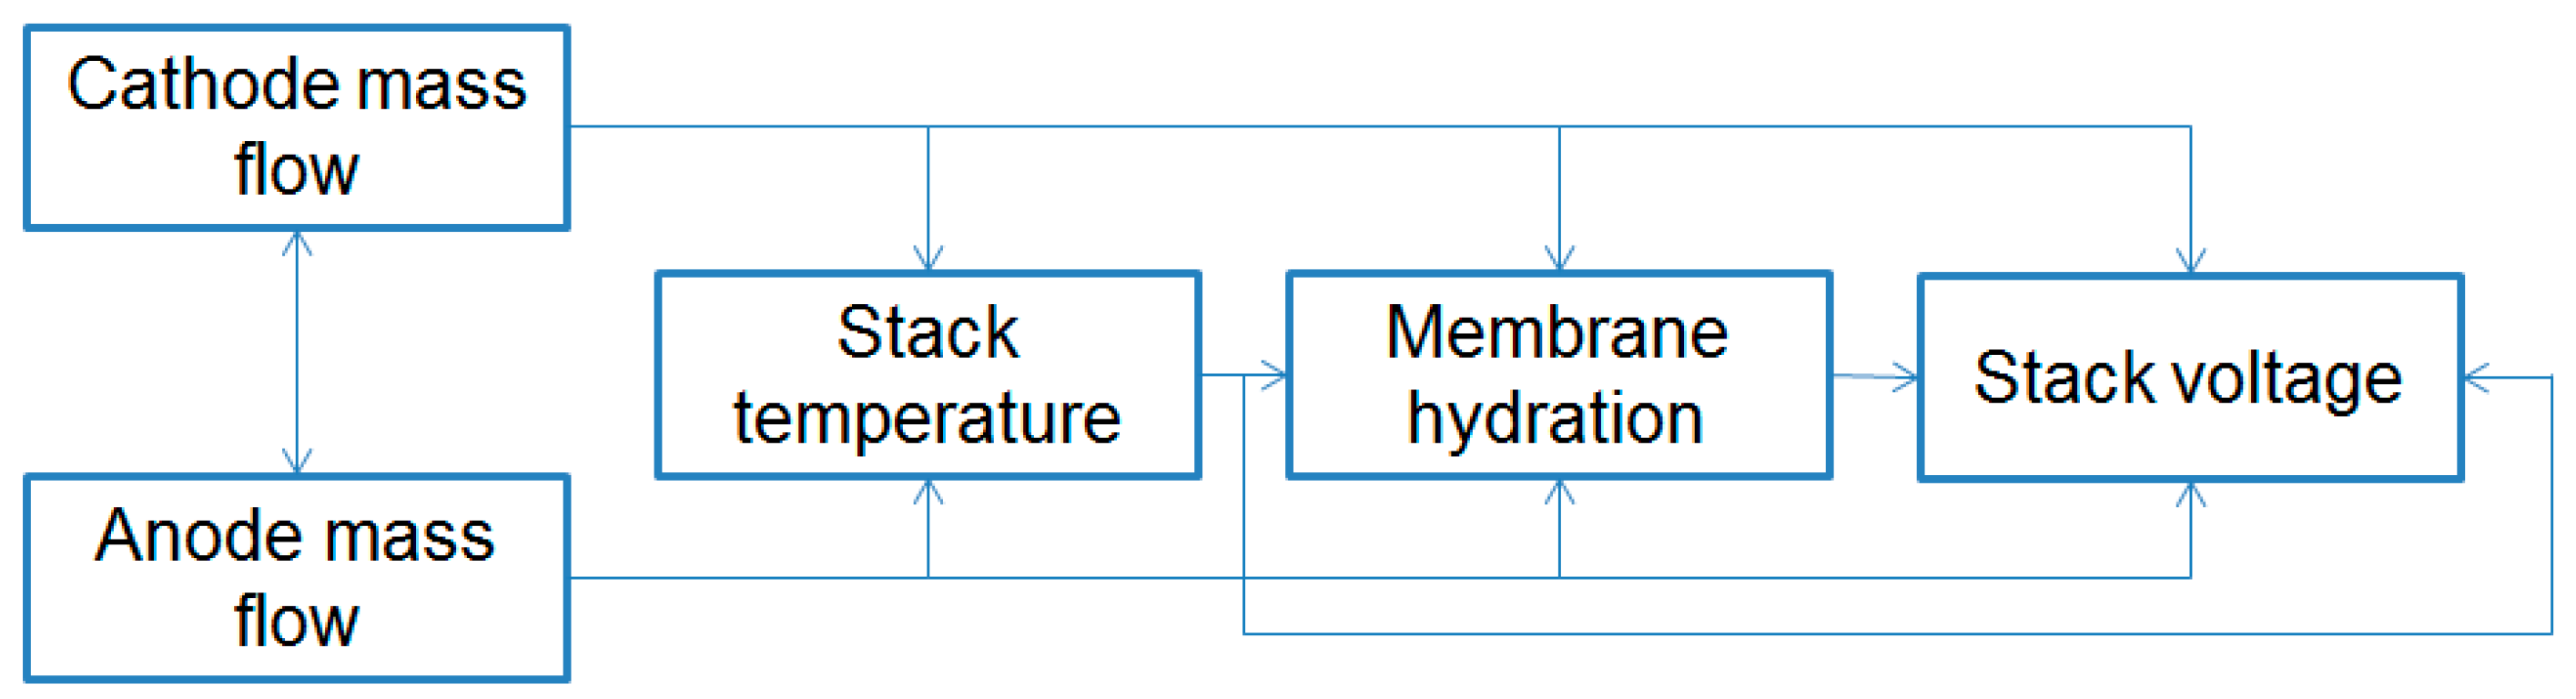
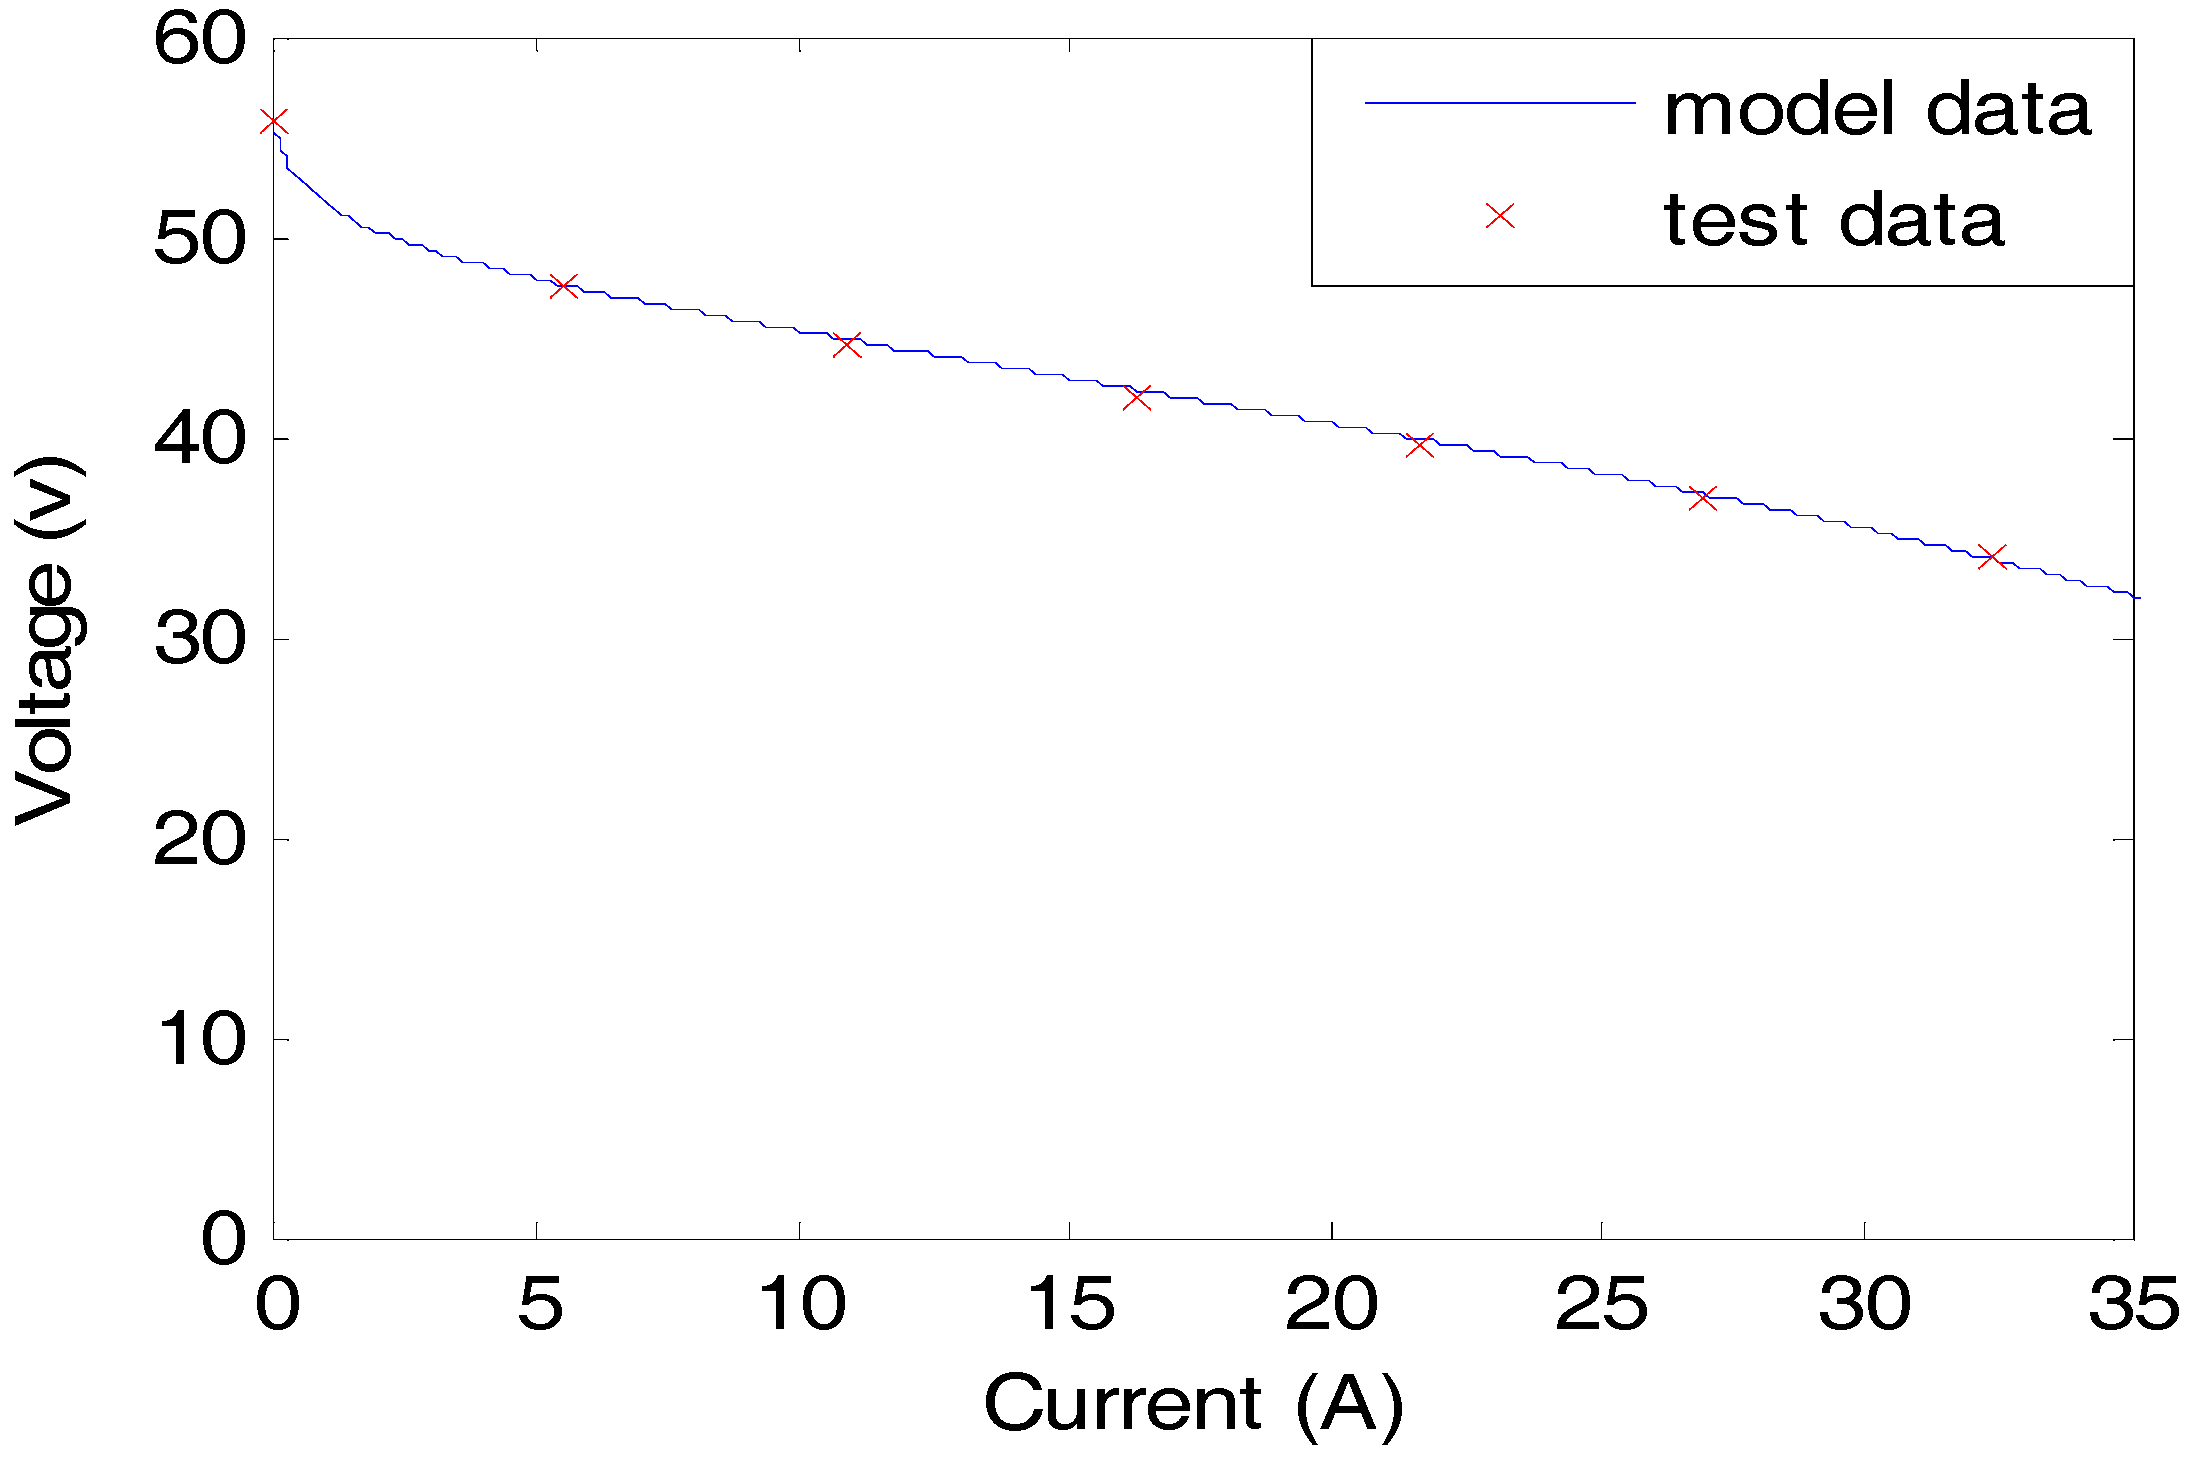
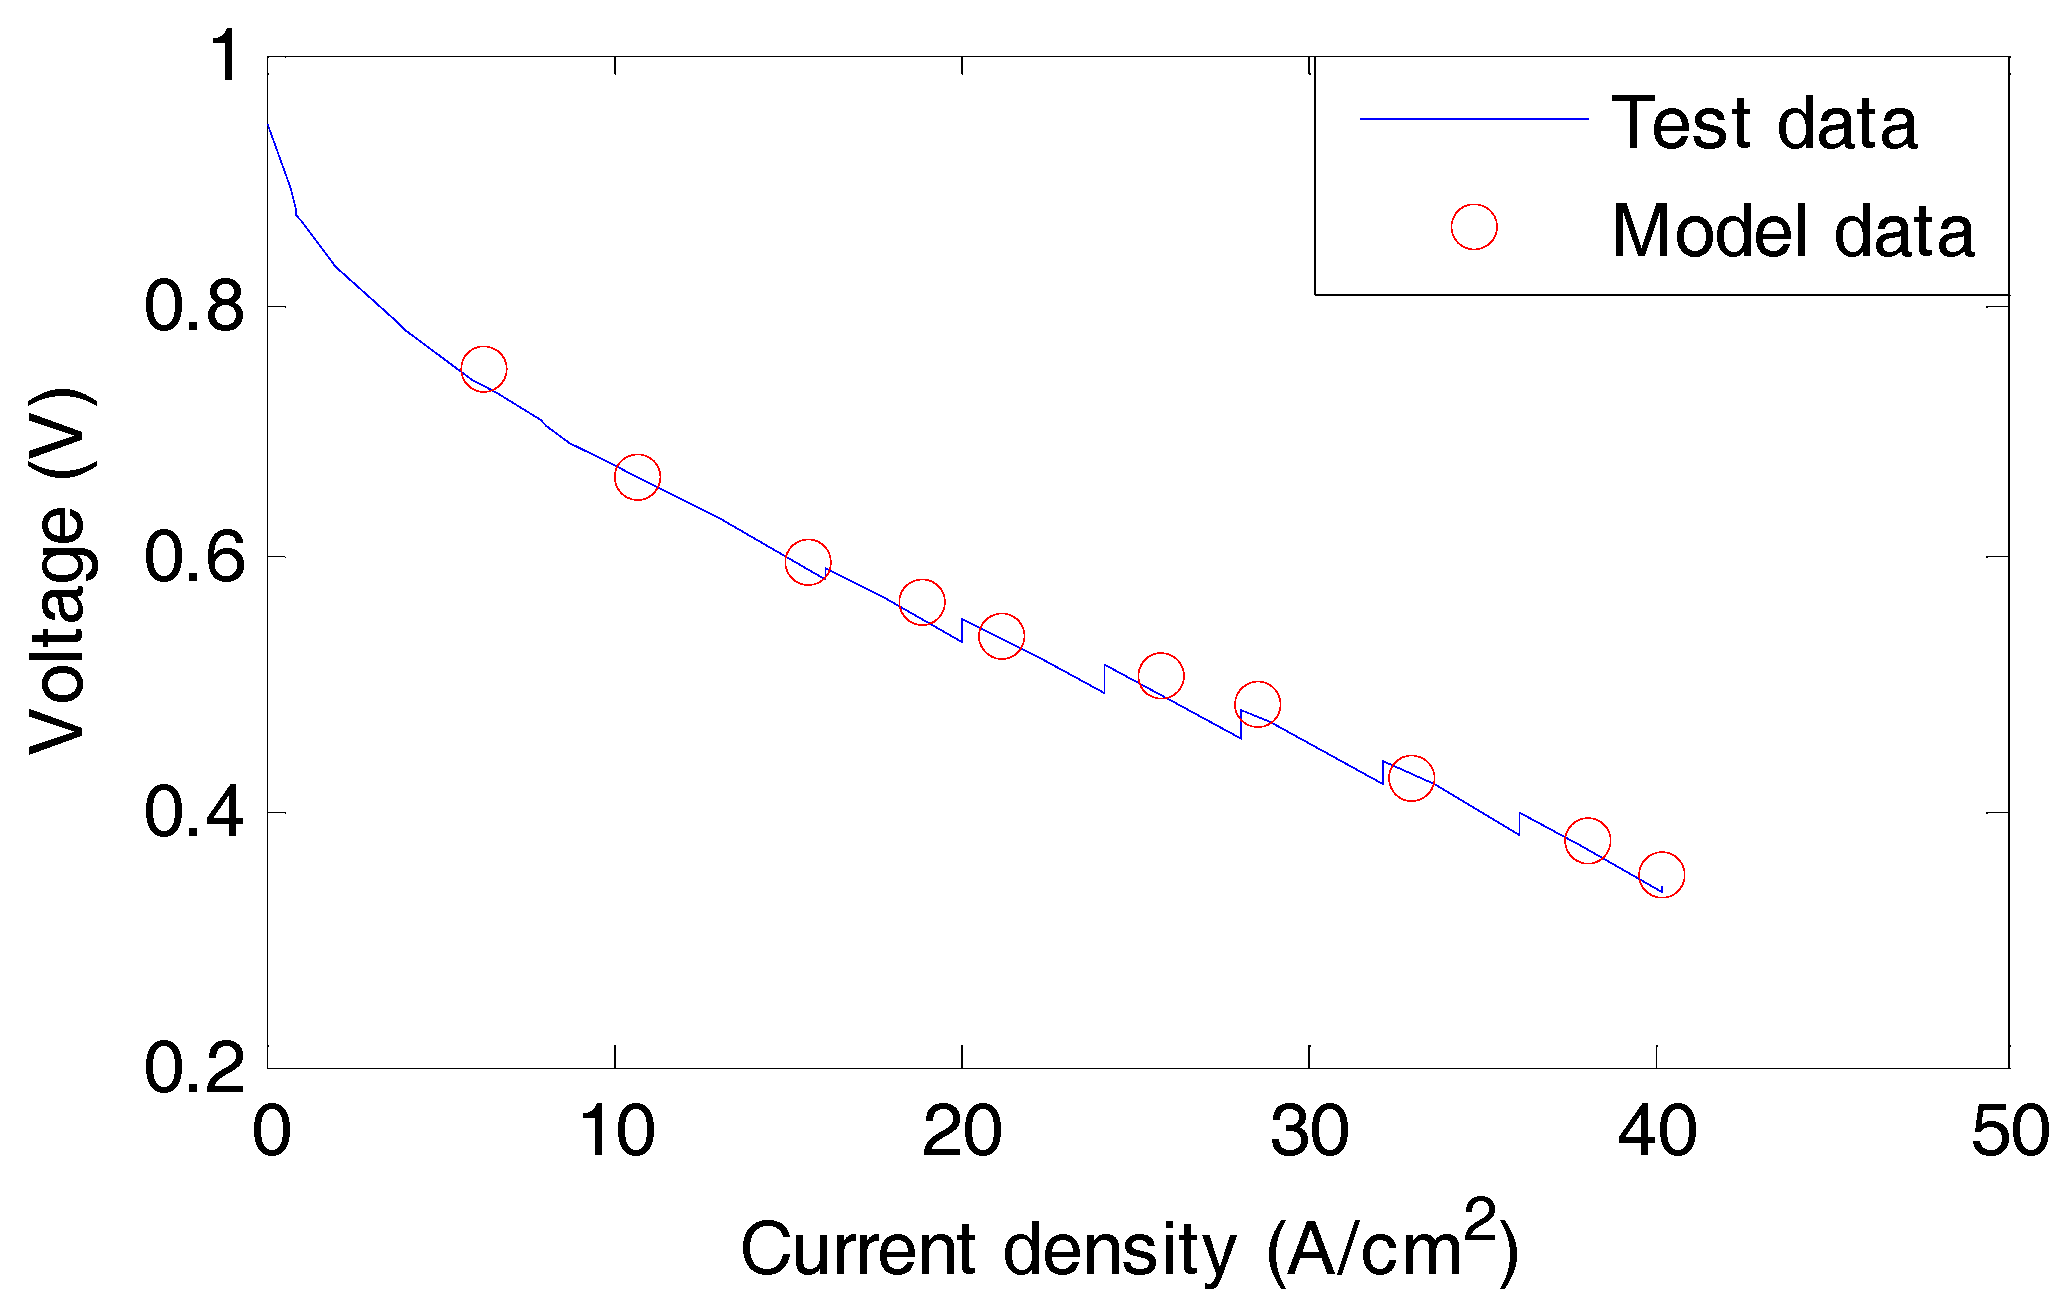
2.1. Development of PEM Fuel Cell Model
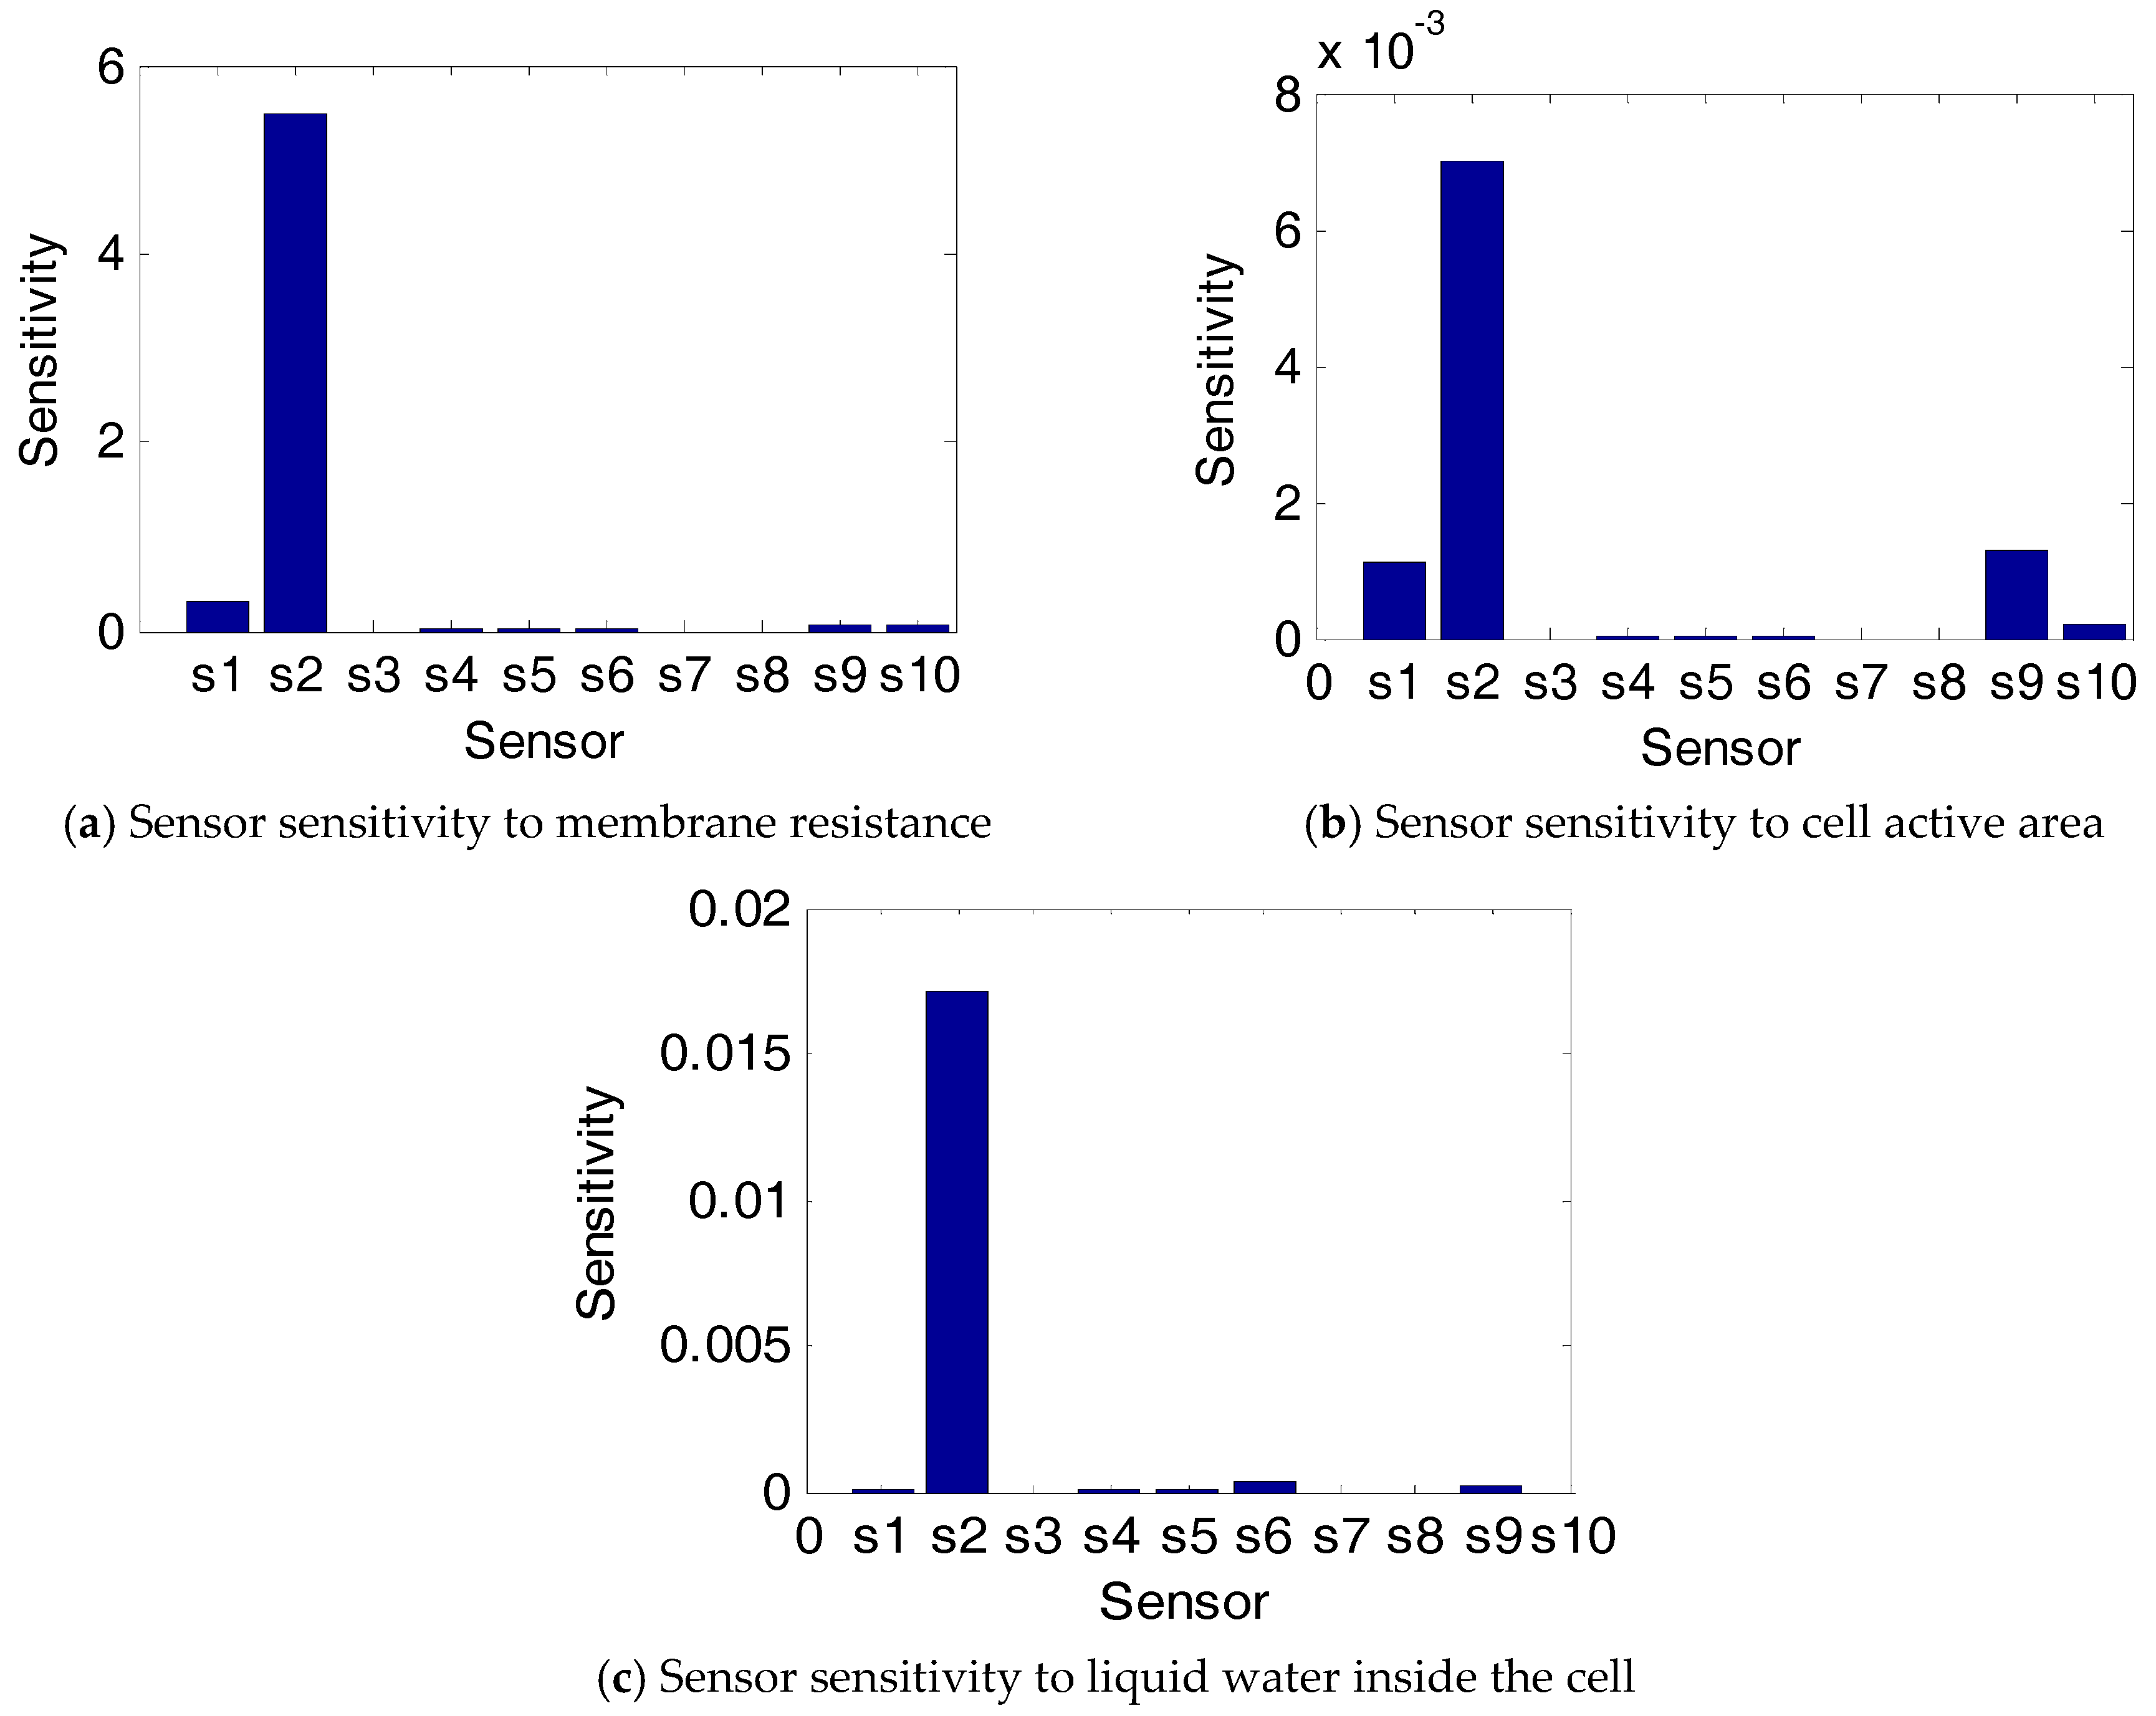
2.2. Generation of Sensitivity Matrix
3. Sensor Selection Algorithm and Its Performance in PEM Fuel Cell Performance Prediction
4. Performance of Selected Sensors in PEM Fuel Cell Fault Diagnosis
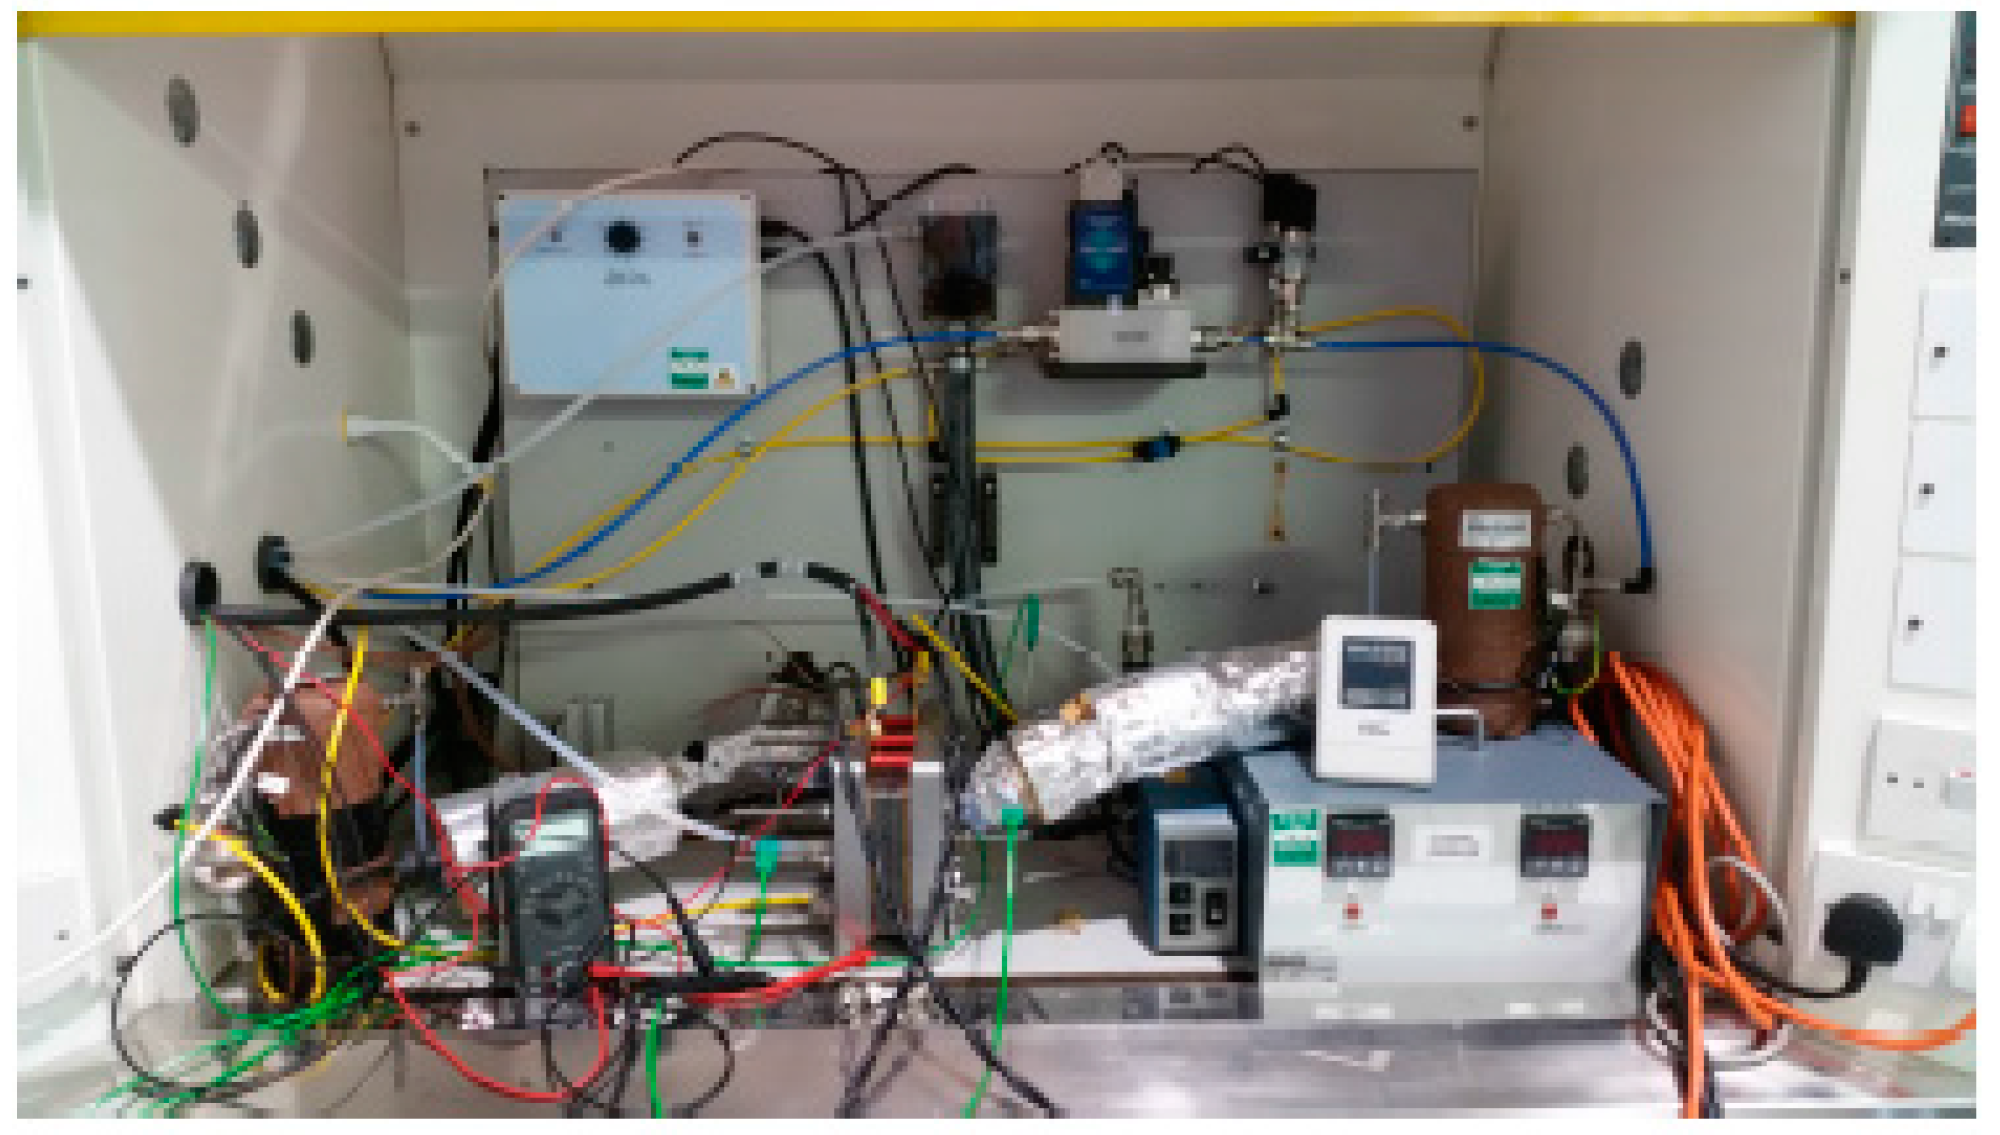
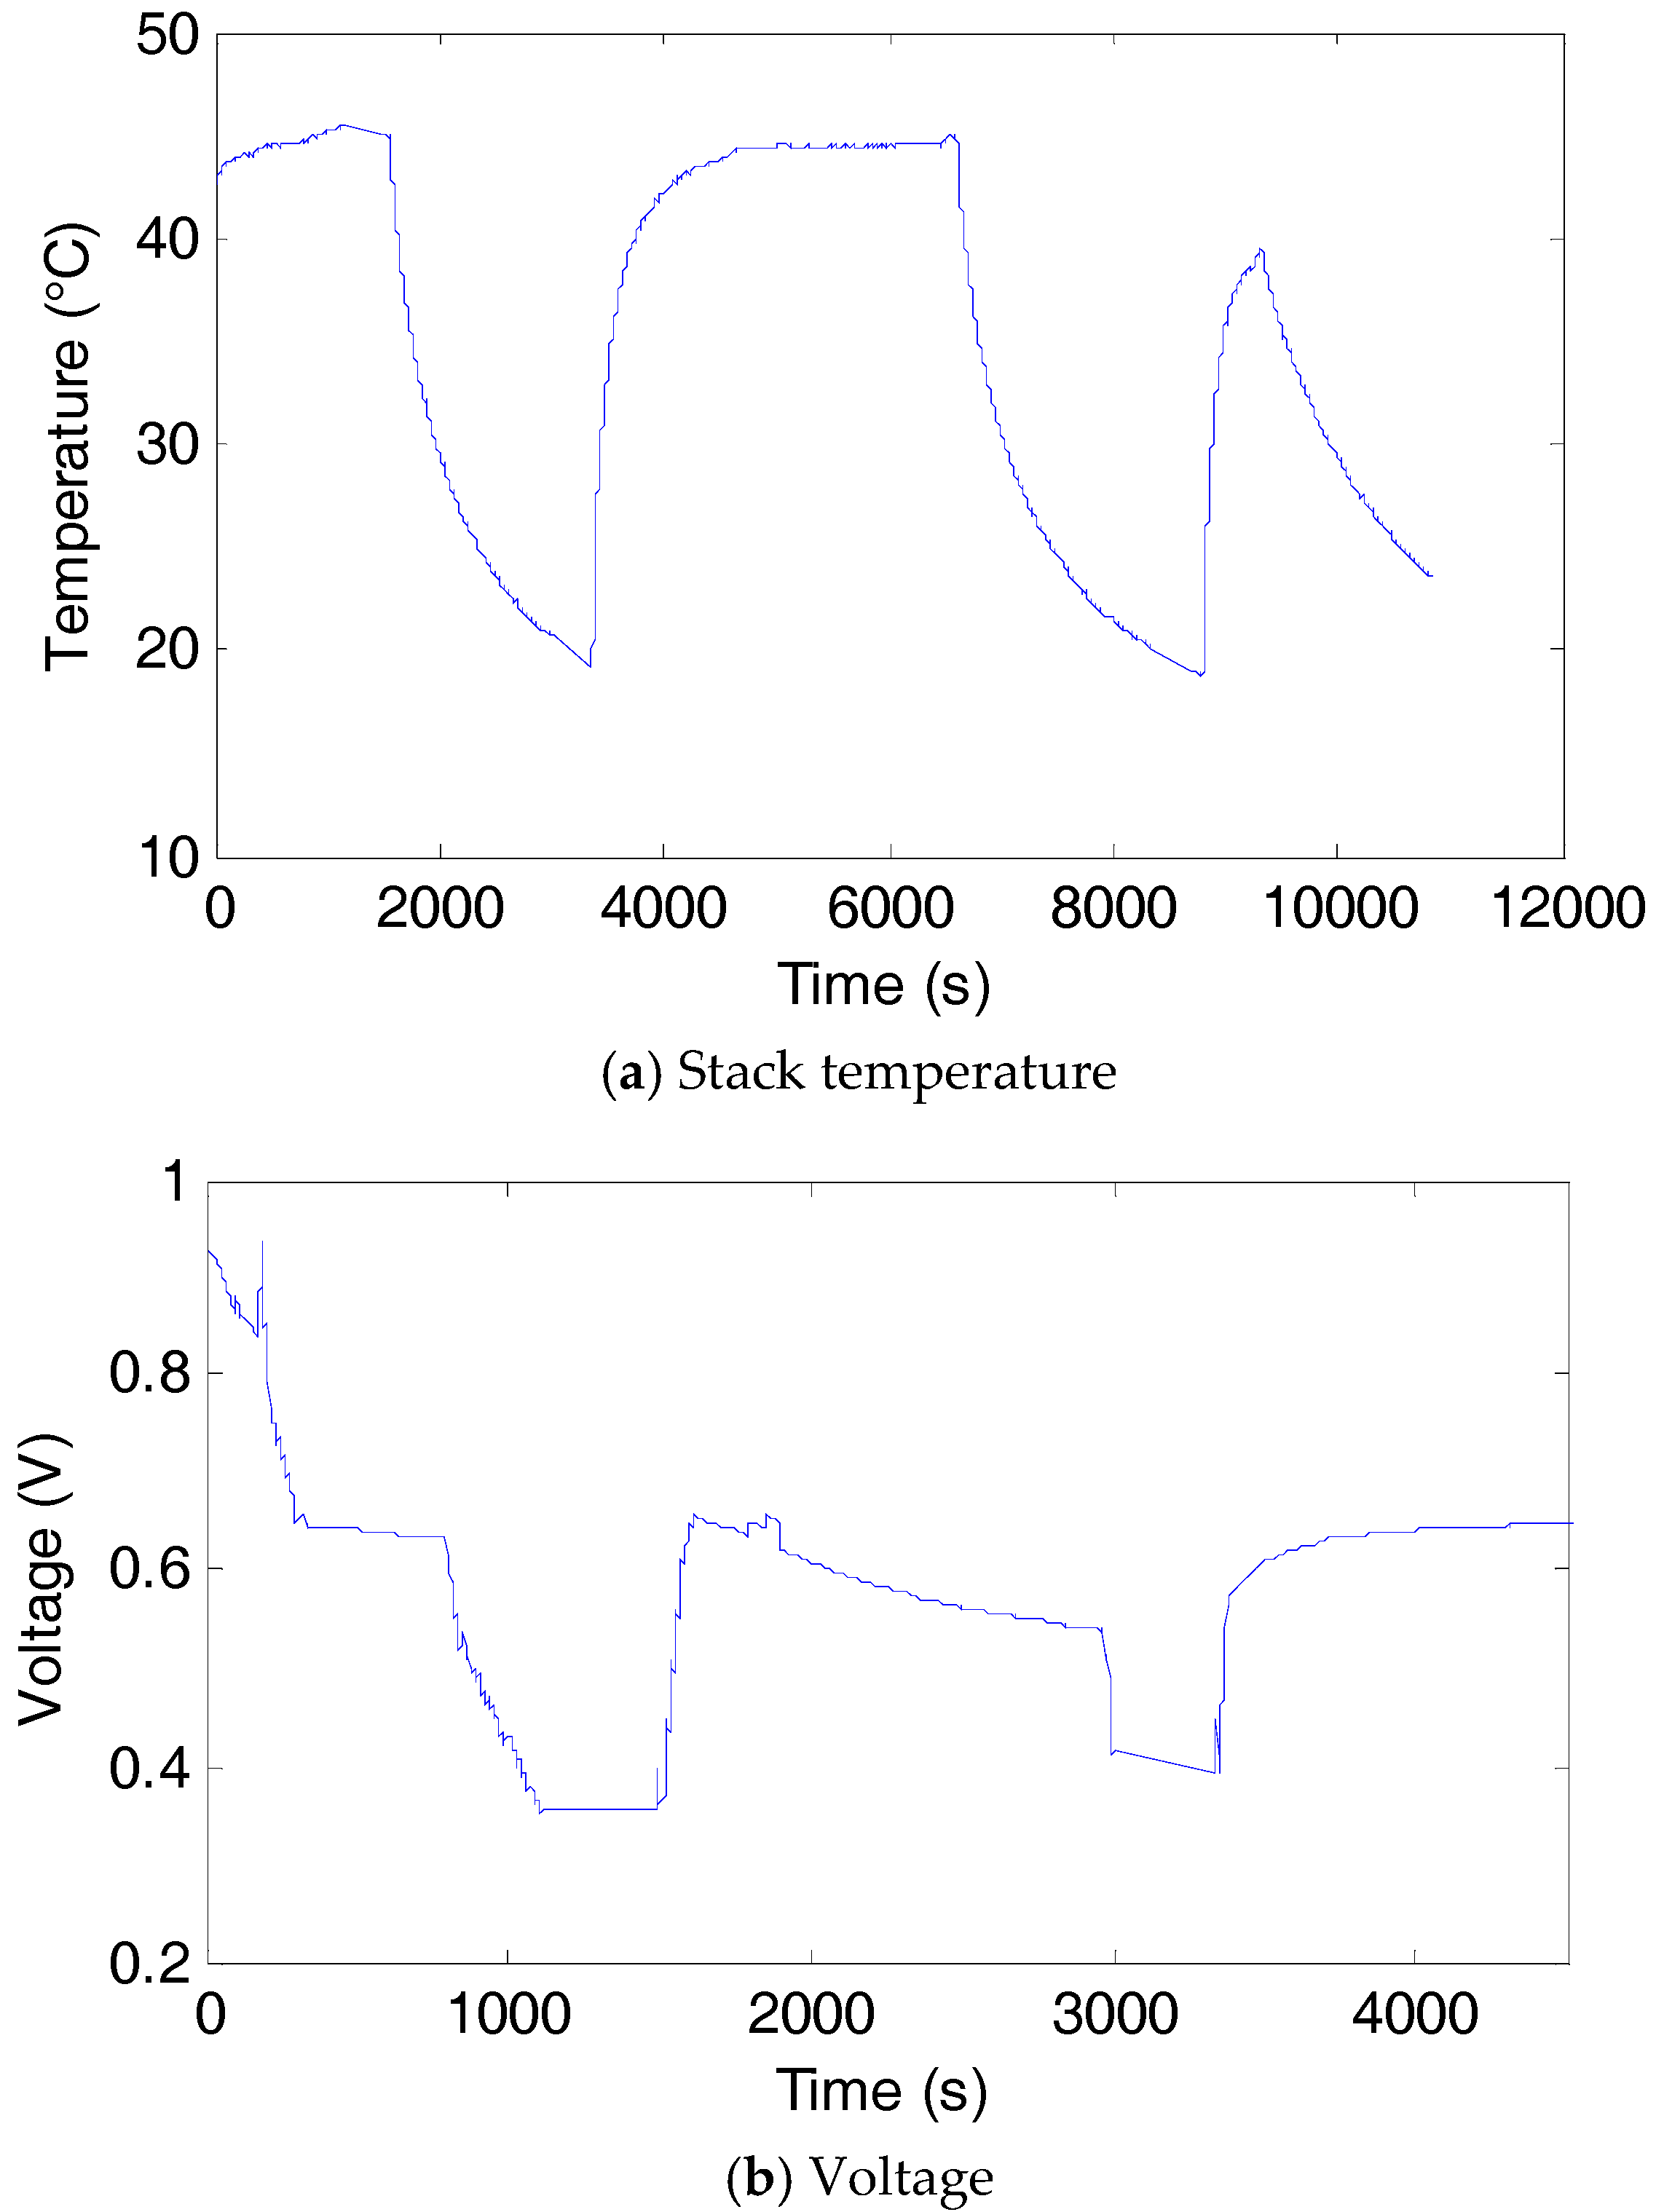
4.1. Description of PEM Fuel Cell Test
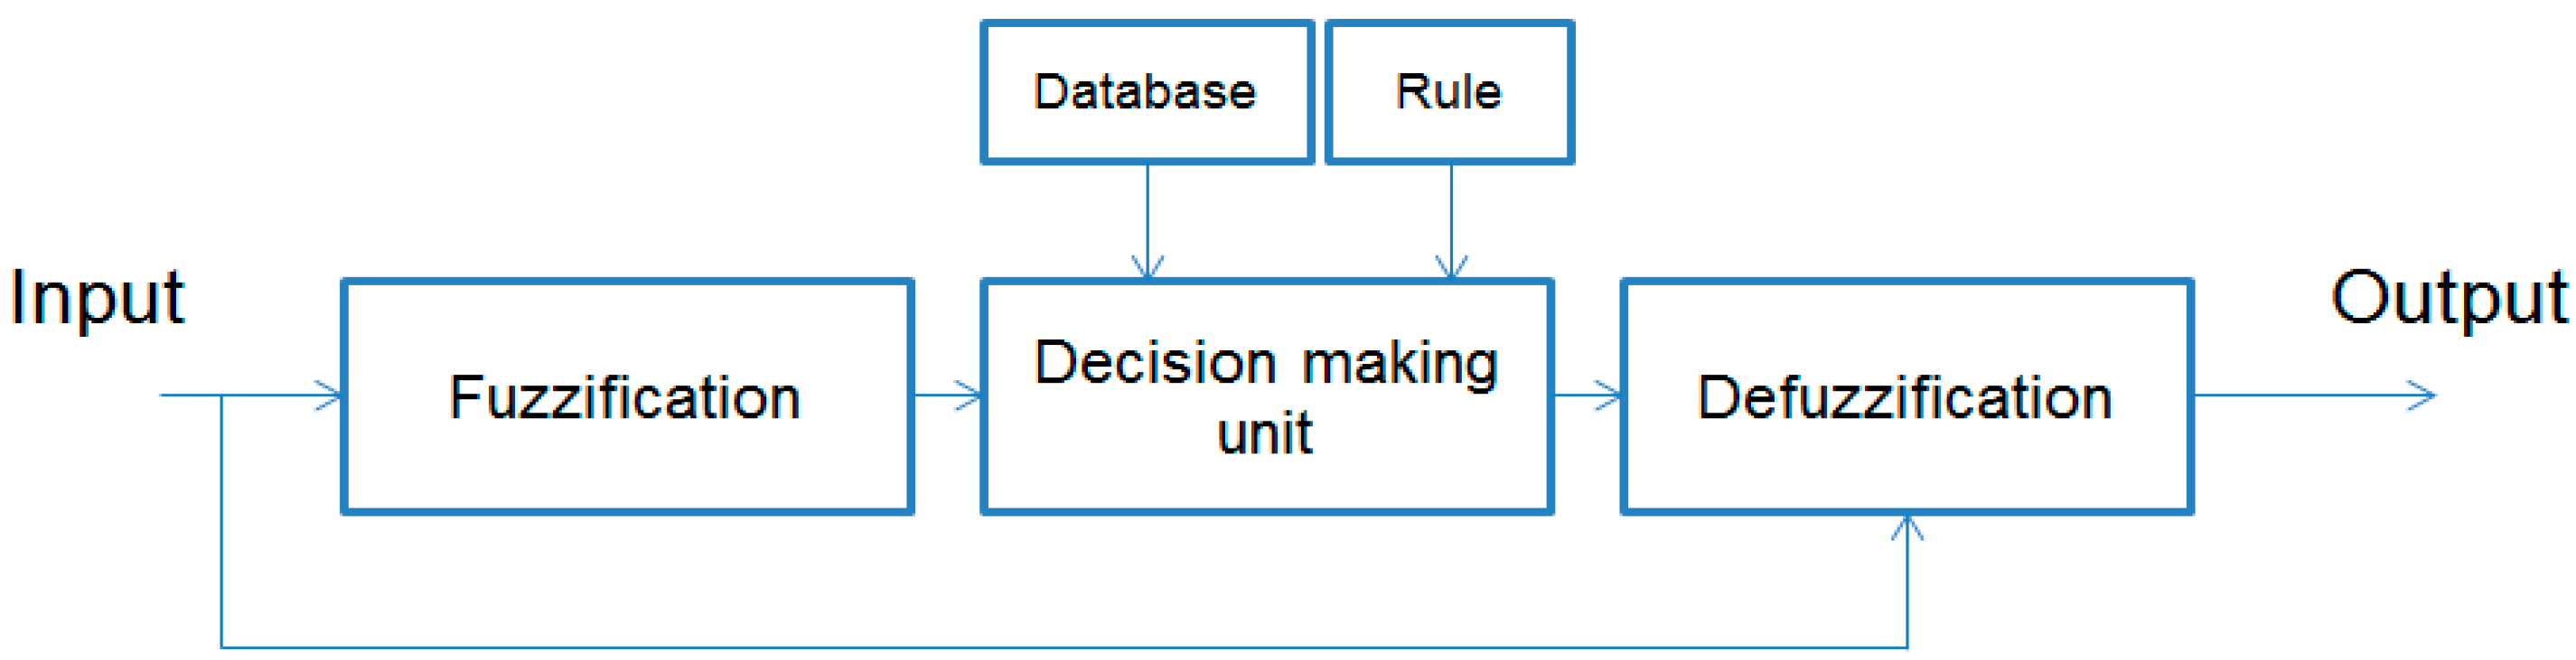
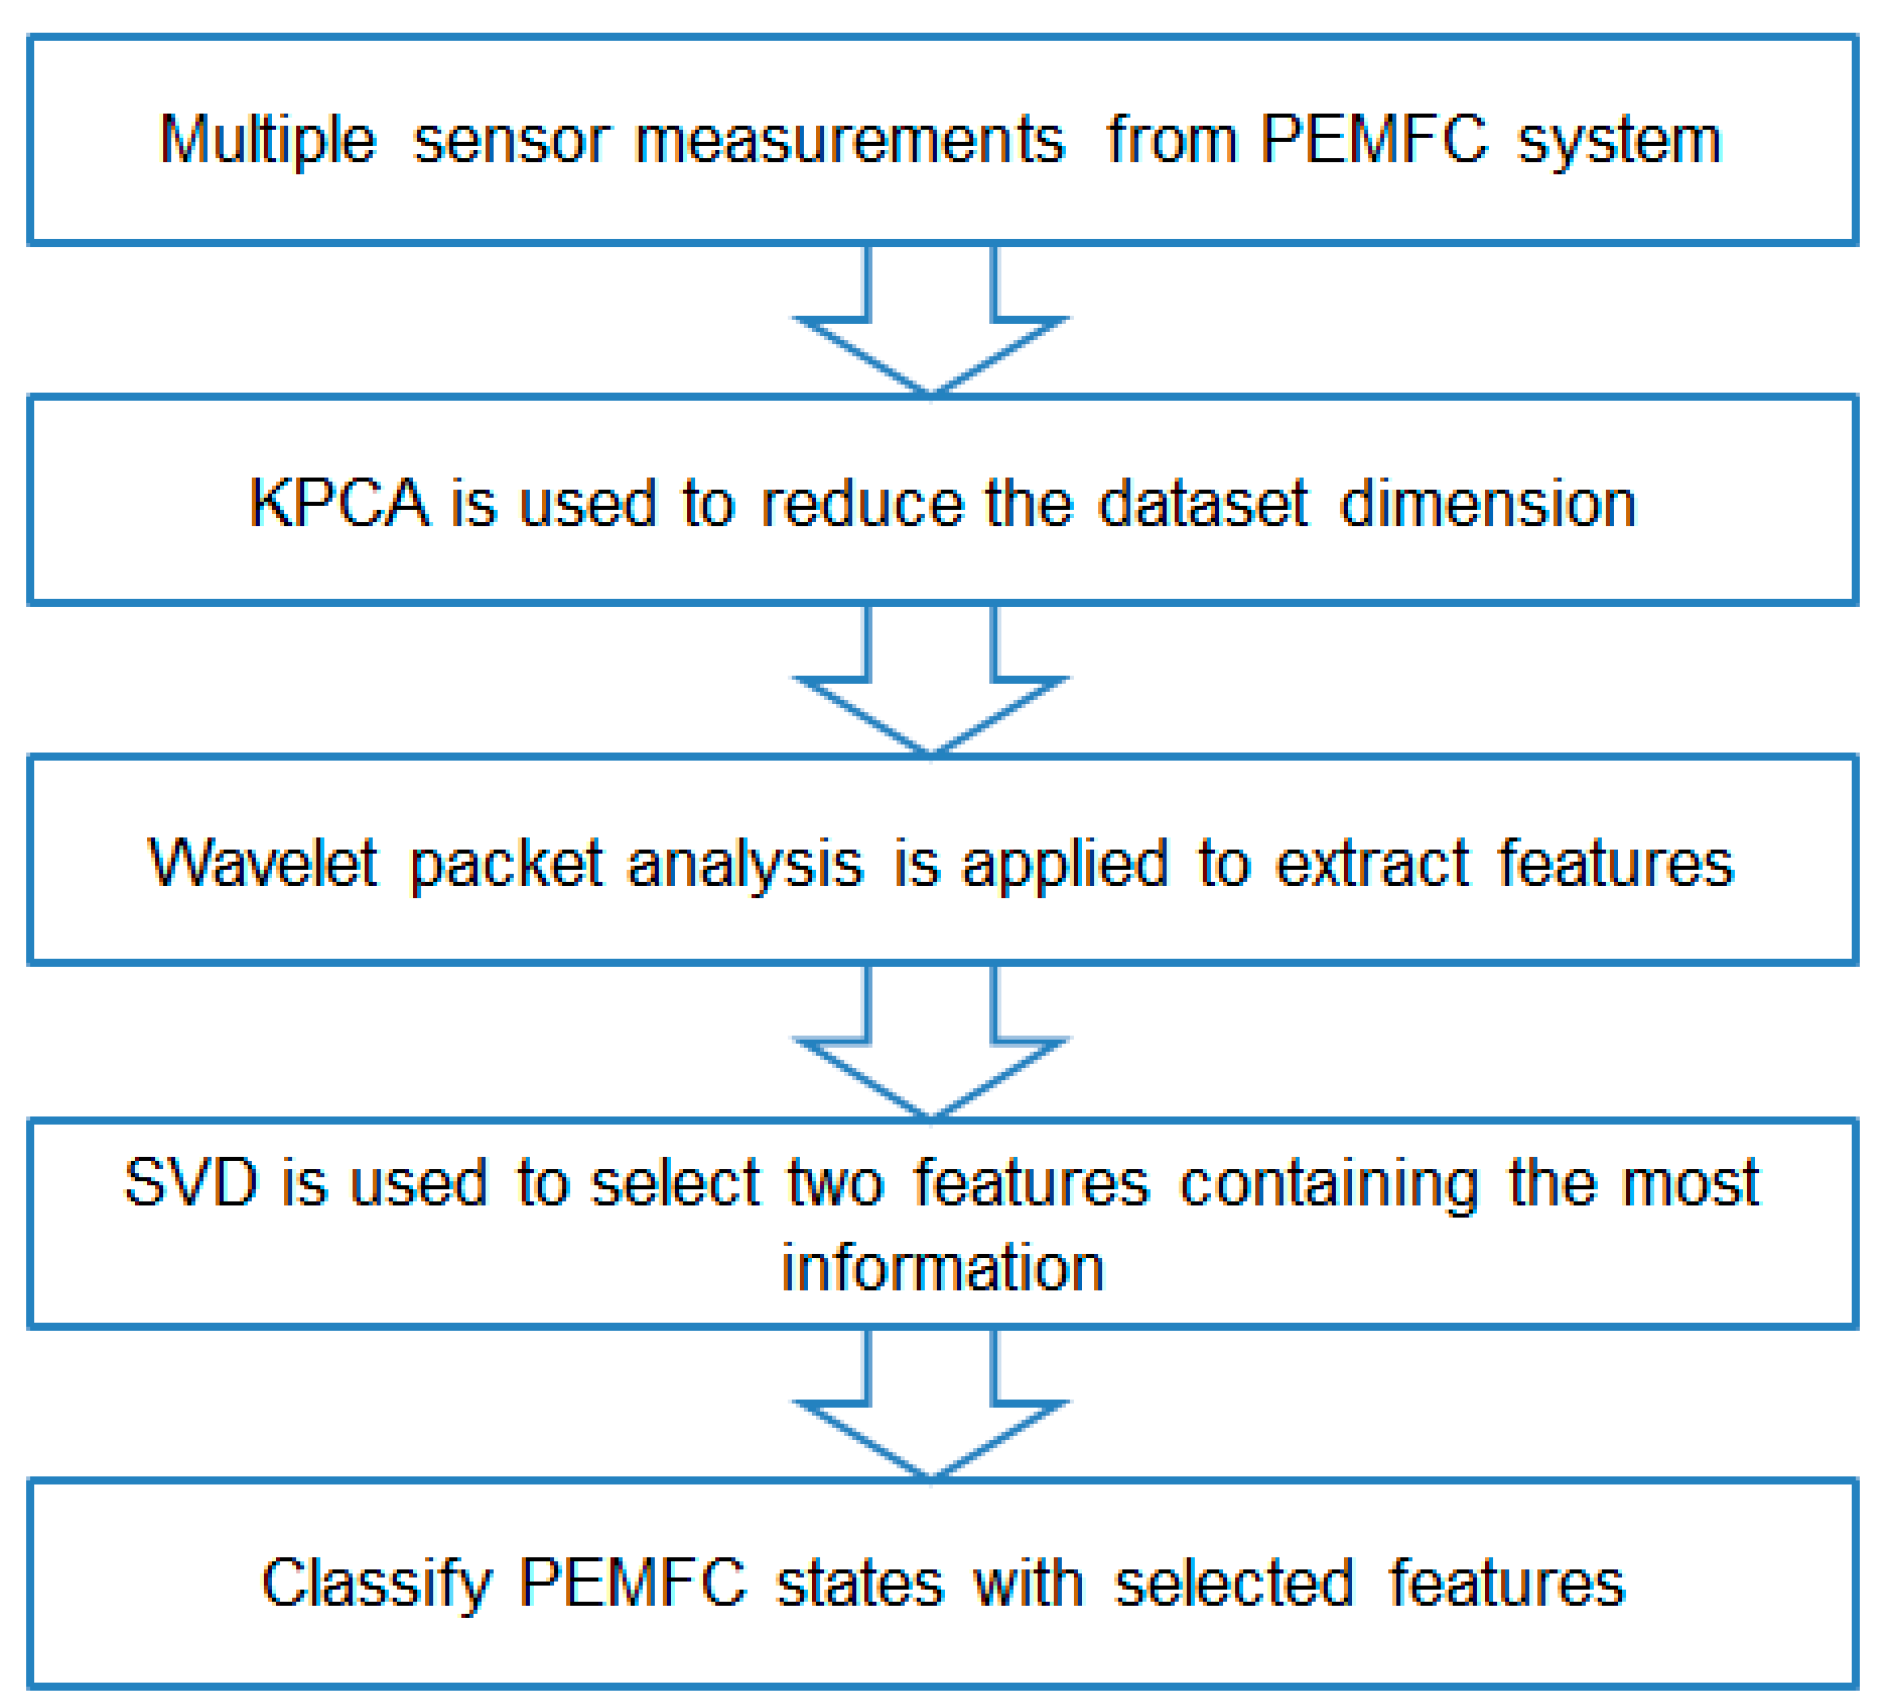
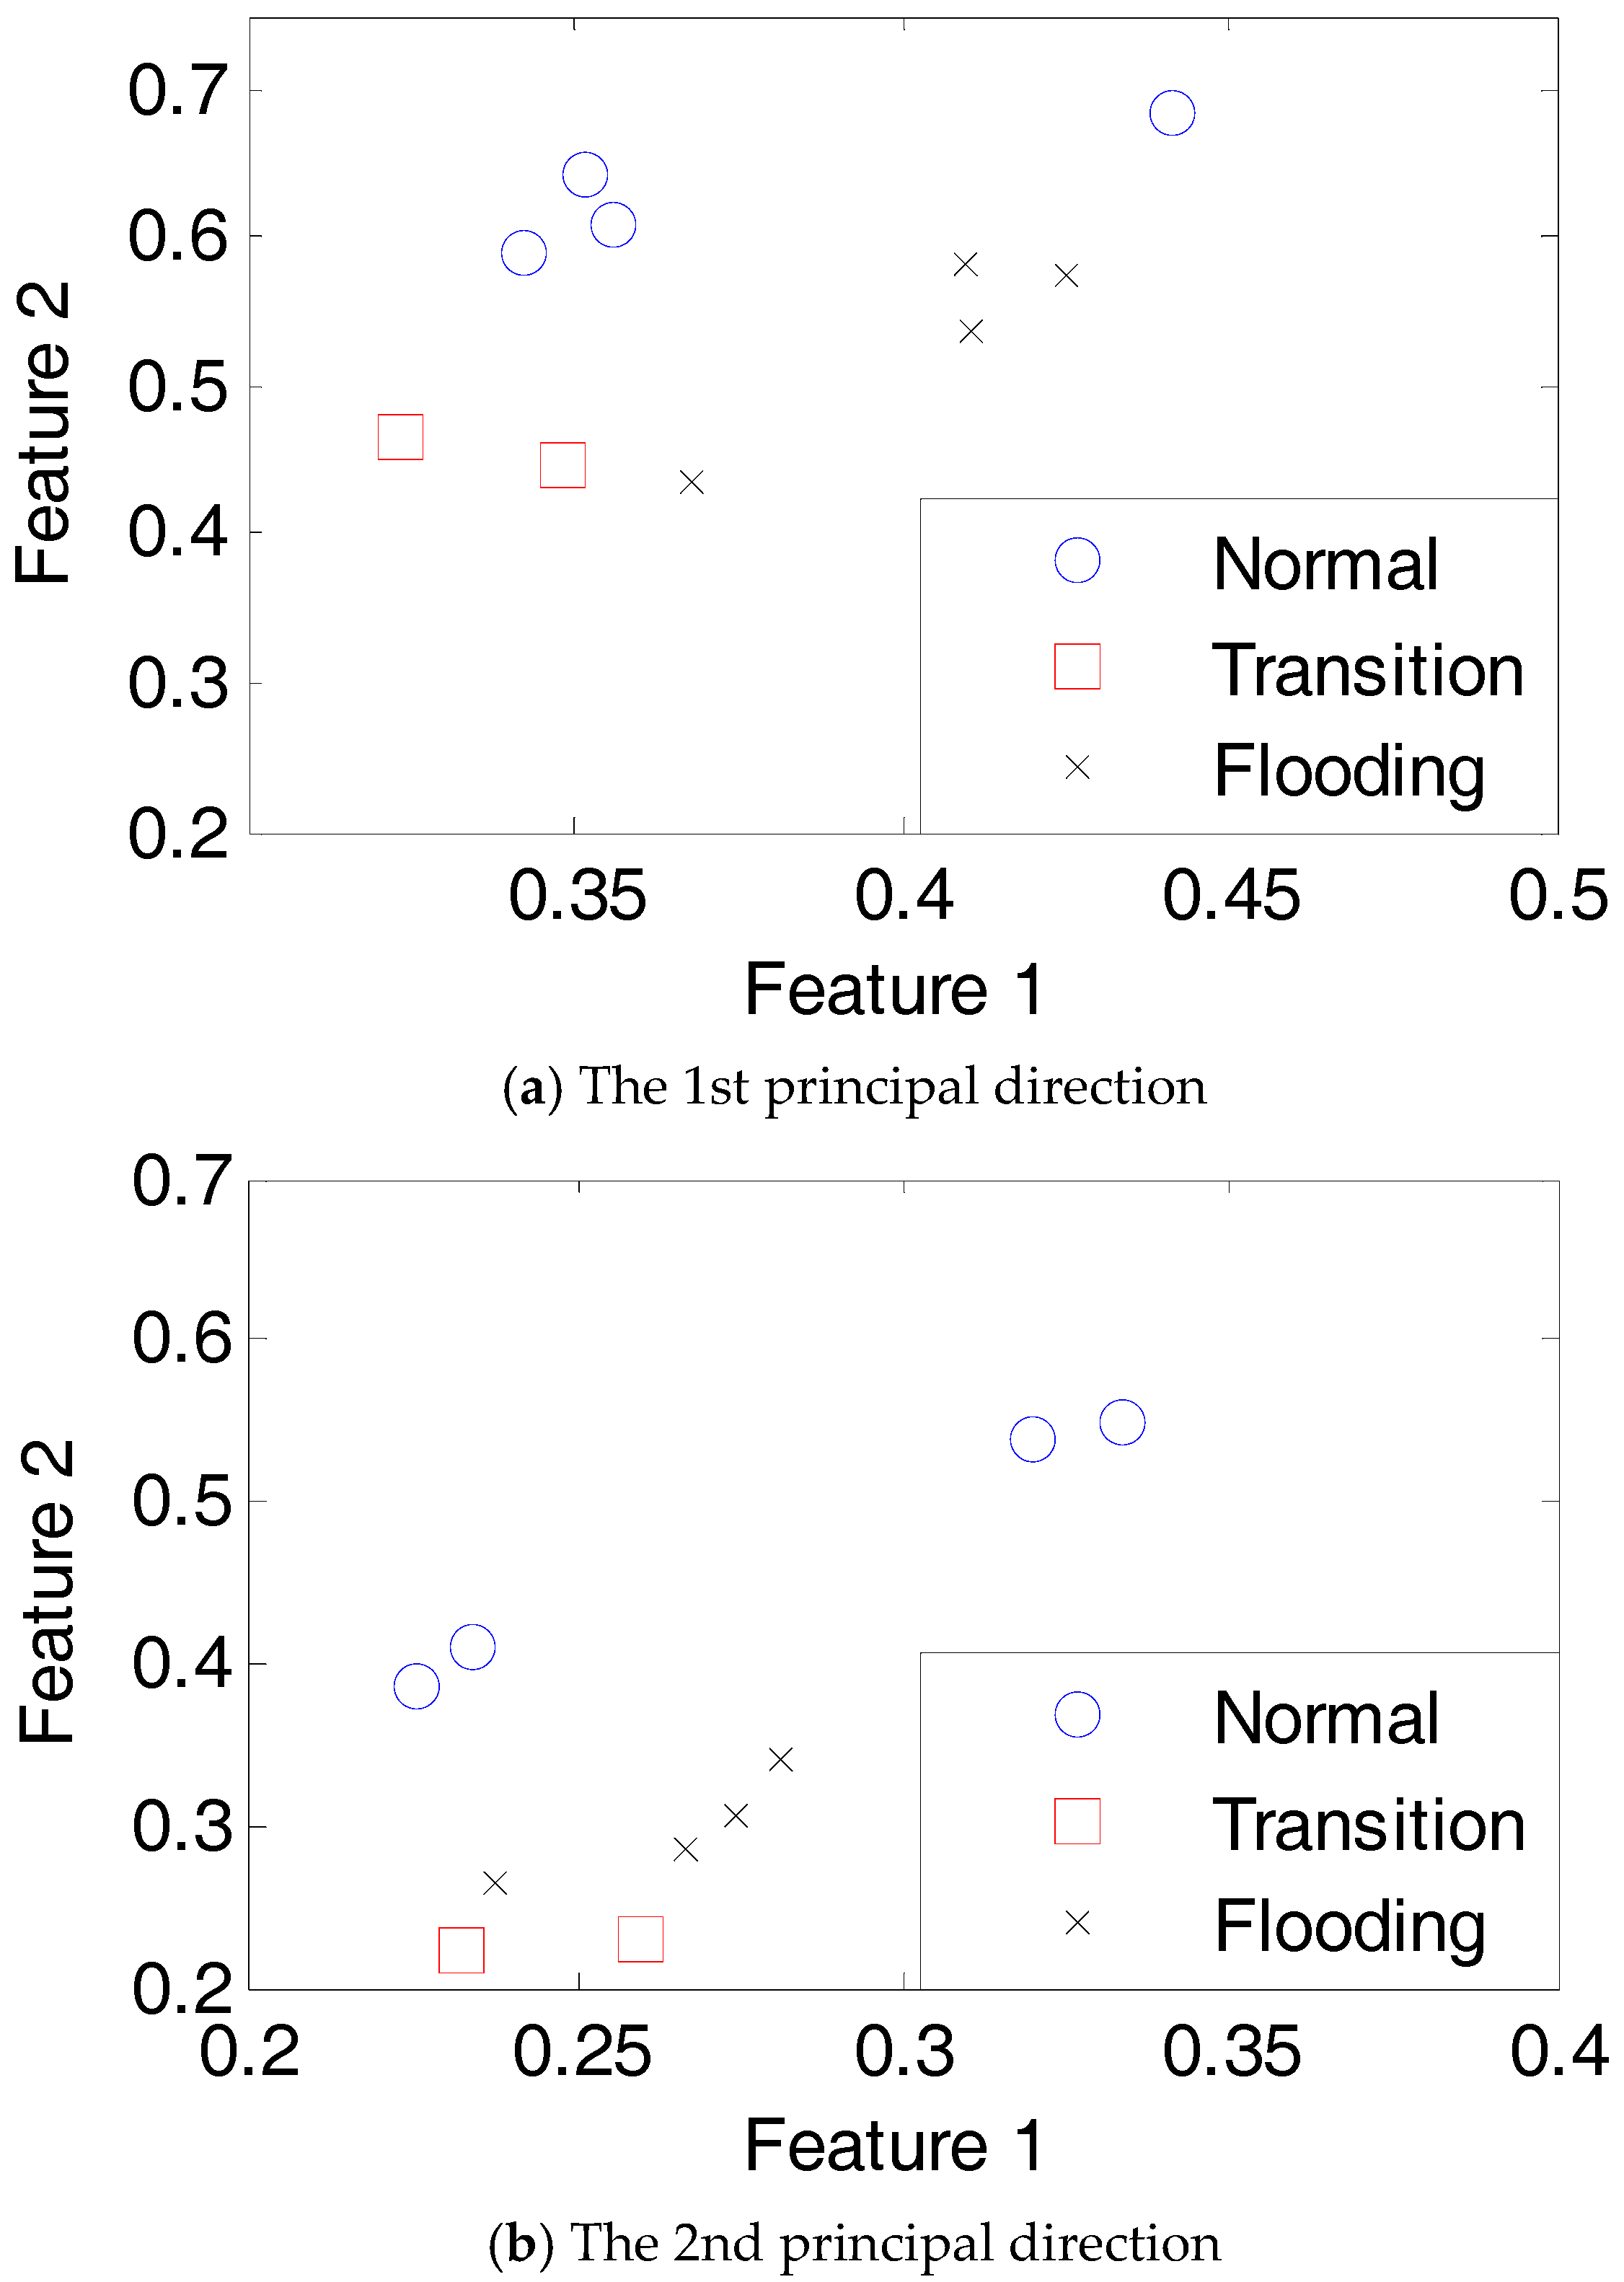
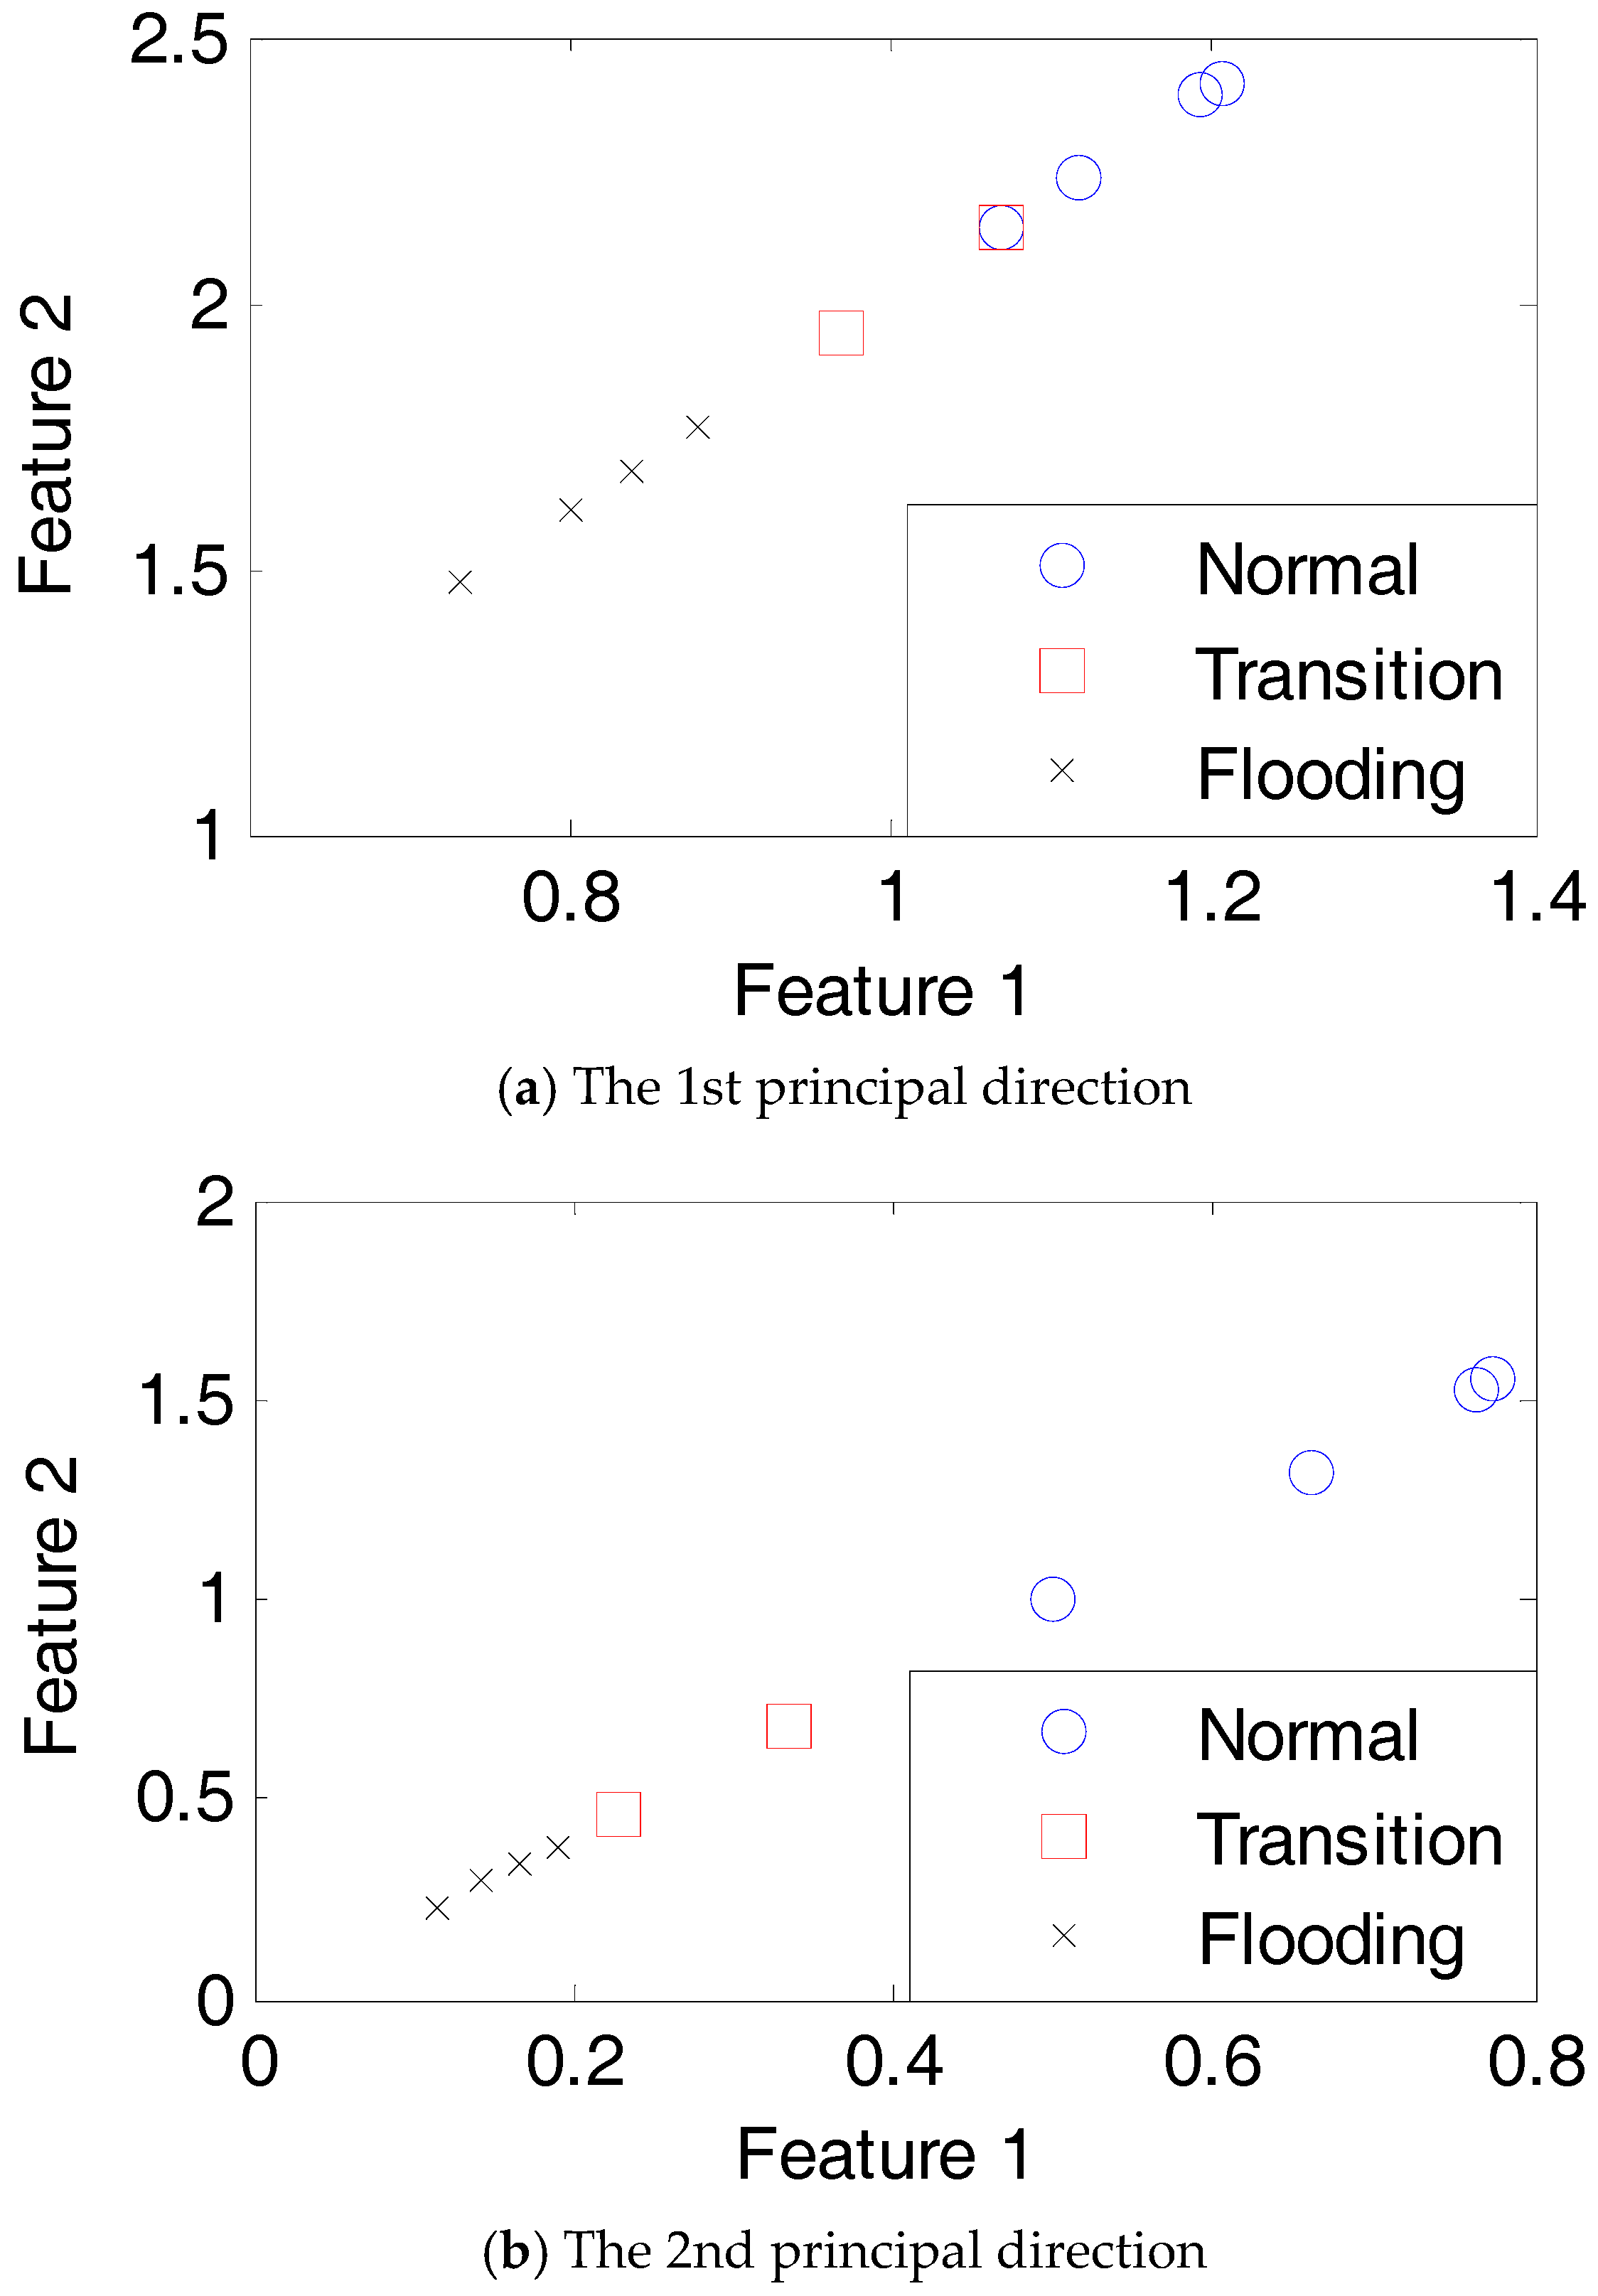
4.2. PEM Fuel Cell Fault Diagnosis
5. Conclusions
Acknowledgments
Author Contributions
Conflicts of Interest
References
- Lebold, M.; Reichard, K.; Boylan, D. Utilizing DCOM in an open system architecture framework for machinery monitoring and diagnostics. In Proceedings of the 2003 IEEE Aerospace Conference, Big Sky, MT, USA, 8–15 March 2003; Volume 3, pp. 1227–1236. [Google Scholar]
- Jouin, M.; Gouriveau, R.; Hissel, D.; Pera, M.C.; Zerhouni, N. Prognostics and health management of PEMFC—State of the art and remaining challenges. Int. J. Hydrog. Energy 2013, 38, 15307–15317. [Google Scholar] [CrossRef]
- Lee, J.; Wu, F.; Zhao, W.; Ghaffari, M.; Liao, L.; Siegel, D. Prognostics and health management design for rotary machinery systems—Review, methodology and applications. Mech. Syst. Signal Process. 2014, 42, 314–334. [Google Scholar] [CrossRef]
- Fouquet, N.; Doulet, C.; Nouillant, C.; Tanguy, G.D.; Bouamama, B.O. Model based PEM fuel cell state-of-health monitoring via ac impedance measurements. J. Power Sources 2006, 159, 905–913. [Google Scholar] [CrossRef]
- Riascos, L.A.M.; Simoes, M.G.; Miyagi, P.E. On-line fault diagnostic system for proton exchange membrane fuel cells. J. Power Sources 2008, 175, 419–429. [Google Scholar] [CrossRef]
- Rubio, M.A.; Urquia, A.; Dormido, S. Diagnosis of performance degradation phenomenon in PEM fuel cells. Int. J. Hydrog. Energy 2010, 35, 2586–2590. [Google Scholar] [CrossRef]
- Zeller, A.; Rallieres, O.; Regnier, J.; Turpin, C. Diagnosis of a hydrogen/air fuel cell by a statistical model-based method. In Proceedings of the Vehicle Power and Propulsion Conference (VPPC), Lille, France, 1–3 September 2010. [Google Scholar]
- Petrone, R.; Zheng, Z.; Hissel, D.; Pera, M.C.; Pianese, C.; Sorrentino, M.; Becherif, M.; Steiner, N.Y. A review on model-based diagnosis methodologies for PEMFCs. Int. J. Hydrog. Energy 2013, 38, 7077–7091. [Google Scholar] [CrossRef]
- Ramschak, E.; Peinecke, V.; Prenninger, P.; Schaffer, T.; Hacker, V. Detection of fuel cell critical status by stack voltage analysis. J. Power Sources 2006, 157, 837–840. [Google Scholar] [CrossRef]
- Placca, L.; Kouta, R.; Candusso, D.; Blachot, J.F.; Charon, W. Analysis of PEM fuel cell experimental data using principle component analysis and multi linear regression. Int. J. Hydrog. Energy 2010, 35, 4582–4591. [Google Scholar] [CrossRef]
- Steiner, N.Y.; Hissel, D.; Mocoteguy, P.; Candusso, D. Non intrusive diagnosis of polymer electrolyte fuel cells by wavelet packet transform. Int. J. Hydrog. Energy 2011, 36, 740–746. [Google Scholar] [CrossRef]
- Taniguchi, A.; Akita, T.; Yasuda, K.; Miyazak, Y. Analysis of electrocatalyst degradation in PEMFC caused by cell reversal during fuel starvation. J. Power Sources 2011, 130, 42–49. [Google Scholar] [CrossRef]
- Zheng, Z.; Petrone, R.; Pera, M.C.; Hissel, D.; Becherif, M.; Steiner, N.Y.; Sorrentino, M. A review on non-model based diagnosis methodologies for PEM fuel cell stacks and systems. Int. J. Hydrog. Energy 2013, 38, 8914–8926. [Google Scholar] [CrossRef]
- Vural, Y.; Ingham, D.B.; Pourkashanian, M. Performance prediction of a proton exchange membrane fuel cell using the ANFIS model. Int. J. Hydrog. Energy 2009, 34, 9181–9187. [Google Scholar] [CrossRef]
- Becker, S.; Karri, V. Predictive models for PEM-electrolyzer performance using adaptive neuro-fuzzy inference systems. Int. J. Hydrog. Energy 2010, 35, 9963–9972. [Google Scholar] [CrossRef]
- Jouin, M.; Gouriveau, R.; Hissel, D.; Pera, M.C.; Zerhouni, N. Prognostics of PEM fuel cell in a particle filtering framework. Int. J. Hydrog. Energy 2013, 39, 481–494. [Google Scholar] [CrossRef]
- Silva, R.E.; Gouriveau, R.; Jemei, S.; Hissel, D.; Boulon, L.; Agbossou, K.; Steiner, N.Y. Proton exchange membrane fuel cell degradation prediction based on adaptive neuro-fuzzy inference systems. Int. J. Hydrog. Energy 2014, 39, 11128–11144. [Google Scholar] [CrossRef]
- Mao, L.; Jackson, L. Selection of optimal sensors for predicting performance of polymer electrolyte membrane fuel cell. J. Power Sources 2016, 328, 151–160. [Google Scholar] [CrossRef]
- Sowers, T.S.; Kopasakis, G.; Simon, D.L. Application of the systematic sensor selection strategy for turbofan engine diagnostics. In Proceedings of the Turbo Expo 2008 Gas Turbine Technical Congress and Exposition, Berlin, Germany, 9–13 June 2008. [Google Scholar]
- Simon, D.L.; Garg, S. A systematic approach to sensor selection for aircraft engine health estimation. In Proceedings of the 19th ISABE conference, Montreal, QC, Canada, 7–11 September 2009. [Google Scholar]
- Yang, S.; Qiu, J.; Liu, G. Sensor optimization selection model based on testability constraint. Chin. J. Aeronaut. 2012, 25, 262–268. [Google Scholar]
- Lyu, K.; Tan, X.; Liu, G.; Zhao, C. Sensor selection of helicopter transmission systems based on physical model and sensitivity analysis. Chin. J. Aeronaut. 2014, 27, 643–654. [Google Scholar] [CrossRef]
- Pukrushpan, J.T. Modeling and Control of Fuel Cell Systems and Fuel Processors. Ph.D. Thesis, The University of Michigan, Ann Arbor, MI, USA, 2003. [Google Scholar]
- Khan, M.J.; Lqbal, M.T. Modelling and analysis of electro-chemical, thermal, and reactant flow dynamics for a PEM fuel cell system. Fuel Cells 2005, 5, 463–475. [Google Scholar] [CrossRef]
- Rod, B.; Jeremy, M.; Bryan, P.; Yu, S.K.; Rangachary, M.; Nancy, G.; Deborah, M.; Mahlon, W.; Fernando, G.; David, W.; et al. Scientific aspects of polymer electrolyte fuel cell durability and degradation. Chem. Rev. 2007, 107, 3904–3951. [Google Scholar]
- Rama, P.; Chen, R.; Andrews, J. A review of performance degradation and failure modes for hydrogen-fuelled polymer electrolyte fuel cells. Proc. Inst. Mech. Eng. Part A J. Power Energy 2008, 222, 421–441. [Google Scholar] [CrossRef]
- Wu, J.; Yuan, X.Z.; Martin, J.J.; Wang, H.; Zhang, J.; Shen, J.; Wu, S.; Merida, W. A review of PEM fuel cell durability: Degradation mechanisms and mitigation strategies. J. Power Sources 2008, 184, 104–119. [Google Scholar] [CrossRef]
- FCLAB Research. IEEE PHM Data Challenge 2014. Available online: http://eng.fclab.fr/ieee-phm-2014-data-challenge/ (accessed on 6 July 2014).
- Canut, J.M.L.; Abouatallah, R.M.; Harrington, D.A. Detection of membrane drying, fuel cell flooding, and anode catalyst poisoning on PEMFC stacks by electrochemical impedance spectroscopy. J. Electrochem. Soc. 2006, 153, 857–864. [Google Scholar] [CrossRef]
- Wu, Y.; Zhang, D.; Song, F.; Yang, J.Y.; Jing, Z.; Li, M. A method for speeding up feature extraction based on KPCA. Neurocomputing 2007, 70, 1056–1061. [Google Scholar]
- Mao, L.; Jackson, L.; Dunnett, S.J. Fault diagnosis of practical polymer electrolyte membrane (PEM) fuel cell system with data-driven approaches. Fuel Cells 2017, 17, 247–258. [Google Scholar] [CrossRef]


| Parameter (Unit) | Value |
|---|---|
| Number of fuel cells | 54 |
| Active electrode area of single cell () | 46.5 |
| Hydrogen flow rate stoichiometry | 1.15 |
| Air flow rate stoichiometry | 2.0 |
| Number | Sensor |
|---|---|
| s1 | Cell voltage (V) |
| s2 | Stack temperature (K) |
| s3 | Anode inlet flow (kg/s) |
| s4 | Cathode inlet flow (kg/s) |
| s5 | Anode outlet flow (kg/s) |
| s6 | Cathode outlet flow (kg/s) |
| s7 | Compressor temperature (K) |
| s8 | Coolant inlet flow (kg/s) |
| s9 | Inlet water temperature (K) |
| s10 | Outlet water temperature (K) |
| Size of Sensor Set | Sensor Set with the Best Noise Resistance Capability |
|---|---|
| 1 | Stack temperature |
| 2 | Stack temperature, cathode outlet flow |
| 3 | Stack temperature, cathode outlet flow, cathode inlet flow |
| 4 | Stack temperature, cathode outlet flow, cathode inlet flow, water inlet temperature |
| 5 | Stack temperature, cathode outlet flow, cathode inlet flow, water inlet temperature, water outlet temperature |
| 6 | Stack temperature, cathode outlet flow, cathode inlet flow, water inlet temperature, water outlet temperature, anode outlet flow |
| Parameter | Value |
|---|---|
| Membrane thickness () | 25 |
| Active area () | 100 |
| Platinum loading () | 0.2 |
| Gas diffusion thickness () | 415 |
| Sensor | Sensor |
|---|---|
| Voltage | Anode inlet flow |
| Anode outlet pressure | Cathode outlet pressure |
| Cathode inlet flow | Anode inlet pressure |
| Anode relative humidity | Cathode relative humidity |
| Cathode inlet pressure | Stack temperature |
© 2017 by the authors. Licensee MDPI, Basel, Switzerland. This article is an open access article distributed under the terms and conditions of the Creative Commons Attribution (CC BY) license (http://creativecommons.org/licenses/by/4.0/).
Share and Cite
Mao, L.; Davies, B.; Jackson, L. Application of the Sensor Selection Approach in Polymer Electrolyte Membrane Fuel Cell Prognostics and Health Management. Energies 2017, 10, 1511. https://doi.org/10.3390/en10101511
Mao L, Davies B, Jackson L. Application of the Sensor Selection Approach in Polymer Electrolyte Membrane Fuel Cell Prognostics and Health Management. Energies. 2017; 10(10):1511. https://doi.org/10.3390/en10101511
Chicago/Turabian StyleMao, Lei, Ben Davies, and Lisa Jackson. 2017. "Application of the Sensor Selection Approach in Polymer Electrolyte Membrane Fuel Cell Prognostics and Health Management" Energies 10, no. 10: 1511. https://doi.org/10.3390/en10101511
APA StyleMao, L., Davies, B., & Jackson, L. (2017). Application of the Sensor Selection Approach in Polymer Electrolyte Membrane Fuel Cell Prognostics and Health Management. Energies, 10(10), 1511. https://doi.org/10.3390/en10101511