

Solid Waste Characterization and Management in a Highly Vulnerable Tropical City


Abstract
:1. Introduction
- (i).
- How much and what solid waste is generated in the vulnerable tropical city, Puerto Carreño?
- (ii).
- What are the key waste-management issues?
- (iii).
- What are the realistic waste-management recommendations considering the local context?
2. Methodology
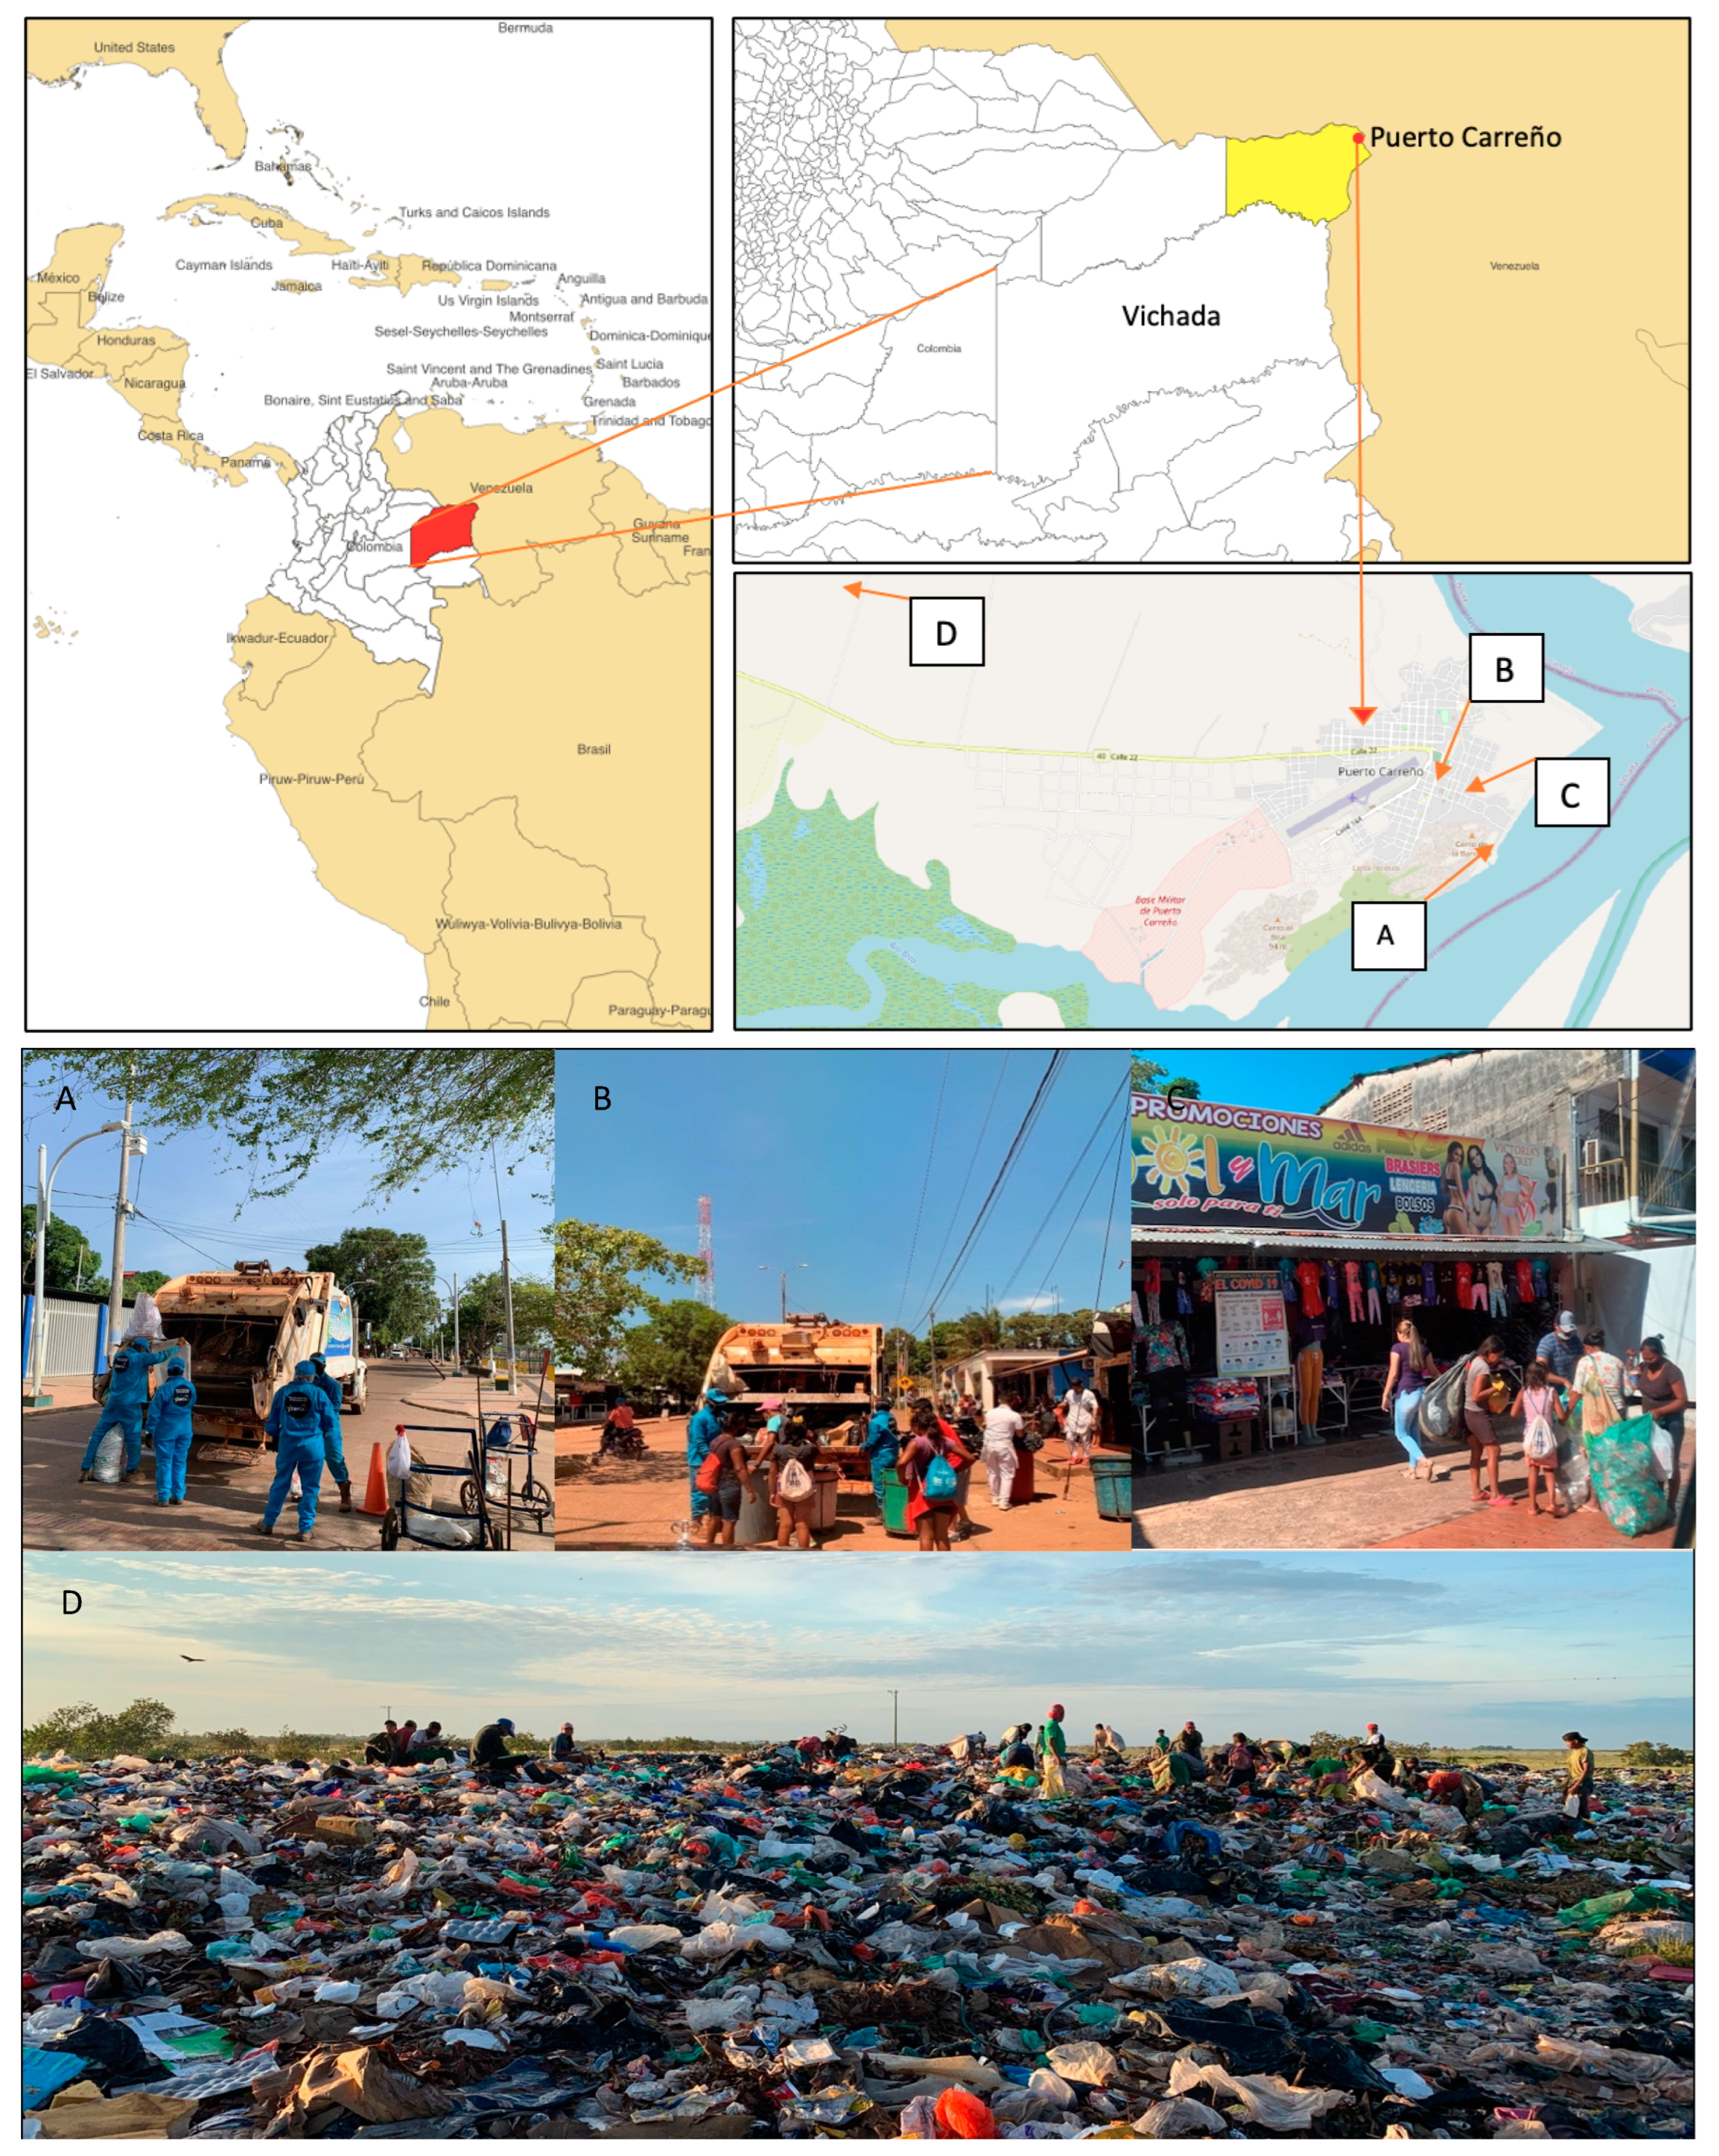
2.1. Study Area
2.2. Current Situation in Puerto Carreño, Vichada, Colombia
2.3. Characterization of Solid Waste
2.4. Estimated Solid Waste Production
3. Results and Discussion
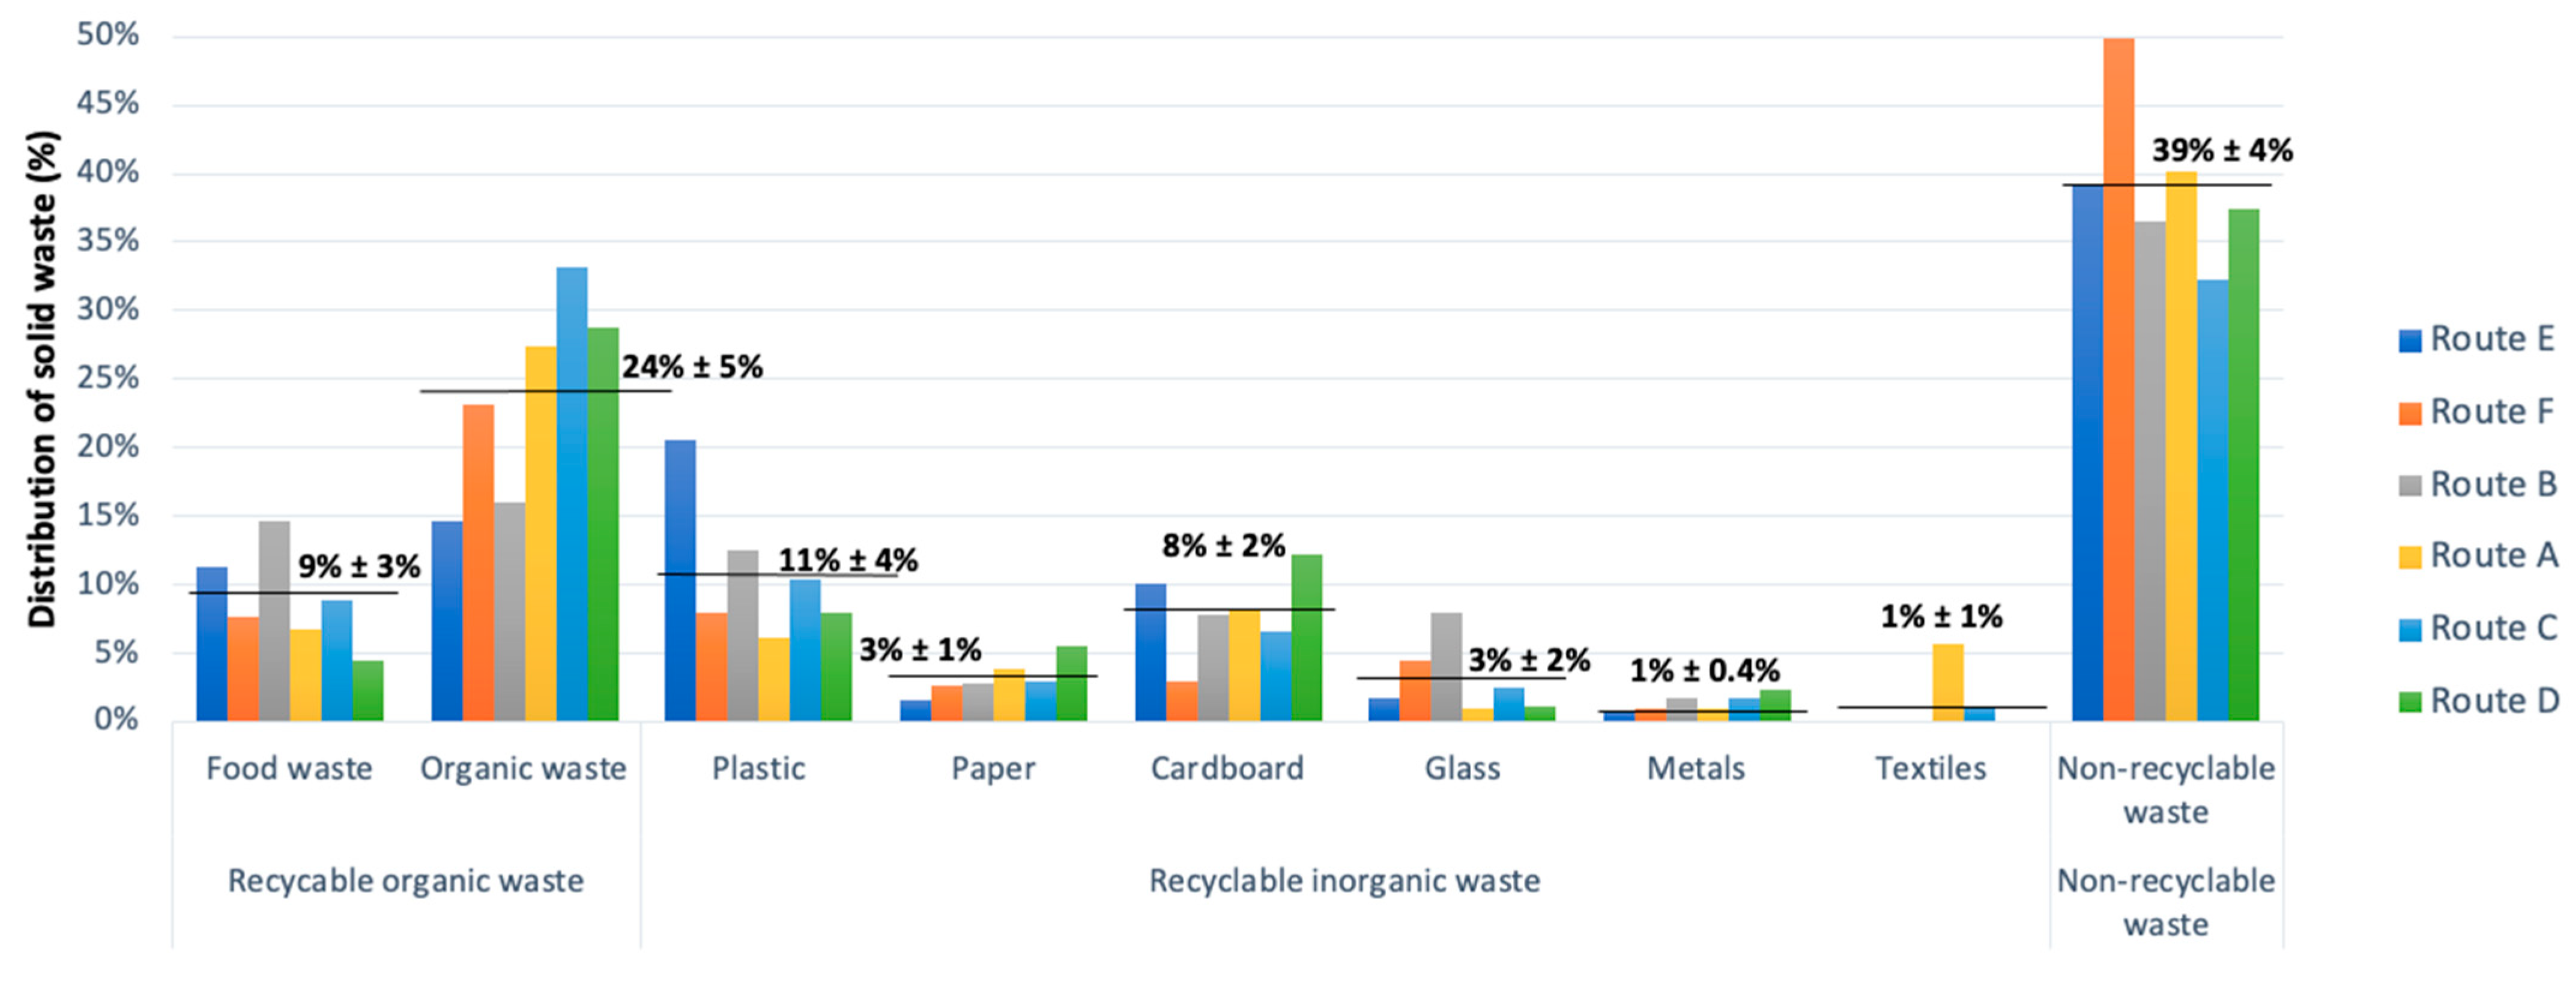
3.1. Characterization of Solid Waste
3.2. Estimated Solid Waste Production
3.3. Discussion
4. Conclusions
Supplementary Materials
Author Contributions
Funding
Institutional Review Board Statement
Informed Consent Statement
Data Availability Statement
Acknowledgments
Conflicts of Interest
References
- Beigl, P.; Lebersorger, S.; Salhofer, S. Modelling municipal solid waste generation: A review. Waste Manag. 2008, 28, 200–2148. [Google Scholar] [CrossRef] [PubMed]
- Kaza, S.; Yao, L.; Bhada-Tata, P.; Van Woerden, F. What a Waste 2.0: A Global Snapshot of Solid Waste Management to 2050; Urban Development Series; World Bank: Washington, DC, USA, 2018. [Google Scholar]
- DANE. Economía Circular: Cuarto Reporte 2021; DANE: Bogotá, Colombia, 2021. [Google Scholar]
- Statista. 2020. Available online: https://www.statista.com/statistics/1052439/rate-of-msw-recycling-worldwide-by-key-country/ (accessed on 27 April 2022).
- CONPES. Documento CONPES 3874: Política Nacional Para la Gestión Integral de Residuos Sólidos; DNP: Bogotá, Colombia, 2016. [Google Scholar]
- Wilson, D.C. Development drivers for waste management. Waste Manag. Res. 2007, 25, 198–207. [Google Scholar] [CrossRef] [PubMed]
- Contraloría General de la República. Informe Sobre el Estado de Los Recursos Naturales y del Ambiente 2020–2021; Contraloría General de la República: Bogotá, Colombia, 2021. [Google Scholar]
- MVCT. Decreto 1077 de 2015; Ministerio de Vivienda, Ciudad y Territorio: Bogotá, Colombia, 2015. [Google Scholar]
- Contraloría General de la República. Auditoría de desempeño al Ministerio de Ambiente y Desarrollo Sostenible-MADS y Autoridades Ambientales en desarrollo de la Política para la Gestión Integral de Residuos Sólidos; Contraloría General de la República: Bogotá, Colombia, 2018. [Google Scholar]
- SSPD. Informe de Disposición Final de Residuos Sólidos-2018; SSPD: Bogotá, Colombia, 2019. [Google Scholar]
- MADS. Decreto 1076 de 2015; Ministerio de Ambiente y Desarrollo Sostenible: Bogotá, Colombia, 2015. [Google Scholar]
- Torkayesh, A.E.; Malmir, B.; Asadabadi, M.R. Sustainable waste disposal technology selection: The stratified best–worst multi-criteria decision-making method. Waste Manag. 2021, 122, 100–112. [Google Scholar] [CrossRef] [PubMed]
- Matlabi, M.; Biglari, H.; Rasouli, S.S.; Sajjadi, R.S. Environmental impact assessment of Gonabad municipal waste landfill site using Leopold Matrix. Electron Physician 2017, 25, 3714–3719. [Google Scholar]
- Zhao, Y.; Christensen, T.H.; Lu, W.; Wang, H.; Wang, H. Environmental impact assessment of solid waste management in Beijing City, China. Waste Manag. 2011, 31, 793–799. [Google Scholar] [CrossRef] [PubMed]
- Ministerio de Ambiente y Desarrollo Sostenible; Ministerio de Comercio, Industria y Turismo. Estrategia Nacional de Economía Circular; Ministerio de Ambiente y Desarrollo Sostenible: Bogotá, Colombia, 2019. [Google Scholar]
- Rodrigo-Ilarri, J.; Vargas-Terranova, C.A.; Rodrigo-Clavero, M.E.; Bustos-Castro, P.A. Advances on the implementation of Circular Economy Techniques in rural areas in Colombia under a sustainable development framework. Sustainability 2021, 13, 3816. [Google Scholar] [CrossRef]
- DANE. Datos Abiertos. 28 January 2018. Available online: https://www.datos.gov.co/Estad-sticas-Nacionales/Censo-Nacional-de-Poblaci-n-y-Vivienda-CNPV-2018/qzc6-q9qw (accessed on 5 May 2022).
- SSPD. Informe de Seguimiento a Sitios de Disposición Final: Relleno Sanitario “El Merey”; Superintendencia de Servicios Públicos Domiciliarios: Bogotá, Colombia, 2019. [Google Scholar]
- Alcaldía de Puerto Carreño, Vichada. Plan de Gestión de Residuos Sólidos del municipio de Puerto Carreño; Puerto Carreño: Vichada, Colombia, 2016. [Google Scholar]
- ONIC. Organización Nacional Indígena de Colombia. 7 January 2022. Available online: https://www.onic.org.co/en/comunicados-onic/3090-vulneraciones-de-los-derechos-fundamentales-a-los-pueblos-indigenas-en-frontera (accessed on 27 May 2022).
- Defensoría del Pueblo. Defensoría del Pueblo. 1 October 2019. Available online: https://www.defensoria.gov.co/es/nube/enlosmedios/8815/Saciar-el-hambre-en-la-basura-as%C3%AD-sobreviven-los-ind%C3%ADgenas-amorúa-en-Puerto-Carreño.htm (accessed on 8 May 2022).
- DANE. Necesidades Básicas Insatisfechas (NBI); DANE: Bogotá, Colombia, 2018. [Google Scholar]
- Procuraduría General de la Nación. Procuraduría General de la Nación. 13 November 2021. Available online: https://www.procuraduria.gov.co/portal/PROCURADURIA-PIDIO-MEDIDAS-URGENTES-ANTE-DESNUTRICION-DE-NINOS-Y-NINAS-INDIGENAS-EN-PUERTO-CARRENO_-VICHADA-.news (accessed on 17 June 2022).
- Agencia, E.F.E. Colombian Indigenous People Scrapping through Trash for Survival. 7 February 2022. Available online: https://www.efe.com/efe/english/destacada/colombian-indigenous-people-scrapping-through-trash-for-survival/50000261-4734751 (accessed on 17 June 2022).
- Tchobanoglous, G.; Theisen, H.; Vigil, S.A. Integrated Solid Waste Management: Engineering Principles and Management Issues; McGraw-Hill: New York, NY, USA, 1993. [Google Scholar]
- Al-Khatib, I.A.; Monou, M.; Zahra, A.S.F.A.; Shaheen, H.Q.; Kassinos, D. Solid waste characterization, quantification, and management practices in developing countries. A case study: Nablus district, Palestine. J. Environ. Manag. 2010, 91, 1131–1138. [Google Scholar] [CrossRef] [PubMed]
- MVCT. Reglamento Técnico del Sector de Agua Potable y Saneamiento Básico-RAS, Titulo F: Sistemas de Aseo Urbano; Viceministerio de Agua y Saneamiento Básico: Bogotá, Colombia, 2012. [Google Scholar]
- Congreso de Colombia. Ley 142 de 1994; Congreso de Colombia: Bogotá, Colombia, 1994. [Google Scholar]
- UN-HABITAT. Solid Waste Management in the World’s Cities; Earthscan Ltd.: London, UK, 2010. [Google Scholar]
- Yamunaque, A.L.; Iannacone, J. Integral Management of Urban Solid Waste in Latin America; PAIDEIA XXI; Universidad Ricardo Palma: Santiago de Surco, Peru, 2021; pp. 453–474. [Google Scholar]
- Sharma, M.; McBean, E. A methodology for solid waste characterization based on diminishing marginal returns. Waste Manag. 2007, 27, 337–344. [Google Scholar] [CrossRef] [PubMed]
- MADS. Resolución 2184 de 2019; MADS: Bogotá, Colombia, 2019. [Google Scholar]
- Gomez, G.; Meneses, M.; Ballinas, L.; Castells, F. Characterization of urban solid waste in Chihuahua, Mexico. Waste Manag. 2008, 28, 2465–2471. [Google Scholar] [CrossRef] [PubMed]
- DANE. Hoja Metodológica de Indicadores: Residuos Sólidos Generados per Cápita; DANE: Bogotá, Colombia, 2020. [Google Scholar]
- Banco Interamericano de Desarrollo. Situación de la Gestión de Residuos Sólidos en América Latina y el Caribe; Banco Interamericano de Desarrollo: Washington, DC, USA, 2015. [Google Scholar]
- Salas, D.A.; Criollo, P.; Ramirez, A.D. The role of higher education institutions in the implementation of circular economy in Latin America. Sustainability 2021, 13, 9805. [Google Scholar] [CrossRef]
- Martinez, C.I.P.; Piña, W.A. Solid waste management in Bogotá: The rol of recycling associations as investigated through SWOT analysis. Environ. Dev. Sustain. 2017, 19, 1067–1086. [Google Scholar] [CrossRef]
- Padilla, A.J.; Trujillo, J.C. Waste disposal and households’ heterogeneity. Identifying factors shaping attitudes towards source-separated recycling in Bogotá, Colombia. Waste Manag. 2018, 74, 16–33. [Google Scholar] [CrossRef] [PubMed]
- Comisión Económica para América Latina y el Caribe (CEPAL); Departamento Nacional de Planeación (DNP); Compromiso Empresarial para el Reciclaje (CEMPRE) Colombia. Encuesta a Municipios Sobre Gestión de Residuos Sólidos Domiciliarios 2019-Colombia; Documentos de Proyectos (LC/TS.2021/67); Comisión Económica para América Latina y el Caribe (CEPAL): Santiago, Chile, 2021. [Google Scholar]


| Weight of Total Solid Waste (tons) | Weight of Recyclable Organic Waste (tons) | Weight of Recyclable Inorganic Waste (tons) | Weight of Non-Recyclable Waste (tons) | |
|---|---|---|---|---|
| 33% | 28% | 39% | ||
| Day | 9.24 | 3.0492 | 2.5872 | 3.6036 |
| Week (Monday–Saturday) | 55.44 | 18.2952 | 15.5232 | 21.6216 |
| Number of trips required per week | 12 | 3.96 | 3.36 | 4.68 |
| Approximation of the number of trips | 4 | 3 | 5 |
| Problematic | Proposed Solutions | Benefits | ||
|---|---|---|---|---|
| High Priority | Presence of indigenous community in sanitary landfill and throughout the collection routes | Indigenous community recognition as Occupational Recycling, to start their formalization process | Creation of companies, social inclusion and dignification of recycling work carried out by indigenous communities | Decrease in the amount of solid waste entering the sanitary landfill, which contributes to reduce the environmental pressures on landfill and can prolong its useful life |
| Lack of updating of solid waste management plan (PGIRS) | Update the baseline of the PGIRS for the formulation of a new document that includes the inclusive recycling program and selective routes | Formulation of plans and projects that contribute to the improvement of the comprehensive solid waste management system | ||
| Lack of selective routes of collection and transport | Establishment of collection and transport routes separately: collection and transport of recyclable waste for indigenous communities and collection and transportation route for the useful organic material | Decrease in informal work and working of minors | Decrease in accidents and affectations to the health of the indigenous recycler community | |
| Medium Priority | Absence of infrastructure for recycling | Establishment of recycling warehouses with machinery to separate and prepare the usable material for its commercialization | ||
| Inadequate separation in the source of origin of solid waste | Sensitization and awareness campaigns to users of the public cleaning service for the correct separation of solid waste and the proper use of the recollection routes | Avoid the separation of solid waste in public space by contributing better aesthetic aspect of the region | Strengthen the economic and environmental aspects of the waste value chain | |
| Final disposition in sanitary landfill, inadequately due to lack of machinery and instruments of measurement | Purchase and installation of industrial weighing machine for the appropriate weighing of solid waste that entered the sanitary landfill | Reduction of invoicing of the public cleaning service in terms of its final disposition | Avoid sanctions, closures, or legal inquiries for non-compliance with the provisions of regulations and environmental license | |
Publisher’s Note: MDPI stays neutral with regard to jurisdictional claims in published maps and institutional affiliations. |
© 2022 by the authors. Licensee MDPI, Basel, Switzerland. This article is an open access article distributed under the terms and conditions of the Creative Commons Attribution (CC BY) license (https://creativecommons.org/licenses/by/4.0/).
Share and Cite
Esteban Cantillo, O.J.; Quesada, B. Solid Waste Characterization and Management in a Highly Vulnerable Tropical City. Sustainability 2022, 14, 16339. https://doi.org/10.3390/su142416339
Esteban Cantillo OJ, Quesada B. Solid Waste Characterization and Management in a Highly Vulnerable Tropical City. Sustainability. 2022; 14(24):16339. https://doi.org/10.3390/su142416339
Chicago/Turabian StyleEsteban Cantillo, Oscar Julián, and Benjamin Quesada. 2022. "Solid Waste Characterization and Management in a Highly Vulnerable Tropical City" Sustainability 14, no. 24: 16339. https://doi.org/10.3390/su142416339
APA StyleEsteban Cantillo, O. J., & Quesada, B. (2022). Solid Waste Characterization and Management in a Highly Vulnerable Tropical City. Sustainability, 14(24), 16339. https://doi.org/10.3390/su142416339