Article

The Biomimetics of Mg2+-Concentration-Resolved Microenvironment for Bone and Cartilage Repairing Materials Design

1
Department of Oral and Maxillofacial Surgery, School and Hospital of Stomatology, Jilin University, Changchun 130021, China
2
Jilin Provincial Key Laboratory of Tooth Development and Bone Remodeling, Jilin University, Changchun 130021, China
3
Department of Oral Maxillofacial—Head & Neck Oncology, Shanghai Ninth People’s Hospital Affiliated to Shanghai Jiao Tong University School of Medicine, Shanghai 200011, China
4
Key Laboratory of Functional Materials Physics and Chemistry of the Ministry of Education, College of Physics, Jilin Normal University, Changchun 130103, China
*
Authors to whom correspondence should be addressed.
Biomimetics 2022, 7(4), 227; https://doi.org/10.3390/biomimetics7040227
Submission received: 15 October 2022 / Revised: 28 November 2022 / Accepted: 2 December 2022 / Published: 5 December 2022

Abstract

:
With the increase in population aging, the tendency of osteochondral injury will be accelerated, and repairing materials are increasingly needed for the optimization of the regenerative processes in bone and cartilage recovery. The local environment of the injury sites and the deficiency of Mg2+ retards the repairing period via inhibiting the progenitor osteogenesis and chondrogenesis cells’ recruitment, proliferation, and differentiation, which results in the sluggish progress in the osteochondral repairing materials design. In this article, we elucidate the Mg2+-concentration specified effect on the cell proliferation, osteochondral gene expression, and differentiation of modeling chondrocytes (extracted from New Zealand white rabbit) and osteoblasts (MC3T3-E1). The concentration of Mg2+ in the culture medium affects the proliferation, chondrogenesis, and osteogenesis: (i) Appropriate concentrations of Mg2+ promote the proliferation of chondrocytes (1.25–10.0 mM) and MC3T3-E1 cells (2.5–30.0 mM); (ii) the optimal concentration of Mg2+ that promotes the gene expression of noncalcified cartilage is 15 mM, calcified cartilage 10 mM, and subchondral bone 5 mM, respectively; (iii) overdosed Mg2+ leads to the inhibition of cell activity for either chondrocytes (>20 mM) or osteoblasts (>30 mM). The biomimetic elucidation for orchestrating the allocation of gradient concentration of Mg2+ in accordance of the physiological condition is crucial for designing the accurate microenvironment in osteochondral injury defects for optimization of bone and cartilage repairing materials in the future.

1. Introduction

Bone and cartilage injuries caused by inflammation, trauma, or tumor are one of the major diseases in clinical practice [1,2] and are accelerating with the increasingly aging populations, especially for countries with large populations, such as China. Early cartilage injuries are difficult to be perceived because of the nerveless structure for these tissues. When patients find cartilage damage, the subchondral bone damage is already involved. Thereof, the cartilage damage has become increasingly characterized as a disease of the osteochondral unit rather than simply the cartilage on the articular surface. The swelling, pain, dysfunction, and disability caused by osteochondral defects not only seriously deteriorate people’s quality of life, but also bring heavy economic burden to individual families and society [3,4,5].
Osteochondral defects beyond the critical defects are notorious for being unable to self-heal. Present treatments mainly include physical therapy, drug therapy, and surgery. Physical and drug therapy are only effective for mild patients and can only relieve local symptoms or delay the pathological process and disease progression. These conservative treatments cannot completely restore the osteochondral tissue structure and physiological function [6,7,8]. Current surgical treatments mostly include approaches such as cell transplantation and osteochondral transplantation. However, it still faces a series of clinical problems, such as secondary damage to the donor site, limited donor sources, immune rejection, and disease transmission [9,10,11]. Meanwhile, the repaired tissue is mainly fibrocartilage, which has a poor capacity to bear loading and is easy to degenerate [12]. These traditional treatments are hard to reconstruct the hierarchical structures and restore the functions of the osteochondral unit.
Tissue engineering has brought new opportunities for the repair of osteochondral defects. As the central component in osteochondral tissue engineering, a suitable microenvironment plays an important role in providing physical, mechanical, and biochemical signals guiding the seed cells’ migration, proliferation, differentiation, and secretion of extracellular matrix (ECM) to repair the osteochondral unit [13]. Many attempts have tried to reconstruct the microenvironment of the osteochondral unit. Hierarchical structures constructed from double-layer, three-layer, or gradient scaffolds aim to mimic the structural microenvironment, while composite scaffolds constructed from organic and inorganic materials are used to mimic the compositional microenvironment [14]. However, the repaired tissue is usually fibrocartilage, and it cannot integrate well with the subchondral bone, which manifests as the loss or disorder of tidemark and calcified cartilage. This may be because the scaffold mainly provides physical and mechanical signals via the microstructure and surface topography. Compared with the physical and mechanical signals, the biochemical signals provided by endogenous or exogenous cytokines (e.g., growth factors and immunomodulatory factors), hormones, and microelements are the crucial factors regulating the biological behavior of cells in the microenvironment [13]. Various growth factors such as BMP-2 and TGF-β are used to obtain better osteochondral repair effects. However, they have recently become increasingly objectionable by the FDA to approve the use of such growth factors due to safety concerns, as they can lead to ectopic osteogenesis or unwanted bone formation [15,16,17]. TGF-β can also interfere with the homeostasis of subchondral bone and even lead to the occurrence of osteoarthritis [18]. Other growth factors such as fibroblast growth factor, insulin-like growth factor, and vascular endothelial growth factor may cause cartilage calcification. The FDA’s review of such biologics has become more stringent, which makes their commercial viability more difficult and expensive [19]. In osteoarthritis, in addition to local osteochondral defects, the local aseptic inflammatory microenvironment further hinders the repair of the osteochondral unit [20].
Magnesium (Mg) is an essential element of the human body that plays important role in various life activities. Various enzymes in the body can play their physiological metabolism under the action of Mg, such as Na+/K+—ATPase, hexokinase, creatine kinase, protein kinase, cyclase, etc. [21]. Mg acts a pivotal part in nerve and neuromuscular conduction, cardiac excitation, muscle contraction, vasomotion, blood pressure regulation, glucose, and insulin metabolism. Mg also plays a significant role in cartilage and bone development, metabolism, and regeneration. About 50–60% of Mg is present in bones, and Mg accounts for 0.5–1% of bone mineral content. It can not only affect the metabolism of bone minerals and matrix by regulating bone metabolism-related hormones, growth factors, and signaling pathway-related factors, but also directly affect the bone tissue itself [22]. At the same time, the study also found that Mg has a chondroprotective effect. Mg can reduce the loss of type II collagen and glycosaminoglycan in osteoarthritis, and can inhibit the expression of interleukin-1β (IL-1β), Tumor Necrosis Factor-α (TNF-α), and matrix metalloproteinase 13 (MMP13) in osteoarthritis [23]. Mg deficiency caused a marked reduction in the number and size of chondrocytes in the proximal femur, and the femur growth plate lacked an orderly cartilage column arrangement and was significantly reduced in width [24]. Reduced levels of proteoglycan and SRY-Box Transcription Factor 9 (SOX9) in both articular cartilage and growth plate extracellular matrix in rats subjected to Mg dietary restriction for 6 months [20,25].
Therefore, considering the important roles of Mg in cartilage and bone development, we can construct an Mg-enriched microenvironment with a concentration gradient. Different concentrations of magnesium ion (Mg2+) regulate the biological behaviors of the cells (chondrocytes, hypertrophic chondrocytes, and osteoblasts) in different layers (articular cartilage (90% in volume), calcified cartilage (5%), and subchondral bone (5%)) in the osteochondral unit to better repair osteochondral defects. However, the precise regulation of Mg2+ on the biological behavior of osteochondral tissue engineering seed cells has not been systematically studied. So, in this experiment, we aimed to systematically investigate the effect of different concentrations of Mg2+ on the proliferation, chondrogenesis, and osteogenesis of chondrocytes and pre-osteoblasts. We also investigated the anti-inflammatory effects of Mg2+ to use it for osteochondral defect regeneration in osteoarthritis.

2. Results

2.1. Effects of Mg2+ on Chondrocytes

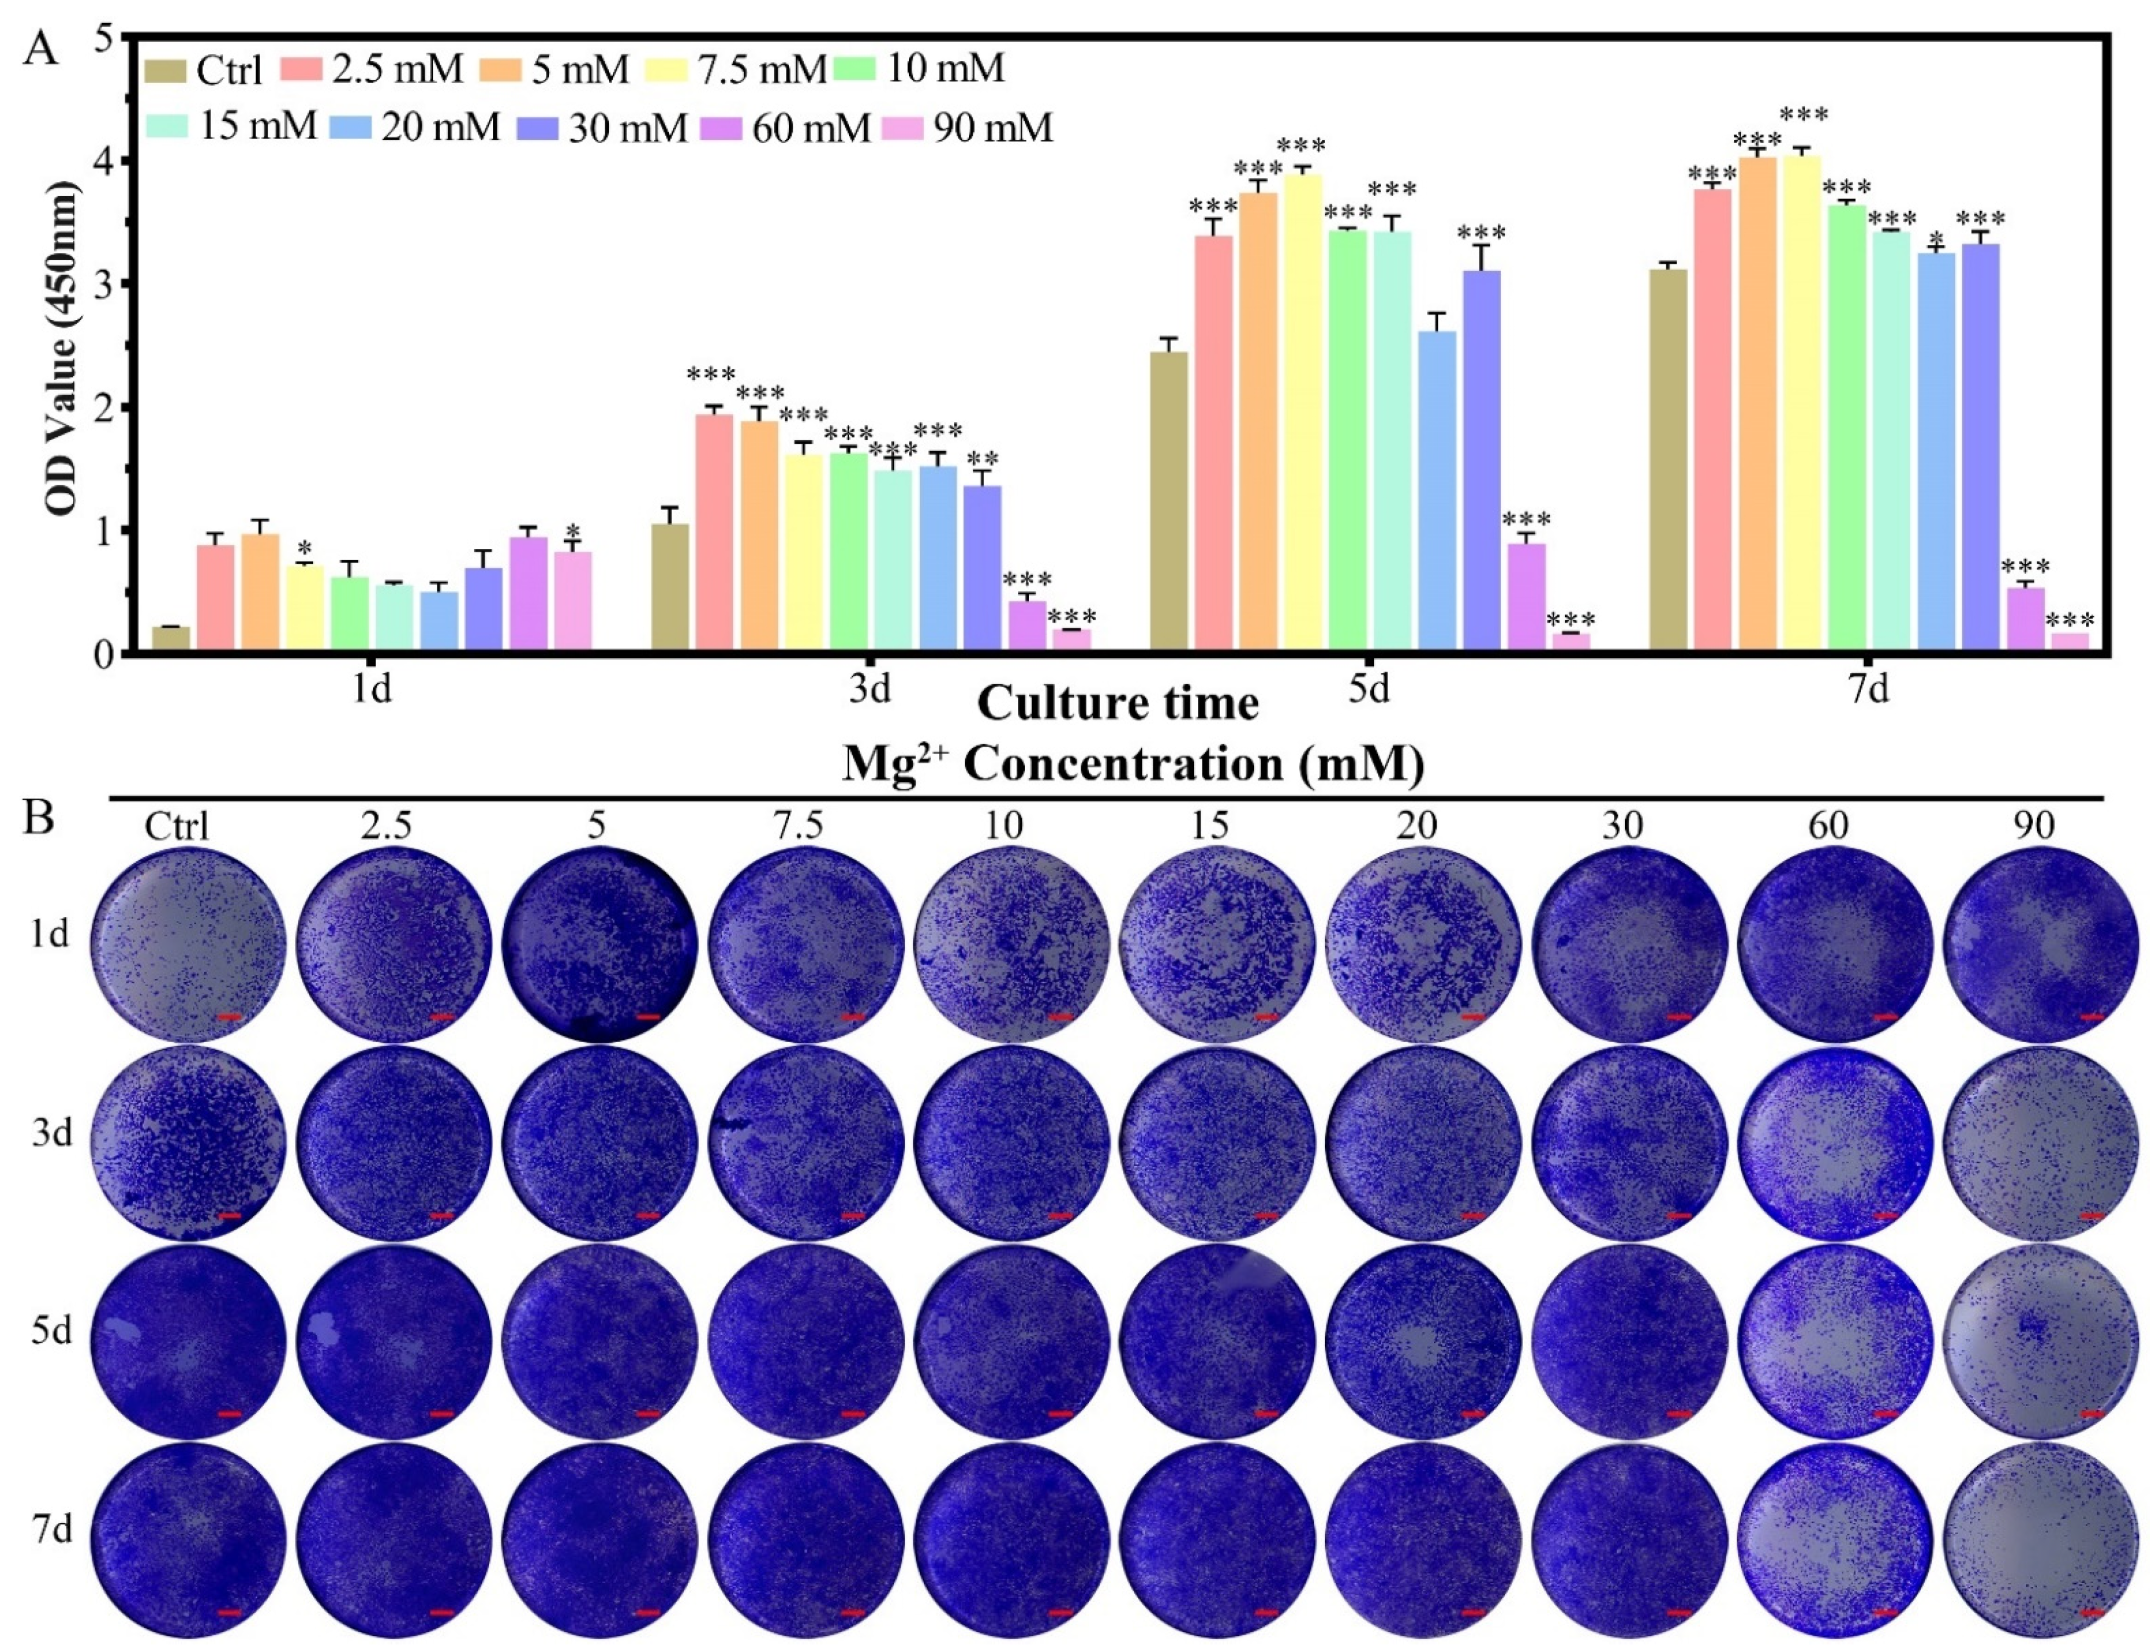
2.1.1. Cell Proliferation

The effect of Mg2+ concentration ([Mg2+]) on the proliferation of chondrocytes was assessed by the CCK-8 method in reference to that cultured in DMEM/F12 without any more Mg2+ addition (Figure 1A). For chondrocytes of New Zealand white rabbit, providing certain amounts of Mg2+ supplementation promoted cell proliferation (1.25–15 mM) from the 1st to the 5th day, while the promotion effect was getting reduced in higher concentrations (15–20 mM), especially for long culture duration. The [Mg2+] on the proliferation of chondrocytes showed three different concentration-dependent results: (i) promoted proliferation of chondrocytes in the range of 1.25 ≤ [Mg2+] ≤ 10.0 mM till the 7th day; (ii) the promotion effect gradually reduced by the 7th day in the range of 12.5 ≤ [Mg2+] ≤ 20.0 mM; (iii) have no promotion effect all the time for [Mg2+] ≥ 25.0 mM. The highest proliferation result was found at 7.5 mM on the third day, 5.0 mM on the fifth day, and 1.25 mM on the seventh day. These results demonstrated that the long-lasting promotion effect on chondrocyte proliferation should avoid high [Mg2+] in the initiation of the culture. The optimum [Mg2+] range is 1.25–15.0 mM.
In the crystal violet staining results, the same tendency could be observed as that measured from the CCK-8 method. The increased purple color for the concentration range of 1.25–10.0 mM demonstrated the proliferation effect of Mg2+ at this range (Figure 1B). With increasing the concentration of Mg2+, the live chondrocytes increased with low concentration and dead with increasing the Mg2+ concentration, especially for the concentration of 25.0 mM. The live/dead staining for the concentration of Mg2+ over 30.0 mM was excluded due to the high dead ratio according to CCK-8 results (Figure S2A,C). Morphology of the chondrocytes kept unchanged for the Mg2+ concentration up to 25.0 mM according to FITC-phalloidin and DAPI staining results (Figure S1A and Figure S2B).

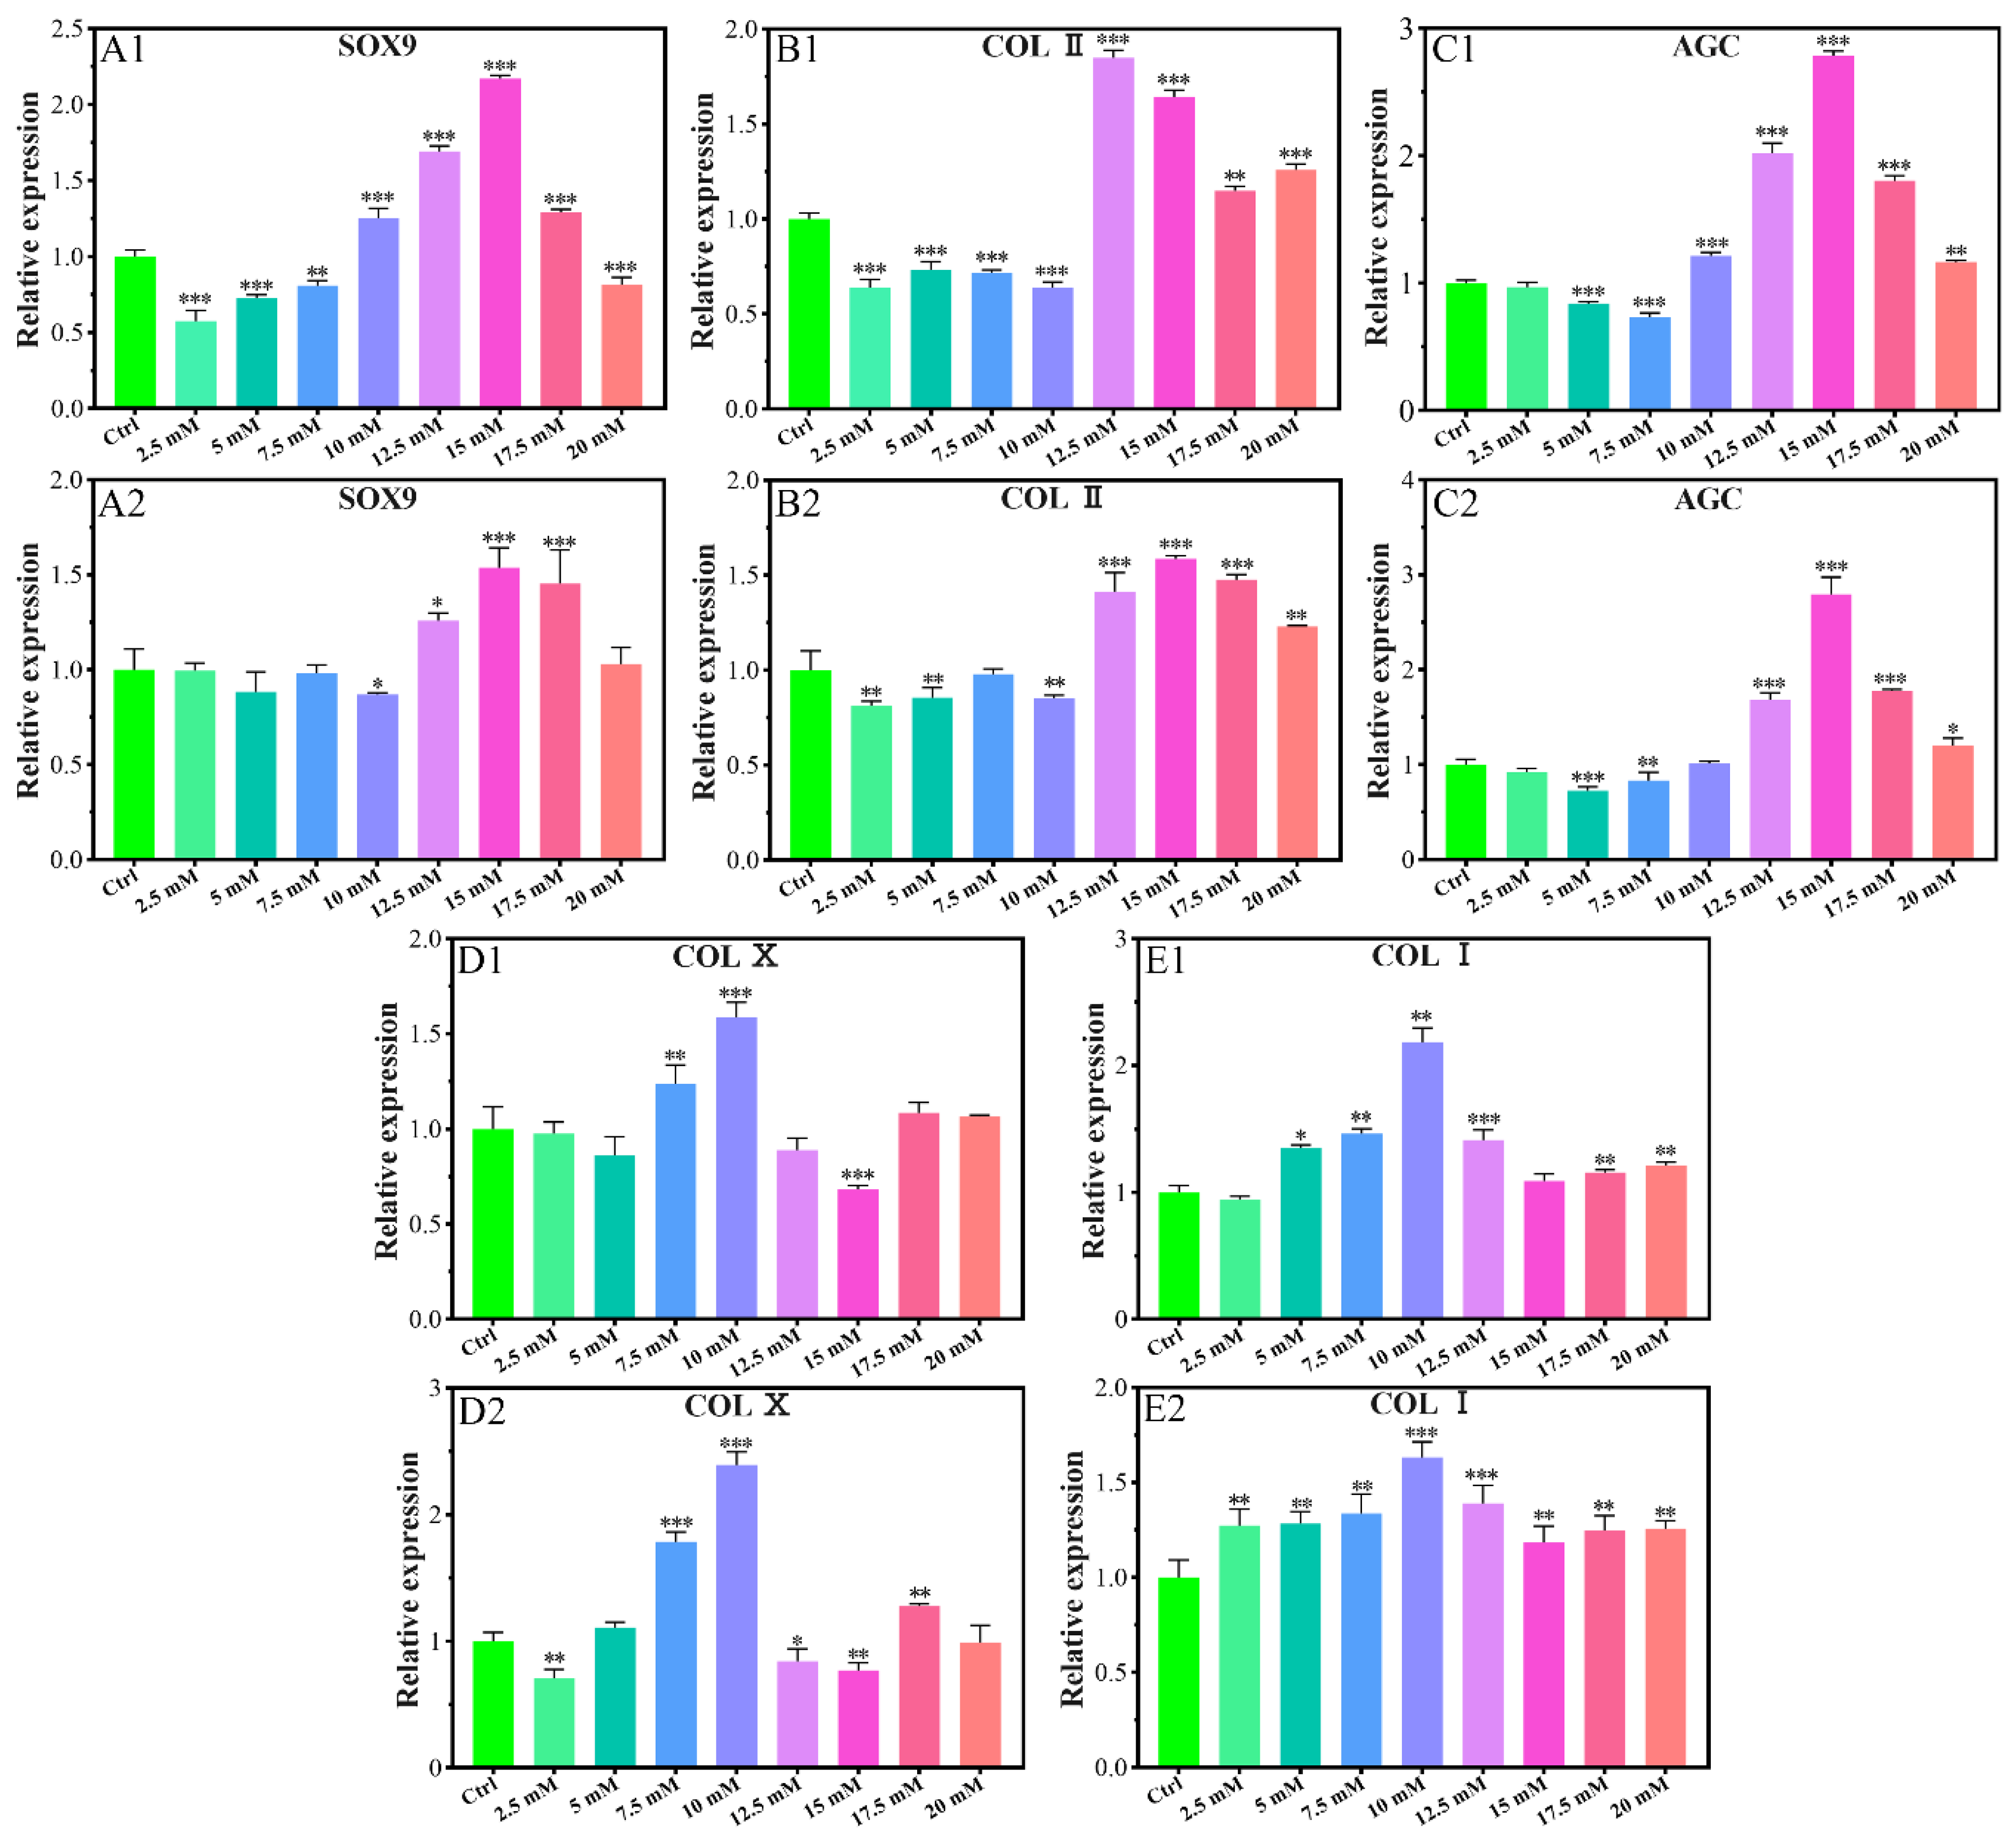
2.1.2. Chondrogenic-Related Gene Expressions

The expression of SOX9 gene was promoted for the concentration of 10–17.5 mM of Mg2+ on the 7th day (Figure 2A1) and 12.5–17.5 mM of Mg2+ on the 14th day (Figure 2A2). All of the other Mg2+ concentrations did not promote the expression of the SOX9 gene.
The expression of the collagen type II (COL II) gene was inhibited in the concentration range of 2.5–10.0 mM on the 7th day (Figure 2B1), and that of 2.5–10.0 mM on the 14th day with a slight exception concentration of 7.5 mM (Figure 2B2). The gene expression promotion concentration range was 12.5–20.0 mM on the 7th day with the highest value for the concentration of 12.5 mM, which kept up to the 14th day with the highest expression for that of 15.0 mM.
The expression of the aggrecan (AGC) gene was also promoted in a similar range as that of SOX9, i.e., 10.0–20.0 mM on the 7th day (Figure 2C1), and 12.5–20.0 mM on the 14th day with the highest value for the concentration of 15.0 mM of Mg2+ (Figure 2C2).
The gene expression of collagen type X (COL X) was promoted only for the concentration of 7.5 mM and 10.0 mM on the 7th day (Figure 2D1) and the fourteenth day. 17.5 mM concentration of Mg also had a promoting effect on the 14th day (Figure 2D2). For all of the other concentrations of Mg2+ at any time, the expression of COL X was inhibited or not changed according to the data.
The expression of the collagen type I (COL I) gene was promoted in the concentration of Mg2+ of 5.0–12.5 mM and 17.5–20.0 mM on the 7th day (Figure 2E1), and that range of 2.5–20.0 mM on the 14th day (Figure 2E2). The most expression result was 10 mM of Mg2+ on either the 7th day or the 14th day.

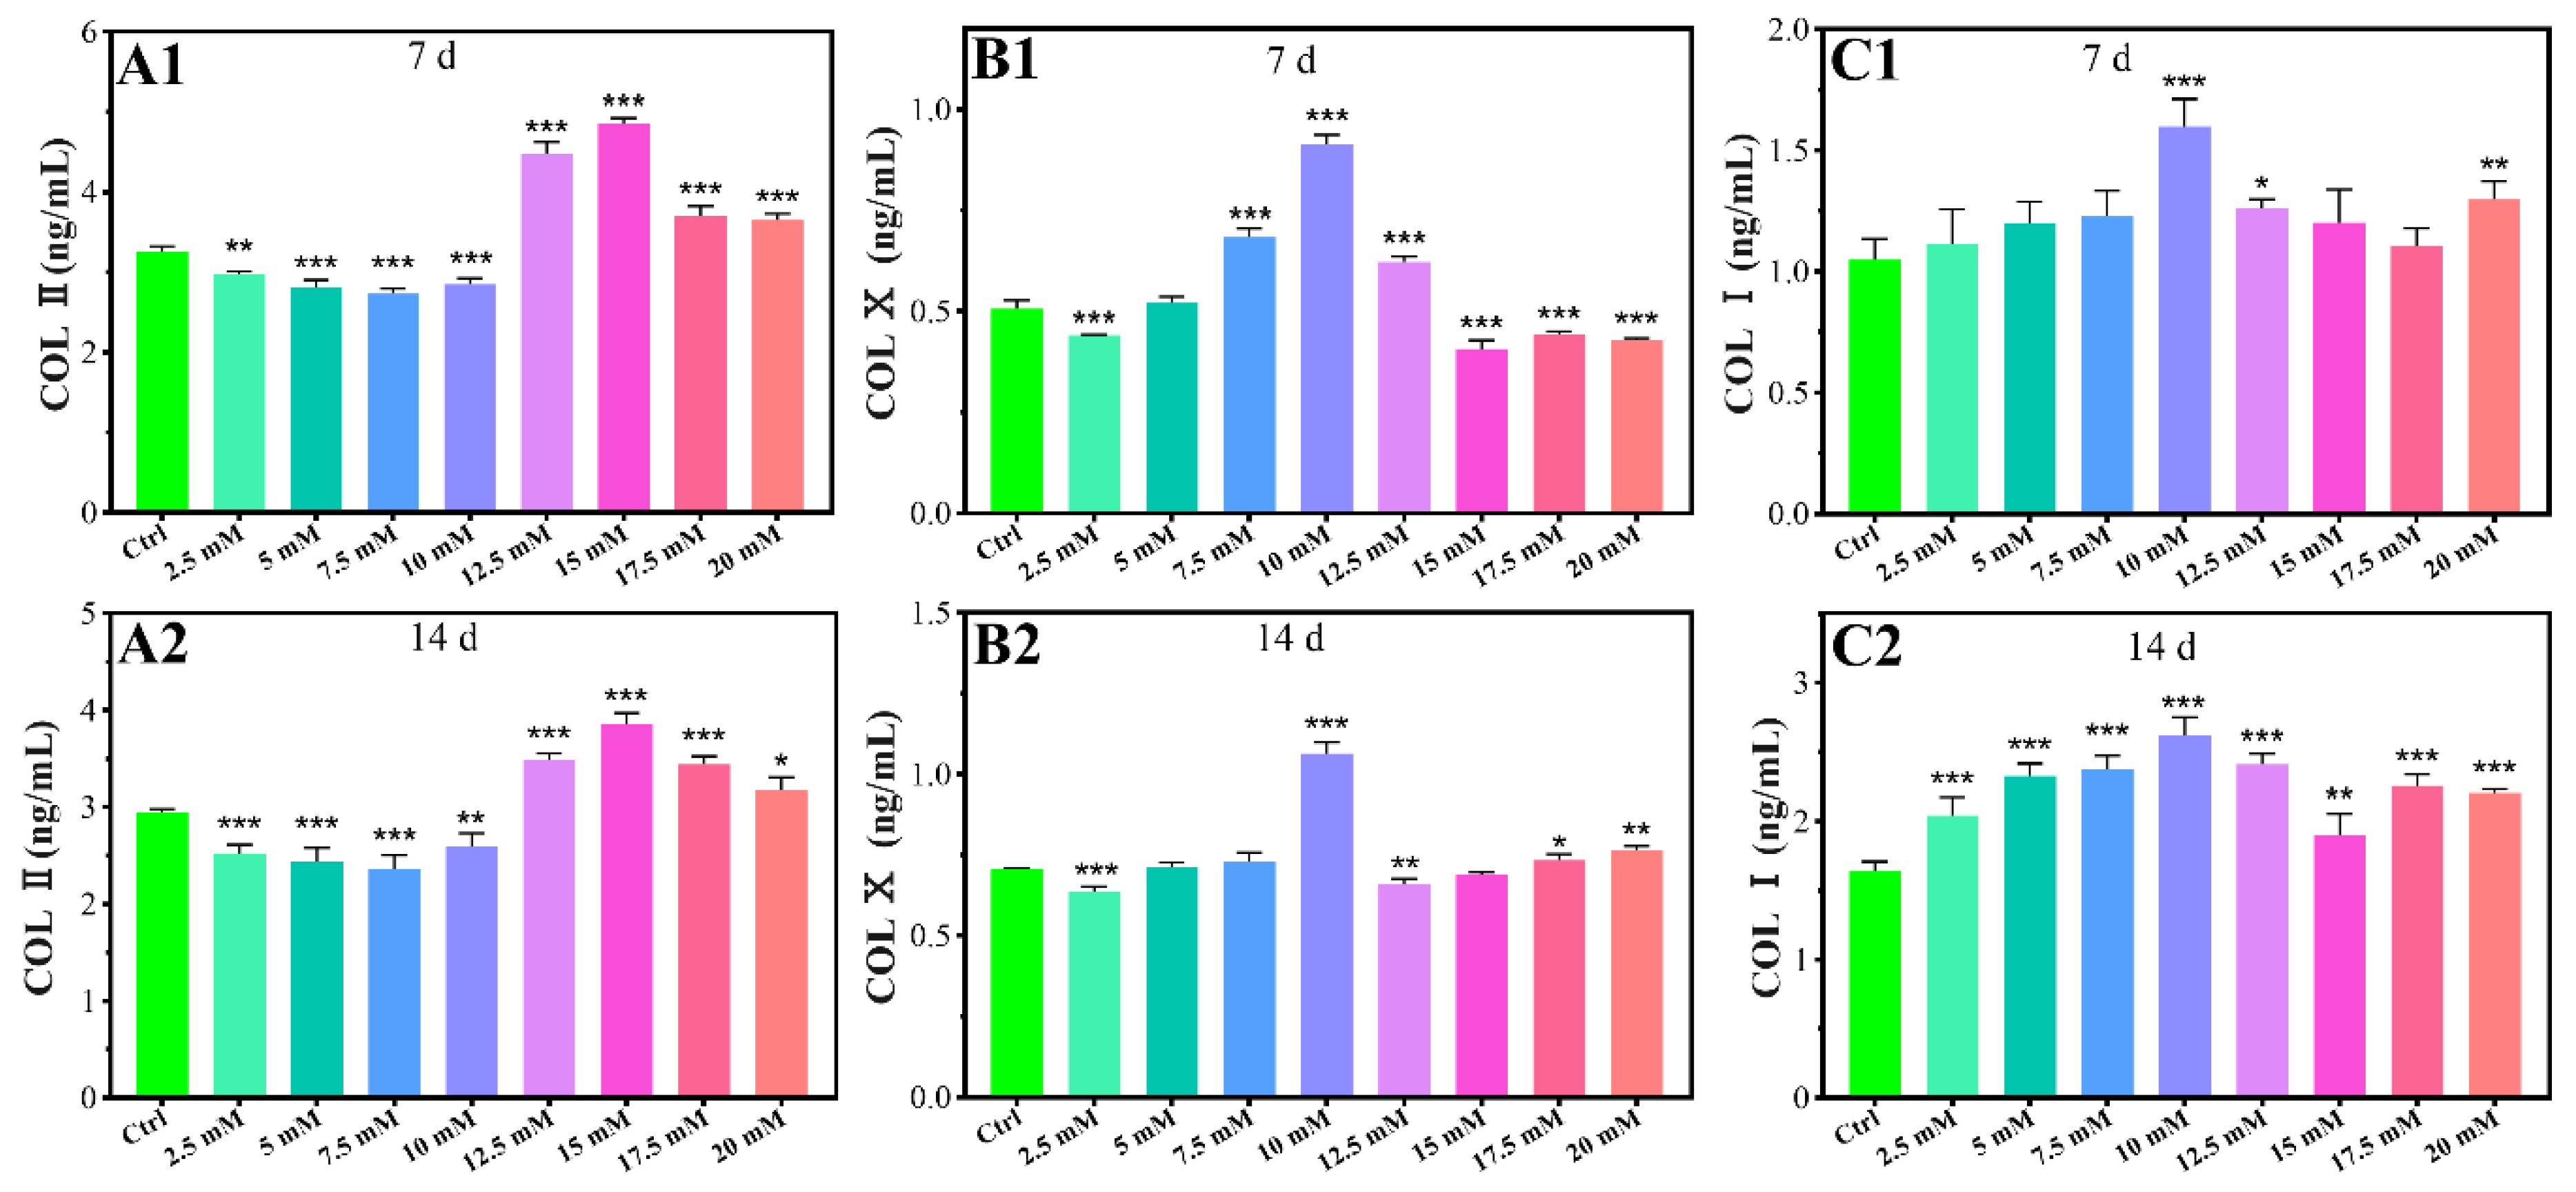
2.1.3. Chondrogenic-Related Protein Expressions

The protein levels of COL Ⅱ, COL Ⅹ, and COL Ⅰ were studied using chondrocytes cultured for 7 days and 14 days respectively. The levels of COL Ⅱ protein significantly increased in high concentrations of Mg2+ (≥12.5 mM) compared with the control group for 7 days and 14 days, while low concentrations of Mg2+ (≤10 mM) inhibited the levels of COL Ⅱ protein (Figure 3A1,A2). At a concentration of 15 mM, Mg2+ significantly increased COL Ⅱ protein contents 1.49- and 1.31-fold, for 7 days and 14 days respectively, when compared to the control group (Figure 3A1,A2). As shown in Figure 3B1,B2, the levels of COL Ⅹ protein significantly increased with 7.5 mM-12.5 mM and 10 mM Mg2+ treatment for 7 days and 14 days respectively. At a concentration of 10 mM, Mg2+ significantly increased COL Ⅹ protein contents 1.80- and 1.51-fold for 7 days and 14 days compared to the control group. Treatment with 10 mM, 12.5 mM, and 20 mM Mg2+ for 7 days significantly increased the COL I protein levels for 7 days compared to the control, while treatment with Mg2+ significantly increased the COL I protein levels for all concentrations for 14 days (Figure 3C1,C2).

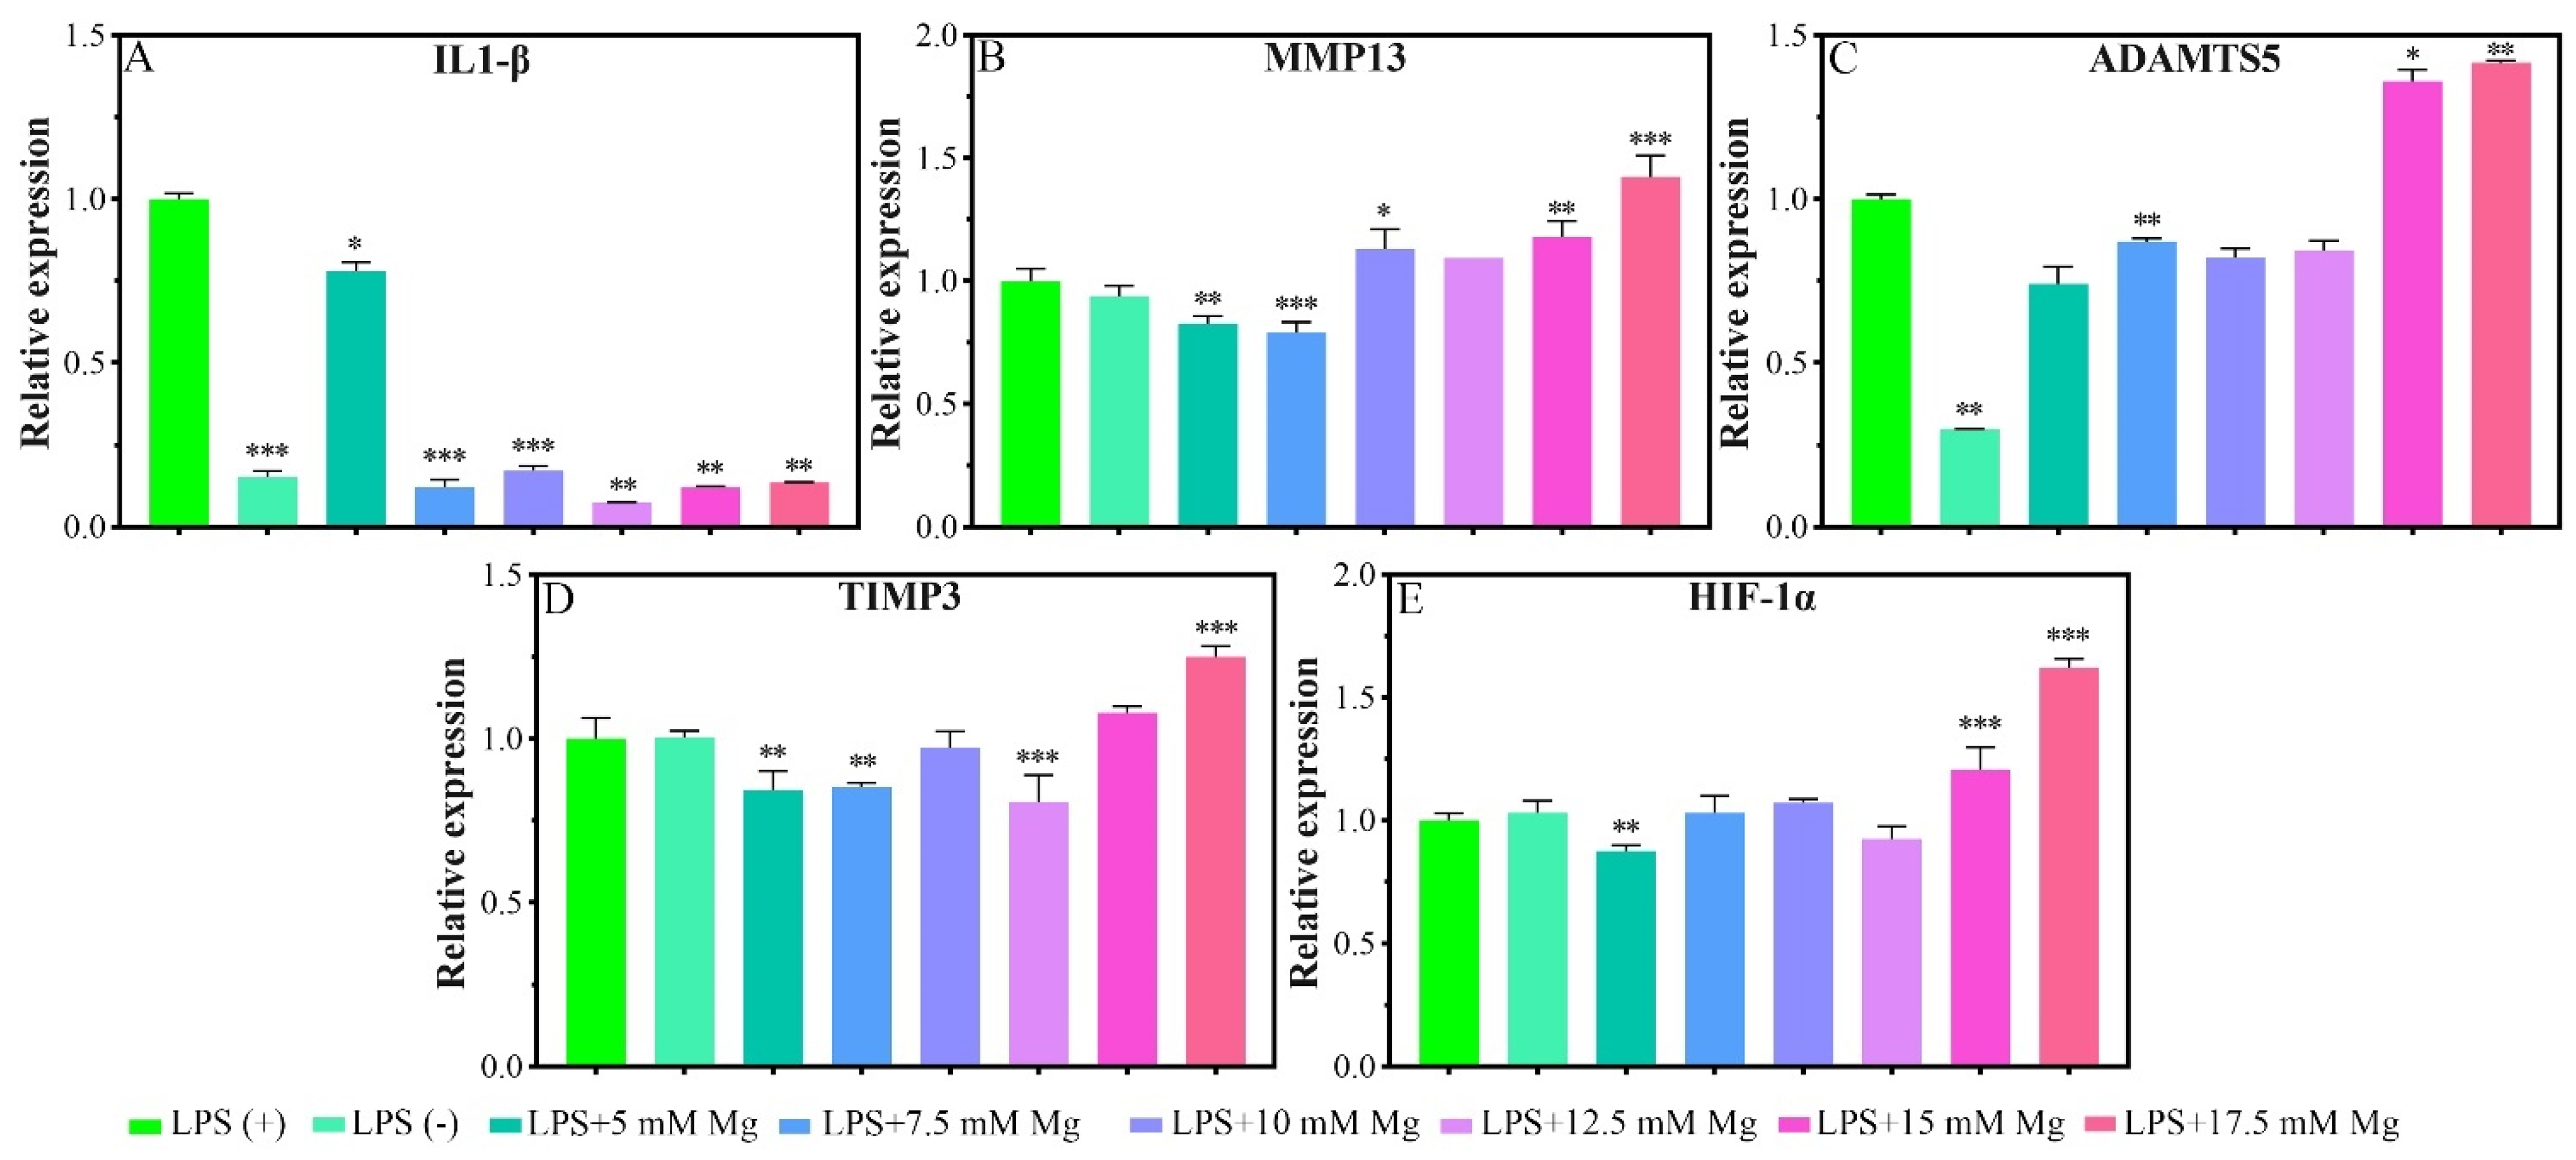
2.1.4. Inflammatory-Related Gene Expressions

Given the pathological characteristics of chondrocytes in osteoarthritis, we focused on the effects of Mg2+ concentration on IL-1β, MMP13, a disintegrin and metalloproteinase with thrombospondin motifs 5 (ADAMTS5), metalloproteinase inhibitor 3 (TIMP3), and hypoxia-inducible factor 1-alpha (HIF-1α) in inflammatory chondrocytes. Lipopolysaccharide (LPS) could serve as a reliable proxy for infection-induced inflammation via Toll-like receptors (TLR) as a prospective mode to induce the inflammation [26]. In the inflammatory model, the LPS (+) group showed a significant expression of IL-1β and ADAMTS5 genes in reference to the LPS (−) group, which indicated the model was successfully built in this experiment (Figure 4A). Cells cultured in different Mg2+ concentration conditions showed a significant inhibiting effect for the expression of the IL-1β gene in comparison with that of the LPS (+) group (Figure 3A). The expression of MMP13 was inhibited for the concentration range of 5.0–7.5 mM of Mg2+ and promoted for the range of 15.0–17.5 mM (Figure 4B). The expression of the ADAMTS5 gene was inhibited for the concentration of 7.5 mM and promoted for the range of 15.0–17.5 mM (Figure 4C). The inhibition range for TIMP3 expression was 5.0 mM, 7.5 mM, and 12.5 mM, which turned to slight promotion for the range of 17.5 mM (Figure 4D). The inhibition effect for the HIF-1α gene was not obvious as the previous genes, which showed slight inhibition for the concentration of 5.0 mM, and also promoted for the range of 15.0–17.5 mM of Mg2+ (Figure 4E).

2.2. Effects of Mg2+ on MC3T3-E1 Cells

2.2.1. Cell Proliferation

The proliferation of MC3T3-E1 cells showed an Mg2+ concentration-dependent phenomenon for the culture in seven days (Figure 5A). The introduction of Mg2+ in the culture medium for MC3T3-E1 cells promoted the proliferation on the first day for all of the concentration groups, which kept the trend up to the 7th day for the concentration range of 2.5–30 mM. An inhibition effect was found for the concentration range of 60.0–90.0 mM from the 3rd day to the seventh day. In the crystal violet staining results, the same tendency could be observed as that measured from the CCK-8 method (Figure 5B). In the live/dead cell staining results, the dead cell ratio increased slightly with increasing Mg2+ concentration, which showed a significant dead amount for the concentration over 30 mM (Figure S3A,C). The morphology of the cells was nearly unchanged for the full range of the Mg2+ concentration (Figure S1B and Figure S3B).

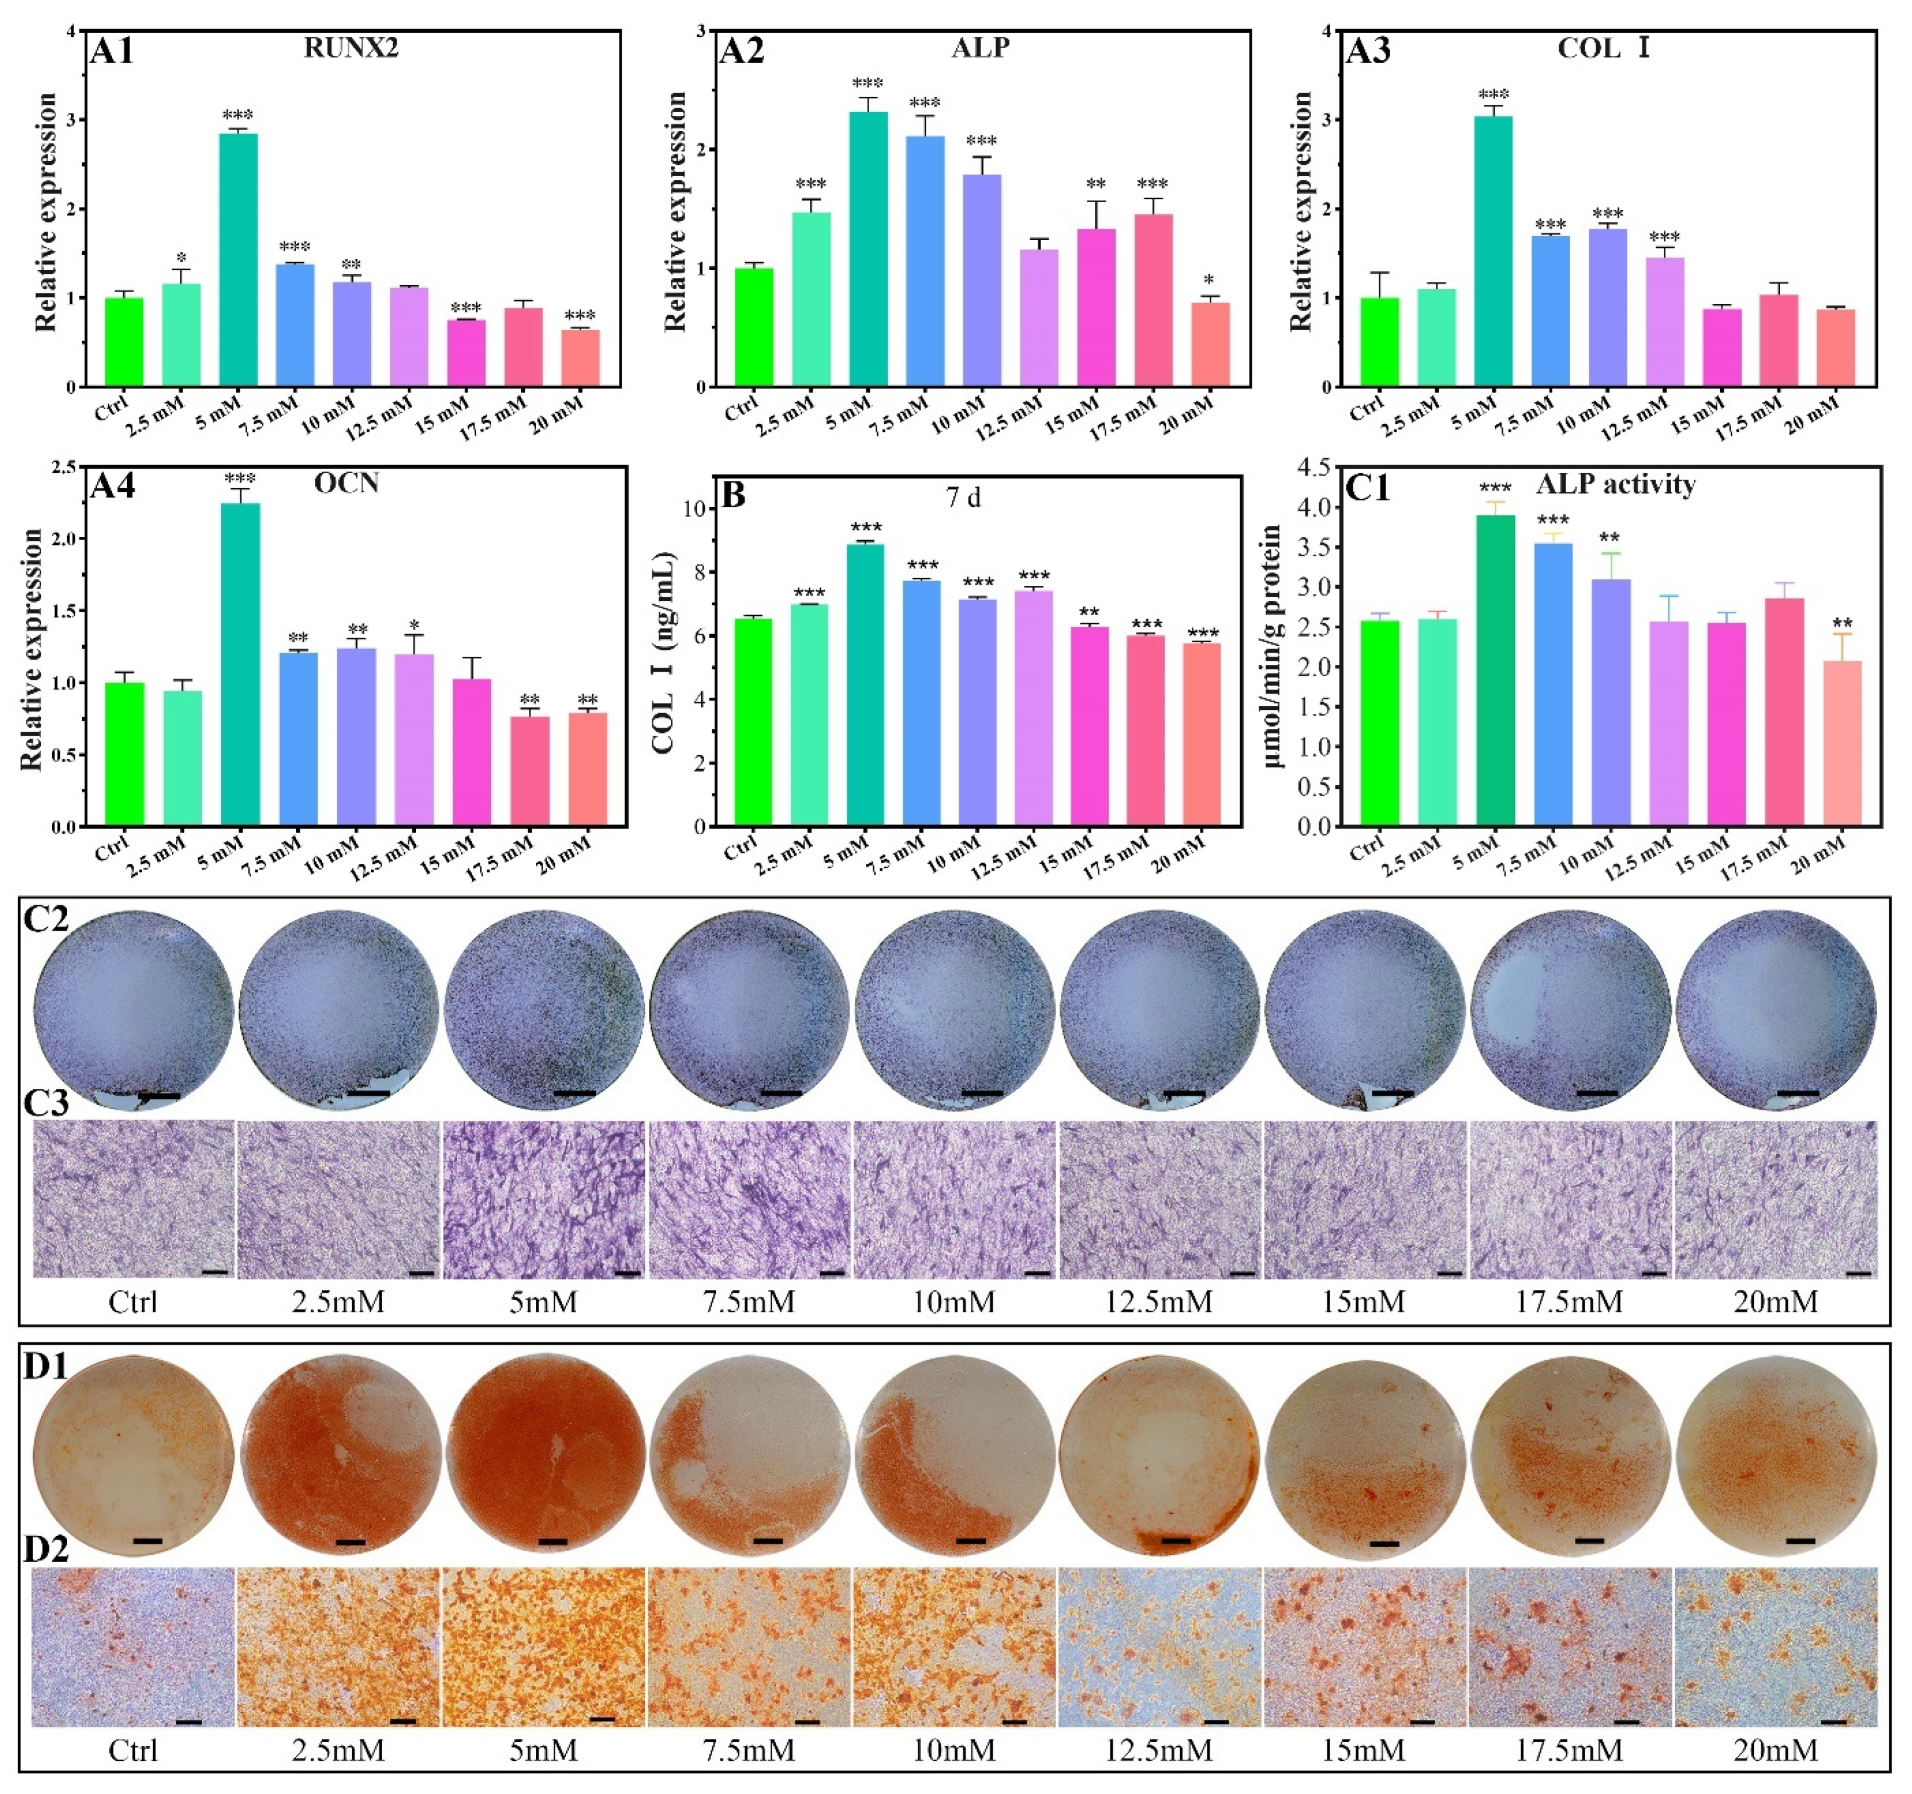
2.2.2. Osteogenic-Related Gene Expressions

The expression promotion range of the Runt-related transcription factor 2 (RUNX2) gene was 2.5–10 mM of Mg2+ on the seventh day (Figure 6A1). The most promotion results occur for the concentration of 5.0 mM. No significant promotion effect for the expression of the RUNX2 gene in the concentrations of 12.5 and 17.5 mM, and that changed as an inhibition for the concentrations of 15.020 mM.
The gene of alkaline phosphatase (ALP) showed a slight promotion of the expression in the Mg2+ concentration range of 2.5–10.0 mM and 15–17.5 mM, with other concentrations showing an inhibition or no promoting effect (Figure 6A2).
The expression of collagen type I (COL I) in MC3T3-E1 cells was promoted for the Mg2+ concentration range of 5–12.5 mM, which had no promoting effect in the range of 15.0–20.0 mM. The highest expression occurred for the 5 mM of Mg2+ (Figure 6A3).
The expression of osteocalcin (OCN) was significantly promoted for the concentration of 512.5 mM, and other concentrations showed no obvious promoting effect or are inhibited for the 2.5 mM, 15.0–20 mM (Figure 6A4).

2.2.3. COL I Contents

The protein levels of COL Ⅰ were studied using MC3T3-E1 cells cultured for 7 days. As shown in Figure 6B, the levels of COL Ⅰ protein significantly increased with 2.5 mM-12.5 mM Mg2+ treatment, while the levels of COL Ⅰ protein were inhibited by 15–20 mM Mg2+. At a concentration of 5 mM, Mg2+ significantly increased COL Ⅰ protein contents 1.36-fold compared to the control group (Figure 6B).

2.2.4. ALP Activity

ALP activity by quantitative analysis and staining showed a promotion effect for the concentration range of 5–10 mM. An inhibition effect was found for the concentration up to 20 mM (Figure 6C1–C3).

2.2.5. Calcium Nodules Formation

The calcium nodules increased for the Mg2+ concentration range of 2.5–10.0 mM in reference to the control group (Figure 6D1,D2), indicating the introduction of Mg2+ promotes calcium nodules formation.

3. Discussion

In this experiment, the effects of different concentrations of Mg2+ on the chondrocytes and MC3T3-E1 cells were systematically studied for the first time. It was found that certain concentrations of Mg2+ can promote the proliferation of chondrocytes (≤10 mM) and MC3T3-E1 cells (≤30 mM). Appropriate concentrations of Mg2+ can also have an anti-inflammatory effect (7.5 mM) and pro-anabolism effect (17.5 mM) on Inflammatory chondrocyte. Moreover, gradient concentrations of Mg2+ can promote the expression of the markers of noncalcified cartilage (15 mM), calcified cartilage (10 mM), and subchondral bone (5 mM), which is beneficial to the regeneration of osteochondral units (Figure 7).

3.1. Pro-Proliferation Effect of Mg2+ on Chondrocytes and MC3T3-E1 and Its Possible Mechanism

The concentration of Mg2+ has been found to directly affect cell proliferation either in chondrocytes or MC3T3-E1 cells. For chondrocytes of New Zealand white rabbit, providing certain amounts of Mg2+ supplementation promotes cell proliferation (1.25–15 mM) from the 1st to the 5th day, while the promotion effect was getting reduced in higher concentrations, especially for long culture duration (Figure 1). These results agree with that of the concentration-dependent proliferation effect of MgSO4 (5–10 mM) on the human articular chondrocytes [27]. The regulatory effect of Mg2+ concentration on chondrocyte proliferation has been reported in porcine and human chondrocyte cultures [27,28]. However, there is still some controversy about the specific concentration range of chondrocyte proliferation. Especially for the New Zealand white rabbit as a model animal for classical osteochondral repair research, there is no relevant report. We systematically adjusted the Mg2+ concentration in the culture environment of New Zealand white rabbit chondrocytes and found that 1.25–10 mM Mg2+ can promote the proliferation of chondrocytes.
Then we investigated the relationship between MC3T3-E1 cell proliferation and Mg2+ concentration. The results found that 2.5–30 mM Mg2+ can promote the proliferation of MC3T3-E1 cells, which could tolerate slightly higher concentrations of Mg2+ than chondrocytes (30 mM vs. 10 mM). When the Mg2+ concentration is greater than 60mM, MC3T3- E1 showed obvious cytotoxicity (Figure 5). Although the stimulating role of magnesium phosphate ceramic has been found in increasing the proliferation rate of MC3T3-E1, there is no relevant research on the effect of Mg2+ concentration on the proliferation of MC3T3-E1 cells in the literature [29].
The synthesis of proteins is highly dependent on the concentration of intracellular Mg2+ due to the Mg2+ as a co-enzyme for many important cell cycle processes. Increasing the concentration of Mg2+ has been convicted that promoting DNA and protein synthesis previously [30]. The regulation mechanism of the pro-proliferation effect of Mg2+ on the two kinds of cells is the same. The effects of Mg2+ on the cell proliferation and differentiation cycle have been summarized in the literature: (i) Moderate concentration of Mg2+ promotes the mitosis of the cells by activating the Mg2+ transporter at the membrane and stimulating the synthesis of DNA and proteins by providing more Mg-ATP co-enzymes [31]; (ii) Deficiency of Mg2+ concentration leads to the upregulation of the cyclin inhibitor p27Kip1, which in turn inhibits the activity of cyclin E-dependent kinases, resulting in blocked DNA and protein synthesis, and cell growth arrest [24,32]; The inhibition effect of high concentration of Mg2+ in chondrocyte proliferation could be ascribed to the locally distorting of the double helix of DNA due to the covalent binding with Mg2+ in the nucleus [33]. (iii) excessive Mg2+ concentration leads to the increased osmotic pressure of the culture medium, and Mg2+ has an antagonistic effect on calcium-related signaling proteins as cell membrane receptors and second messengers, thereby triggering cell membrane rupture and cell death [34]. Although the regulation of cell proliferation by Mg has a certain common law, for different cells, the range of its pro-proliferation concentration is still quite different, which may be related to the difference in the number of Mg2+ transporters on cell membrane between different species.
As we know, chondrocyte hypertrophy is marked by a 10-fold increase in cell volume [35]. To our surprise, although the gene and protein levels of hypertrophic chondrocyte marker COL X elevated when the culture medium contain 7.5–10 mM Mg2+, we did not observe significant morphology changes of chondrocytes cultured in the culture plates. This may be due to the high cell seeding density which result in insignificant change in cell morphology, or it may be related to the two-dimensional culture environments. We will further optimize the cell seeding density and change the cell culture environment to observe the effect of Mg2+ on the change of chondrocyte morphology.

3.2. Effect of Mg2+ Concentration on Chondrogenesis of Chondrocytes and Its Mechanism

Given the histological and physiopathological characteristics of articular cartilage, we focused on the effect of Mg2+ concentration on gene expressions of SOX9, COL II, AGC, COL X, and COL I in chondrocytes. The subcultured chondrocytes exhibit certain differentiation plasticity. They can change their developmental fate such as dedifferentiation and transdifferentiation under different regulatory mechanisms. SOX9, COL II, and AGC are markers of chondrogenic differentiation, while COL X and COL I are markers of chondrocytes hypertrophy and dedifferentiation, respectively.
As shown in Figure 2A–C, in the concentration range of 12.5–17.5mM of Mg2+, SOX9 gene expression can be promoted, while COL II and AGC genes are expressed higher compared to the control group in Mg2+ concentrations in the range of 12.5–20 mM. 15 mM Mg2+ has the best effect on promoting the expression of the three genes. ELISA results showed that 12.5–20 mM of Mg2+ promoted the protein levels of COL II, and 15 mM of Mg2+ had the best promotion effect (Figure 3A1,A2). SOX9, COL II, and AGC have a similar Mg2+ concentration-regulated expression range, which is because SOX9 is a regulatory transcription factor in the process of chondrogenesis, and can positively regulate the expression of COL II and Aggrecan by binding to the specific enhancers of COL II and AGC [36,37]. COL II is the most important protein in hyaline cartilage, which forms a three-dimensional network structure in the extracellular matrix with hydrophilic acidic aggrecan loosely bonded [38].
As shown in Figure 2D1,D2, when the concentration of magnesium is 2.5 mM, 12.5 mM and 15 mM, the gene expression of COL X can be inhibited, indicating that magnesium in this range inhibits chondrocyte hypertrophy; At 7.5–10 mM, the gene expression of COL X was promoted, indicating a pro-hypertrophy effect of magnesium in this range. Protein quantification results by ELISA showed that 10 mM Mg2+ promote the COL X protein levels (Figure 3B1,B2). Studies have found that Mg2+ can inhibit chondrocyte hypertrophy and matrix calcification by regulating the MAPK/ERK phosphorylation signaling pathway and autophagy [39], which is closely related to the inhibition of COL X gene expression. In this study, we found that whether Mg2+ promotes or inhibits COL X expression is related to the dose of Mg2+. 10 mM Mg2+ had the best promotion effect on the COL X gene and protein expression levels. COL X is the main marker of hypertrophic cartilage and calcified cartilage. It plays several roles including stabilizing the remodelling ECM [40], regulating the distribution of collagens and proteoglycans throughout the ECM [41], and regulating the zonal distribution of matrix vesicles [42]. Runx2 can regulate the expression of COL X in pre-hypertrophic and hypertrophic chondrocytes, which can bind and release calcium in a dose-dependent manner, thereby participating in endochondral ossification [43], which is beneficial to the bone formation during bone development. In osteoarthritis, the amount of hypertrophic cartilage is also increased with an up-regulation of COL X. Therefore, the regulation of Mg2+ on chondrocyte COL X is bidirectional, and the change of Mg2+ concentration can be adjusted according to the purpose of treatment. We can design scaffolds that contain appropriate concentrations of Mg2+ by 3D printing or hydrogels to repair bone defect by promoting endochondral osteogenesis or promote cartilage regeneration by inhibiting chondrocyte hypertrophy. For patients with osteoarthritis, the local delivery of appropriate concentrations of Mg2+ by local injection of nanocarrier to inhibit the up-regulation of COL X may reduce the progression of osteoarthritis.
The expressions of the COL I gene and protein were elevated when the Mg2+ concentration is higher than 0.7 mM (Figure 2E1,E2 and Figure 3E1,E2), which indicates that the high Mg2+ microenvironment can cause the dedifferentiation of chondrocytes. One of the disadvantages of the in vitro culture of chondrocytes is the potential of dedifferentiation, especially for the cells cultured in a two-dimensional environment in vitro or in more generations of propagation for a long time. The morphology of the dedifferentiated chondrocytes changes from triangle to the elongated spindle, with the main collagen changing from type-II to type-I [44]. The occurrence of COL I, as the main collagen protein of fibrous cartilage, indicates poor quality of the cartilage, which is prone to degenerate and unable to fulfill its function [45,46]. However, the main type of collagen in fibrocartilage such as articular disc and condyle is COL I. Magnesium may promote the regeneration of fibrocartilage by promoting the production of COL I, so it may also be used for condylar cartilage and articular disc regeneration [47]. In our case, the supplement of Mg2+ does not inhibit the dedifferentiation of chondrocytes of New Zealand white rabbit. But as we know, chondrocytes are prone to dedifferentiation when cultured in two-dimensional environments, while they can return to the phenotype of normal chondrocytes in three-dimensional environments. The dedifferentiation of chondrocytes characterized by up-regulation of COL I, which may be related to the two-dimensional culture environment in this study. We will use three-dimensional culture environments such as pellet culture and hydrogel culture to study the effect of Mg2+ on chondrocytes dedifferentiation in further study.
Although the repair of osteochondral defects is accomplished by bone marrow mesenchymal stem cells, it is also accompanied by the formation of fibrocartilage, which reduces the quality of the neo-cartilage. In the clinical trials for patients with cartilage defects, the use of chondrocyte transplantation has achieved good results. If Mg2+ can promote the migration of surrounding chondrocytes to the defect area and continuously secrete cartilage matrix to repair cartilage defects, then we do not need to expand chondrocytes in vitro, but directly implant the Mg2+-based biomaterials rely on endogenous chondrocytes to repair cartilage layer defects. This may be a method that can be considered in the future.

3.3. Effect of Mg2+ Concentration on Inflammation Related Gene Expressions and Its Mechanism

As shown in Figure 4, the inhibitory concentration ranges of Mg2+ on IL-1β, MMP13, and ADAMTS5 were 5–17.5 mM, 5–7.5 mM, and 7.5 mM, respectively. The inhibitory concentration of Mg2+ on the above genes is lower than that of promoting effect of ECM synthesis of chondrocytes.
IL-1β is the main inflammatory factor related to the occurrence and development of osteoarthritis. It can promote the synthesis of MMP13 and ADAMTS5, thereby degrading collagen type II fibrils and proteoglycan [48]. Studies have shown that Mg2+ may affect osteoarthritis by inhibiting the expression of IL-1β, TNF-α, MMP13, and ADAMTS5 genes in macrophages, synoviocytes, and chondrocytes [23,24,39]. Mg2+ can inhibit the expression of IL-1β and TNF-α in the synovial tissue of New Zealand rabbits with OA by inhibiting the calcium ion channel TRPV5 and activating cartilage autophagy [49]. The inhibitory effect of Mg2+ on IL-1β, MMP13, and ADAMTS5 indicates that it has a certain potential in the treatment of osteoarthritis and 5–7.5 mM Mg2+ was most effective in inhibiting cartilage catabolism.
This study also found that low concentrations of Mg2+ (5 mM, 7.5 mM, 12.5 mM) could inhibit the expression of TIPM3, while high concentrations of Mg2+ (17.5 mM) could promote the expression of TIPM3. Zan et al. found that 20 mM Mg2+ chloride can promote the synthesis of TIPM3 [50], which is almost the same as the concentration that promotes the expression of TIPM3 in this paper. TIPM3 is a major proteoglycanase inhibitor. High concentrations of Mg2+ promote the synthesis of TIPM3 to further suppresses osteoarthritis by inhibiting the expression of ADAMTS4, ADAMTS5, and MMP-13 [51,52].
Given the physiological characteristics of the hypoxia environment in cartilage, we studied the effect of [Mg2+] on the expression of HIF-1α in inflammatory chondrocytes and found that 5 mM of [Mg2+] had a certain inhibitory effect on the expression of HIF-1α, while 15 and 17.5 mM of [Mg2+] could promote the expression of HIF-1α (Figure 4E). The effects of [Mg2+] on HIF-1α and TIPM3 tend to be almost the same, probably because HIF-1α can act on the promoter of TIPM3, thereby increasing its transcription and protein expression [53]. Studies have shown that a hypoxic environment plays an important role in promoting cartilage repair and regeneration. For example, co-immunoprecipitation confirmed that HIF-1α and SOX9 combined with each other to promote cartilage formation. The activation of SOX9 can be inhibited after knocking out the HIF-1α promoter site. The expression of SOX9 was increased twofold under hypoxic conditions relative to normoxic conditions [54,55]. HIF-1α also can maintain chondrocyte and cartilage homeostasis by regulating chondrocyte autophagy and apoptosis [56]. Therefore, the promotion of HIF-1α expression by Mg2+ is beneficial to the synthesis of cartilage matrix and the maintenance of cartilage homeostasis. Another study found that HIF-1α inhibits the expression of MMP13 by blocking the interaction between transcription factor 4 and β-catenin, while the reduction of HIF-1α can promote the expression of MMP13 and increase cartilage damage [57]. In this study, the Mg2+ concentration that promotes HIF-1α expression also promotes MMP13 expression, although the mechanism remains to be further studied, this problem can be solved by trying to combine drugs such as zinc-binding and non-zinc-binding selective MMP-13 inhibitors that can inhibit MMP-13 expression in the treatment of osteoarthritis.
In the case of osteochondral defects in arthritis, the inflammatory factors that degrade the cartilage matrix should be inhibited first, and then promote the synthesis of cartilage matrix. Since the negatively charged glycosaminoglycans in the cartilage matrix can adsorb a large amount of positively charged Mg2+, Mg2+ enriched in the cartilage matrix gradually increase with the degradation of the Mg-doped scaffold. [Mg2+] changes from low to high, which is in line with the sequence of low concentrations inhibiting inflammation firstly, followed by high concentrations promoting cartilage matrix synthesis. We have fabricated scaffolds that contain appropriate concentrations of Mg2+ by 3D printing or hydrogels. The gradient distribution of Mg2+ can be achieved by two-phase, three-phase, or gradient scaffold.

3.4. Effect of Mg2+ Concentration on Osteogenesis of MC3T3-E1 Cells and Its Mechanism

Aiming at the histological and physiological characteristics of bone, we focused on the effects of Mg2+ concentration on the gene expressions of RUNX2, ALP, COL I, and OCN in MC3T3-E1 cells. As shown in Figure 6A1–A4, RUNX2 gene expression was promoted when the Mg2+ concentration was less than 10 mM, while the ALP, Collagen I, and OCN genes were up-regulated in the range of Mg2+ concentration in 2.5–10 mM, 5–12.5 mM, and 5–12.5 mM, respectively. The regulation of these gene expressions has similar Mg2+ concentration ranges, which is because RUNX2 can bind to osteoblast-specific cis-acting elements to regulate the transcription and translation of ALP, Collagen I, and OCN, thereby promoting cell growth, osteogenesis, and accelerated extracellular matrix deposition [58].
At the same time, the protein levels of COL I and ALP were measured. COL I is the most abundant protein in bone matrix, while ALP plays an important role in regulating bone mineralization. ELISA results showed that 2.5–12.5 mM Mg2+ promoted the expression of COL I protein, while 15–20 mM Mg2+ inhibited the expression of COL I protein (Figure 6B). Through the quantitative and qualitative experiments of ALP activity, we found that 5–10 mM Mg2+ can promote the synthesis on ALP protein (Figure 6C1–C3). The protein quantification results were consistent with the PCR results. Under the activation of Mg2+, ALP can hydrolyze phosphate monoesters and other substrates to release phosphate. The accumulation of local phosphate ions results in excess soluble calcium phosphate products and calcium phosphate precipitation. Calcium salts form calcification centres along COL I fibres and hydroxyapatite are gradually formed to form osteoid under the control of non-collagen such as OCN.
The number of calcium nodules formed by 2.5–10 mM Mg2+ was significantly more than other groups, while higher concentrations of Mg2+ inhibited calcium nodules formation (Figure 6D1,D2), probably because Mg2+ is an antagonist of calcium. High concentrations of extracellular Mg2+ can reduce the calcium content in mitochondria, inhibit the formation of matrix vesicles and autophagosomes, and ultimately inhibit the formation of bone matrix. Compared with the concentration range of Mg2+ promoting cartilage extracellular matrix synthesis. The concentration range of Mg2+ promoting bone matrix synthesis in MC3T3-E1 cells is relatively lower, which may be due to the difference in the number of Mg2+ transporters and receptors on different cell membranes.
In this study, we found that 5 mM Mg2+ had the best effect on promoting osteogenesis according to osteogenesis-related gene expression, COL I protein contents, ALP activity, and calcium nodule formation.
In the future, we can develop multi-layered scaffolds or gradient scaffolds for the regeneration of articular osteochondral defects. Each layer of the scaffolds corresponds to the hyaline chondrocyte layer, the hypertrophic chondrocyte layer, and the subchondral bone layer, respectively. In each layer of the scaffold, different concentrations of Mg2+ are loaded and the release of specific concentrations of Mg2+ is precisely regulated. The different effects of different concentrations of Mg2+ on chondrocytes and osteoblasts are used to promote the integrated repair of osteochondral defects. We can also take advantage of the anti-inflammatory effects of Mg2+ for the treatment of osteoarthritis osteochondral defects. Through the release of a specific concentration of Mg2+ from the scaffold, it can not only control inflammation but also promote the regeneration of osteochondral.

4. Materials and Methods

4.1. Chemicals

Chemicals and materials (and their purity and manufacture) in the experiment are listed as follows: Magnesium chloride hexahydrate (99%, Aladdin, Shanghai, China), Collagenase Type II (Sigma Aldrich, St. Louis, MO, USA), Trypsin (Sigma Aldrich, St. Louis, MO, USA), Phosphate Buffer Saline (PBS, Hyclone, Cytiva, Logan, UT, USA), Penicillin–streptomycin (Hyclone, Cytiva, Logan, UT, USA), Fetal Bovine Serum (FBS, Biological Industries, Israel), Dulbecco’s modified Eagle’s Medium (DMEM) of High glucose (HG, 4500 mg/dL) (DEME-HG; Hyclone, Cytiva, Logan, UT, USA), Dulbecco’s modified Eagle’s Medium/Nutrient Mixture F12 (DEME/F12; Hyclone, Cytiva, Logan, UT, USA), Cell counting kit-8 (CCK8, Solarbio, Beijing, China), Crystal violet (Solarbio, Beijing, China), Calcein-AM/Propidium Iodide (PI) live/dead cell staining kit (Solarbio, Beijing, China), 4′,6-diamidino-2-phenylindole (DAPI, Solarbio, Beijing, China), FITC-phalloidin (Solarbio, Beijing, China), Lipopolysaccharide (LPS, Solarbio, Beijing, China), L-Ascorbic acid (Sigma Aldrich, A4403, St. Louis, MO, USA), β-Glycerophosphate disodium salt hydrate (Sigma Aldrich, G9422, St. Louis, MO, USA), Dexamethasone (Sigma Aldrich, D4902, St. Louis, MO, USA), Alkaline Phosphatase (ALP) Assay kit (Beyotime Biotechnology, Shanghai, China), BCIP/NBT Alkaline Phosphatase (ALP) Assay Chromogenic Kit (Beyotime Biotechnology, Shanghai, China), Alizarin red (Solarbio, Beijing, China), Trizol reagent (Yeason Biotech, Shanghai, China), Hifair® II First Strand cDNA Synthesis Kit (Yeason Biotech, Shanghai, China), Hieff® qPCR SYBR Green Master Mix (Yeason Biotech, Shanghai, China). Rabbit Collagen Type II ELISA Kit (Cusabio, Wuhan, China), Rabbit Collagen Type X ELISA Kit (MyBioSource, San Diego, CA, USA), Rabbit Collagen Type I ELISA Kit (Cusabio, Wuhan, China), Mouse Collagen Type I ELISA Kit (Cusabio, Wuhan, China).

4.2. Chondrocytes and MC3T3-E1 Culture

The Animal Ethics Committee of the School of Stomatology, Jilin University approved the procedures related to animals. Chondrocytes were isolated and cultured according to a previous study [59]. Briefly, chondrocytes were taken from the articular cartilage of the knee joints of New Zealand white rabbits of two weeks old. Firstly, the articular cartilage of the femur condyle was dissected and cut into small pieces with an approximate volume of 1 mm3 under aseptic conditions. The chondrocytes were separated from the cartilage tissue with the assistance of II-type collagenase. The obtained chondrocytes were cultured in DMEM/F12 supplemented with 10% FBS, 100 units/mL penicillin, and 100 mg/mL streptomycin in a cell incubator filled with 5% of CO2. The culture medium was updated every 2 days. The second passage of chondrocytes was used for the following experiments.
MC3T3-E1 subclone 4 was purchased from the American Type Culture Collection (ATCC) company, and cultured in DMEM-high glucose supplemented with 10% FBS, 100 units/mL penicillin, and 100 mg/mL streptomycin in a cell incubator filled with 5% of CO2. The culture medium was refreshed every 2 days.

4.3. Effects of Mg2+ Concentration on the Chondrocytes

4.3.1. Cell Proliferation

The effect of Mg2+ concentration on the proliferation of chondrocytes was assessed by the CCK-8 method. Chondrocytes (1.5 × 10³ cells/well) were inoculated into each well of the 96-well plate and cultured for 24 h until updated with the 100 μL of Mg2+-loaded DMEM/F12 culture medium with different Mg2+ concentrations (1.25 mM, 2.5 mM, 5.0 mM, 7.5 mM, 10.0 mM, 12.5 mM, 15.0 mM, 20.0 mM, 25.0 mM, 30.0 mM, 60.0 mM, 90.0 mM. The stock solution of Mg2+ was prepared by magnesium chloride hexahydrate and stored in 4 °C). Five parallel experiments were applied for each Mg2+ concentration and the control group were the pure DMEM/F12 (with the concentration of Mg2+ being 0.7 mM). The culture medium was renewed every two days. For cell proliferation measurement, 10 μL of CCK-8 solution was added to the well and cultured for another 2 h, then the OD value was collected at 450 nm by the microplate reader at the first, third, and fifth day for each Mg2+ concentration and the control group of the culture medium.
The cell proliferation amounts were also observed directly by the crystal violet staining method. The as-cultured cells in the well were washed with PBS solution firstly. Then, the cells were fixed with 100 μL of paraformaldehyde for 30 min, and then re-washed with PBS solution. After that, 100 μL of crystal violet was dripped to stain the cells and re-washed with PBS solution for the image recording by a digital scanner.

4.3.2. Cell Activity

The living activity of the cells was assessed via the dead-live staining method. The ultrahigh Mg2+ concentration groups (30 mM, 60 mM, and 90 mM) were excluded based on the CCK-8 results (due to the high inhibition effect on cell proliferation). The chondrocytes (1.5 × 10⁴ cells/well) were inoculated in 48-well plates for the Mg2+ concentration groups of 1.25–25.0 mM with DMEM/F12 as the control group. The culture medium was updated every 2 days. The dead and live cells were stained after being cultured for 72 h [60]. The results were recorded by a fluorescence microscope.

4.3.3. Cell Morphology

Morphology of the chondrocytes was observed by a combination of FITC-phalloidin and DAPI staining method. The Mg2+ concentration sets and cell culture method were the same as that in Section 4.3.2. After cultured for 48 h, FITC-phalloidin and DAPI were applied to stain the F-actin and nucleus, respectively, to illustrate the morphology changes of the chondrocytes. The results were recorded by a fluorescence microscope.

4.3.4. Chondrogenic-Related Gene Expressions

The effect of Mg2+ concentration on chondrogenic-related gene expressions (SOX9, COL II, AGC, COL X, and COL I) was evaluated by real-time quantitative PCR technique. Briefly, chondrocytes were seeded on 6-well plates with a density of 2 × 10⁵ cells/well. After cultured for 24 h, the culture media was replaced with fresh culture media containing different concentrations of Mg2+ (2.5 mM, 5 mM, 7.5 mM, 10 mM, 12.5 mM, 15 mM, 17.5 mM, and 20 mM). The total RNA of each group was extracted by Trizol reagent (Invitrogen, USA) after cultured for 7 days. Then reverse transcription was performed to synthesize cDNA from purified RNA using Oligo(dT) primers (Promega, San Luis Obispo, CA, USA) and SuperScript III reverse transcriptase (Invitrogen, Carlsbad, CA, USA) in accordance with the instructions of the suppliers. Finally, cDNA was subjected to real-time PCR (Applied Biosystems 7300, Foster City, CA, USA) using SYBR Green detection (PerfeCTa SYBR Green FastMix, ROX; Quanta Biosciences, Gaithersburg, MD, USA) with custom-designed primers (Takara Bio, Dalian, China; Table S1). All genes were quantified by comparison with the internal reference gene glyceraldehyde-3-phosphate dehydrogenase (GAPDH) for standardization. The 2−ΔΔCt method was used to analysis of relative gene expression levels according to a reference previously published [61]. The experiment was repeated three times with three replicate wells for each sample.

4.3.5. Chondrogenic-Related Protein Expressions

ELISA was performed to evaluate the protein levels of COL II, COL X, and COL I secreted by the chondrocytes cultured in varied Mg2+ concentrations. Briefly, chondrocytes were seeded on 6-well plates with a density of 2 × 10⁵ cells/well. After cultured for 24 h, the culture media was replaced with fresh culture media containing different concentrations of Mg2+ (2.5 mM, 5 mM, 7.5 mM, 10 mM, 12.5 mM, 15 mM, 17.5 mM, and 20 mM). After cultured for 7 days and 14 days, the supernatant was collected and centrifuged at 3000 rpm for 10 min at 4 °C, then stored at −80 °C for use. ELISA was performed according to the manufacturer’s protocol. The absorbance of each sample was detected using a microplate reader at the wavelength of 450 nm. Protein concentrations were calculated using a standard curve according to the instructions.

4.3.6. Inflammatory-Related Gene Expressions

The effect of Mg2+ concentration on inflammatory-related gene expressions (IL-1β, MMP13, ADAMTS5, TIMP3, and HIF-1α) of chondrocytes was also evaluated by real-time quantitative PCR technique. We built the chondrocytes inflammatory models by the lipopolysaccharide (LPS)-induced method. Briefly, chondrocytes were seeded on 6-well plates with a density of 2 × 10⁵ cells/well. After cultured for 24 h, the culture media was replaced with fresh culture media containing different concentrations of Mg2+ (5 mM, 7.5 mM, 10 mM, 12.5 mM, 15 mM, 17.5 mM) and 10 μg/mL of LPS. The real-time quantitative PCR technique was used after being cultured for 24 h. The specific experimental process was the same as that in Section 4.3.4.

4.4. Effects of Mg2+ Concentration on the MC3T3-E1 Cells

4.4.1. Cell Proliferation

MC3T3-E1 cells (1.5×10³) were seeded in 96-well plates with 100 μL of high-glucose DMEM medium (with the concentration of Mg2+ being 0.8 mM). Every Mg2+ concentration (2.5 mM, 5.0 mM, 7.5 mM, 10.0 mM, 15.0 mM, 20.0 mM, 30.0 mM, 60.0 mM, and 90.0 mM) was repeated five parallel experiments. The proliferation of MC3T3-E1 cells was assessed by the CCK-8 method and the OD values were recorded for the first, third, fifth, and seventh day, respectively. The specific experimental process was the same as that in Section 4.3.1.

4.4.2. Cell Activity

The effect of Mg2+ concentrations on MC3T3-E1 activity was assessed by the live/dead staining method as described in Section 4.3.2. Ultrahigh concentrations of Mg2+ groups (60.0 mM and 90.0 mM) were excluded.

4.4.3. Cell Morphology

The effect of Mg2+ concentration on MC3T3-E1 morphology was assessed via the FITC-phalloidin and DAPI staining method as that in Section 4.3.3. Ultrahigh concentrations of Mg2+ groups (60.0 mM and 90.0 mM) were excluded.

4.4.4. Osteogenic-Related Gene Expressions

Osteogenic-related gene expressions of collagen type-I, RUNX2, ALP, OCN, and OPN were measured by real-time quantitative PCR technique. Briefly, MC3T3-E1 cells were seeded on 6-well plates with a density of 2 × 10⁵ cells/well. After cultured for 24 h, the culture media was replaced with osteogenic induction medium (supplemented with 50 μg/mL of ascorbic acid, 5 mM of beta-sodium glycerophosphate, and 10 nM of dexamethasone) containing different concentrations of Mg2+ (2.5 mM, 5 mM, 7.5 mM, 10 mM, 12.5 mM, 15 mM, 17.5 mM, 20 mM). The real-time quantitative PCR technique was used as described in Section 4.3.4 after being cultured for 7 days.

4.4.5. The Protein Expressions of COL Ⅰ

The protein amounts of COL Ⅰ of MC3T3-E1 cultured in varied Mg2+ concentrations for 7 days were measured by ELISA. Briefly, MC3T3-E1 cells were seeded on 6-well plates with a density of 2 × 10⁵ cells/well. After cultured for 24 h, the culture media was replaced with osteogenic induction medium containing different concentrations of Mg2+ (2.5 mM, 5 mM, 7.5 mM, 10 mM, 12.5 mM, 15 mM, 17.5 mM, and 20 mM). After cultured for 7 days, the supernatant was collected and centrifuged at 3000 rpm for 10 min at 4 °C, then stored at −80 °C for use. The specific experimental process of ELISA was the same as that in Section 4.3.5.

4.4.6. ALP Activity

The effect of Mg2+ concentration on the ALP activity of MC3T3-E1 was assessed by the quantitative Alkaline Phosphatase Assay kit and BCIP/NBT ALP Chromogenic Kit. MC3T3-E1 cells were seeded on 12-well plates with a density of 1.5 × 10⁴ cells/well. After cultured for 24 h, the culture media was replaced with osteogenic induction medium containing different concentrations of Mg2+ (2.5 mM, 5 mM, 7.5 mM, 10 mM, 12.5 mM, 15 mM, 17.5 mM, 20 mM). The high-glucose DMEM group was also cultured as the control group. The culture medium was updated every two days and the ALP activity was measured according to commercial kit instructions at the seventh day.

4.4.7. Calcium Nodules Formation

The effect of Mg2+ concentration on calcium nodule formation of MC3T3-E1 was assessed by the alizarin red staining method. Briefly, MC3T3-E1 cells were seeded on 6-well plates with a density of 2 × 10⁵ cells/well. After cultured for 24 h, the culture media was replaced with osteogenic induction medium containing different concentrations of Mg2+ (2.5 mM, 5 mM, 7.5 mM, 10 mM, 12.5 mM, 15 mM, 17.5 mM, 20 mM). After being cultured for 21 days, the alizarin red staining method was used to detect the formation of calcium nodules.

4.5. Statistical Analysis

All the quantitative data were presented as mean ± standard deviation. Statistical Product and Service Solutions 23.0 software (SPSS, Chicago, IL, USA) was used to calculate the statistical analysis. Statistical differences of experimental results were analyzed using one-way analysis of variance (ANOVA) with Tukey’s HSD post-hoc test. Differences were considered as statistically significant at p < 0.05. The data were indicated with (*) for p < 0.05, (**) for p < 0.01, and (***) for p < 0.001, respectively. All the experiments were repeated at least three times with five replicate wells (CCK-8) of three replicate wells (PCR, ELISA, and ALP activity) for each group.

5. Conclusions

In summary, we have provided a systematic assessment of the effect of Mg2+ concentration on the cell proliferation and gene and protein expression of chondrocytes and osteoblasts simultaneously. The chondrocytes extracted from New Zealand rabbit could be promoted proliferation in the additional 1.25–10 mM Mg2+ supplied culture medium, while MC3T3-E1 cells could be promoted proliferation at the Mg2+ supplied concentration range of 2.5–30 mM. These results indicate that although chondroctytes need a lower concentration of Mg2+, it is still deficient in the physiological condition, especially for the osteochondral site where no blood supply provides additional Mg2+ for the promoting of chondral repair physiologically, while although the proliferation of osteoblast need more of Mg2+, it could be recruited from the neighbour sites within the bone tissues that harbour the most abundant amount of Mg2+ in the body. For the chondrocytes, the provided additional Mg2+ promotes the gene expression of SOX9 (in the Mg2+ concentration range of 12.5–17.5mM), Col II (12.5–20 mM), AGC (12.5–20 mM), while it also shows a tendency to promote the expression of Col X and Col I, especially at the concentration of 10 mM of Mg2+. The addition of Mg2+ also show a bonus effect on the inhibitory of inflame in the concentration ranges 5–17.5 mM, 5–7.5 mM, and 7.5 mM for IL-1β, MMP13, and ADAMTS5 factors, respectively. For the osteoblasts, the osteogenesis genes of ALP, Collagen I, and OCN were up-regulated in the range of Mg2+ concentration in 2.5–10 mM, 5–12.5 mM, and 5–12.5 mM, respectively. The ALP staining and calcium nodules assessment results also demonstrate the providing suitable concentration of Mg2+ could promote the osteogenesis. Although the osteochondral microenvironment is complex in the physiological condition for different joints in different animals and the Mg2+ needing is orchestrating by the exquisite design and functioning of the Nature, understanding the fundamental effect of Mg2+ on the cartilage and bone could definitely provide essential guidelines for the develop new clinical bioactive materials and medical therapeutics that benefits the patients suffering osteochondral diseases.

Supplementary Materials

The following supporting information can be downloaded at: https://www.mdpi.com/article/10.3390/biomimetics7040227/s1. Figure S1: The morphology of passage one chondrocytes (A) and MC3T3-E1 subclone 4 (B); Figure S2. Chondrocytes activity after cultured in varied Mg2+ concentration for 72h by the Live/Dead staining (A), chondrocytes morphology after cultured in varied Mg2+ concentration for 24h by the FITC-phalloidin and DAPI fluorescence staining (B), the number of dead cells counted from Live/Dead staining (C), scale bar 200 μm; Figure S3. MC3T3-E1 activity after cultured in varied Mg2+ concentration for 72h by the Live/Dead staining (A), MC3T3-E1 morphology after cultured in varied Mg2+ concentration for 24h by the FITC-phalloidin and DAPI fluorescence staining (B), the number of dead cells counted from Live/Dead staining (C), scale bar 200 μm; Table S1: Forward (F) and reverse (R) primers used for quantitative RT-PCR.

Author Contributions

Conceptualization, Z.L. and B.H.; methodology, Z.L. and X.Z.; software, Y.W. and Z.W.; validation, T.T. and Z.W.; investigation, Z.L. and Y.W; data curation, Z.L. and T.T; writing—original draft preparation, Z.L.; writing—review and editing, L.Y. and B.H.; supervision, L.Y. and B.H.; project administration, B.H.; funding acquisition, B.H. All authors have read and agreed to the published version of the manuscript.

Funding

This research was funded by National Natural Science Foundation of China (grant number: 81771041) and China Postdoctoral Science Foundation (grant number: 2021TQ0206, 2021M690105).

Institutional Review Board Statement

All procedures of animals were approved by the Animal Ethics Committee of the School of Stomatology, Jilin University, with permit number 2022295, and were performed following the guides for the Care and Use of Laboratory Animals published by the US National Institutes of Health (8th edition, NIH Publication, 2011).

Data Availability Statement

Not applicable.

Conflicts of Interest

The authors declare that they have no conflict of interest.

References

  1. Gorbachova, T.; Melenevsky, Y.; Cohen, M.; Cerniglia, B.W. Osteochondral lesions of the knee: Differentiating the most common entities at MRI. Radiographics 2018, 38, 1478–1495. [Google Scholar] [CrossRef] [PubMed] [Green Version]
  2. Tateiwa, D.; Yoshikawa, H.; Kaito, T. Cartilage and Bone Destruction in Arthritis: Pathogenesis and Treatment Strategy: A Literature Review. Cells 2019, 8, 818. [Google Scholar] [CrossRef] [PubMed] [Green Version]
  3. Mountziaris, P.M.; Kramer, P.R.; Mikos, A.G. Emerging intra-articular drug delivery systems for the temporomandibular joint. Methods 2009, 47, 134–140. [Google Scholar] [CrossRef] [PubMed] [Green Version]
  4. Chui, K.; Jeys, L.; Snow, M. Knee salvage procedures: The indications, techniques and outcomes of large osteochondral allografts. World J. Orthop. 2015, 6, 340–350. [Google Scholar] [CrossRef]
  5. D’Ambrosi, R.; Maccario, C.; Serra, N.; Ursino, C.; Usuelli, F.G. Relationship between symptomatic osteochondral lesions of the talus and quality of life, body mass index, age, size and anatomic location. Foot Ankle Surg. 2018, 24, 365–372. [Google Scholar] [CrossRef]
  6. Behery, O.; Siston, R.A.; Harris, J.D.; Flanigan, D.C. Treatment of cartilage defects of the knee: Expanding on the existing algorithm. Clin. J. Sport Med. 2014, 24, 21–30. [Google Scholar] [CrossRef] [Green Version]
  7. Seo, S.G.; Kim, J.S.; Seo, D.-K.; Kim, Y.K.; Lee, S.-H.; Lee, H.S. Osteochondral lesions of the talus: Few patients require surgery. Acta Orthop. 2018, 89, 462–467. [Google Scholar] [CrossRef] [Green Version]
  8. Kan, H.S.; Chan, P.K.; Chiu, K.Y.; Yan, C.H.; Yeung, S.S.; Ng, Y.L.; Shiu, K.W.; Ho, T. Non-surgical treatment of knee osteoarthritis. Hong Kong Med. J. 2019, 25, 127–133. [Google Scholar] [CrossRef]
  9. Rodriguez-Merchan, E.C. The treatment of cartilage defects in the knee joint: Microfracture, mosaicplasty, and autologous chondrocyte implantation. Am. J. Orthop Belle Mead NJ 2012, 41, 236–239. [Google Scholar]
  10. Schinhan, M.; Gruber, M.; Dorotka, R.; Pilz, M.; Stelzeneder, D.; Chiari, C.; Rossler, N.; Windhager, R.; Nehrer, S. Matrix-associated autologous chondrocyte transplantation in a compartmentalized early stage of osteoarthritis. Osteoarthr. Cartil. 2013, 21, 217–225. [Google Scholar] [CrossRef] [Green Version]
  11. Jevsevar, D.S. Treatment of osteoarthritis of the knee: Evidence-based guideline, 2nd edition. J. Am. Acad. Orthop Surg. 2013, 21, 571–576. [Google Scholar] [CrossRef] [PubMed]
  12. Armiento, A.R.; Alini, M.; Stoddart, M.J. Articular fibrocartilage—Why does hyaline cartilage fail to repair? Adv. Drug Deliv. Rev. 2019, 146, 289–305. [Google Scholar] [CrossRef] [PubMed]
  13. Zhu, G.; Zhang, T.; Chen, M.; Yao, K.; Huang, X.; Zhang, B.; Li, Y.; Liu, J.; Wang, Y.; Zhao, Z. Bone physiological microenvironment and healing mechanism: Basis for future bone-tissue engineering scaffolds. Bioact. Mater. 2021, 6, 4110–4140. [Google Scholar] [CrossRef] [PubMed]
  14. Bigham, A.; Foroughi, F.; Ghomi, E.R.; Rafienia, M.; Neisiany, R.E.; Ramakrishna, S. The journey of multifunctional bone scaffolds fabricated from traditional toward modern techniques. Bio. Des. Manuf. 2020, 3, 281–306. [Google Scholar] [CrossRef]
  15. Shields, L.B.; Raque, G.H.; Glassman, S.D.; Campbell, M.; Vitaz, T.; Harpring, J.; Shields, C.B. Adverse effects associated with high-dose recombinant human bone morphogenetic protein-2 use in anterior cervical spine fusion. Spine 2006, 31, 542–547. [Google Scholar] [CrossRef]
  16. Boraiah, S.; Paul, O.; Hawkes, D.; Wickham, M.; Lorich, D.G. Complications of recombinant human BMP-2 for treating complex tibial plateau fractures: A preliminary report. Clin. Orthop. Relat. Res. 2009, 467, 3257–3262. [Google Scholar] [CrossRef] [PubMed] [Green Version]
  17. Luca, L.; Rougemont, A.L.; Walpoth, B.H.; Gurny, R.; Jordan, O. The effects of carrier nature and pH on rhBMP-2-induced ectopic bone formation. J. Control. Release 2010, 147, 38–44. [Google Scholar] [CrossRef]
  18. van der Kraan, P.M. The changing role of TGFbeta in healthy, ageing and osteoarthritic joints. Nat. Rev. Rheumatol. 2017, 13, 155–163. [Google Scholar] [CrossRef]
  19. Bose, S.; Fielding, G.; Tarafder, S.; Bandyopadhyay, A. Understanding of dopant-induced osteogenesis and angiogenesis in calcium phosphate ceramics. Trends Biotechnol. 2013, 31, 594–605. [Google Scholar] [CrossRef] [Green Version]
  20. Li, M.; Yin, H.; Yan, Z.; Li, H.; Wu, J.; Wang, Y.; Wei, F.; Tian, G.; Ning, C.; Li, H.; et al. The immune microenvironment in cartilage injury and repair. Acta Biomater. 2022, 140, 23–42. [Google Scholar] [CrossRef]
  21. Grober, U.; Schmidt, J.; Kisters, K. Magnesium in Prevention and Therapy. Nutrients 2015, 7, 8199–8226. [Google Scholar] [CrossRef]
  22. Rondanelli, M.; Faliva, M.A.; Tartara, A.; Gasparri, C.; Perna, S.; Infantino, V.; Riva, A.; Petrangolini, G.; Peroni, G. An update on magnesium and bone health. Biometals 2021, 34, 715–736. [Google Scholar] [CrossRef]
  23. Yao, H.; Xu, J.K.; Zheng, N.Y.; Wang, J.L.; Mok, S.W.; Lee, Y.W.; Shi, L.; Wang, J.Y.; Yue, J.; Yung, S.H.; et al. Intra-articular injection of magnesium chloride attenuates osteoarthritis progression in rats. Osteoarthr. Cartil. 2019, 27, 1811–1821. [Google Scholar] [CrossRef]
  24. Zhang, Y.; Xu, J.; Qin, L.; Jiang, Q. Magnesium and osteoarthritis: From a new perspective. Ann. Jt. 2016, 1, 1–13. [Google Scholar] [CrossRef]
  25. Gruber, H.E.; Ingram, J.; Norton, H.J.; Wei, L.Y.; Frausto, A.; Mills, B.G.; Rude, R.K. Alterations in growth plate and articular cartilage morphology are associated with reduced SOX9 localization in the magnesium-deficient rat. Biotech Histochem. 2004, 79, 45–52. [Google Scholar] [CrossRef]
  26. Medzhitov, R. The spectrum of inflammatory responses. Science 2021, 374, 1070–1075. [Google Scholar] [CrossRef]
  27. Feyerabend, F.; Witte, F.; Kammal, M.; Willumeit, R. Unphysiologically high magnesium concentrations support chondrocyte proliferation and redifferentiation. Tissue Eng. 2006, 12, 3545–3556. [Google Scholar] [CrossRef]
  28. Dou, Y.; Li, N.; Zheng, Y.; Ge, Z. Effects of fluctuant magnesium concentration on phenotype of the primary chondrocytes. J. Biomed. Mater. Res. A 2014, 102, 4455–4463. [Google Scholar] [CrossRef]
  29. Kim, J.A.; Yun, H.-s.; Choi, Y.-A.; Kim, J.-E.; Choi, S.-Y.; Kwon, T.-G.; Kim, Y.K.; Kwon, T.-Y.; Bae, M.A.; Kim, N.J. Magnesium phosphate ceramics incorporating a novel indene compound promote osteoblast differentiation in vitro and bone regeneration in vivo. Biomaterials 2018, 157, 51–61. [Google Scholar] [CrossRef]
  30. Rubin, A.; Terasaki, M.; Sanui, H. Major intracellular cations and growth control: Correspondence among magnesium content, protein synthesis, and the onset of DNA synthesis in BALB/c3T3 cells. Proc. Natl. Acad. Sci. USA 1979, 76, 3917–3921. [Google Scholar] [CrossRef] [Green Version]
  31. Rubin, H. Central roles of Mg2+ and MgATP2- in the regulation of protein synthesis and cell proliferation: Significance for neoplastic transformation. Adv. Cancer Res. 2005, 93, 1–58. [Google Scholar] [CrossRef] [PubMed]
  32. Wolf, F.I.; Cittadini, A. Magnesium in cell proliferation and differentiation. Front. Biosci. 1999, 4, 607–617. [Google Scholar] [CrossRef] [PubMed] [Green Version]
  33. de Baaij, J.H.; Hoenderop, J.G.; Bindels, R.J. Magnesium in man: Implications for health and disease. Physiol. Rev. 2015, 95, 1–46. [Google Scholar] [CrossRef] [PubMed]
  34. Zhen, Z.; Liu, X.; Huang, T.; Xi, T.; Zheng, Y. Hemolysis and cytotoxicity mechanisms of biodegradable magnesium and its alloys. Mater Sci. Eng. C Mater Biol. Appl. 2015, 46, 202–206. [Google Scholar] [CrossRef] [PubMed]
  35. Bush, P.G.; Parisinos, C.A.; Hall, A.C. The osmotic sensitivity of rat growth plate chondrocytes in situ; clarifying the mechanisms of hypertrophy. J. Cell Physiol. 2008, 214, 621–629. [Google Scholar] [CrossRef]
  36. Bell, D.M.; Leung, K.K.; Wheatley, S.C.; Ng, L.J.; Zhou, S.; Ling, K.W.; Sham, M.H.; Koopman, P.; Tam, P.P.; Cheah, K.S. SOX9 directly regulates the type-II collagen gene. Nat. Genet. 1997, 16, 174–178. [Google Scholar] [CrossRef]
  37. Ono, N.; Ono, W.; Nagasawa, T.; Kronenberg, H.M. A subset of chondrogenic cells provides early mesenchymal progenitors in growing bones. Nat. Cell Biol. 2014, 16, 1157–1167. [Google Scholar] [CrossRef]
  38. Bielajew, B.J.; Hu, J.C.; Athanasiou, K.A. Collagen: Quantification, biomechanics, and role of minor subtypes in cartilage. Nat. Rev. Mater. 2020, 5, 730–747. [Google Scholar] [CrossRef] [PubMed]
  39. Yue, J.; Jin, S.; Gu, S.; Sun, R.; Liang, Q. High concentration magnesium inhibits extracellular matrix calcification and protects articular cartilage via Erk/autophagy pathway. J. Cell Physiol. 2019, 234, 23190–23201. [Google Scholar] [CrossRef]
  40. Schmid, T.M.; Linsenmayer, T.F. Immunohistochemical localization of short chain cartilage collagen (type X) in avian tissues. J. Cell Biol. 1985, 100, 598–605. [Google Scholar] [CrossRef] [PubMed] [Green Version]
  41. Chan, D.; Jacenko, O. Phenotypic and biochemical consequences of collagen X mutations in mice and humans. Matrix Biol. 1998, 17, 169–184. [Google Scholar] [CrossRef]
  42. Kirsch, T.; Harrison, G.; Golub, E.E.; Nah, H.D. The roles of annexins and types II and X collagen in matrix vesicle-mediated mineralization of growth plate cartilage. J. Biol. Chem. 2000, 275, 35577–35583. [Google Scholar] [CrossRef] [PubMed] [Green Version]
  43. Muir, H. The chondrocyte, architect of cartilage. Biomechanics, structure, function and molecular biology of cartilage matrix macromolecules. Bioessays 1995, 17, 1039–1048. [Google Scholar] [CrossRef] [PubMed]
  44. Jin, G.Z.; Kim, H.W. Efficacy of collagen and alginate hydrogels for the prevention of rat chondrocyte dedifferentiation. J. Tissue Eng. 2018, 9, 2041731418802438. [Google Scholar] [CrossRef] [PubMed] [Green Version]
  45. Charlier, E.; Deroyer, C.; Ciregia, F.; Malaise, O.; Neuville, S.; Plener, Z.; Malaise, M.; de Seny, D. Chondrocyte dedifferentiation and osteoarthritis (OA). Biochem. Pharmacol. 2019, 165, 49–65. [Google Scholar] [CrossRef]
  46. Hao, Z.Y.; Wang, S.; Nie, J.C.; Li, D.C.; Fang, A.O.; Kang, J.F.; Liu, C.Z.; Wang, L. Effects of bionic mechanical stimulation on the properties of engineered cartilage tissue. Bio. Des. Manuf. 2021, 4, 33–43. [Google Scholar] [CrossRef]
  47. Xu, H.Y.; Huang, H.; Zou, X.J.; Xia, P.C.; Foon, W.A.L.S.; Wang, J.W. A novel bio-active microsphere for meniscus regeneration via inducing cell migration and chondrocyte differentiation. Bio. Des. Manuf. 2021, 4, 203–221. [Google Scholar] [CrossRef]
  48. Jin, J.; Lv, X.; Wang, B.; Ren, C.; Jiang, J.; Chen, H.; Chen, X.; Gu, M.; Pan, Z.; Tian, N.; et al. Limonin Inhibits IL-1beta-Induced Inflammation and Catabolism in Chondrocytes and Ameliorates Osteoarthritis by Activating Nrf2. Oxid Med. Cell Longev. 2021, 2021, 7292512. [Google Scholar] [CrossRef]
  49. Chen, R.; Zhou, X.; Yin, S.; Lu, Z.; Nie, J.; Zhou, W.; Liu, X. Study on the protective mechanism of autophagy on cartilage by magnesium sulfate. Zhongguo Xiu Fu Chong Jian Wai Ke Za Zhi 2018, 32, 1340–1345. [Google Scholar] [CrossRef]
  50. Zan, R.; Ji, W.; Qiao, S.; Wu, H.; Wang, W.; Ji, T.; Yang, B.; Zhang, S.; Luo, C.; Song, Y. Biodegradable magnesium implants: A potential scaffold for bone tumor patients. Sci. China Mater. 2021, 64, 1007–1020. [Google Scholar] [CrossRef]
  51. Yamamoto, K.; Okano, H.; Miyagawa, W.; Visse, R.; Shitomi, Y.; Santamaria, S.; Dudhia, J.; Troeberg, L.; Strickland, D.K.; Hirohata, S.; et al. MMP-13 is constitutively produced in human chondrocytes and co-endocytosed with ADAMTS-5 and TIMP-3 by the endocytic receptor LRP1. Matrix Biol. 2016, 56, 57–73. [Google Scholar] [CrossRef] [PubMed]
  52. Suzuki, Y.; Hasegawa, M.; Matsui, Y.; Unno, H.; Iino, T.; Yoshida, T.; Sudo, A. Intra-articular injection of rebamipide prevents articular cartilage degeneration in murine post-traumatic osteoarthritis models. Mod. Rheumatol. 2020, 30, 765–772. [Google Scholar] [CrossRef] [PubMed]
  53. Shu, Y. Activation of Hypoxia Inducible Factor-1α Enhances Articular Cartilage Regeneration; The Chinese University of Hong Kong: Hong Kong, 2016. [Google Scholar]
  54. Zhang, C.; Yang, F.; Cornelia, R.; Tang, W.; Swisher, S.; Kim, H. Hypoxia-inducible factor-1 is a positive regulator of Sox9 activity in femoral head osteonecrosis. Bone 2011, 48, 507–513. [Google Scholar] [CrossRef] [PubMed]
  55. Zhou, N.; Hu, N.; Liao, J.-Y.; Lin, L.-B.; Zhao, C.; Si, W.-K.; Yang, Z.; Yi, S.-X.; Fan, T.-X.; Bao, W. HIF-1α as a regulator of BMP2-induced chondrogenic differentiation, osteogenic differentiation, and endochondral ossification in stem cells. Cell. Physiol. Biochem. 2015, 36, 44–60. [Google Scholar] [CrossRef]
  56. Lu, J.; Peng, Y.; Zou, J.; Wang, J.; Lu, S.; Fu, T.; Jiang, L.; Zhang, C.; Zhang, J. Hypoxia Inducible Factor-1alpha Is a Regulator of Autophagy in Osteoarthritic Chondrocytes. Cartilage 2021, 13, 1030S–1040S. [Google Scholar] [CrossRef]
  57. Bouaziz, W.; Sigaux, J.; Modrowski, D.; Devignes, C.S.; Funck-Brentano, T.; Richette, P.; Ea, H.K.; Provot, S.; Cohen-Solal, M.; Hay, E. Interaction of HIF1alpha and beta-catenin inhibits matrix metalloproteinase 13 expression and prevents cartilage damage in mice. Proc. Natl. Acad. Sci. USA 2016, 113, 5453–5458. [Google Scholar] [CrossRef] [Green Version]
  58. Komori, T. Molecular mechanism of Runx2-dependent bone development. Mol. Cells 2020, 43, 168. [Google Scholar]
  59. Li, Z.; Liu, P.; Yang, T.; Sun, Y.; You, Q.; Li, J.; Wang, Z.; Han, B. Composite poly(l-lactic-acid)/silk fibroin scaffold prepared by electrospinning promotes chondrogenesis for cartilage tissue engineering. J. Biomater. Appl. 2016, 30, 1552–1565. [Google Scholar] [CrossRef]
  60. Zhao, Y.; Huang, Y.; Jia, L.; Wang, R.; Tan, K.; Li, W. A Novel Tension Machine Promotes Bone Marrow Mesenchymal Stem Cell Osteoblastic and Fibroblastic Differentiation by Applying Cyclic Tension. Stem. Cells Int. 2021, 2021, 6647651. [Google Scholar] [CrossRef]
  61. Livak, K.J.; Schmittgen, T.D. Analysis of relative gene expression data using real-time quantitative PCR and the 2(-Delta Delta C(T)) Method. Methods 2001, 25, 402–408. [Google Scholar] [CrossRef]
Figure 1. The proliferation of chondrocytes cultured in varied Mg2+ concentrations from 0.7 mM (Ctrl group) up to 90.0 mM. (A) the CCK-8 quantitative method of the cell proliferation, all data were presented as mean ± SD, * p < 0.05, ** p < 0.01, and *** p < 0.001; (B) digital images of the crystal violet stained chondrocytes cultured in different Mg2+ containing DMEM/F12 medium, scale bar = 1 mm.
Biomimetics 07 00227 g001
Figure 2. Effects of gene expression of chondrocytes cultured in different Mg2+ concentrations on the 7th day (A1,B1,C1,D1,E1) and the 14th day (A2,B2,C2,D2,E2). All data are presented as fold change after normalization to GAPDH, and fold changes are shown as mean ± SD, * p < 0.05, ** p < 0.01, and *** p < 0.001.
Biomimetics 07 00227 g002
Figure 3. Effects of protein contents of chondrocytes cultured in different Mg2+ concentrations on the 7th day (A1,B1,C1) and the 14th day (A2,B2,C2), all data were presented as mean ± SD, * p < 0.05, ** p < 0.01, and *** p < 0.001.
Biomimetics 07 00227 g003
Figure 4. Inflammatory-related gene expressions of chondrocytes that cultured in different concentrations of Mg2+. All data are presented as fold change after normalization to GAPDH, and fold changes are shown as mean ± SD, * p < 0.05, ** p < 0.01, and *** p < 0.001.
Biomimetics 07 00227 g004
Figure 5. The proliferation of MC3T3-E1 cells cultured in varied Mg2+ concentrations from 0.8 mM (Ctrl group) up to 90.0 mM. (A) the CCK-8 quantitative method of the cell proliferation, all data were presented as mean ± SD, * p < 0.05, ** p < 0.01, and *** p < 0.001; (B) digital graphs of the crystal violet stained MC3T3-E1 cells cultured in different Mg2+ containing culture medium, scale bar = 1 mm.
Biomimetics 07 00227 g005
Figure 6. Osteogenic-related gene expressions of MC3T3-E1 cells cultured in different concentrations of Mg2+ (A1A4), all data are presented as fold change after normalization to GAPDH, and fold changes are shown as mean ± SD, *p < 0.05, **p < 0.01, and ***p < 0.001. COL I contents of MC3T3-E1 cells after being cultured in varied Mg2+ concentrations on the 7d by ELISA (B). ALP activity of MC3T3-E1 cells after being cultured in varied Mg2+ concentrations on the 7d by quantitative ALP activity assay (C1) and ALP activity staining assay (C2,C3). Effect of Mg2+ concentrations on the formation of calcium nodules (D1,D2). The scale bars in C2, C3, D1, and D2 are 5 mm, 200 μm, 5 mm, and 200 μm, respectively.
Biomimetics 07 00227 g006
Figure 7. Gradient Mg2+-enriched Microenvironment promotes the formation of Noncalcified cartilage, hypertrophic cartilage and subchondral bone. Appropriate concentrations of Mg2+ also have an anti-inflammatory effect and pro-anabolism effect.
Biomimetics 07 00227 g007
Publisher’s Note: MDPI stays neutral with regard to jurisdictional claims in published maps and institutional affiliations.

