
Effect of Land Use-Land Cover Change on Soil Erosion and Sediment Yield in Muger Sub-Basin, Upper Blue Nile Basin, Ethiopia


Abstract
:1. Introduction
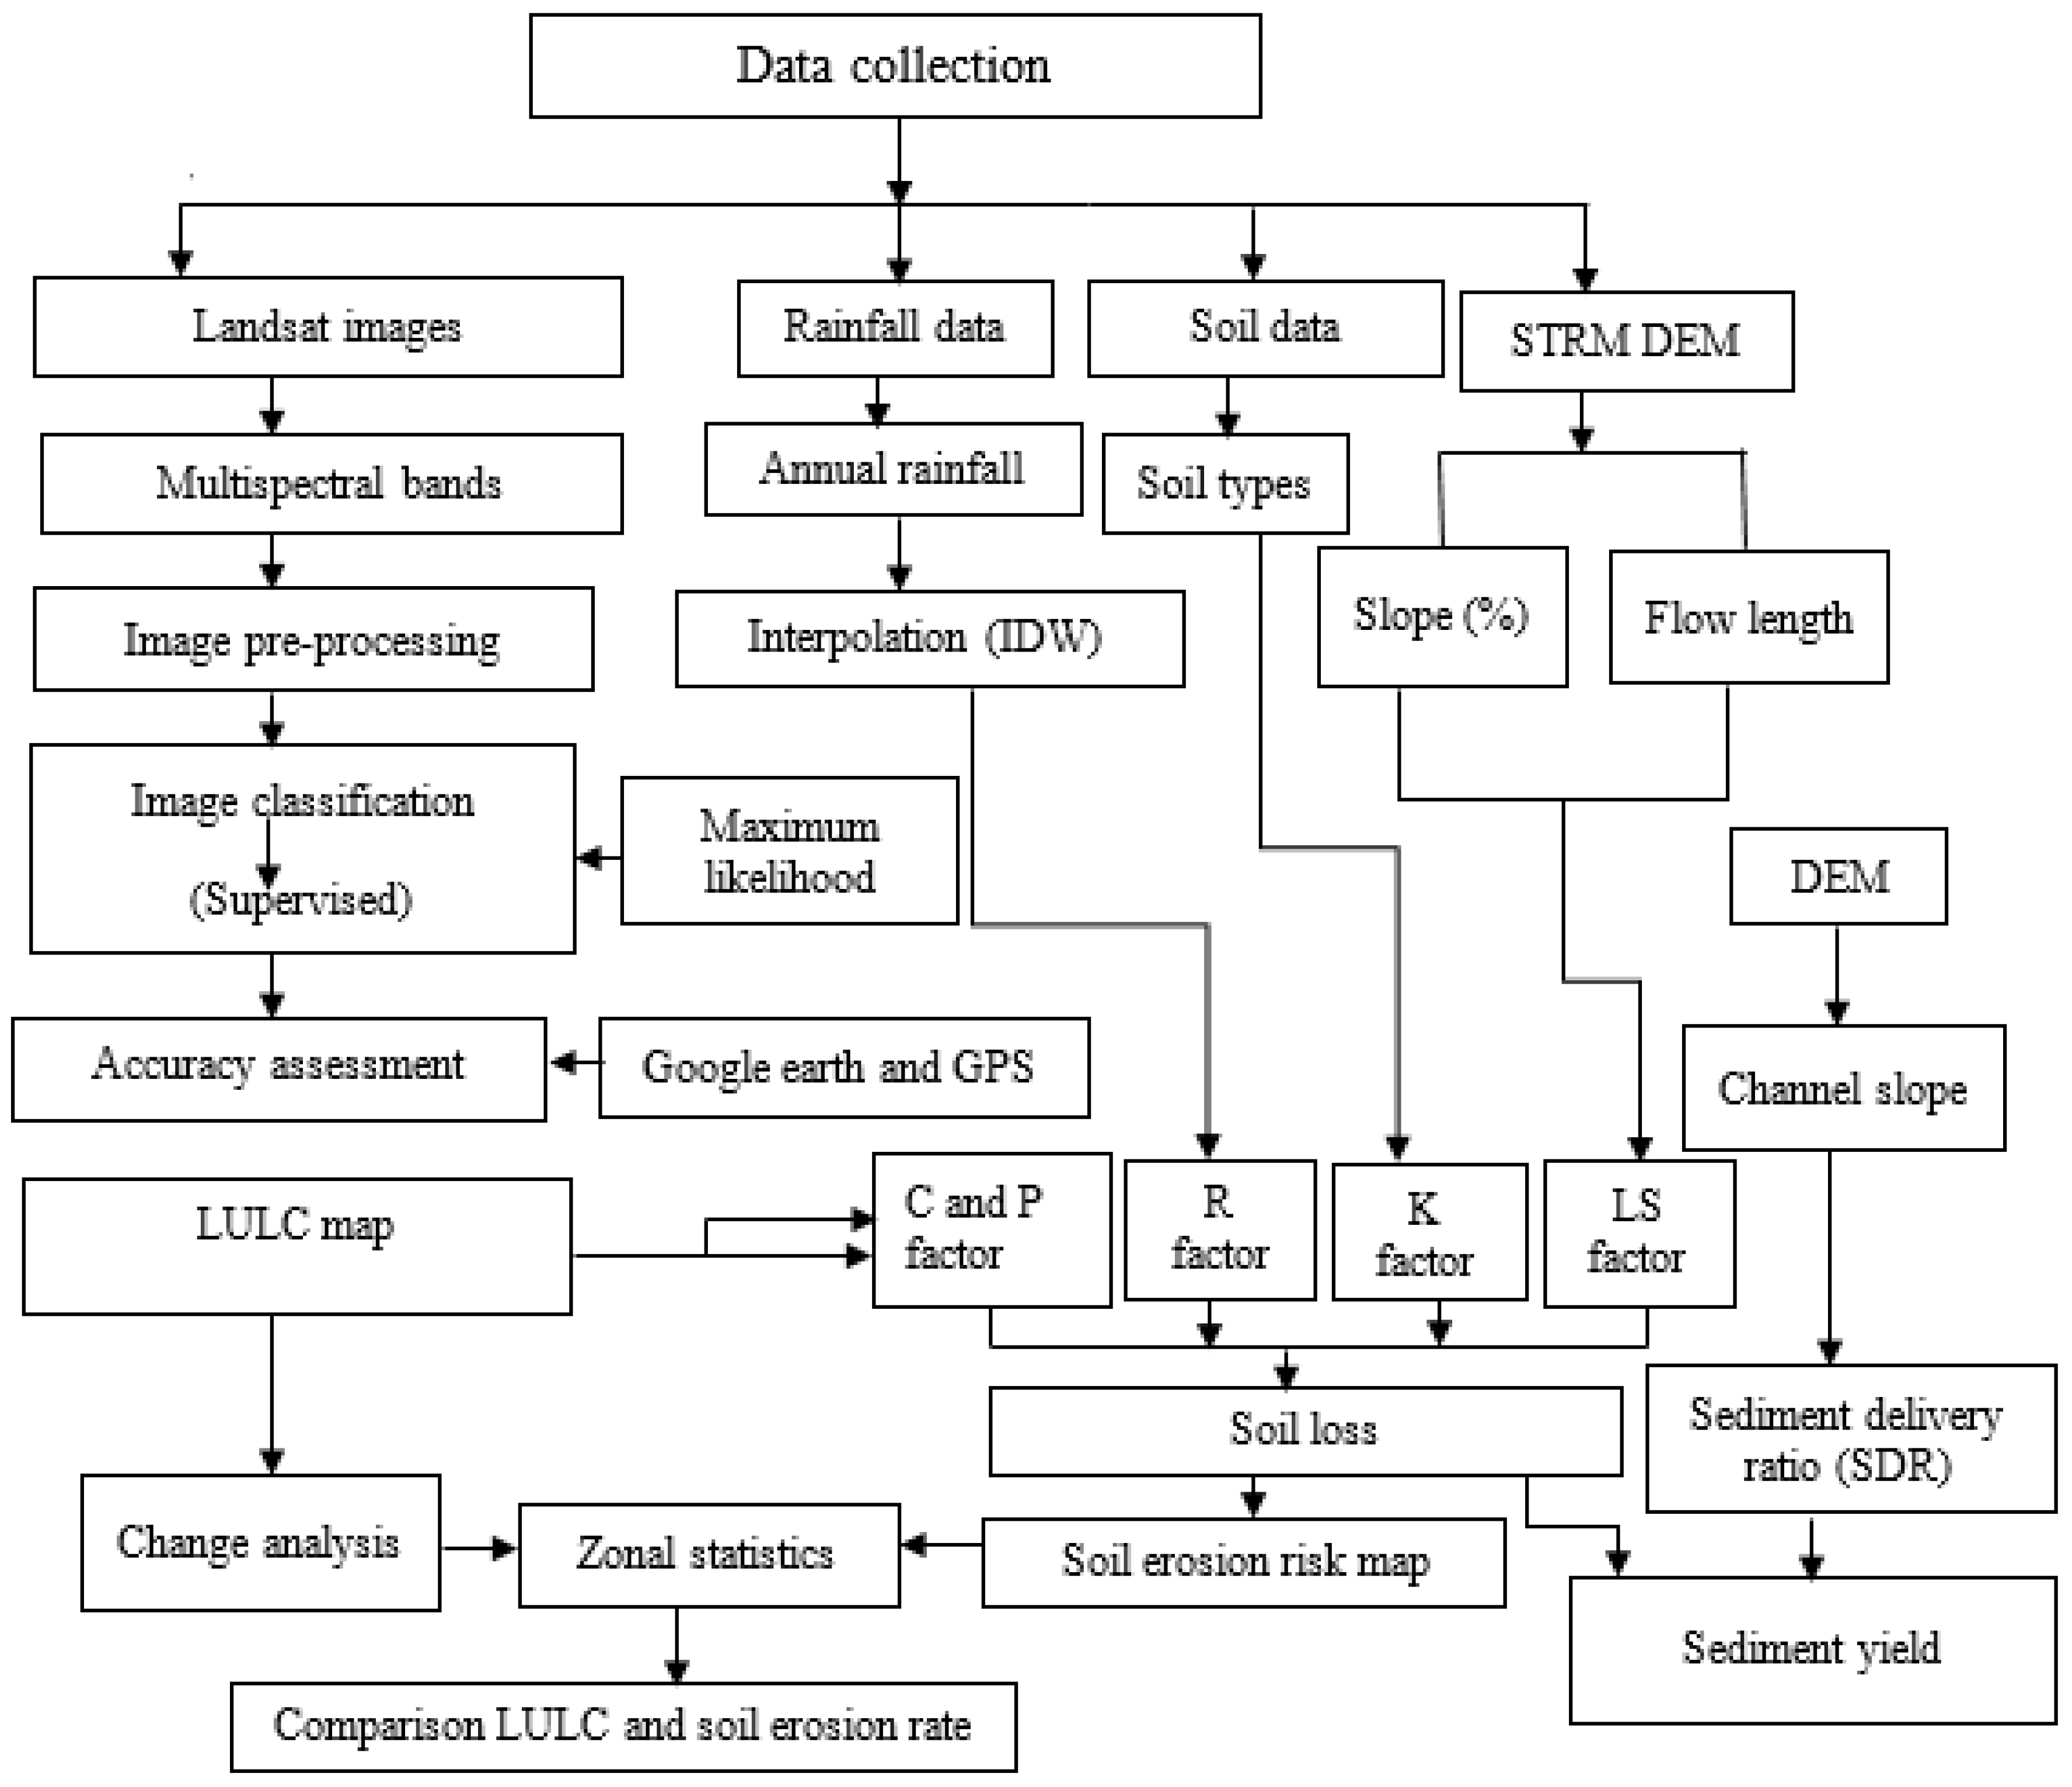
2. Materials and Methods
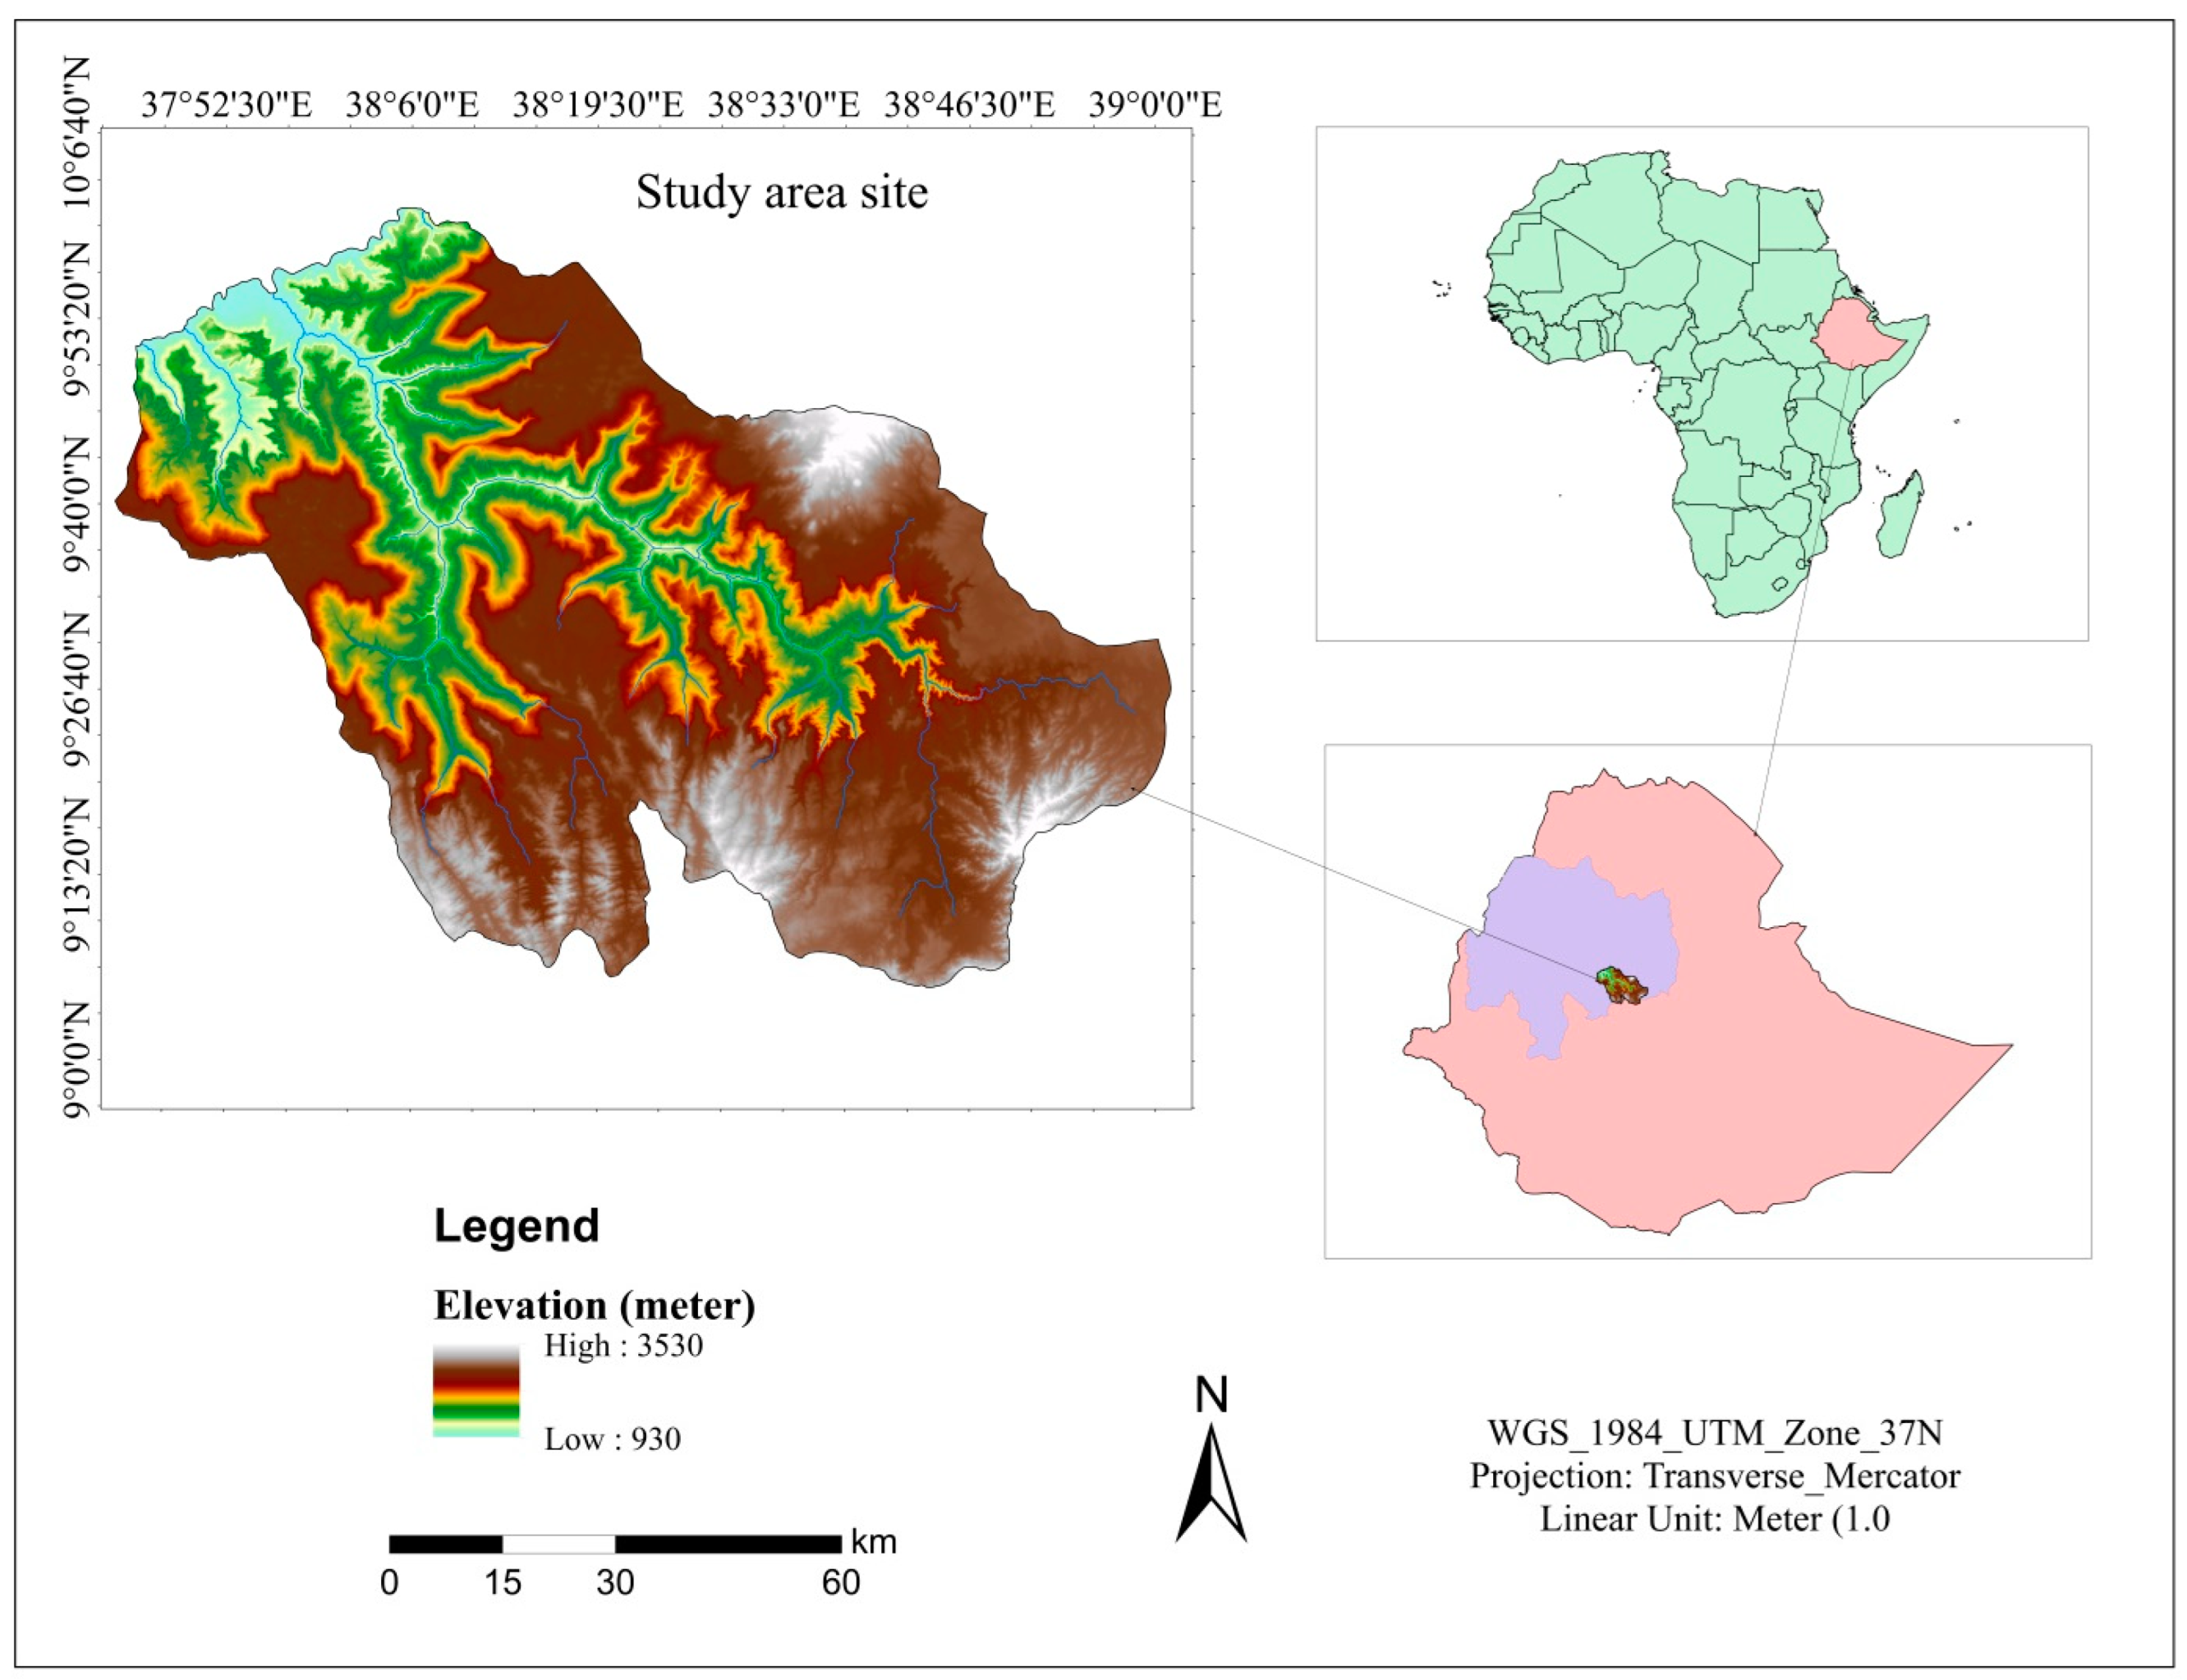
2.1. Study Area Descriptions
2.2. Land Use and Land Cover
2.3. Data Sources and Types
2.4. Soil Loss Estimation Based on RUSLE Model
- R is rainfall runoff erosivity factor (MJ mm ha/year);
- K is soil erodibility factor (ton/ha MJ mm/year);
- LS is slope length and steepness factor;
- C is land cover and management factor, and
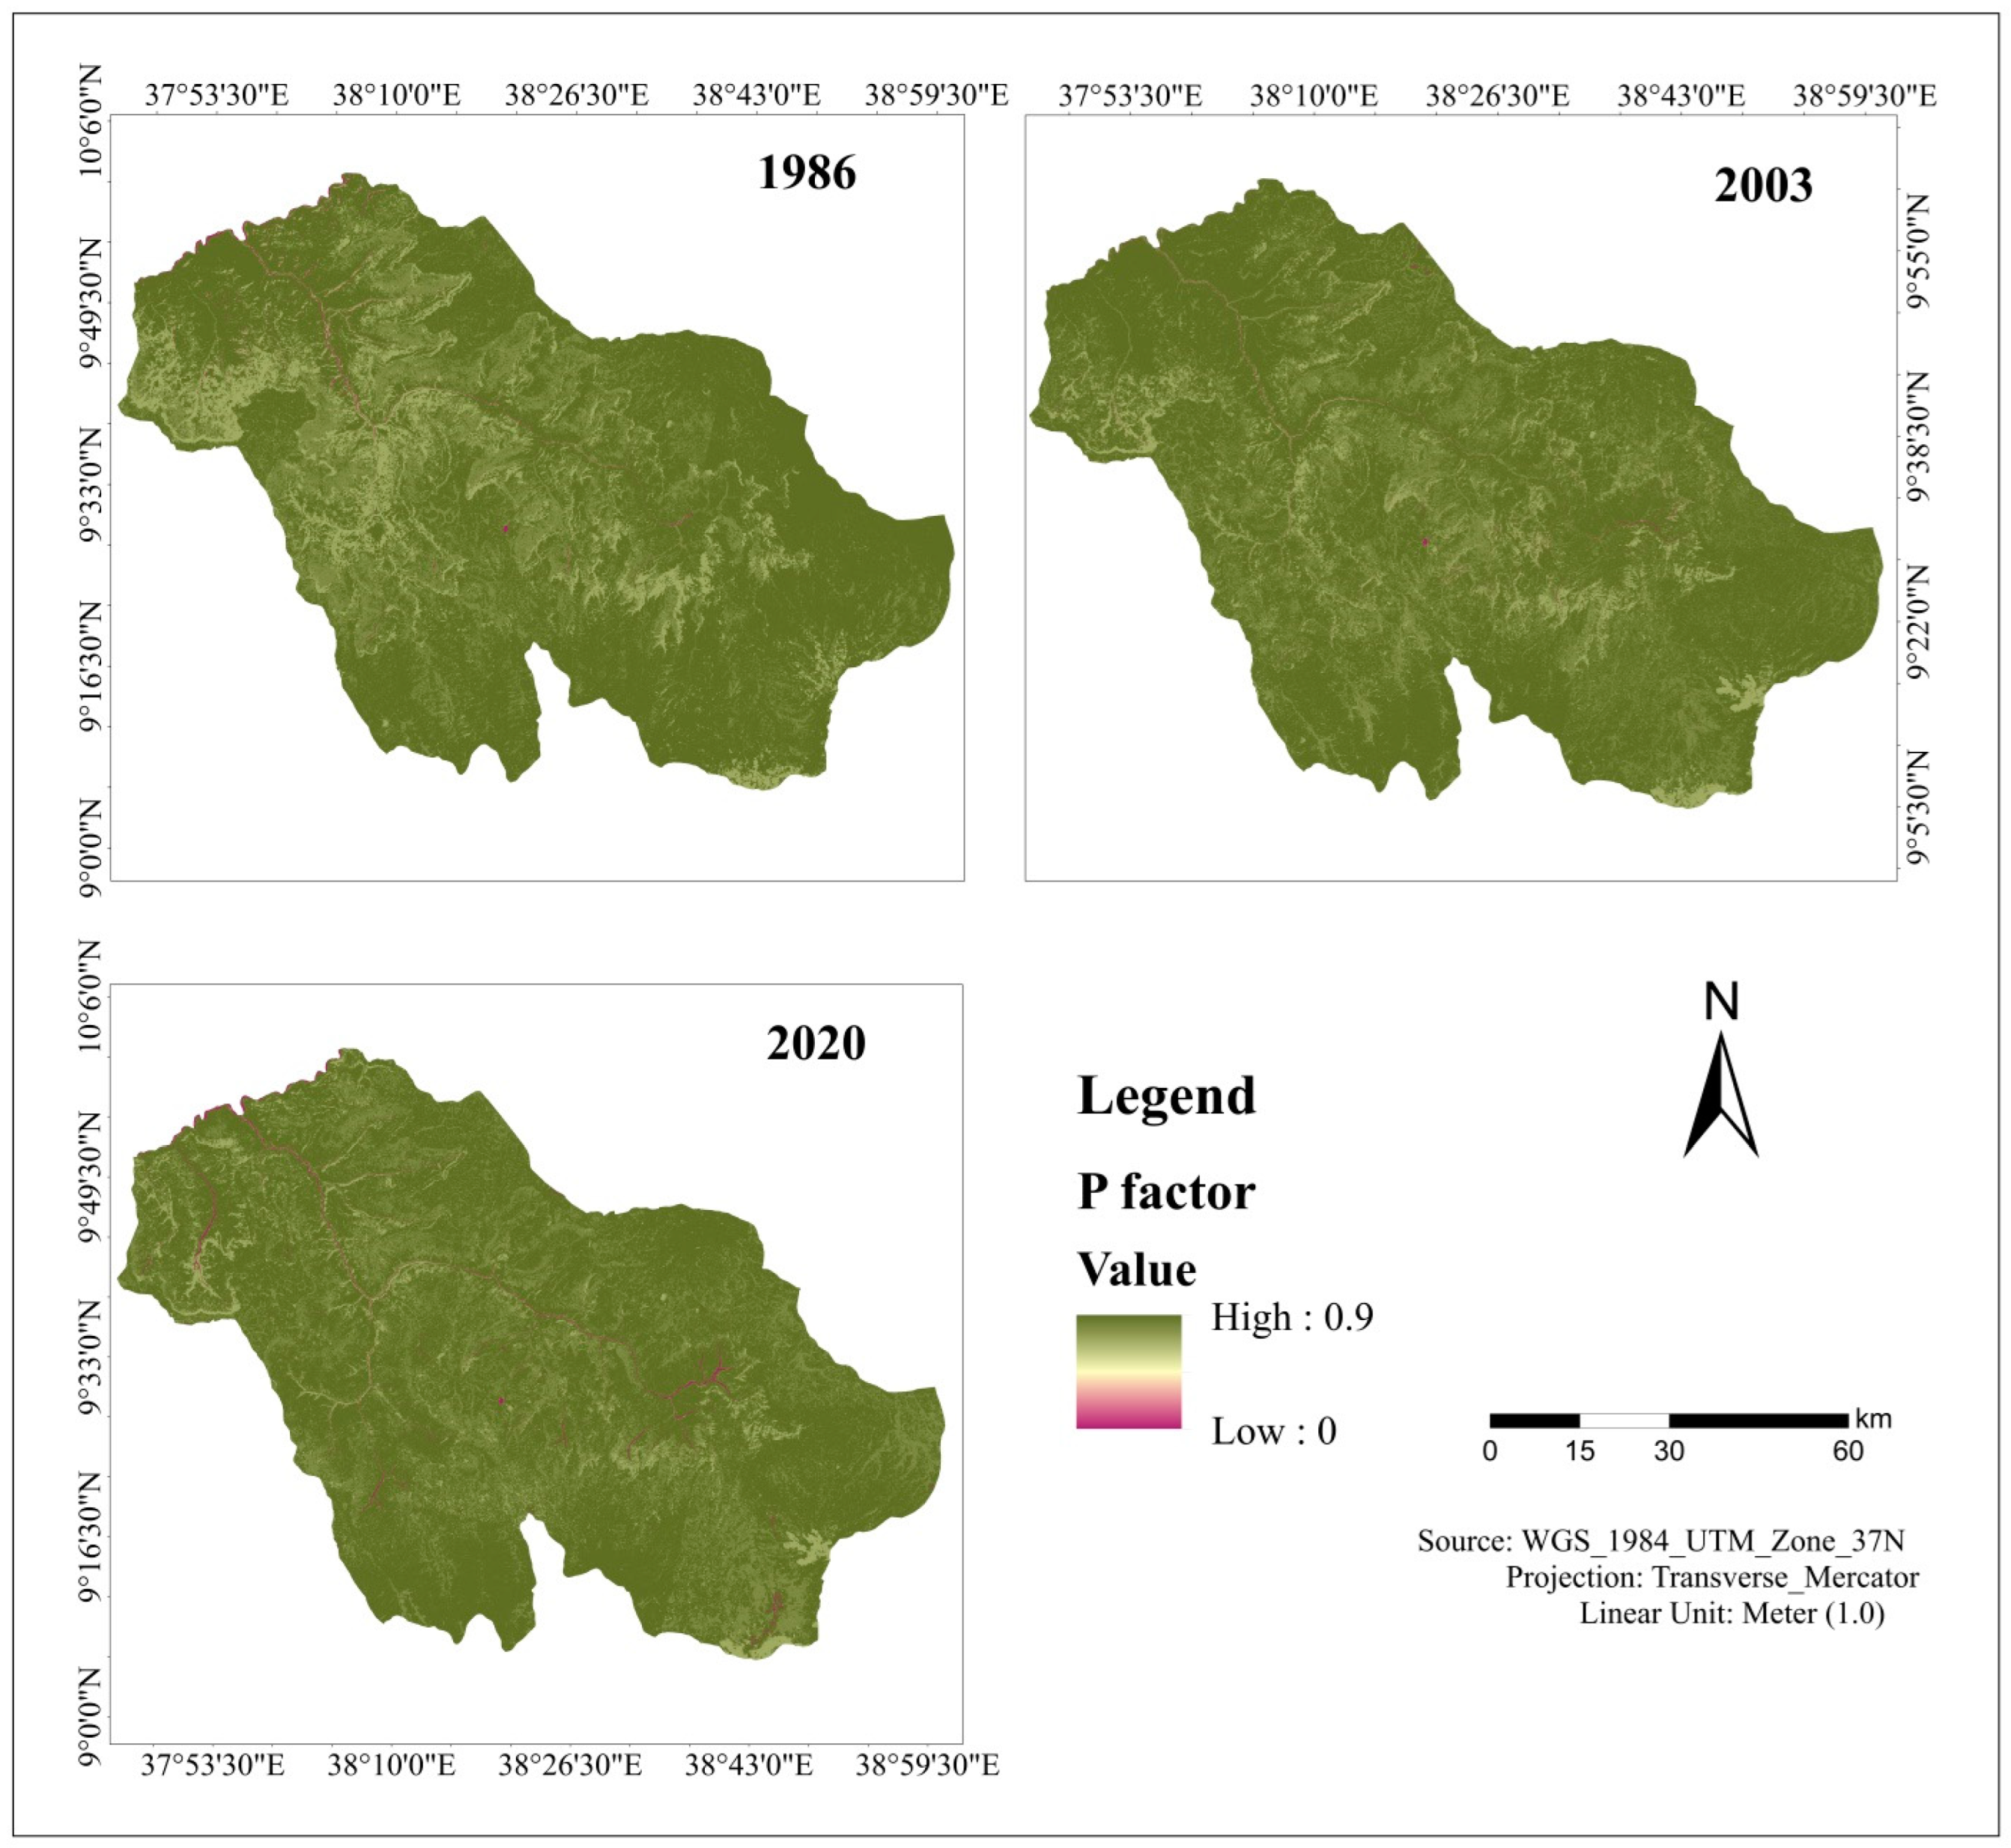
- P is conservation practice factors.
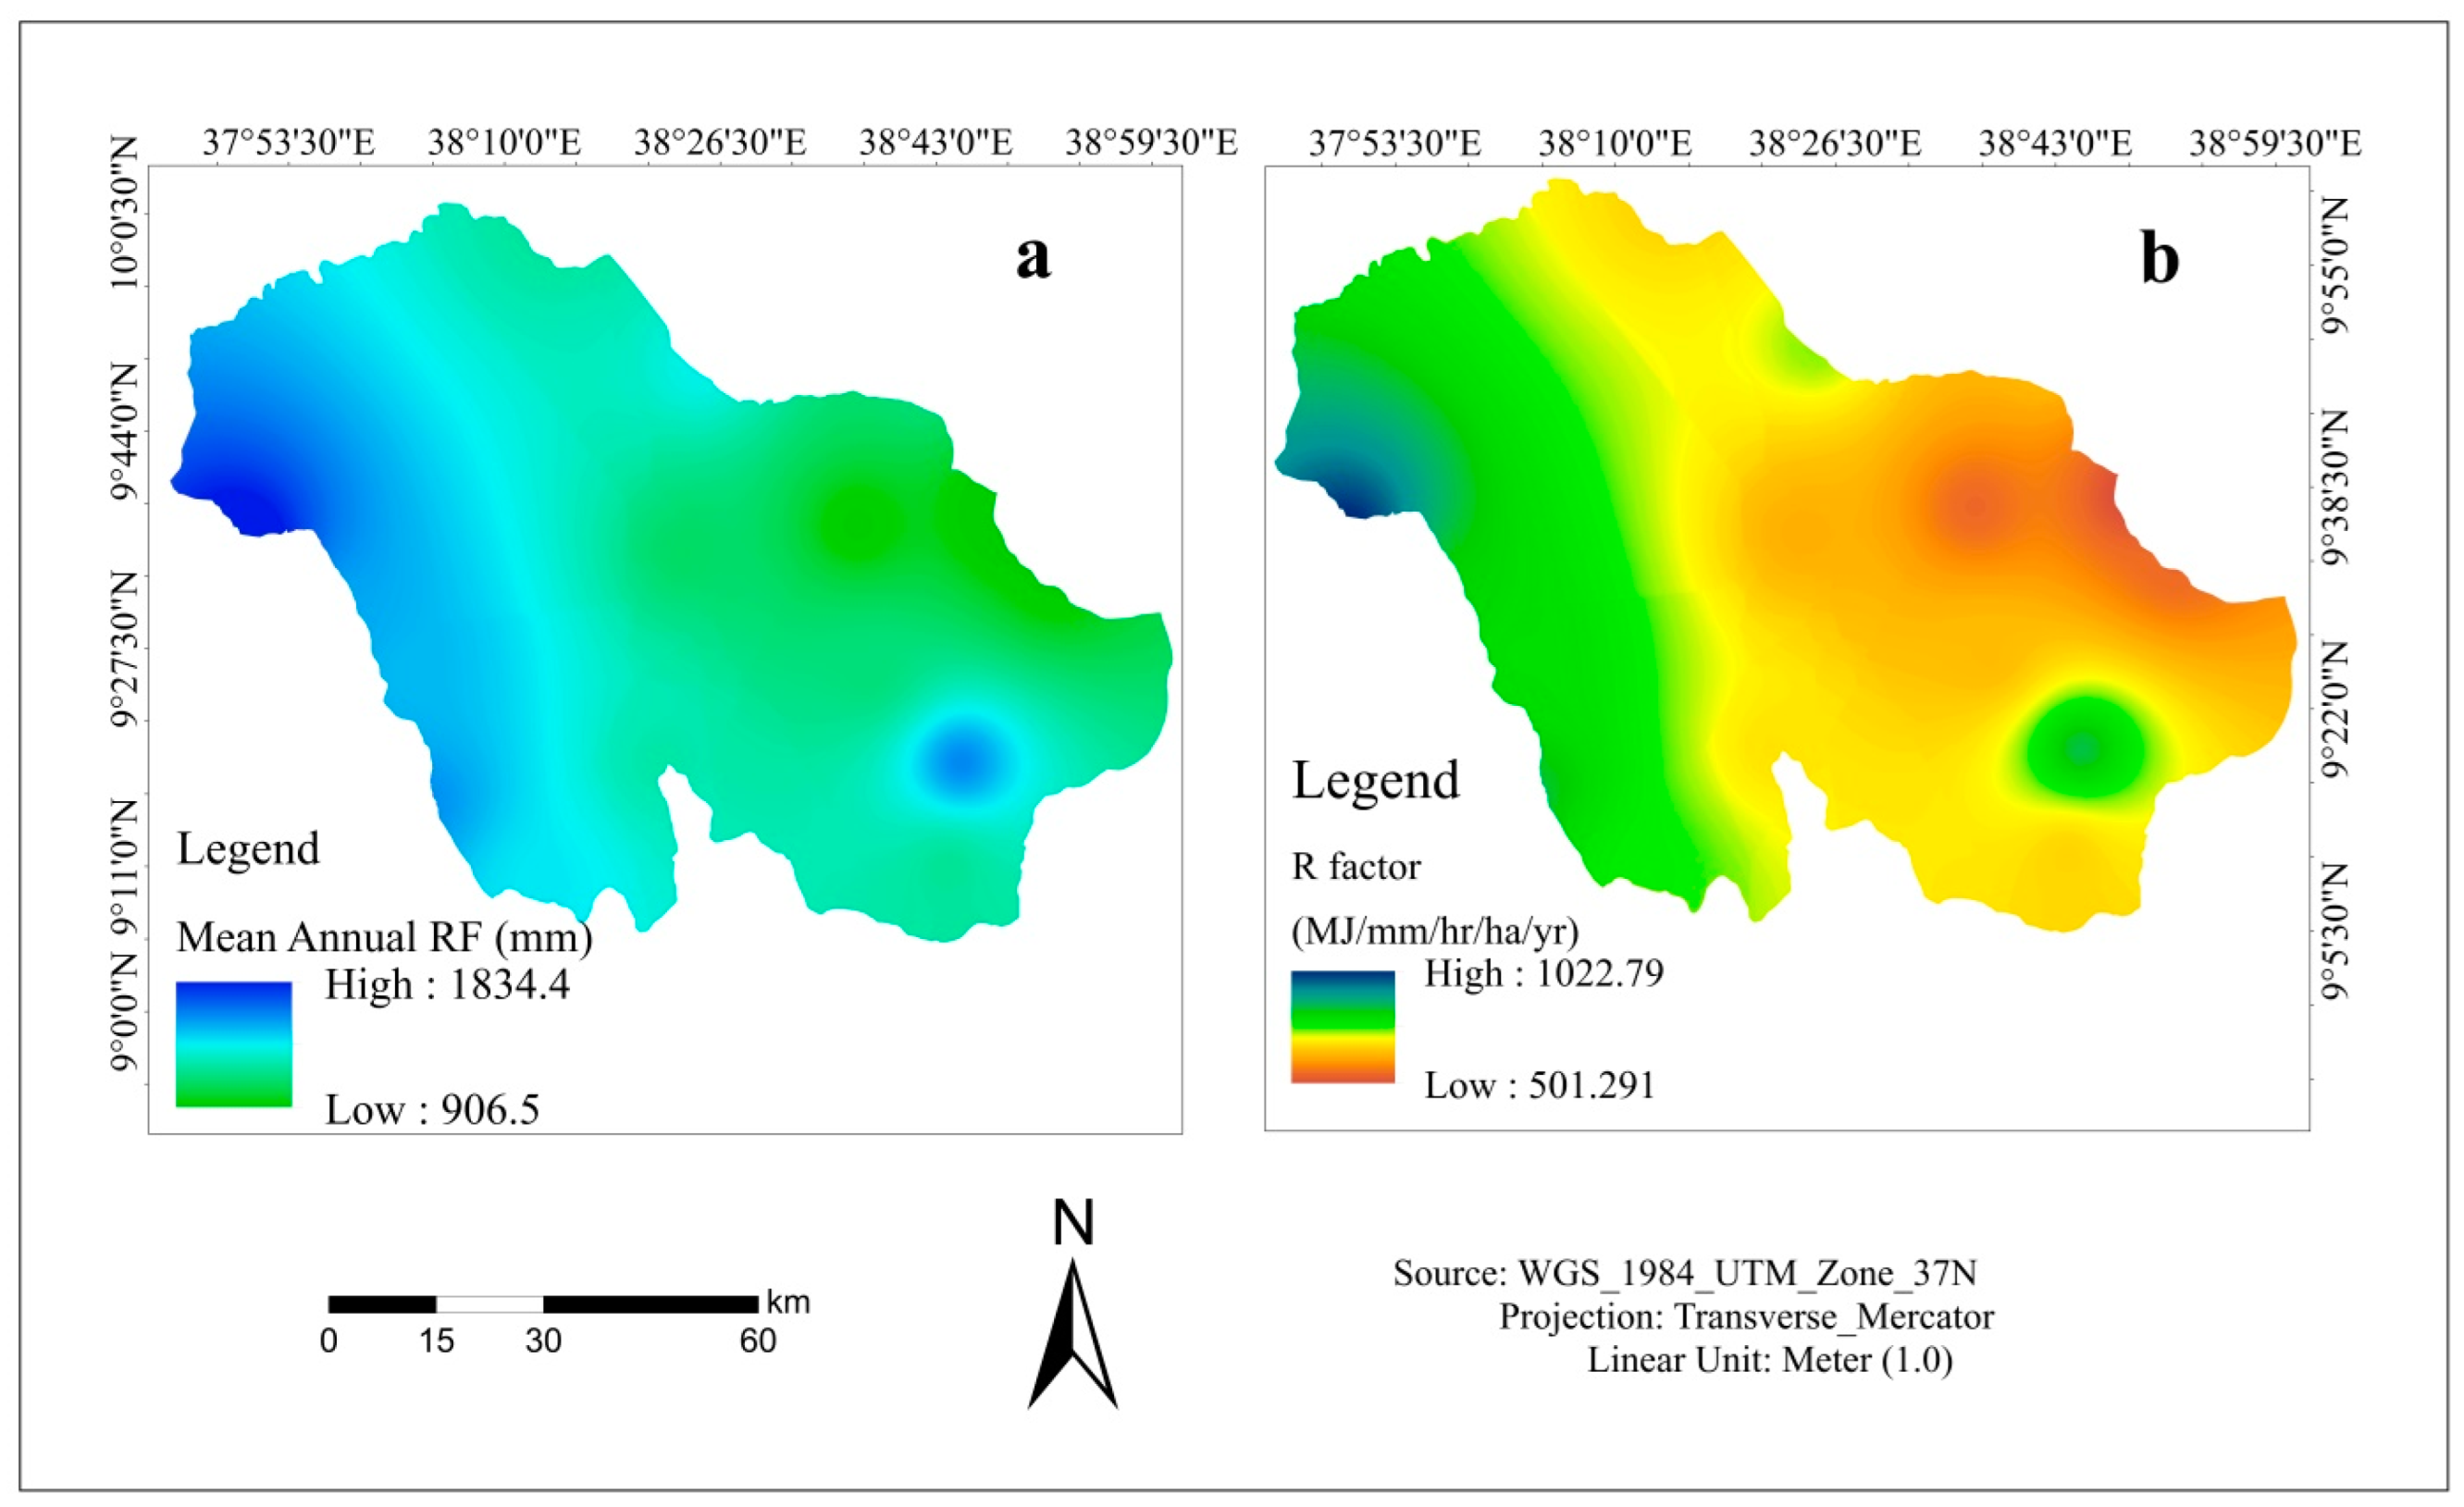
2.4.1. Rainfall Erosivity (R) Factor
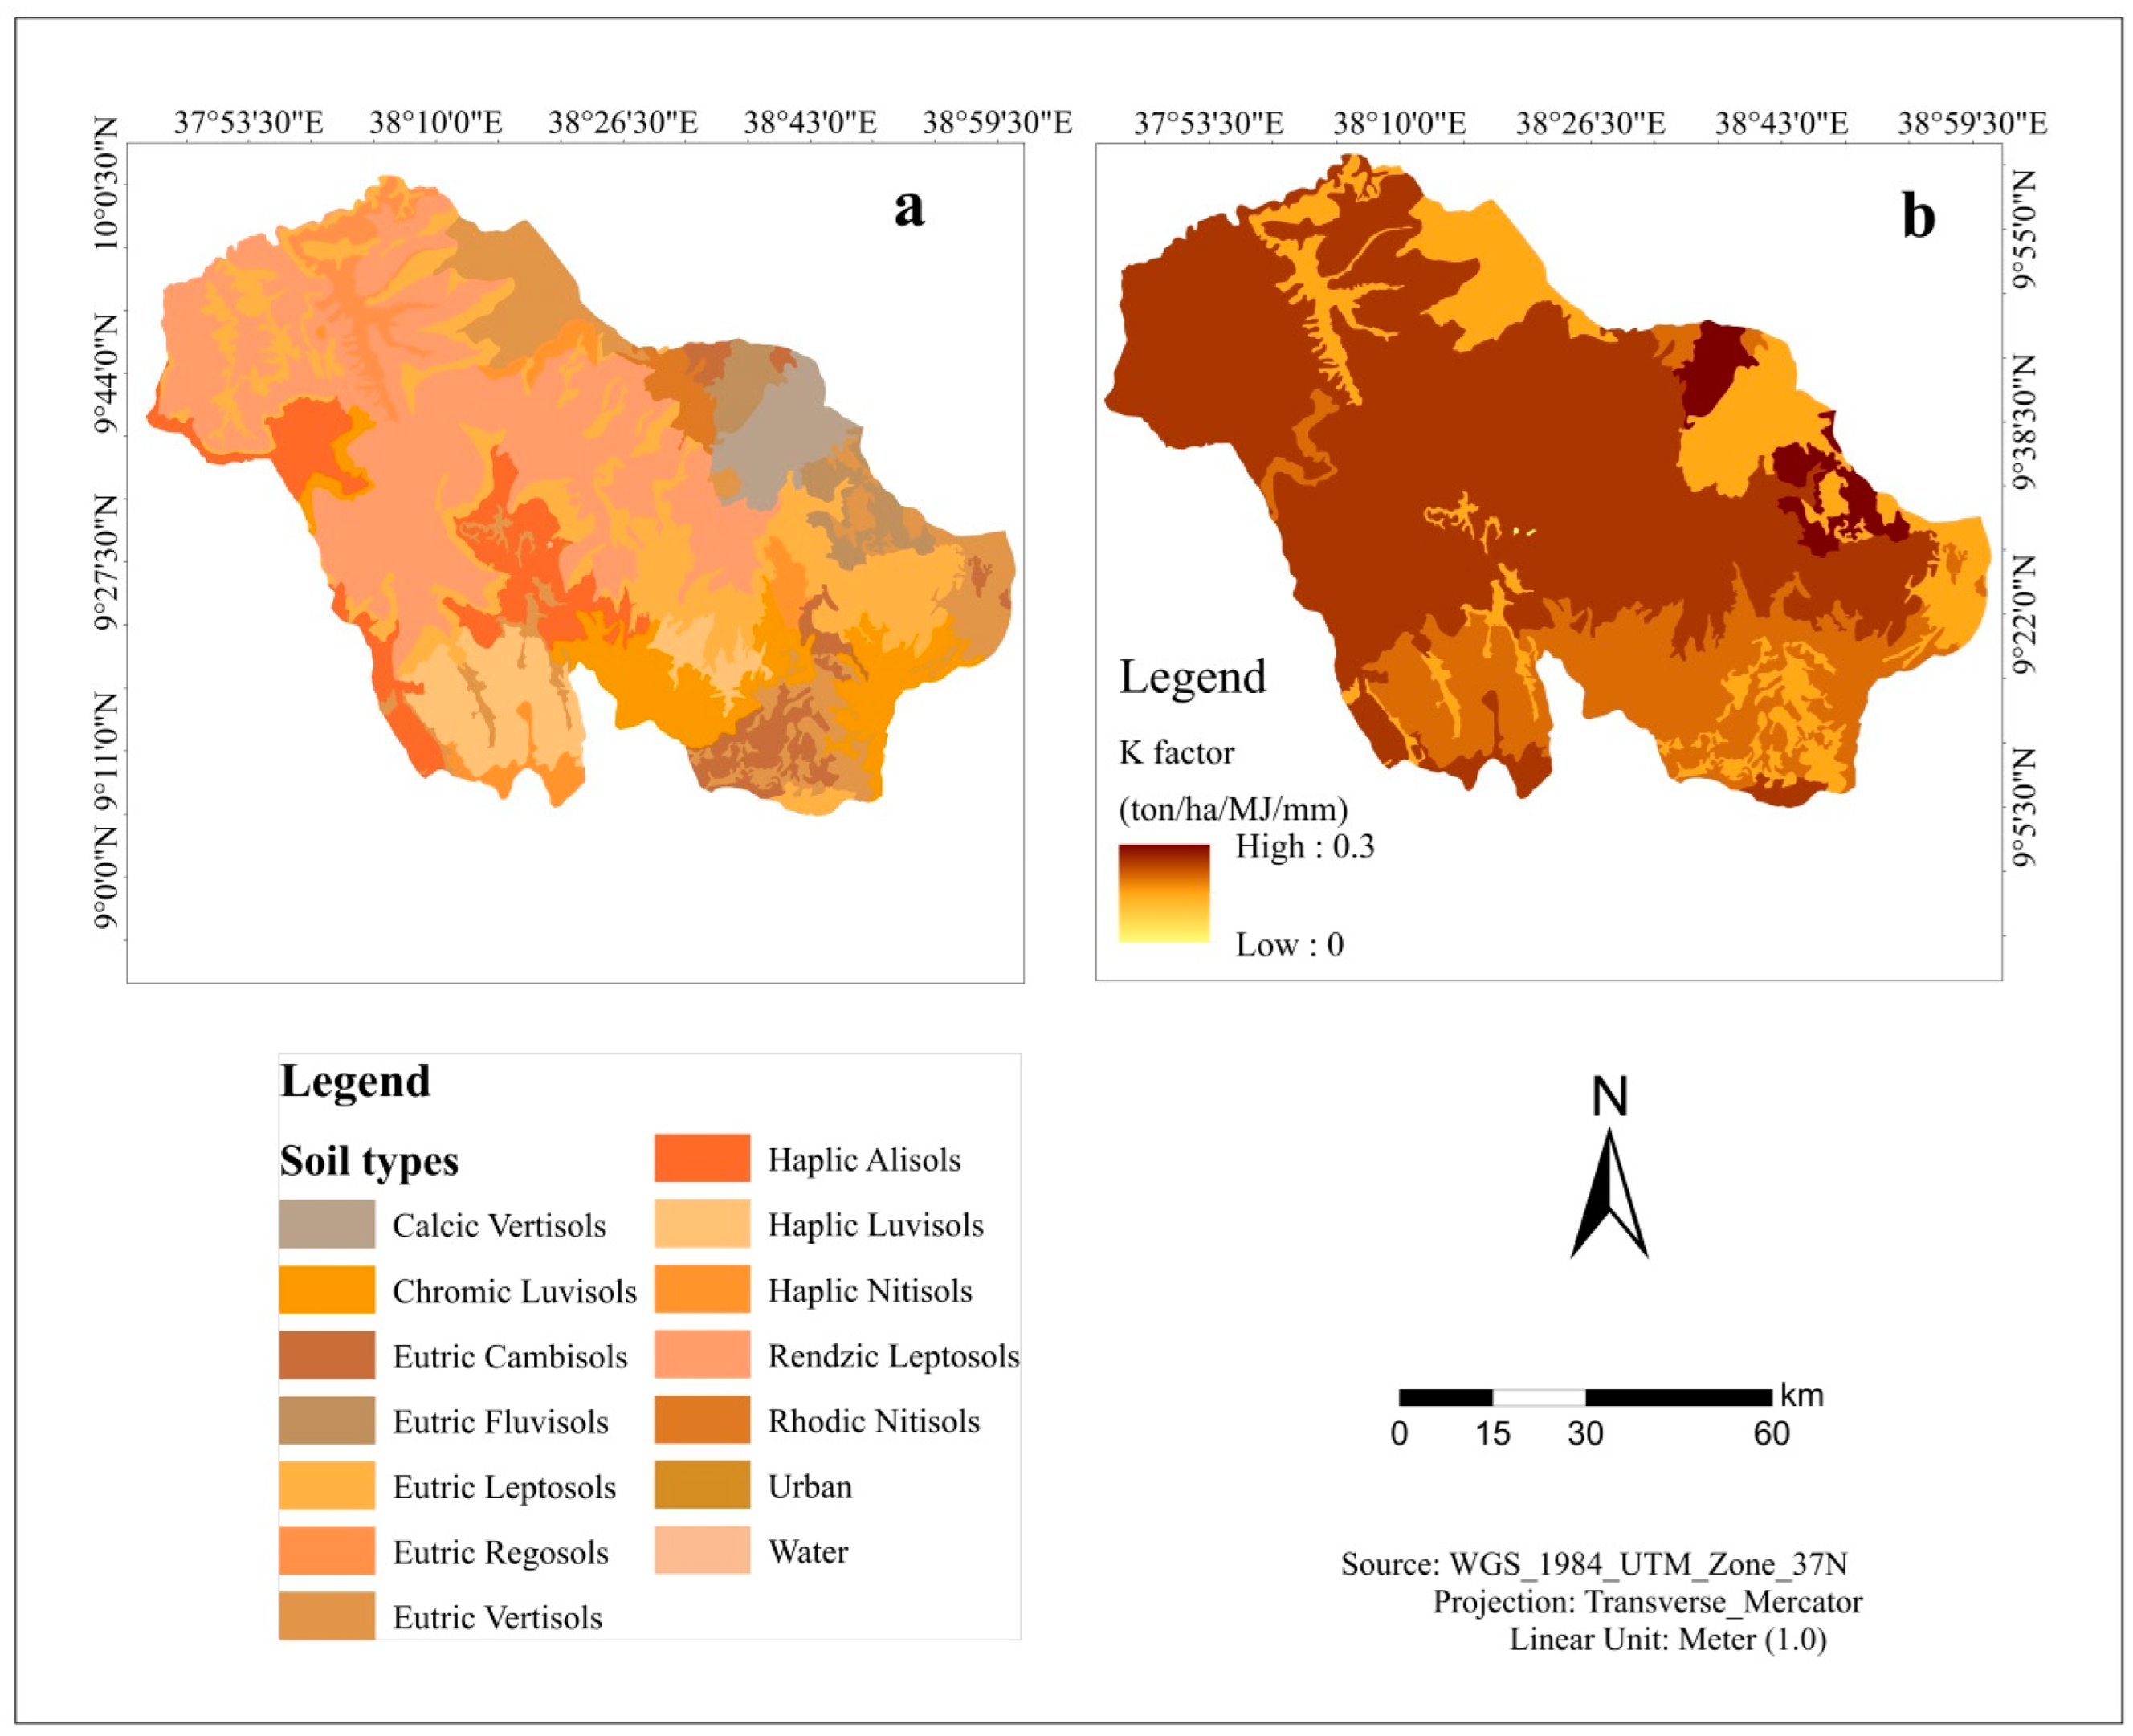
2.4.2. Soil Erodibility (K) Factor
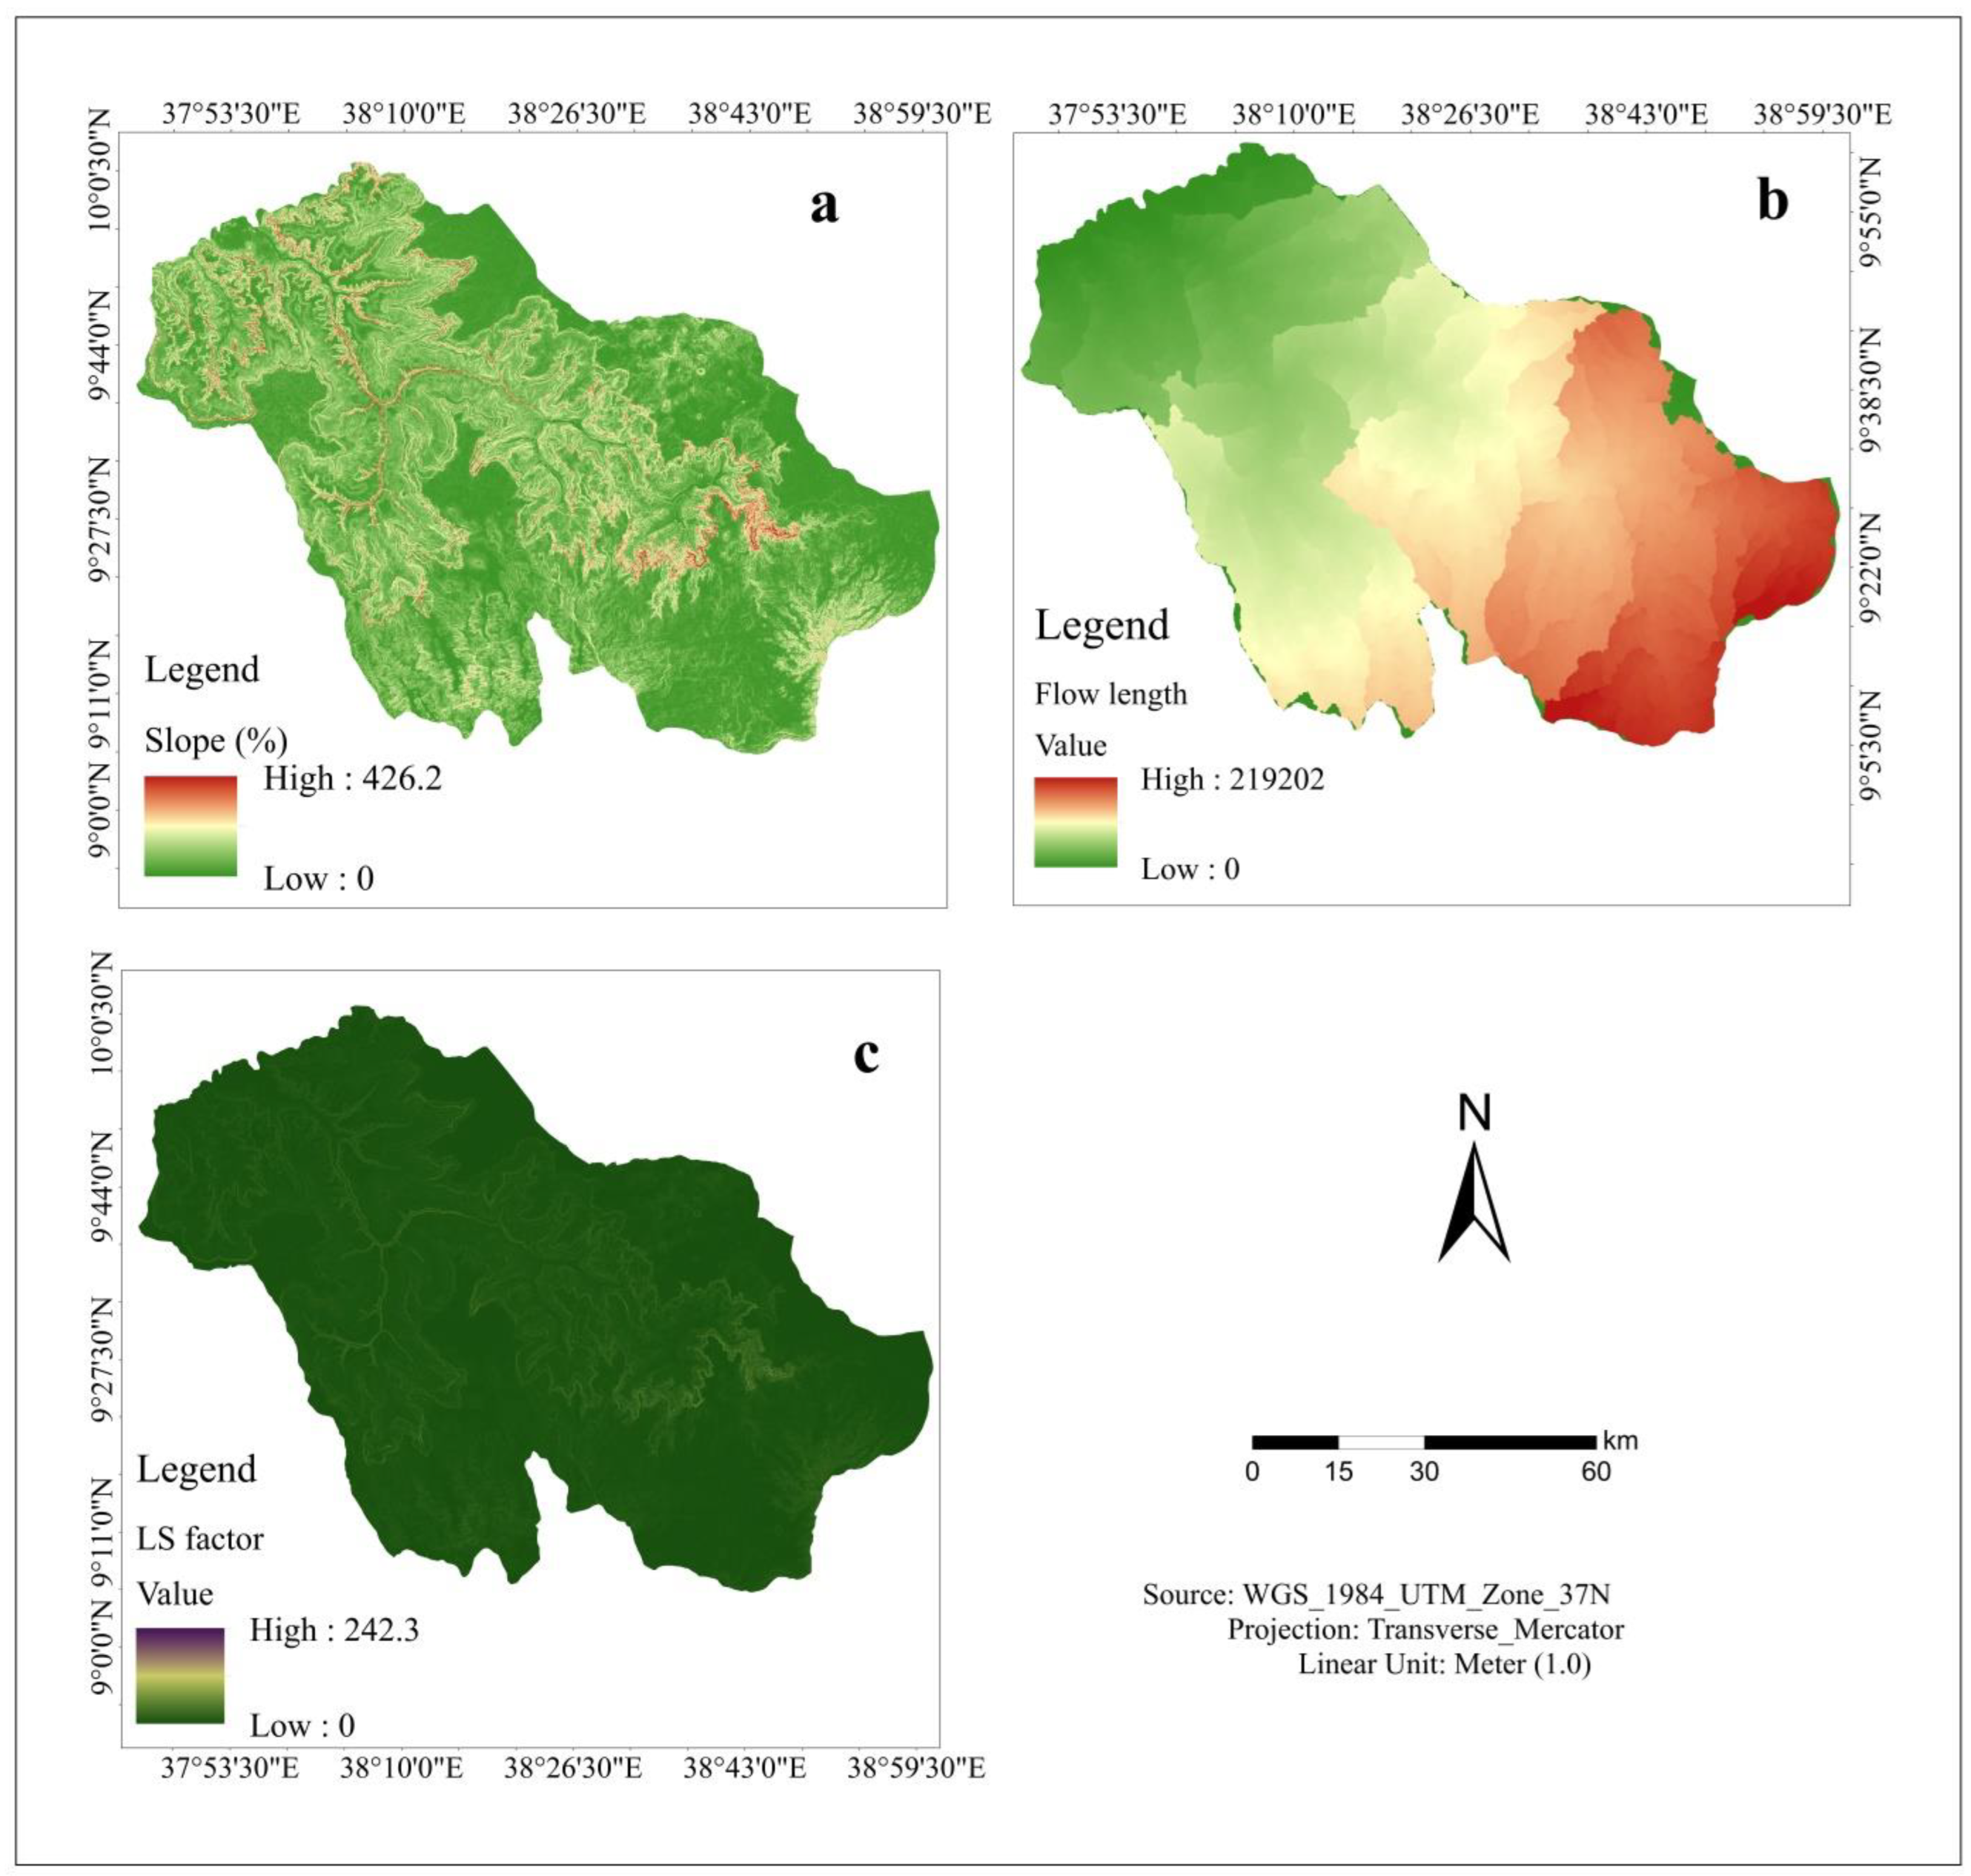
2.4.3. Slope Length and Steepness (LS) Factor
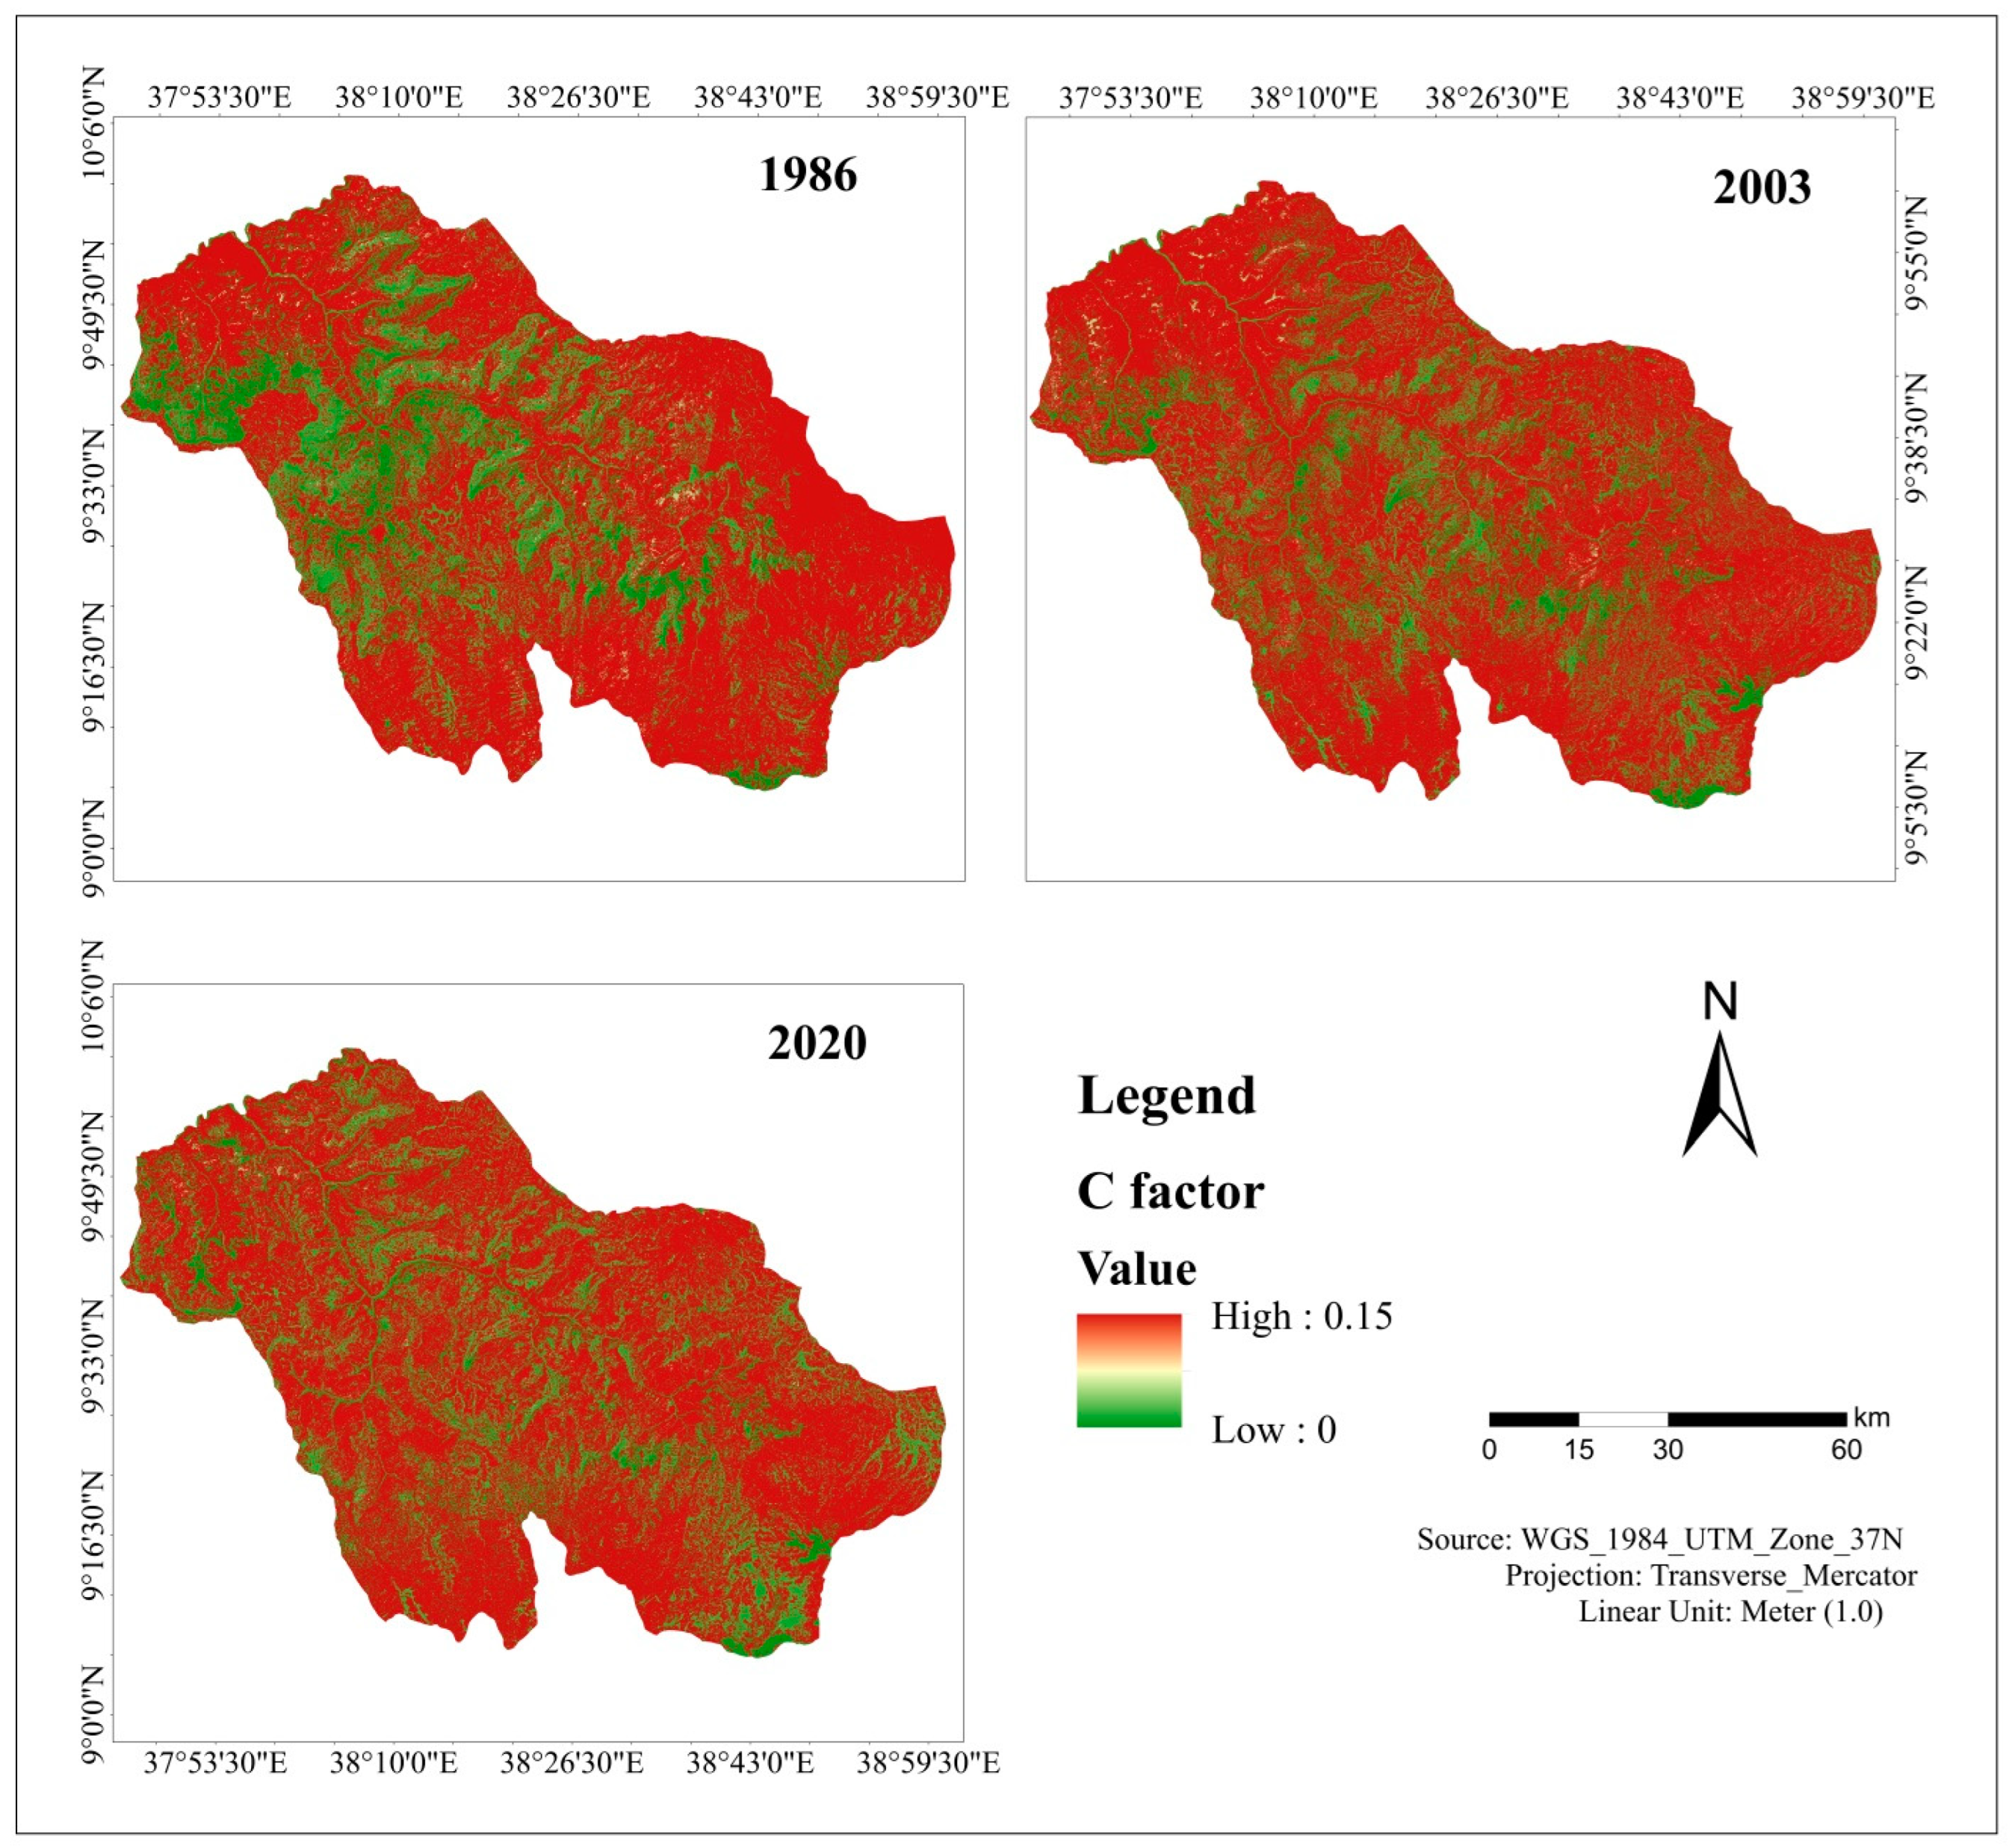
2.4.4. Land Cover and Management (C) Factor
2.4.5. Support Practice (P) Factor
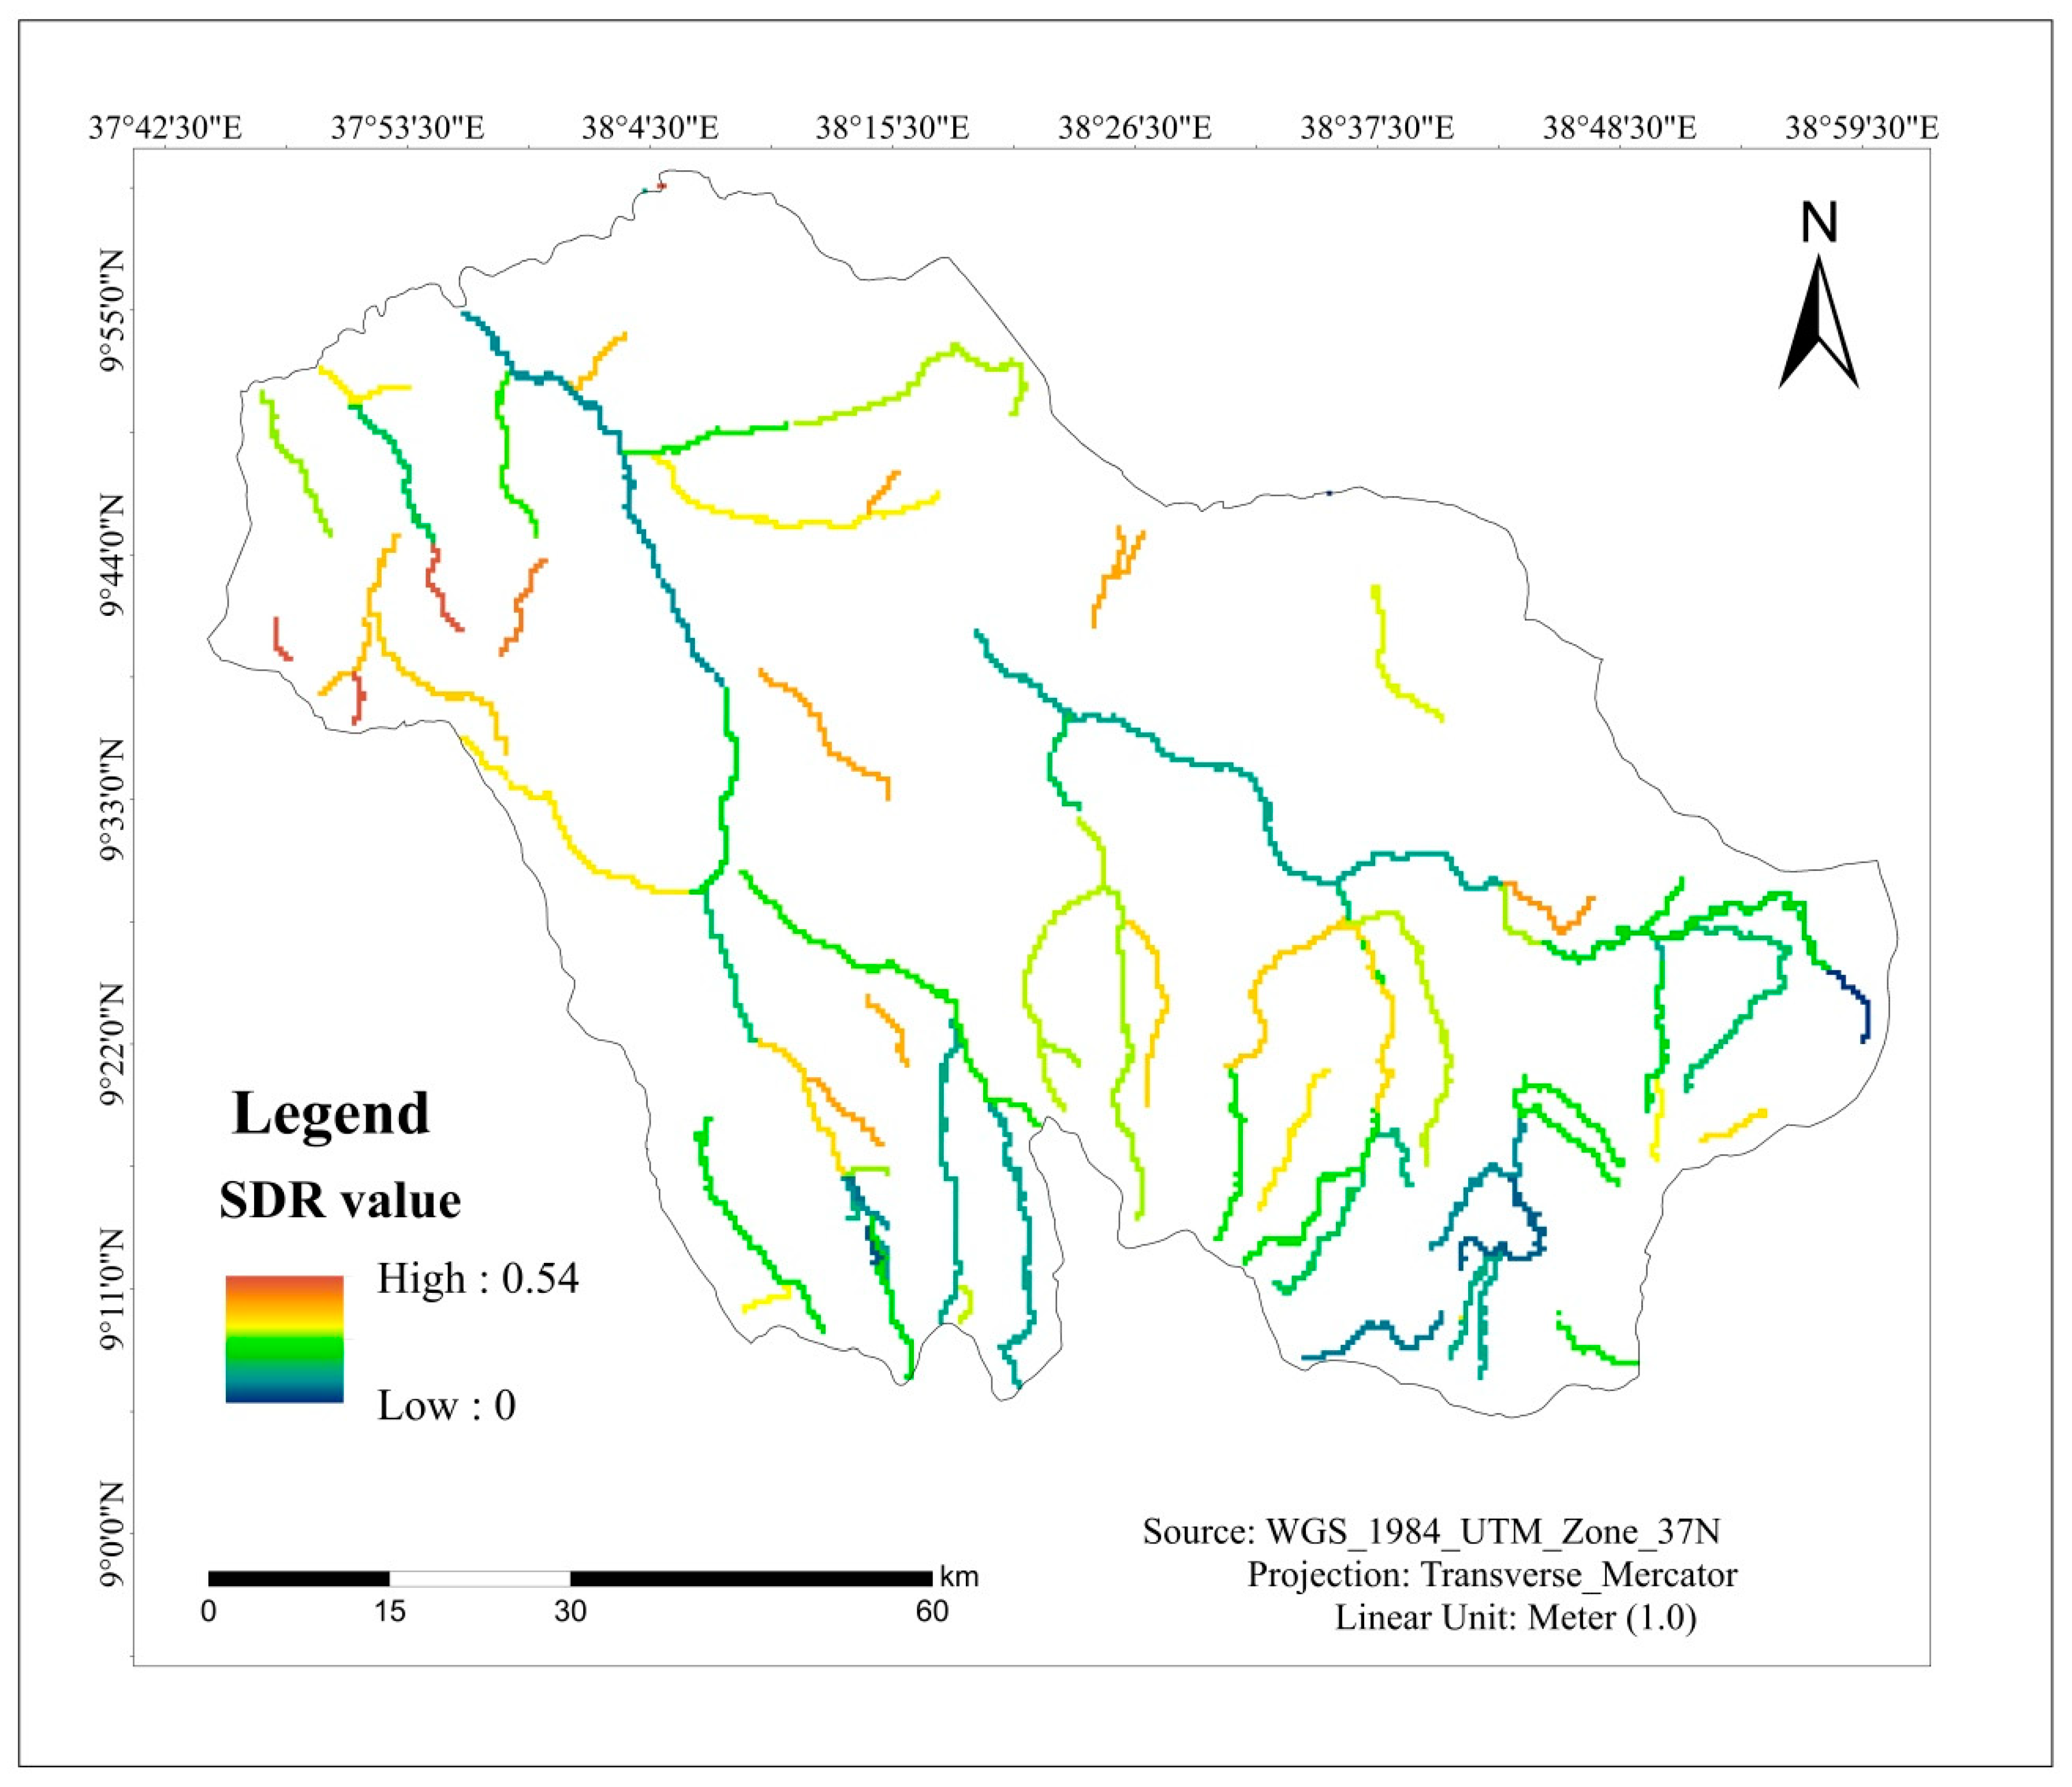
2.5. Estimation of the Sediment Delivery Ratio (SDR)
- ΔCh is the channel divide and outlet;
- Lc is the distance between the same two points parallel to the mean channel.
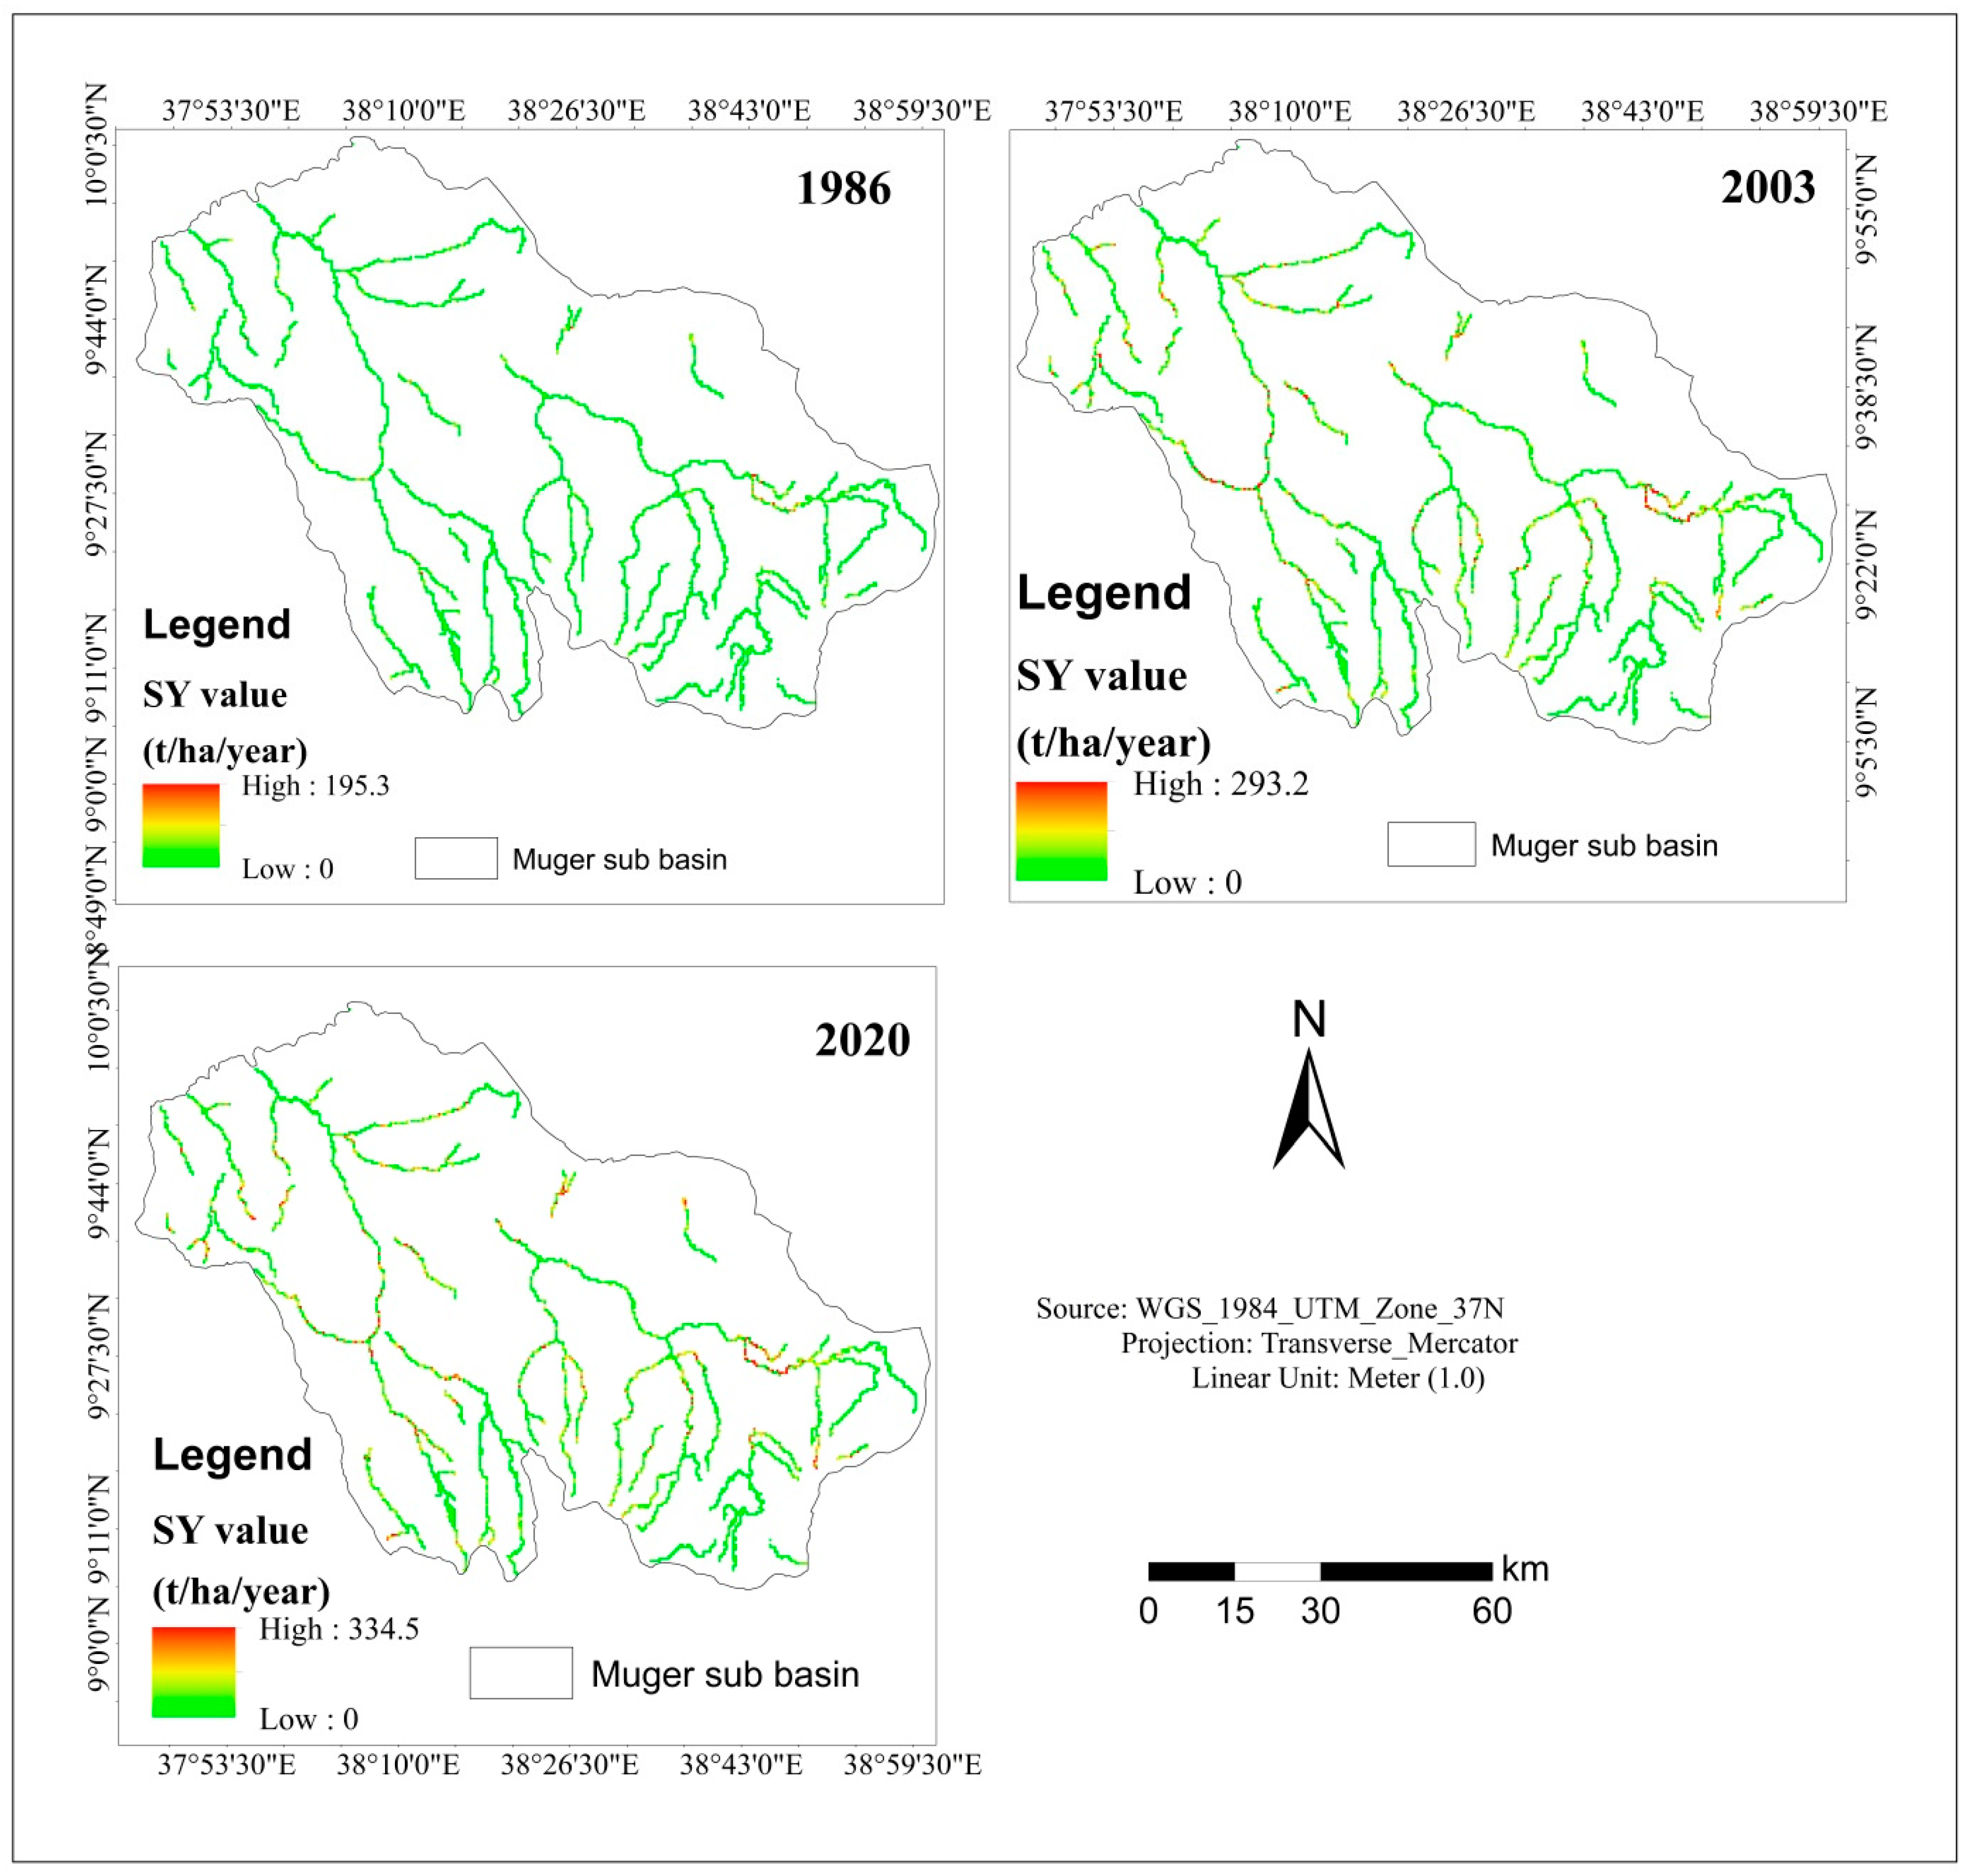
2.6. Estimation of Sediment Yield (SY)
3. Results and Discussion
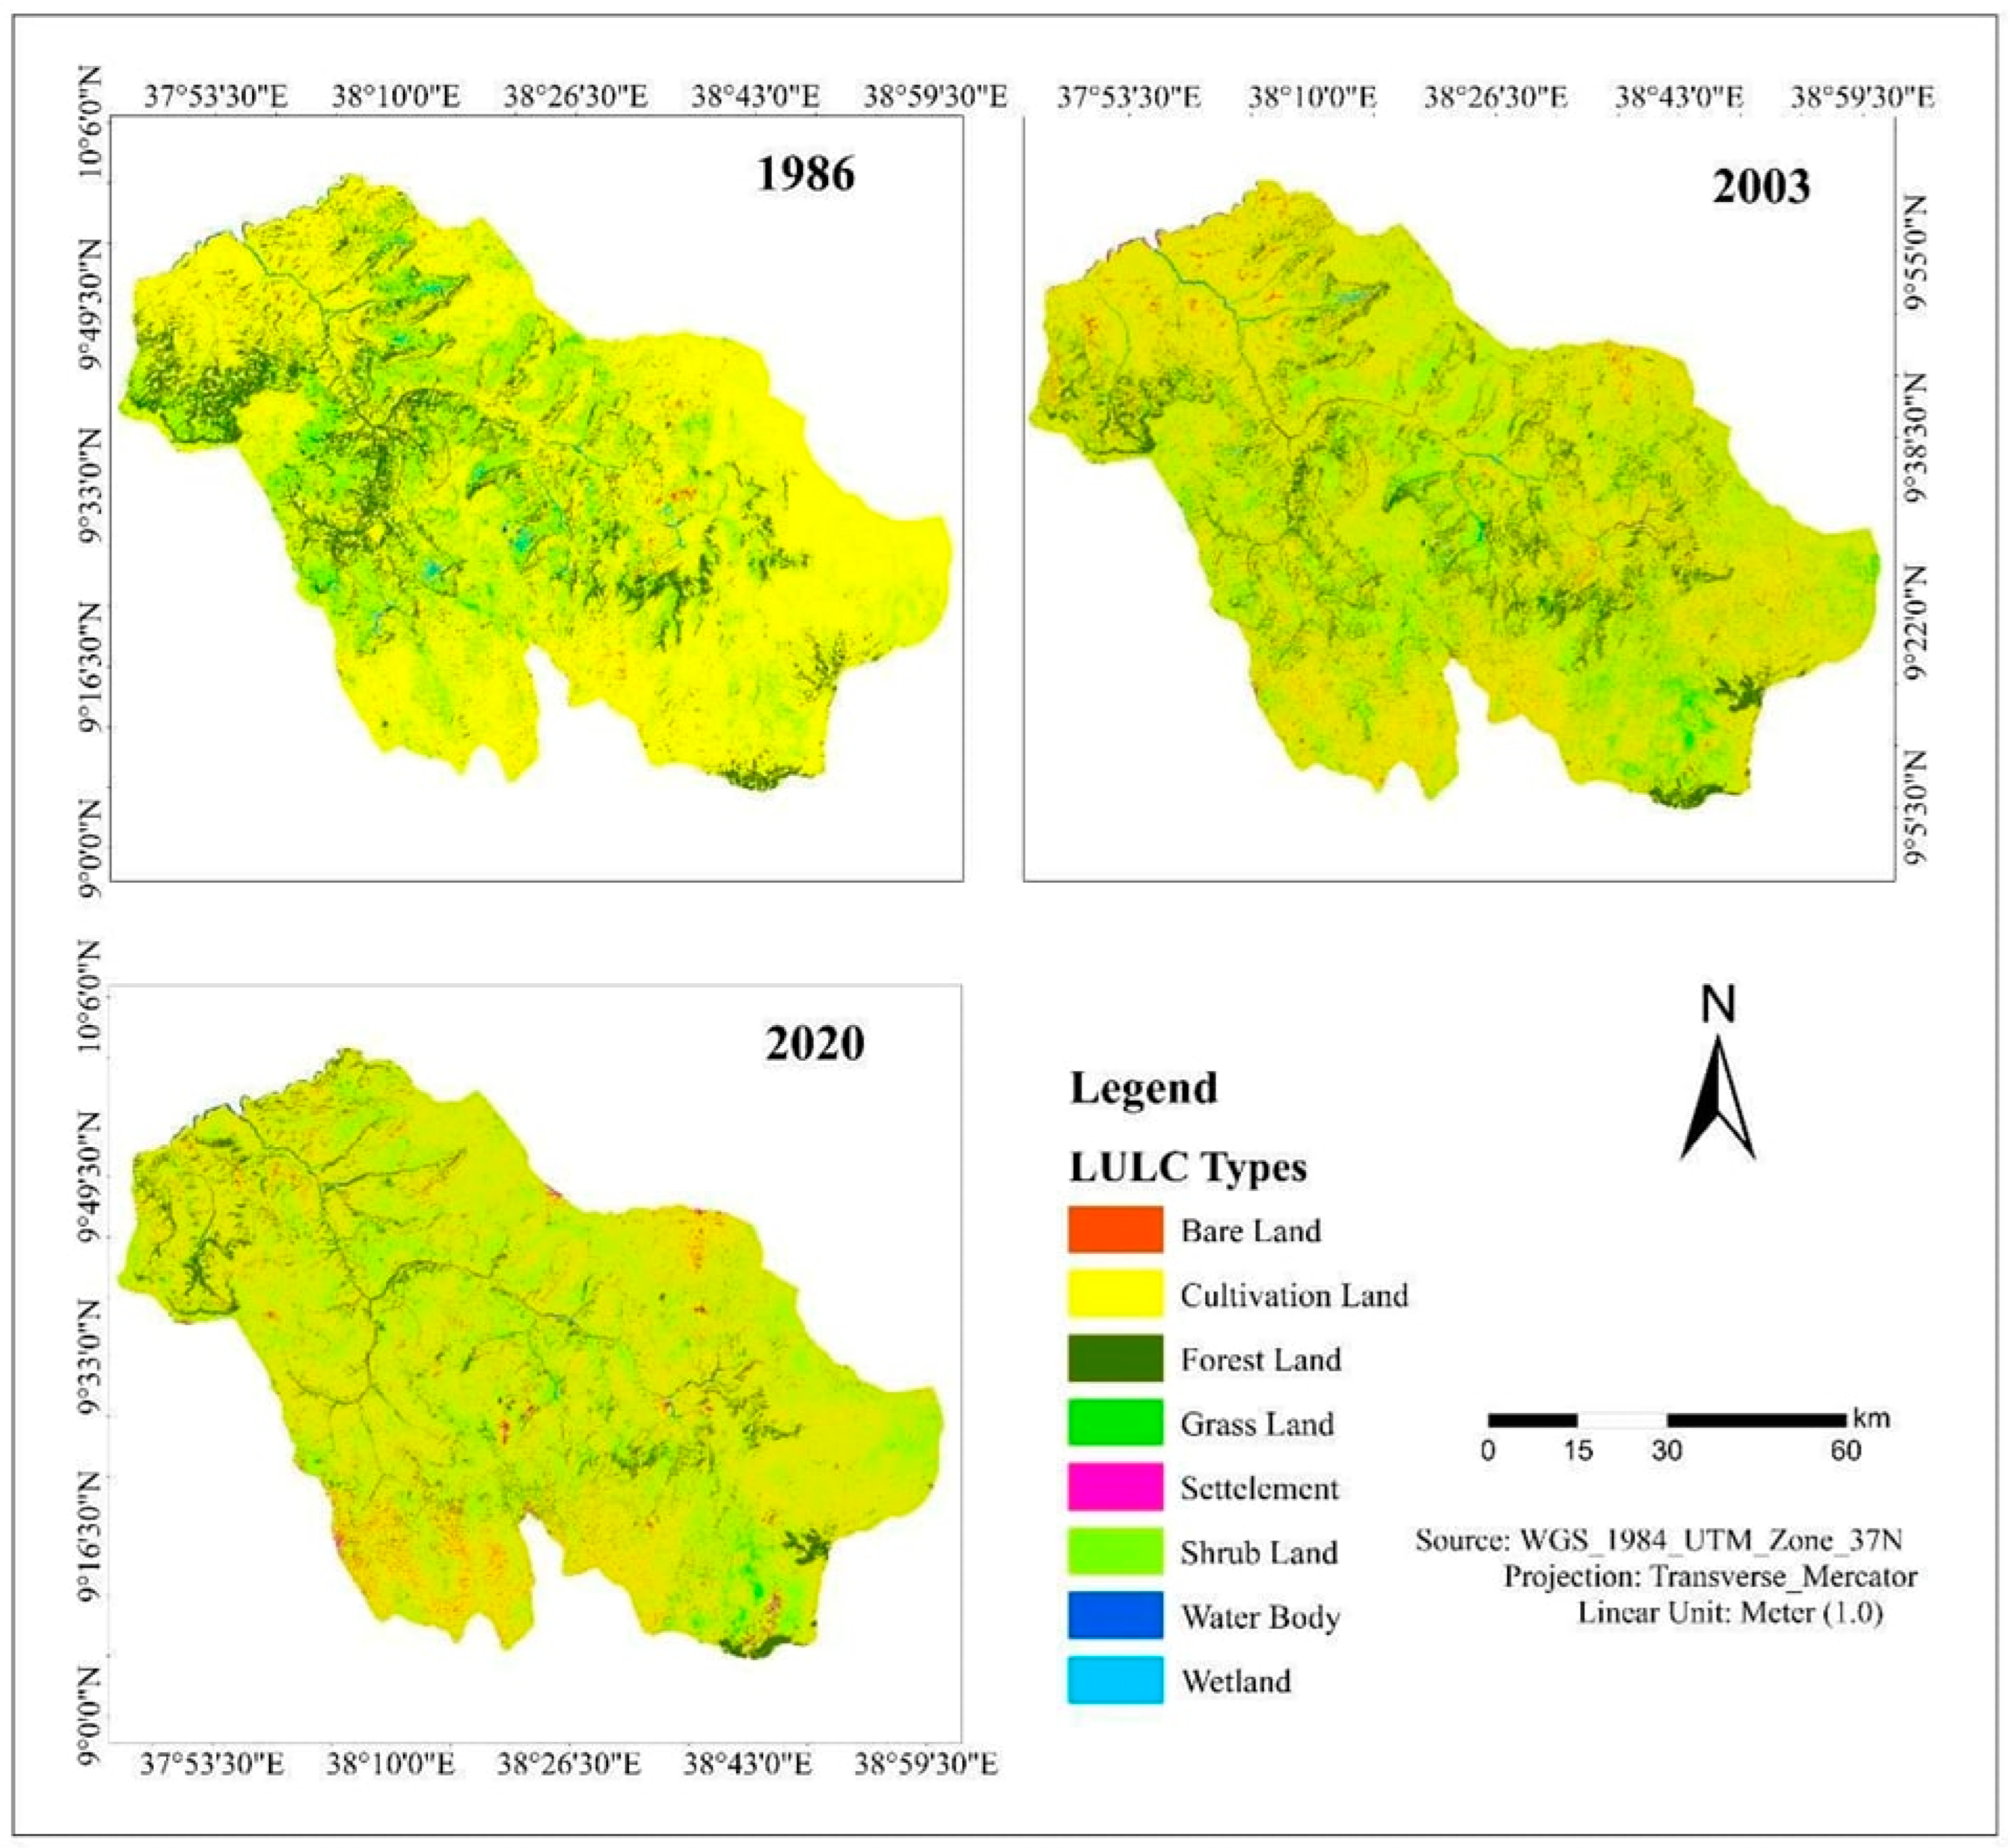
3.1. Land Use Land Cover Change
3.2. Soil Loss Estimation Using RUSLE Model
3.2.1. Rainfall Erosivity (R) Factor
3.2.2. Soil Erodibility (K) Factor
3.2.3. Slope Length and Steepness (LS) Factor
3.2.4. Land Cover and Management (C) Factor
3.2.5. Support Practice (P) Factor
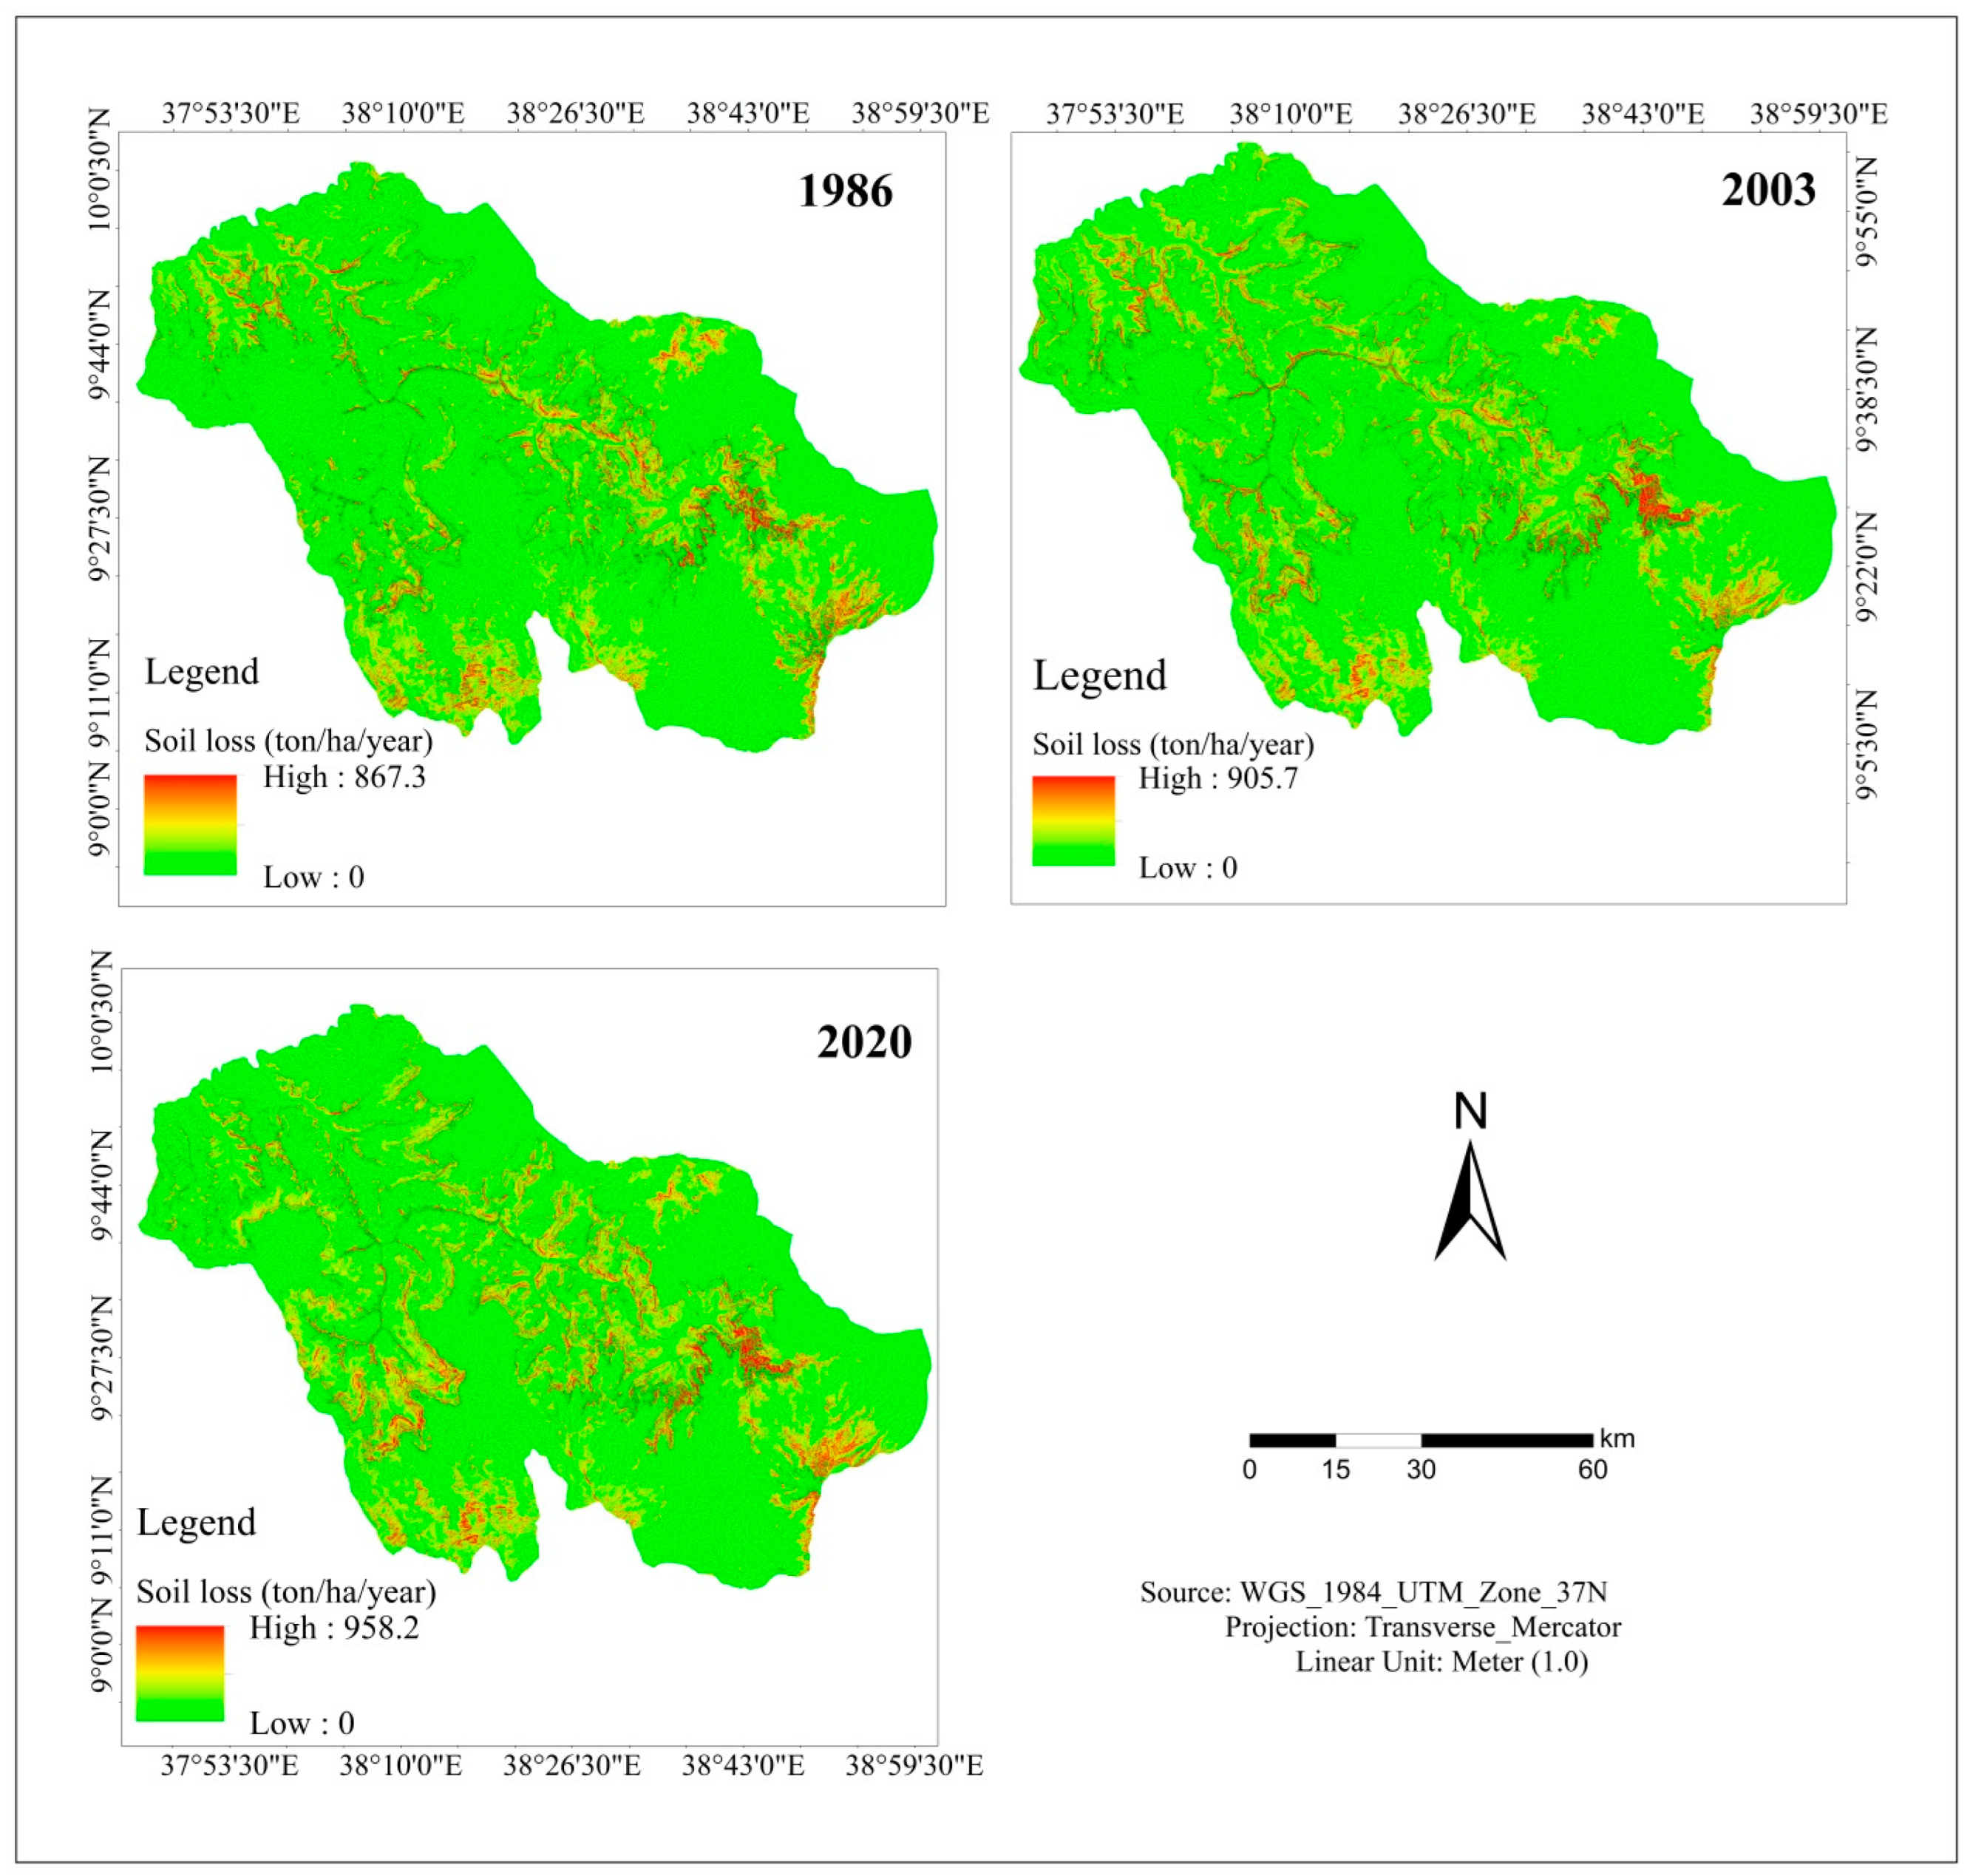
3.3. Soil Erosion Rate under Different LULC Change
3.4. Impact of LULC Change on Soil Erosion
3.5. Sediment Yield Estimation
4. Conclusions
Author Contributions
Funding
Data Availability Statement
Acknowledgments
Conflicts of Interest
References
- Ganasri, B.; Ramesh, H. Assessment of soil erosion by RUSLE model using remote sensing and GIS-A case study of Nethravathi Basin. Geosci. Front. 2016, 7, 953–961. [Google Scholar] [CrossRef] [Green Version]
- Li, J.; Feng, P.; Chen, F. Effects of land use change on flood characteristics in mountainous area of Daqinghe watershed, China. Nat. Hazards 2014, 70, 593–607. [Google Scholar] [CrossRef]
- Dabral, P.; Baithuri, N.; Pandey, A. Soil erosion assessment in a hilly catchment of North Eastern India using USLE, GIS and remote sensing. Water Resour. Manag. 2008, 22, 1783–1798. [Google Scholar] [CrossRef]
- Borrelli, P.; Robinson, D.A.; Fleischer, L.R.; Lugato, E.; Ballabio, C.; Alewell, C.; Meusburger, K.; Modugno, S.; Schütt, B.; Ferro, V. An assessment of the global impact of 21st century land use change on soil erosion. Nat. Commun. 2017, 8, 2013. [Google Scholar] [CrossRef] [Green Version]
- Uddin, K.; Abdul Matin, M.; Maharjan, S. Assessment of land cover change and its impact on changes in soil erosion risk in Nepal. Sustainability 2018, 10, 4715. [Google Scholar] [CrossRef] [Green Version]
- Weldu Woldemariam, G.; Edo Harka, A. Effect of land use and land cover change on soil erosion in erer sub-basin, Northeast Wabi Shebelle Basin, Ethiopia. Land 2020, 9, 111. [Google Scholar] [CrossRef] [Green Version]
- Benavidez, R.; Jackson, B.; Maxwell, D.; Norton, K. A review of the (Revised) Universal Soil Loss Equation ((R) USLE): With a view to increasing its global applicability and improving soil loss estimates. Hydrol. Earth Syst. Sci. 2018, 22, 6059–6086. [Google Scholar] [CrossRef] [Green Version]
- Haregeweyn, N.; Tsunekawa, A.; Poesen, J.; Tsubo, M.; Meshesha, D.T.; Fenta, A.A.; Nyssen, J.; Adgo, E. Comprehensive assessment of soil erosion risk for better land use planning in river basins: Case study of the Upper Blue Nile River. Sci. Total Environ. 2017, 574, 95–108. [Google Scholar] [CrossRef] [Green Version]
- Benaud, P.; Anderson, K.; Evans, M.; Farrow, L.; Glendell, M.; James, M.R.; Quine, T.A.; Quinton, J.N.; Rawlins, B.; Rickson, R.J. National-scale geodata describe widespread accelerated soil erosion. Geoderma 2020, 371, 114378. [Google Scholar] [CrossRef]
- Moisa, M.B.; Negash, D.A.; Merga, B.B.; Gemeda, D.O. Impact of land-use and land-cover change on soil erosion using the RUSLE model and the geographic information system: A case of Temeji watershed, Western Ethiopia. J. Water Clim. Chang. 2021, 12, 3404–3420. [Google Scholar] [CrossRef]
- Awulachew, S.B.; McCartney, M.; Steenhuis, T.S.; Ahmed, A.A. A Review of Hydrology, Sediment and Water Resource Use in the Blue Nile Basin. 2009. Available online: https://www.semanticscholar.org/paper/A-review-of-hydrology%2C-sediment-and-water-resource-Awulachew-McCartney/42b243c0dbcc67ce406489661af209ad099b1247 (accessed on 14 October 2022).
- Blanco, H.; Lal, R. Principles of Soil Conservation and Management; Springer: New York, NY, USA, 2008; Volume 167169. [Google Scholar]
- Pimentel, D.; Burgess, M. Soil erosion threatens food production. Agriculture 2013, 3, 443–463. [Google Scholar] [CrossRef] [Green Version]
- Gashaw, T.; Tulu, T.; Argaw, M.; Worqlul, A.W. Modeling the impacts of land use–land cover changes on soil erosion and sediment yield in the Andassa watershed, upper Blue Nile basin, Ethiopia. Environ. Earth Sci. 2019, 78, 679. [Google Scholar] [CrossRef]
- Bewket, W.; Teferi, E. Assessment of soil erosion hazard and prioritization for treatment at the watershed level: Case study in the Chemoga watershed, Blue Nile basin, Ethiopia. Land Degrad. Dev. 2009, 20, 609–622. [Google Scholar] [CrossRef]
- Gashaw, T.; Tulu, T.; Argaw, M. Erosion risk assessment for prioritization of conservation measures in Geleda watershed, Blue Nile basin, Ethiopia. Environ. Syst. Res. 2018, 6, 1. [Google Scholar] [CrossRef] [Green Version]
- Ethiopia Population 2020 (Demographics, M., Graphs)-World Population Review. Available online: https://worldpopulationreview.com/countries/ethiopia-population (accessed on 1 January 2021).
- Yesuf, M.; Mekonnen, A.; Kassie, M.; Pender, J. Cost of Land Degradation in Ethiopia: A Critical Review of Past Studies; Environmetnal Economics Policy Forum for Ehtiopia: Addis Ababa, Ethiopia, 2005. [Google Scholar]
- Hurni, H. Soil Conservation Research Programme Ethiopia; Research Report on Agro-Ecological Belts; Centre for Development and Environment University of Bern, Switzerland in association with The Ministry of Agriculture, Ethiopia: Addis Ababa, Ethiopia, 1998; 43p. [Google Scholar]
- Kidane, M.; Bezie, A.; Kesete, N.; Tolessa, T. The impact of land use and land cover (LULC) dynamics on soil erosion and sediment yield in Ethiopia. Heliyon 2019, 5, e02981. [Google Scholar] [CrossRef] [Green Version]
- Zeleke, G.; Hurni, H. Implications of land use and land cover dynamics for mountain resource degradation in the Northwestern Ethiopian highlands. Mt. Res. Dev. 2001, 21, 184–191. [Google Scholar] [CrossRef] [Green Version]
- Gashaw, T.; Bantider, A.; Silassie, H. Land degradation in Ethiopia: Causes, impacts and rehabilitation techniques. J. Environ. Earth Sci. 2014, 4, 98–104. [Google Scholar]
- Kidane, D.; Alemu, B. The effect of upstream land use practices on soil erosion and sedimentation in the Upper Blue Nile Basin, Ethiopia. Res. J. Agric. Environ. Manag. 2015, 4, 55–68. [Google Scholar]
- Akale, A.T.; Dagnew, D.C.; Belete, M.A.; Tilahun, S.A.; Mekuria, W.; Steenhuis, T.S. Impact of soil depth and topography on the effectiveness of conservation practices on discharge and soil loss in the Ethiopian highlands. Land 2017, 6, 78. [Google Scholar] [CrossRef] [Green Version]
- Muluneh, A.; Stroosnijder, L.; Keesstra, S.; Biazin, B. Adapting to climate change for food security in the Rift Valley dry lands of Ethiopia: Supplemental irrigation, plant density and sowing date. J. Agric. Sci. 2017, 155, 703–724. [Google Scholar] [CrossRef]
- Bewket, W.; Sterk, G. Dynamics in land cover and its effect on stream flow in the Chemoga watershed, Blue Nile basin, Ethiopia. Hydrol. Processes Int. J. 2005, 19, 445–458. [Google Scholar] [CrossRef]
- Meshesha, D.T.; Tsunekawa, A.; Tsubo, M.; Ali, S.A.; Haregeweyn, N. Land-use change and its socio-environmental impact in Eastern Ethiopia’s highland. Reg. Environ. Chang. 2014, 14, 757–768. [Google Scholar] [CrossRef]
- Gemeda, D.O.; Korecha, D.; Garedew, W. Monitoring climate extremes using standardized evapotranspiration index and future projection of rainfall and temperature in the wettest parts of southwest Ethiopia. Environ. Chall. 2022, 7, 100517. [Google Scholar] [CrossRef]
- Asres, R.S.; Tilahun, S.A.; Ayele, G.T.; Melesse, A.M. Analyses of land use/land cover change dynamics in the upland watersheds of Upper Blue Nile Basin. In Landscape Dynamics, Soils and Hydrological Processes in Varied Climates; Springer: Berlin/Heidelberg, Germany, 2016; pp. 73–91. [Google Scholar]
- Alewell, C.; Borrelli, P.; Meusburger, K.; Panagos, P. Using the USLE: Chances, challenges and limitations of soil erosion modelling. Int. Soil Water Conserv. Res. 2019, 7, 203–225. [Google Scholar] [CrossRef]
- Prasannakumar, V.; Vijith, H.; Abinod, S.; Geetha, N. Estimation of soil erosion risk within a small mountainous sub-watershed in Kerala, India, using Revised Universal Soil Loss Equation (RUSLE) and geo-information technology. Geosci. Front. 2012, 3, 209–215. [Google Scholar] [CrossRef] [Green Version]
- Moges, D.M.; Bhat, H.G. Integration of geospatial technologies with RUSLE for analysis of land use/cover change impact on soil erosion: Case study in Rib watershed, north-western highland Ethiopia. Environ. Earth Sci. 2017, 76, 765. [Google Scholar] [CrossRef]
- Kavian, A.; Hoseinpoor Sabet, S.; Solaimani, K.; Jafari, B. Simulating the effects of land use changes on soil erosion using RUSLE model. Geocarto Int. 2017, 32, 97–111. [Google Scholar] [CrossRef]
- Tanyaş, H.; Kolat, Ç.; Süzen, M.L. A new approach to estimate cover-management factor of RUSLE and validation of RUSLE model in the watershed of Kartalkaya Dam. J. Hydrol. 2015, 528, 584–598. [Google Scholar] [CrossRef]
- Farhan, Y.; Nawaiseh, S. Spatial assessment of soil erosion risk using RUSLE and GIS techniques. Environ. Earth Sci. 2015, 74, 4649–4669. [Google Scholar] [CrossRef]
- Kayet, N.; Pathak, K.; Chakrabarty, A.; Sahoo, S. Evaluation of soil loss estimation using the RUSLE model and SCS-CN method in hillslope mining areas. Int. Soil Water Conserv. Res. 2018, 6, 31–42. [Google Scholar] [CrossRef]
- Zerihun, M.; Mohammedyasin, M.S.; Sewnet, D.; Adem, A.A.; Lakew, M. Assessment of soil erosion using RUSLE, GIS and remote sensing in NW Ethiopia. Geoderma Reg. 2018, 12, 83–90. [Google Scholar] [CrossRef]
- Bhandari, K.P.; Aryal, J.; Darnsawasdi, R. A geospatial approach to assessing soil erosion in a watershed by integrating socio-economic determinants and the RUSLE model. Nat. Hazards 2015, 75, 321–342. [Google Scholar] [CrossRef]
- Hurni, H. An ecosystem approach to soil conservation. In Soil Erosion and Conservation; El-Swaify, S.A., Moldenhauer, W.C., Lo, A., Eds.; Soil Conservation Society of America: Ankey, IA, USA, 1985; pp. 759–771. Available online: https://pdf.usaid.gov/pdf_docs/Pnaav607.pdf (accessed on 14 October 2022).
- Renard, K.; Foster, G.; Weesies, G.; McCool, D.; Yoder, D. Predicting Soil Erosion by Water: A Guide to Conservation Planning with the Revised Universal Soil Loss Equation (RUSLE); USDA Agricultural Handbook 703; USDA: Washington, DC, USA, 1997.
- Fernández, C.; Vega, J.A. Evaluation of RUSLE and PESERA models for predicting soil erosion losses in the first year after wildfire in NW Spain. Geoderma 2016, 273, 64–72. [Google Scholar] [CrossRef]
- Marondedze, A.K.; Schütt, B. Assessment of soil erosion using the RUSLE Model for the Epworth district of the Harare Metropolitan Province, Zimbabwe. Sustainability 2020, 12, 8531. [Google Scholar] [CrossRef]
- Denekew, A.; Bekele, S. Characterization and atlas of the Blue Nile Basin and its sub basins. Int. Water Manag. Inst. Addis Ababa 2009. [Google Scholar]
- Amare, A.; Simane, B. Climate change induced vulnerability of smallholder farmers: Agroecology-based analysis in the Muger sub-basin of the upper Blue-Nile basin of Ethiopia. Am. J. Clim. Chang. 2017, 6, 668–693. [Google Scholar] [CrossRef] [Green Version]
- Central Statistics Agency. Population and Housing Census: Population Size by Age and Sex; Summary and Statistical Report of the 2007; Central Statistics Agency: Addis Ababa, Ethiopia, 2007.
- Teshome, D.S.; Taddese, H.; Tolessa, T.; Kidane, M.; You, S. Drivers and Implications of Land Cover Dynamics in Muger Sub-Basin, Abay Basin, Ethiopia. Sustainability 2022, 14, 11241. [Google Scholar] [CrossRef]
- CSA. Central Statistical Agency: Population Projection of Ethiopia for All Regions at Wereda Level from 2014–2017; Central Statistical Agency: Addis Ababa, Ethiopia, 2013.
- McCool, D.; Foster, G.; Renard, K.; Yoder, D.; Weesies, G. The revised universal soil loss equation. In Proceedings of the Department of Defense/Interagency Workshop on Technologies to Address Soil Erosion on Department of Defense Lands San Antonio, San Antonio, TX, USA, 11–15 June 1995; p. 9. [Google Scholar]
- Galagay, H.; Minale, A. Soil loss estimation using GIS and Remote sensing techniques: A case of Koga watershed, Northwestern Ethiopia. Int. Soil Water Conserv. Res. 2016, 4, 126–136. [Google Scholar] [CrossRef] [Green Version]
- Yesuph, A.Y.; Dagnew, A.B. Soil erosion mapping and severity analysis based on RUSLE model and local perception in the Beshillo Catchment of the Blue Nile Basin, Ethiopia. Environ. Syst. Res. 2019, 8, 17. [Google Scholar] [CrossRef] [Green Version]
- Angima, S.; Stott, D.; O’neill, M.; Ong, C.; Weesies, G. Soil erosion prediction using RUSLE for central Kenyan highland conditions. Agric. Ecosyst. Environ. 2003, 97, 295–308. [Google Scholar] [CrossRef]
- Kulimushi, L.C.; Choudhari, P.; Mubalama, L.K.; Banswe, G.T. GIS and remote sensing-based assessment of soil erosion risk using RUSLE model in South-Kivu province, eastern, Democratic Republic of Congo. Geomat. Nat. Hazards Risk 2021, 12, 961–987. [Google Scholar] [CrossRef]
- Kulimushi, L.C.; Maniragaba, A.; Choudhari, P.; Elbeltagi, A.; Uwemeye, J.; Rushema, E.; Singh, S.K. Evaluation of soil erosion and sediment yield spatio-temporal pattern during 1990–2019. Geomat. Nat. Hazards Risk 2021, 12, 2676–2707. [Google Scholar] [CrossRef]
- Wischmeier, W.H.; Smith, D.D. Predicting Rainfall Erosion Losses: A Guide to Conservation Planning; Handbook No. 537; United States Department of Agriculture: Washington, DC, USA, 1978.
- Amsalu, T.; Mengaw, A. GIS based soil loss estimation using rusle model: The case of jabi tehinan woreda, ANRS, Ethiopia. Nat. Resour. 2014, 2014, 49160. [Google Scholar] [CrossRef]
- Hurni, H. Erosion-productivity-conservation systems in Ethiopia. In Proceedings of the 4th International Conference on Soil Conservation, Maracacy, Venezuela, 3–9 November 1985. [Google Scholar]
- Helldén, U. An Assessment of Woody Biomass, Community Forests, Land Use and Soil Erosion in Ethiopia; Lund University Press: Lund, Sweden, 1987. [Google Scholar]
- Mengistu, D.; Bewket, W.; Lal, R. Soil erosion hazard under the current and potential climate change induced loss of soil organic matter in the Upper Blue Nile (Abay) River Basin, Ethiopia. In Sustainable Intensification to Advance Food Security and Enhance Climate Resilience in Africa; Springer: Berlin/Heidelberg, Germany, 2015; pp. 137–163. [Google Scholar]
- Tsegaye, L.; Bharti, R. Soil erosion and sediment yield assessment using RUSLE and GIS-based approach in Anjeb watershed, Northwest Ethiopia. SN Appl. Sci. 2021, 3, 582. [Google Scholar] [CrossRef]
- Alexakis, D.D.; Hadjimitsis, D.G.; Agapiou, A. Integrated use of remote sensing, GIS and precipitation data for the assessment of soil erosion rate in the catchment area of “Yialias” in Cyprus. Atmos. Res. 2013, 131, 108–124. [Google Scholar] [CrossRef]
- Griffin, M.; Beasley, D.; Fletcher, J.; Foster, G. Estimating soil loss on topographically non-uniform field and farm units. J. Soil Water Conserv. 1988, 43, 326–331. [Google Scholar]
- Tessema, Y.M.; Jasińska, J.; Yadeta, L.T.; Świtoniak, M.; Puchałka, R.; Gebregeorgis, E.G. Soil loss estimation for conservation planning in the welmel watershed of the Genale Dawa Basin, Ethiopia. Agronomy 2020, 10, 777. [Google Scholar] [CrossRef]
- Pijl, A.; Reuter, L.E.; Quarella, E.; Vogel, T.A.; Tarolli, P. GIS-based soil erosion modelling under various steep-slope vineyard practices. Catena 2020, 193, 104604. [Google Scholar] [CrossRef]
- Belayneh, M.; Yirgu, T.; Tsegaye, D. Potential soil erosion estimation and area prioritization for better conservation planning in Gumara watershed using RUSLE and GIS techniques’. Environ. Syst. Res. 2019, 8, 20. [Google Scholar] [CrossRef] [Green Version]
- Gashaw, T.; Worqlul, A.W.; Dile, Y.T.; Addisu, S.; Bantider, A.; Zeleke, G. Evaluating potential impacts of land management practices on soil erosion in the Gilgel Abay watershed, upper Blue Nile basin. Heliyon 2020, 6, e04777. [Google Scholar] [CrossRef]
- Olorunfemi, I.E.; Komolafe, A.A.; Fasinmirin, J.T.; Olufayo, A.A.; Akande, S.O. A GIS-based assessment of the potential soil erosion and flood hazard zones in Ekiti State, Southwestern Nigeria using integrated RUSLE and HAND models. Catena 2020, 194, 104725. [Google Scholar] [CrossRef]
- Ali, S.A.; Hagos, H. Estimation of soil erosion using USLE and GIS in Awassa Catchment, Rift valley, Central Ethiopia. Geoderma Reg. 2016, 7, 159–166. [Google Scholar] [CrossRef]
- Molla, T.; Sisheber, B. Estimating soil erosion risk and evaluating erosion control measures for soil conservation planning at Koga watershed in the highlands of Ethiopia. Solid Earth 2017, 8, 13–25. [Google Scholar] [CrossRef] [Green Version]
- Ouyang, D.; Bartholic, J. Predicting sediment delivery ratio in Saginaw Bay watershed. In Proceedings of the 22nd National Association of Environmental Professionals Conference, Orlando, FL, USA, 19–23 May 1997; pp. 659–671. [Google Scholar]
- Williams, J.R.; Berndt, H.D. Sediment yield computed with universal equation. J. Hydraul. Div. 1972, 98, 2087–2098. [Google Scholar] [CrossRef]
- Gelagay, H. RUSLE and SDR model based sediment yield assessment in a GIS and remote sensing environment; a case study of Koga watershed, Upper Blue Nile Basin, Ethiopia. Hydrol. Curr. Res. 2016, 7, 239. [Google Scholar] [CrossRef]
- Roy, P. Application of USLE in a GIS environment to estimate soil erosion in the Irga watershed, Jharkhand, India. Phys. Geogr. 2019, 40, 361–383. [Google Scholar] [CrossRef]
- Yigez, B.; Xiong, D.; Zhang, B.; Yuan, Y.; Baig, M.A.; Dahal, N.M.; Guadie, A.; Zhao, W.; Wu, Y. Spatial distribution of soil erosion and sediment yield in the Koshi River Basin, Nepal: A case study of Triyuga watershed. J. Soils Sediments 2021, 21, 3888–3905. [Google Scholar] [CrossRef]
- Panditharathne, D.; Abeysingha, N.; Nirmanee, K.; Mallawatantri, A. Application of revised universal soil loss equation (Rusle) model to assess soil erosion in “kalu Ganga” River Basin in Sri Lanka. Appl. Environ. Soil Sci. 2019, 2019, 4037379. [Google Scholar] [CrossRef] [Green Version]
- Belihu, M.; Tekleab, S.; Abate, B.; Bewket, W. Hydrologic response to land use land cover change in the Upper Gidabo Watershed, Rift Valley Lakes Basin, Ethiopia. HydroResearch 2020, 3, 85–94. [Google Scholar] [CrossRef]
- Dibaba, W.T.; Demissie, T.A.; Miegel, K. Drivers and implications of land use/land cover dynamics in Finchaa catchment, northwestern Ethiopia. Land 2020, 9, 113. [Google Scholar] [CrossRef] [Green Version]
- Negassa, M.D.; Mallie, D.T.; Gemeda, D.O. Forest cover change detection using Geographic Information Systems and remote sensing techniques: A spatio-temporal study on Komto Protected forest priority area, East Wollega Zone, Ethiopia. Environ. Syst. Res. 2020, 9, 1. [Google Scholar] [CrossRef] [Green Version]
- Moisa, M.B.; Dejene, I.N.; Hinkosa, L.B.; Gemeda, D.O. Land use/land cover change analysis using geospatial techniques: A case of Geba watershed, western Ethiopia. SN Appl. Sci. 2022, 4, 187. [Google Scholar] [CrossRef]
- Erdogan, E.H.; Erpul, G.; Bayramin, İ. Use of USLE/GIS methodology for predicting soil loss in a semiarid agricultural watershed. Environ. Monit. Assess. 2007, 131, 153–161. [Google Scholar] [CrossRef]
- Moisa, M.B.; Dejene, I.N.; Merga, B.B.; Gemeda, D.O. Soil loss estimation and prioritization using geographic information systems and the RUSLE model: A case study of the Anger River Sub-basin, Western Ethiopia. J. Water Clim. Chang. 2022, 13, 1170–1184. [Google Scholar] [CrossRef]
- Karamage, F.; Zhang, C.; Ndayisaba, F.; Shao, H.; Kayiranga, A.; Fang, X.; Nahayo, L.; Muhire Nyesheja, E.; Tian, G. Extent of cropland and related soil erosion risk in Rwanda. Sustainability 2016, 8, 609. [Google Scholar] [CrossRef] [Green Version]
- Sharma, A.; Tiwari, K.N.; Bhadoria, P. Effect of land use land cover change on soil erosion potential in an agricultural watershed. Environ. Monit. Assess. 2011, 173, 789–801. [Google Scholar] [CrossRef] [PubMed]
- Sinshaw, B.G.; Belete, A.M.; Mekonen, B.M.; Wubetu, T.G.; Anley, T.L.; Alamneh, W.D.; Atinkut, H.B.; Gelaye, A.A.; Bilkew, T.; Tefera, A.K. Watershed-based soil erosion and sediment yield modeling in the Rib watershed of the Upper Blue Nile Basin, Ethiopia. Energy Nexus 2021, 3, 100023. [Google Scholar] [CrossRef]


| Data Category | Sources | Purpose | Period/Resolution |
|---|---|---|---|
| DEM | The shuttle radar topographic mapping obtained from the MoWIE Ethiopia | To generate drainage network, flow length, and LS factor | 30 m |
| Landsat images | Derived from Landsat images (Landsat-5, Landst-7, and Landsat 8) [48] | For LULC types and C, and P-factor | 30 m (1986, 2003, and 2020) |
| Soil data | MoWIE, Ethiopia | To map soil types and to generate the soil erodibility (K) factor | 1:250,000 |
| Rainfall data | NMA | To extract the R-factor from the mean annual rainfall data | 1986–2020 |
| Stations | Location | Mean Annual Rainfall (mm) (1986–2020) | R-Factor MJ mm ha−1 h−1 year−1 | ||
|---|---|---|---|---|---|
| Latitude (°N) | Longitude (°E) | Elevation (m) | |||
| Addis Ababa Obs | 9.02 | 38.75 | 2386 | 1213.24 | 673.72 |
| Kachise | 9.61 | 37.86 | 2557 | 1847.11 | 1029.96 |
| Fiche | 9.77 | 38.73 | 2784 | 1156.95 | 642.08 |
| Debre Berhan | 9.63 | 39.50 | 2750 | 928.52 | 513.71 |
| Gohatsion | 10.00 | 38.24 | 2507 | 1203.34 | 668.16 |
| Gebere guracha | 9.82 | 38.42 | 2560 | 1337.10 | 743.33 |
| Degem | 9.82 | 38.63 | 3086 | 1120.82 | 621.78 |
| Debre Tsige | 9.64 | 38.83 | 2640 | 883.55 | 488.43 |
| Fital | 9.62 | 38.65 | 2566 | 978.66 | 541.89 |
| Muke Turi | 9.62 | 38.65 | 2649 | 979.29 | 542.24 |
| Derba | 9.43 | 38.65 | 2385 | 1154.67 | 640.81 |
| Chancho | 9.30 | 38.74 | 2632 | 1536.33 | 855.30 |
| Sululta | 9.18 | 38.73 | 2610 | 1202.92 | 667.92 |
| Muger | 9.45 | 38.34 | 2553 | 1371.37 | 762.59 |
| Enchini | 9.32 | 38.37 | 2687 | 1231.11 | 683.76 |
| Shekute | 9.37 | 38.04 | 2581 | 1448.90 | 806.16 |
| Harodoyo | 9.56 | 37.96 | 2532 | 1478.80 | 822.96 |
| Jeldu | 9.25 | 38.08 | 2952 | 1524.05 | 848.40 |
| Soil Types | Soil Color | K-Factor | Area (ha) | Percentage (%) | References |
|---|---|---|---|---|---|
| Calcic Vertisols | Black | 0.15 | 29,407.92 | 3.59 | [20,51] |
| Chromic Luvisols | Brown | 0.2 | 68,522.20 | 8.37 | [20,51] |
| Eutric Cambisols | Brown | 0.2 | 29,829.01 | 3.64 | [10,51] |
| Eutric Fluvisols | Yellow | 0.3 | 27,378.35 | 3.34 | [20,51] |
| Eutric Leptosols | Red | 0.25 | 149,753.05 | 18.29 | [34,51] |
| Eutric Regosols | Brown | 0.2 | 21,513.83 | 2.63 | [20,34,51] |
| Eutric Vertisols | Black | 0.15 | 93,894.68 | 11.47 | [20,34,39,51] |
| Haplic Alisols | Red | 0.25 | 65,453.09 | 7.99 | [15,20,51] |
| Haplic Luvisols | Brown | 0.2 | 52,497.27 | 6.41 | [16,20,34,51] |
| Haplic Nitisols | Red | 0.25 | 21,213.26 | 2.59 | [14,39,51] |
| Rendzic Leptosols | Red | 0.25 | 247,882.08 | 30.27 | [34,51] |
| Rhodic Nitisols | Red | 0.25 | 11,322.20 | 1.38 | [34,51] |
| Urban, mining, etc | - | 0 | 75.10 | 0.01 | [60] |
| Water bodies | - | 0 | 68.92 | 0.01 | [30,60] |
| LULC Types | 1986 | 2003 | 2020 | C-Factor | P-Factor | |||
|---|---|---|---|---|---|---|---|---|
| Area (ha) | % | Area (ha) | % | Area (ha) | % | |||
| Bare Land | 9413.19 | 1.15 | 8601.39 | 1.05 | 4654.5 | 0.57 | 0.05 | 0.8 |
| Cultivation land | 563,823 | 68.86 | 592,957 | 72.42 | 576,806 | 70.44 | 0.15 | 0.9 |
| Forest land | 96,475.9 | 11.78 | 76,634.6 | 9.36 | 48,326.3 | 5.90 | 0.001 | 0.7 |
| Grassland | 12,482.9 | 1.52 | 28,152.5 | 3.44 | 3362.4 | 0.41 | 0.01 | 0.8 |
| Settlement | 262.89 | 0.03 | 6182.91 | 0.76 | 12,563.5 | 1.53 | 0.004 | 0.9 |
| Shrub land | 117,792 | 14.39 | 92,954.9 | 11.35 | 165,935 | 20.27 | 0.014 | 0.8 |
| Water body | 2764.56 | 0.34 | 2066.04 | 0.25 | 4613.58 | 0.56 | 0.00 | 0.0 |
| Wetland | 15,809.5 | 1.93 | 11,274.6 | 1.38 | 2562.66 | 0.31 | 0.05 | 0.8 |
| Total | 818,823.9 | 100 | 818,823.9 | 100 | 818,823.9 | 100 | ||
| LULC Types | 1986 | 2003 | 2020 | Percentage Change (%) | Rate of Change in ha/year | |||||||
|---|---|---|---|---|---|---|---|---|---|---|---|---|
| Area (ha) | % | Area (ha) | % | Area (ha) | % | 1986–2003 | 2003–2020 | 1986–2020 | 1986–2003 | 2003–2020 | 1986–2020 | |
| Bare Land | 9413.19 | 1.15 | 8601.39 | 1.05 | 4654.5 | 0.57 | −8.62 | −45.89 | −50.55 | −47.75 | −232.17 | −139.96 |
| Cultivation Land | 563,823 | 68.86 | 592,957 | 72.42 | 576,806 | 70.44 | 5.17 | −2.72 | 2.30 | 1713.76 | −950.06 | 381.85 |
| Forest Land | 96,475.9 | 11.78 | 76,634.6 | 9.36 | 48,326.3 | 5.90 | −20.57 | −36.94 | −49.91 | −1167.14 | −1665.19 | −1416.16 |
| Grass Land | 12,482.9 | 1.52 | 28,152.5 | 3.44 | 3362.4 | 0.41 | 125.53 | −88.06 | −73.06 | 921.74 | −1458.24 | −268.25 |
| Settlement Area | 262.89 | 0.03 | 6182.91 | 0.76 | 12,563.5 | 1.53 | 2251.90 | 103.20 | 4679.00 | 348.24 | 375.33 | 361.78 |
| Shrub Land | 117,792 | 14.39 | 92,954.9 | 11.35 | 165,935 | 20.27 | −21.09 | 78.51 | 40.87 | −1461.01 | 4292.95 | 1415.97 |
| Water Body | 2764.56 | 0.34 | 2066.04 | 0.25 | 4613.58 | 0.56 | −25.27 | 123.31 | 66.88 | −41.09 | 149.86 | 54.38 |
| Wetland | 15,809.5 | 1.93 | 11,274.6 | 1.38 | 2562.66 | 0.31 | −28.68 | −77.27 | −83.79 | −266.76 | −512.47 | −389.61 |
| Total | 818,823.9 | 100 | 818,823.9 | 100 | 818,823.9 | 100 | −8.62 | −45.89 | −50.55 | −47.75 | −232.17 | −139.96 |
| Year | Min | Max | Mean |
|---|---|---|---|
| 1986 | 0 | 867.3 | 53.2 |
| 2003 | 0 | 905.7 | 63.6 |
| 2020 | 0 | 958.2 | 64.8 |
| Severity Class | 1986 | 2003 | 2020 | ||||
|---|---|---|---|---|---|---|---|
| Soil Erosion Rate (ton/ha/year) | Area (km2) | % | Area (km2) | % | Area (km2) | % | |
| Very slight | 0–5 | 2089 | 25.5 | 2037.2 | 24.9 | 1950.5 | 23.9 |
| Slight | 5–15 | 1485.3 | 18.2 | 1190.1 | 14.6 | 1269.5 | 15.5 |
| Moderate | 15–30 | 1066 | 13.0 | 919.5 | 11.2 | 844.2 | 10.3 |
| Severe | 30–50 | 840 | 10.3 | 916.7 | 11.2 | 926.4 | 11.3 |
| Very severe | >50 | 2707.7 | 33.0 | 3124.5 | 38.1 | 3197.4 | 38.9 |
| Total | 8188 | 100.0 | 8188 | 100 | 8188 | 100 |
| LULC Types | 1986 | 2003 | 2020 |
|---|---|---|---|
| Mean Soil Loss (ton/ha/year) | Mean Soil Loss (ton/ha/year) | Mean Soil Loss (ton/ha/year) | |
| Bare land | 25.9 | 26.4 | 28.1 |
| Cultivated land | 74.3 | 83.7 | 87.6 |
| Forest land | 1.1 | 1.1 | 1.2 |
| Grassland | 1.0 | 2.3 | 3.2 |
| Settlement | 1.9 | 1.9 | 2.9 |
| Shrub land | 7.2 | 8.0 | 10.6 |
| Water body | 0.0 | 0.0 | 0.0 |
| Wetland | 2.8 | 4.3 | 4.5 |
| LULC Types | 1986 | 2003 | 2020 |
|---|---|---|---|
| Mean | 7.8 | 10 | 10.2 |
| Max | 195.3 | 293.2 | 334.5 |
| Min | 0 | 0 | 0 |
| SD | 16.2 | 18.5 | 21.5 |
Publisher’s Note: MDPI stays neutral with regard to jurisdictional claims in published maps and institutional affiliations. |
© 2022 by the authors. Licensee MDPI, Basel, Switzerland. This article is an open access article distributed under the terms and conditions of the Creative Commons Attribution (CC BY) license (https://creativecommons.org/licenses/by/4.0/).
Share and Cite
Teshome, D.S.; Moisa, M.B.; Gemeda, D.O.; You, S. Effect of Land Use-Land Cover Change on Soil Erosion and Sediment Yield in Muger Sub-Basin, Upper Blue Nile Basin, Ethiopia. Land 2022, 11, 2173. https://doi.org/10.3390/land11122173
Teshome DS, Moisa MB, Gemeda DO, You S. Effect of Land Use-Land Cover Change on Soil Erosion and Sediment Yield in Muger Sub-Basin, Upper Blue Nile Basin, Ethiopia. Land. 2022; 11(12):2173. https://doi.org/10.3390/land11122173
Chicago/Turabian StyleTeshome, Dawit Samuel, Mitiku Badasa Moisa, Dessalegn Obsi Gemeda, and Songcai You. 2022. "Effect of Land Use-Land Cover Change on Soil Erosion and Sediment Yield in Muger Sub-Basin, Upper Blue Nile Basin, Ethiopia" Land 11, no. 12: 2173. https://doi.org/10.3390/land11122173
APA StyleTeshome, D. S., Moisa, M. B., Gemeda, D. O., & You, S. (2022). Effect of Land Use-Land Cover Change on Soil Erosion and Sediment Yield in Muger Sub-Basin, Upper Blue Nile Basin, Ethiopia. Land, 11(12), 2173. https://doi.org/10.3390/land11122173