Article

Accuracy Analysis of the Indoor Location System Based on Bluetooth Low-Energy RSSI Measurements

Faculty of Electrical Engineering, Bialystok University of Technology, Wiejska 45D, 15-351 Bialystok, Poland
*
Author to whom correspondence should be addressed.
Energies 2022, 15(23), 8832; https://doi.org/10.3390/en15238832
Submission received: 28 October 2022 / Revised: 18 November 2022 / Accepted: 21 November 2022 / Published: 23 November 2022

Abstract

:
Systems for determining the position of objects inside buildings have a wide range of applications, such as the surveillance of people’s movements in hospitals, and of goods or mobile robots in warehouse spaces or production halls. Hence, there is a need for the development of methods that could be applied for those purposes. This paper presents the results of research on an experimental system for localizing people being evacuated from a building. The proposed solution was designed as a part of the building evacuation management system. The method used for finding location belongs to the class of proximity-type methods and is based on Received Signal Strength Indicator (RSSI) information of Bluetooth Low-Energy (BLE) devices. The devices used to build the system (BLE receivers) and the evacuee’s wristband (BLE transmitters) are low-budget electronic modules. The paper presents preliminary research and the process of selecting data processing methods, as well as the results of tests of the experimental network created for the evacuation system. The results of measurements and statistical analyses of the properties of the RSSI parameter of the BLE signal transmission between the modules used in the designed system are presented. In addition, the results of RSSI measurements and the analyses of RSSI recorded under varying environmental conditions in the building are presented. The choice of the data processing method and its parameters was made with the use of the determined probabilities of the nearest locator node detection. Finally, the performance of the experimental installation of the evacuee tracking system was tested and the effectiveness of the proximity method was evaluated. The experimental tests aimed to analyze the detection range and the impact of shading. They also allowed for determining the mean error and for estimating the maximum position determination error. It should be emphasized that the proposed position estimation method has a very low computational load, allowing the implementation of an extensive real-time system on a typical personal computer. Although the proposed system should be classified as a coarse positioning system, its features such as low cost, simplicity, flexibility, the use of commonly available components and low requirements for computational load make it attractive. Such a system is directly transferable to other applications in, for example, Industry 4.0.

Graphical Abstract

1. Introduction

Positioning-based solutions aim to reliably locate the exact position of a tracked object or person in real time (i.e., with a fixed high and constant degree of repeatability), both within and outside a building. Positioning solutions must be flexible and have good accuracy. In warehouses, for example, there is a need to know the exact location of goods in real time, whether stationary or on the move. These include both people and objects, such as forklift trucks, transport trucks and robots. Warehouse applications include inventory management, collision avoidance, employee safety and advanced workflow optimization.
Using Real-Time Location Systems (RTLS) [1], which utilize Bluetooth Low-Energy (BLE) or Ultra-Wideband (UWB) wireless communication technology and position determination methodology, companies can evenly cover a warehouse or its parts with locator nodes so that the system can reliably calculate the exact location of tags in real time [2]. Determining the location of a radio wave transmitter is an issue present in many applications. For instance, distance measurements are important in robotic and Internet of Things (IoT) applications, or in the location of patients in a care home, where the RSSI method with the trilateration technique can be used [3]. Due to the relationship between the accuracy of the distance determination and the bandwidth of the applied signal, if accuracy on the decimeter level is needed, the UWB technique can be applied [4]. It uses bands within a 3.1–10.6 GHz range.
In evacuation management systems, on the other hand, knowing or tracking the location of people plays an important role so that occupants can successfully leave a building and reach a safe place in the event of a fire, a gas leak or a terrorist attack. This is especially true in large buildings, such as factories and offices, where monitoring the efficiency and timing of evacuation is crucial in terms of the safety and survival of people. A particular area of application for such systems is in nursing homes and medical care facilities, whose residents are elderly, often incapacitated, people. In their case, even if they do not require continuous care, they may require assistance when they feel threatened. Hence, it is important to supervise the smoothness of their movement during evacuation and to monitor their basic vital functions.
The proposed evacuation system tracks the location of a person inside a building by using the Received Signal Strength Indicator (RSSI) of BLE transmission obtained from appropriately placed receivers. It also allows supervising the movement of evacuees and may even allow applying the optimal evacuation path regarding obstacles on the way [5]. The purpose of this study is to evaluate the accuracy of the location of a person wearing a wristband during the evacuation from a building.
The proposed system is characterized by simplicity and flexibility. Therefore, although it has been developed for a human evacuation system, it is directly transferable to other applications, such as surveillance of the movement of people or mobile robots in Industry 4.0 applications.

1.1. Related Works

The localization algorithms for BLE beacons, encountered in the literature, can be divided into three classes: proximity-based, range-based and fingerprinting (FP) [6,7,8,9]. The use of the RSSI parameter measured at the receiver is for detecting the presence in the proximity of a cooperating object transmitter and for localizing it. This has a number of advantages over other methods based on Time of Flight (TOF), Angle of Arrival (AOA) or Direction of Arrival (DOA) measurements [10,11,12]. The main advantages of the RSSI-based methods are the solution simplicity and the ability to be implemented in devices with Wi-Fi or Bluetooth connectivity without the need for hardware changes. Extension with new functionalities, such as presence detection and localization, is achieved by adding a software layer analyzing measurements normally carried out in receiver systems [10,13,14,15,16].
Two types of RSSI-based distance measurement systems are discussed in the literature. One, comprising the classes of proximity and range-based methods, is based on the use of propagation relationships [13,14,17,18]. The other one, fingerprinting, is based on taking a series of measurements of the signal strength received from a transmitter placed at various points of a given building and storing them in a database. In this case, the location of the transmitter is determined by comparing the measured RSSI with the values from the database and interpolating the location accordingly.
Over the past few years, researchers have proposed, simulated and implemented a number of algorithms and localization techniques using RSSI values and the propagation time of electromagnetic waves between wireless devices. The methods and techniques used are as follows: log distance path loss model, trilateration, multilateration, fingerprint method, centroid algorithm, weighted centroid algorithm, maximum likelihood estimation (MLE), k-nearest neighbor method, Kalman filter, particle filter and Gaussian model [19,20,21,22,23,24].
The measurement of the received signal power is commonly carried out and is usually made available to the user as the RSSI parameter and sometimes also as the RX (received signal) parameter. Based on the relationship between the decrease in the received signal power and the increase in the distance between the transmitter and receiver, it is possible to determine the distance between them. By processing measurements from several receivers located in space, it is possible to obtain the spatial localization of the receiver by means of trilateration or multilateration. The above method is simple, as there is no need for time synchronization between the received and transmitted signal. It is also independent of the efficiency of the modulation type and data transfer rate, or of the precision of time synchronization systems, and above all, there is no need for additional systems which measure the delay time or the observation angle.
However, it should be noted that the RSSI-based methods of distance measurement and position determination are less accurate than methods based on TOF or AOA. This is due to fluctuations in signal strength resulting from multipath propagation and interference in the radio channel, which causes fluctuations in the determined distance. In order to achieve useful accuracy of the localization system, it is necessary to use more measurement points than required for trilateration [10,13,14].
The intensity of the problems mentioned above depends on the immediate surroundings, so it is necessary to undertake appropriate studies to take into account the specifics of the target building in which the evacuation system is supposed to be applied. In addition, it should be remembered that not only the location of the object concerning the nearest obstacles but also its orientation and the specific type of equipment used may affect the signal strength and the distance and position estimates obtained [11,13,15,25]. Therefore, the above aspect should also be included in the research program, allowing these phenomena to be taken into account in the developed algorithms implemented in the localization system software.

1.2. Contributions of This Work

The contribution of this article to the research area includes:
  • Implementing a RSSI-based positioning system in an evacuation management system to support the evacuation guidance used in a building;
  • Presenting the successive stages of the system design, together with the selection and design of methods for processing RSSI data;
  • Carrying out research and analysis of the RSSI properties based on real measurements in a building;
  • Presenting the results of measurements and statistical analyses of the properties of the RSSI parameter of BLE signal transmission between the modules used in the designed system;
  • Selecting and identifying the parameters of the RSSI distance dependence model;
  • Presenting the results of RSSI measurements and analyses of RSSI recorded under varying environmental conditions in the building, and selecting the data processing method and its parameter using the determination of the nearest locator node detection probability; and
  • Verifying the performance of an experimental network of the positioning system, and evaluating the effectiveness of the proximity method. The experimental tests performed were aimed at analyzing the detection range and the impact of shading. The tests also made it possible to determine the mean error and estimate the maximum error of the position determination.

2. Materials and Methods

The received signal power in commonly used devices is most often made available to the user as the RSSI parameter, and sometimes as RX. The RX parameter is defined unambiguously as the received signal power expressed in mW or dBm, while there is no standard established for RSSI. Depending on the equipment manufacturer, the RSSI value can be defined, for example, as a percentage of the range (or a number within the 0–100 range), a number within the 0–127 range, or a dBm value [6,13,20].
As part of the study, a method based on propagation relationships was created and used. Taking into account the previously mentioned propagation problems, the different properties of antennas, and the transmit and receive paths of commercially available equipment, including automatic gain control systems, as well as the lack of a uniform standard for the RSSI parameter used by different manufacturers, it was necessary to carry out tests for specific equipment in an environment similar to the typical one of the target network.
The research program was divided into three stages. In the first one, measurements and analysis of the statistical properties of the RSSI parameter of BLE signal transmission between the modules used in the designed system were conducted. In addition, the parameters of the RSSI distance dependence model were selected and identified.
In the second stage, RSSI data were measured and analyzed under varying environmental conditions to test the feasibility of using the studied modules to determine the closest locator node. The need for additional data processing was shown and a filtering method was selected. Next, a study was conducted on the selection of the filter parameter using the determined locator node detection probabilities at different parameter values.
In the third stage, the performance of the system was tested and the effectiveness of the proposed methods of determining location based on the nearest locator node was evaluated, and the error of determining location was estimated.

2.1. Model of the Relationship between Measured RSS Readings and Corresponding Distances

In an indoor location using BLE beacons, the radio propagation model is typically used to model the relationship between measured RSS readings and their respective distances. The most frequently used model is the lognormal model [19,26]. The RSSI at a given distance d can be modeled as follows:
R S S I ( d ) = R S S I d 0 10 γ l o g 10 ( d d 0 ) + X σ
where RSSId0 denotes the RSSI at the reference distance d0, γ is the path loss coefficient and Xσ is zero-mean Gaussian random noise with a variance σ2 [27]. The γ term is usually chosen empirically for the given equipment and environment.
Hence, the measured RSSI is assumed to follow a normal distribution RSSI∼N(mRSSI, σRSSI2), where mRSSI is the expected value of the RSSI and σRSSI2 is the variance of the measurement.

2.2. Locator Module and Wristband Description

Modules with an ESP32 chip and a PCB antenna were used as locator nodes (Bluetooth receivers with RSSI measurement). An example of a locator node from an experimental installation is presented in Figure 1a. The Bluetooth module of the wristband prototype was used as the transmitter (localized object). In this stage, the Bluetooth module of the wristband prototype shown in Figure 1b served as the localized object.
Programmable watches and wristbands available on the market today usually use two models of microcontrollers (BLE modules). There is also a group of older models using chips from the PIC, AVR or ESP MCUs (Microcontroller Units) families. Current designs, however, use ESP32 (Espressif Systems) or nRF52832 (Nordic Semiconductor) processors.

2.3. Stage A—Study of the Basic Properties of the RSSI Parameter of the BLE Signal Received by Locator Nodes Used in the Experimental System

The first stage of the research focused on determining the properties of the RSSI parameter of the received Bluetooth signal provided by the locator nodes and transmitters used. For this purpose, 24 series of RSSI measurements were carried out at different distances between the transmitter and the receiver locator nodes. In the further part of the article, the n-th locator node will be denoted as LocXn, while the m-th location of the transmitter will be denoted as PXm, where X ∈ {A, B, C} depends on the stage of testing.
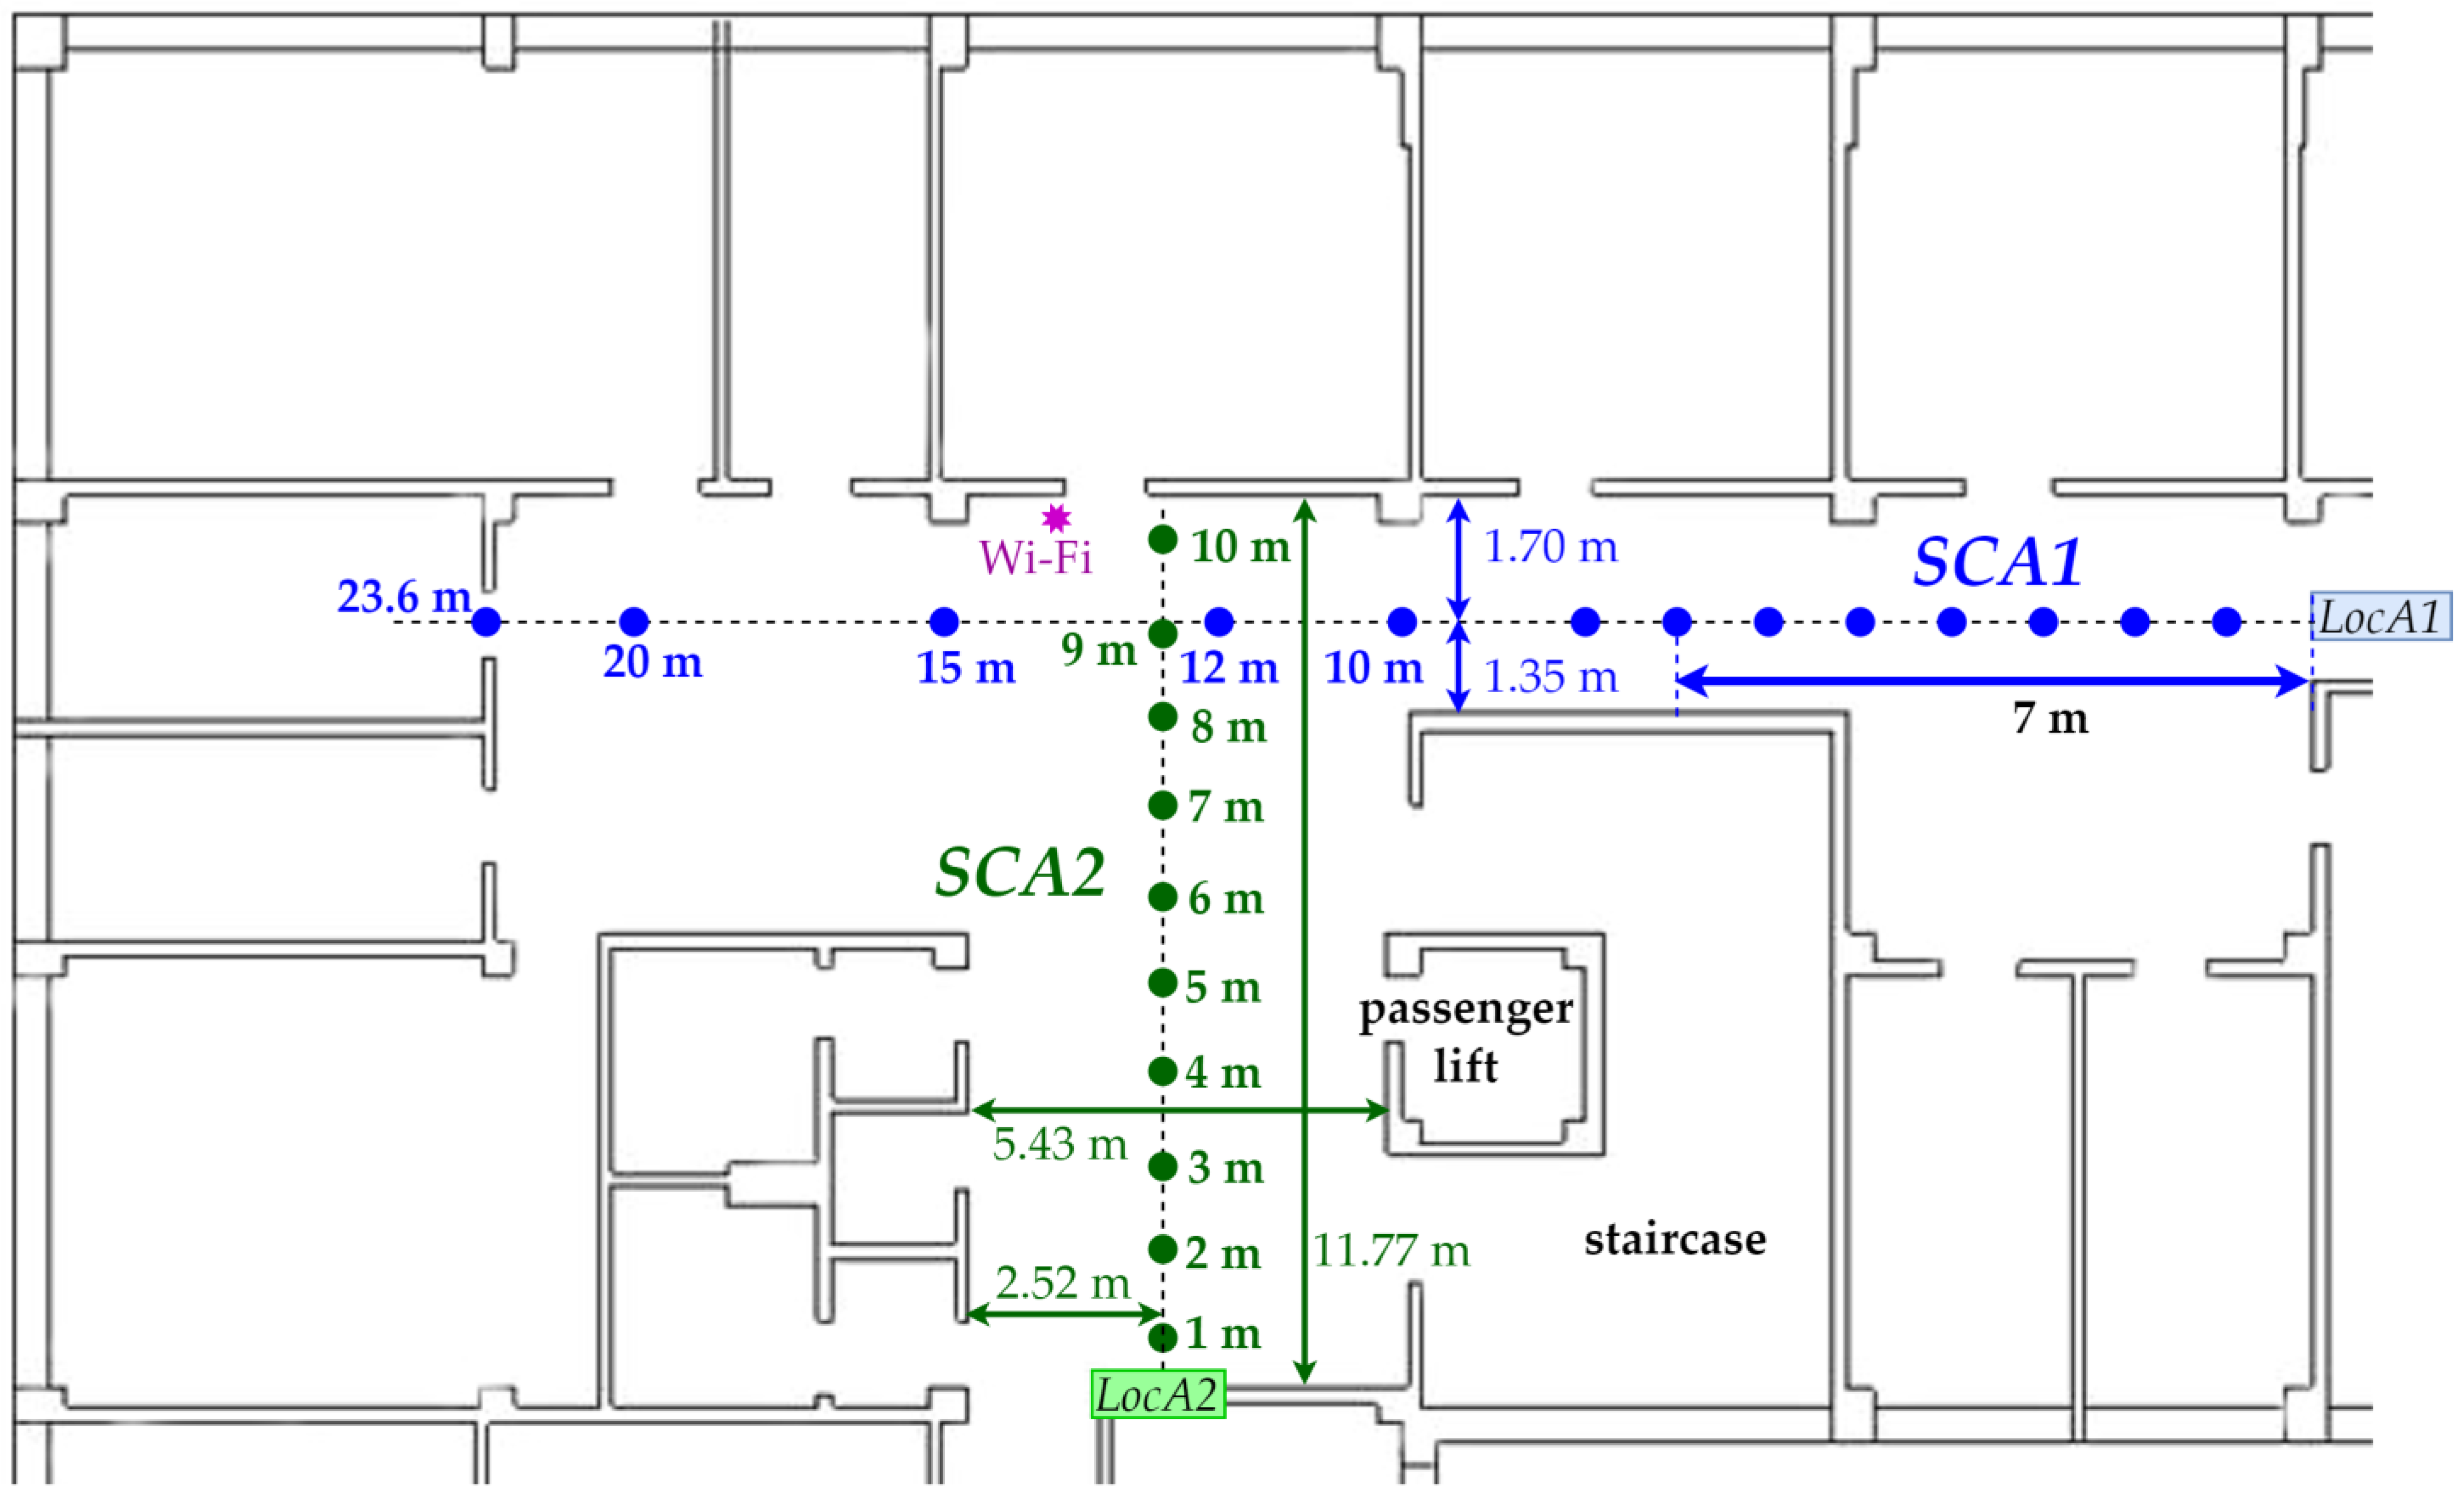
The research was conducted in a corridor on the third, top floor of a building with an elevator. The locator node (BLE receiver) was placed 0.5 m above the floor at a distance of 1.7 m from the wall. The height of the room was 3 m. The transmitter, suspended at 0.5 m above the floor, was placed sequentially at 14 locations at distances between 0.5 m and 23.6 m from the receiver. At each location, measurements were conducted for about 5 min with a sampling rate of 1 Hz. This allowed for the recording of about N = 300 measurements per location. This series of measurements was designated as SCA1.
The next series of measurements, designated as SCA2, were conducted in the same room, but in the perpendicular direction to SCA1. This organization of measurements was intended to conduct a series of tests under slightly different multipath and interference conditions, although in both cases, due to the vast space, these effects should be minimal. In this case, the transmitter was placed sequentially at 10 locations, 1 m to 10 m (changing every 1 m) from the receiver. A drawing of the measurement locations according to scenarios SCA1 and SCA2 is included in Figure 2.

2.4. Stage B—Study of the Environmental Effect on the RSSI Characteristics of the Transmitter-Locator System

The second stage of the research focused on studying the effect of the direct locator-transmitter system environment on RSSI properties. The results of tests conducted for the raw RSSI data confirmed the need for filtering and allowed the selection of the type and parameters of the filter. The purpose of the research conducted at this stage was to test the feasibility of using the RSSI parameter of the received BLE signal to determine the closest-to-object locator node. This approach makes it possible to determine the location of a localized object with an accuracy that depends on the density of the locator node distribution grid.
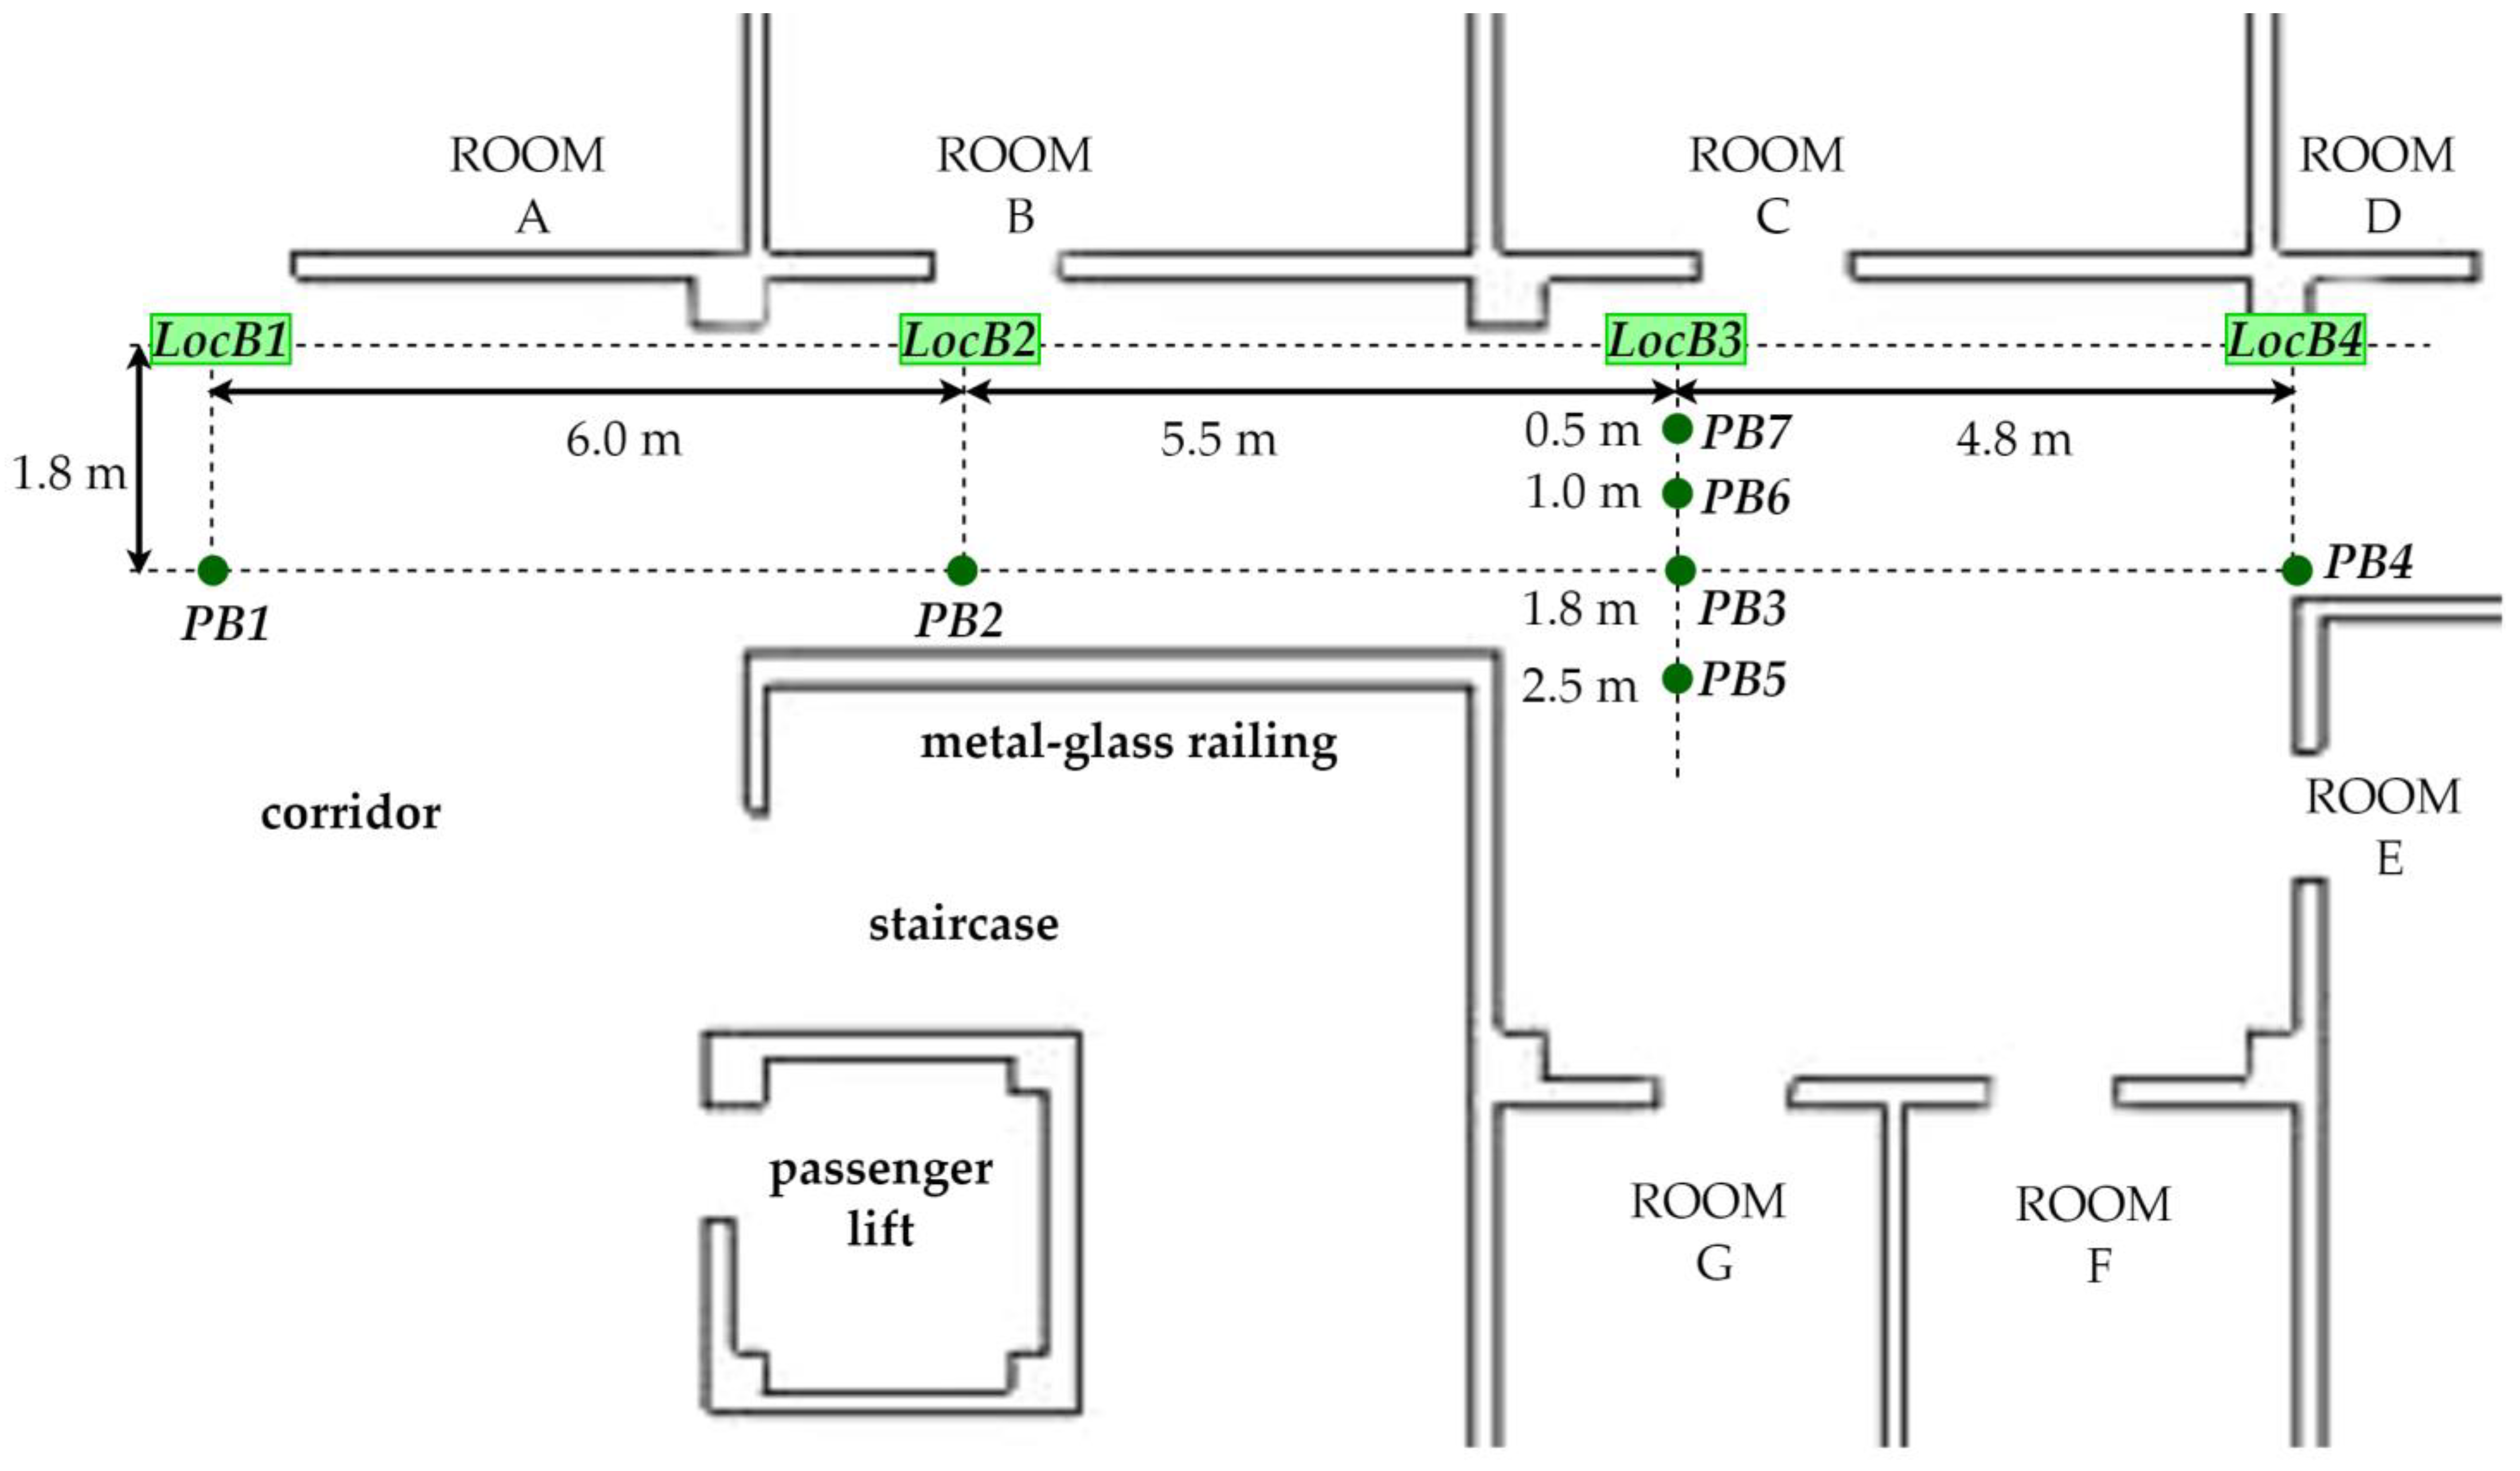
The study was conducted in the same corridor as the Stage A study. Four locator nodes (labeled LocB1, LocB2, LocB3, LocB4) were placed along the wall at intervals of 6.0 m, 5.5 m and 4.8 m at 0.5 m above the floor (Figure 3). The height of the room was 3 m. The transmitter, suspended at 0.5 m above the floor, was placed sequentially at 7 locations: at a distance of 1.8 m in front of each locator node, and additionally at distances of 2.5 m, 1.0 m and 0.5 m opposite to LocB3. A sketch showing the mutual location of locator nodes (LocB1, LocB2, LocB3, LocB4) and object locations (PB1, PB2,…, PB7) is shown in Figure 3.
The tests were conducted for stationary objects. Measurements were carried out for about 5 min each time, which, with a sampling rate of 1 Hz, allowed the recording of about 300 measurements per location. The location of the tests was chosen so that each locator node was placed in slightly different conditions, such as a narrow corridor (LocB4), a wider space (LocB3, LocB1), the presence of a source of potential interference from Wi-Fi transmitters also operating in the 2.4 GHz band (LocB1), a nearby metal structure of an elevator shaft and a metal stair handrail (LocB2).

2.5. Stage C—Testing the Effectiveness of the Evacuation Management System

The final, third stage of the research was conducted using the created experimental network that is part of the evacuation surveillance system. At this stage, the operation of the system was checked and the effectiveness of the proposed methods of determining location based on the nearest locator node was evaluated, and the error of determining location was estimated.
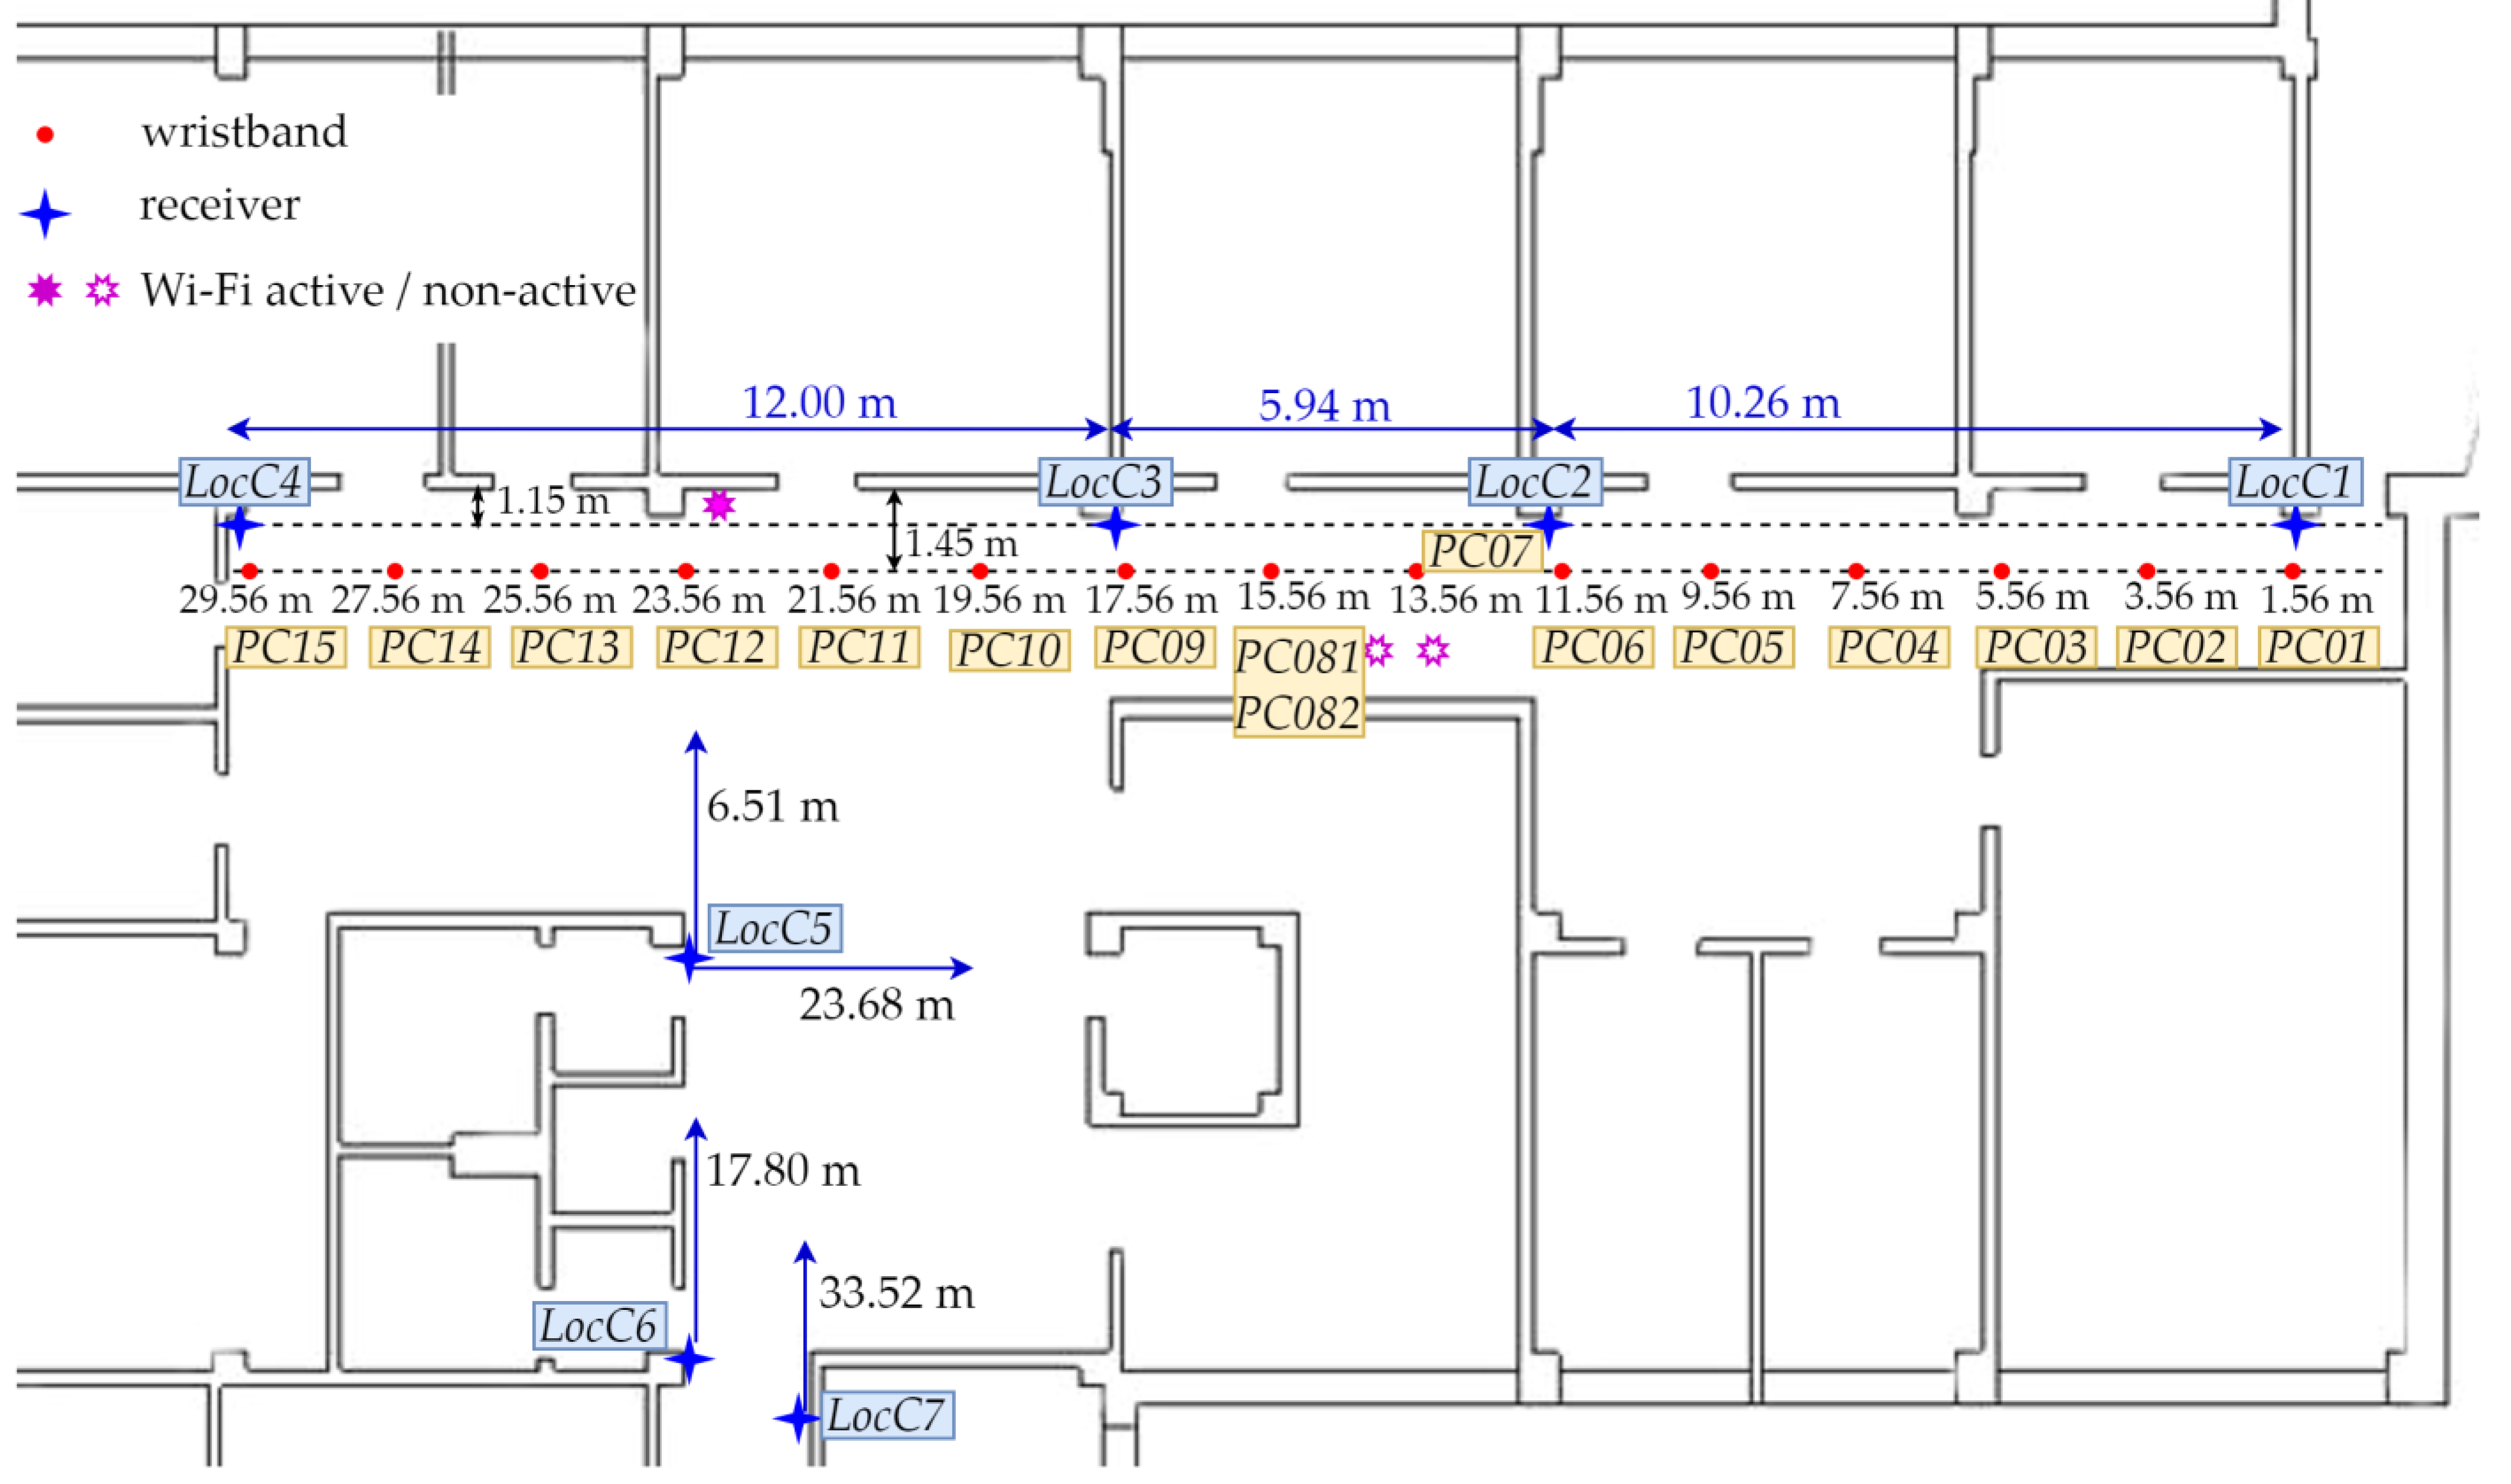
The experimental installation of the evacuation surveillance system was mounted on the third floor of a university building. Seven locator nodes (designated as LocC1, LocC2, LocC3, LocC4, LocC5, LocC6 and LocC7) were placed along the walls of the corridors and lobby at points approximately 6 m to 12 m apart. The specific mounting location was based on the building architecture and the electric power availability. A sketch of the locator nodes placement is shown in Figure 4. The locator nodes were suspended from the ceiling at 2.70 m above the floor (Figure 5). The height of the room was 3 m. The transmitter (wristband) was placed on a stand at 0.9 m above the floor (Figure 5), which is the height of the average position of a wristband worn on a hand. The stand with the wristband was placed sequentially at 15 locations in a line, 1.45 m away from the wall, every 2 m starting from the position under the LocC1 locator node. A sketch of the object placement points during the series of measurements is shown in Figure 4. The points of measurement acquisition are marked as PC01, PC02,…, PC15. In addition, at the point labeled PC082, the orthogonal position of the band relative to PC081 was used to estimate the effect of the orientation of the Bluetooth antenna.

3. Results of Experiments

This section presents the results of the measurement experiments along with their analysis and conclusions important for developing the evacuation supervision system. First, as we explain in Section 3.1, the basic properties of RSSI data obtained in the modules planned for use were determined. Next, the influence of the environment on the properties of the RSSI was determined. On this basis, a data processing method and its appropriate parameters were selected based on the probability of detecting the nearest locator node. This is the scope of Section 3.2. In the last stage, described in Section 3.3, the performance of the experimental installation of the evacuation supervision system was analyzed. At this stage, an analysis of the detection range was carried out, and the mean error and the maximum error of the position determination were estimated. The subsequent stages of the research were conducted as described in Section 2.

3.1. Experimental Research on the Basic Properties of the RSSI Parameter

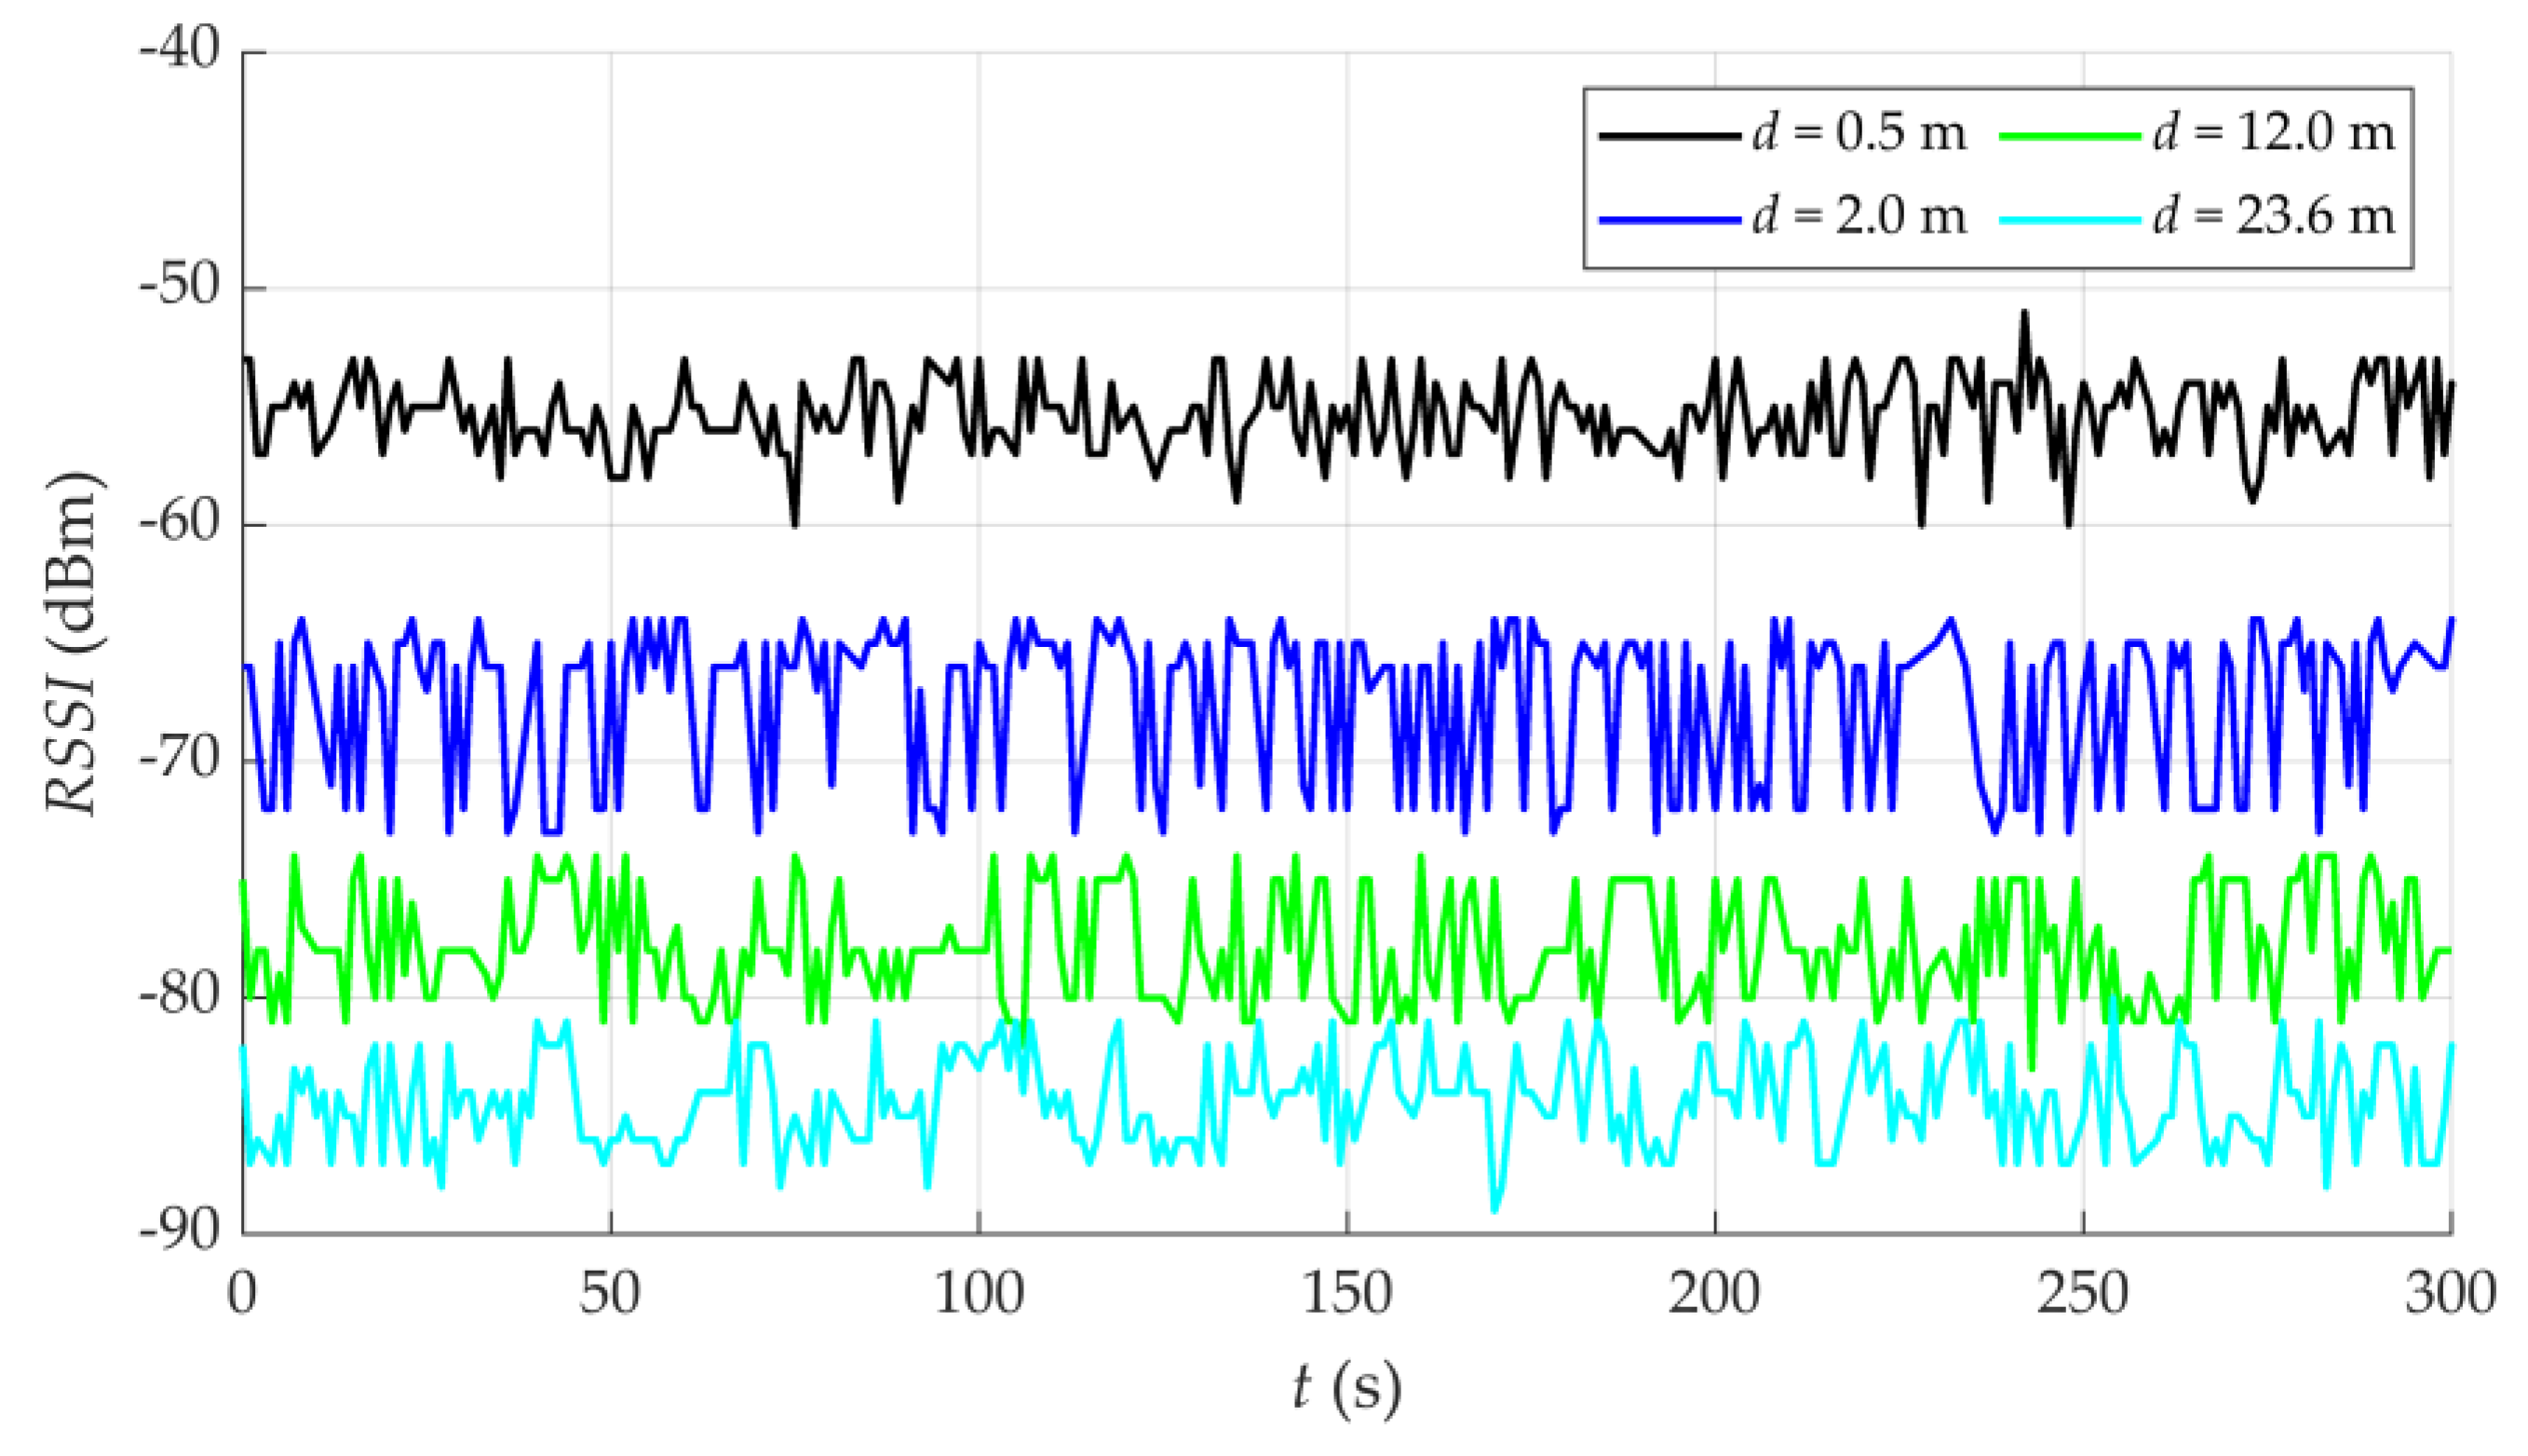
The first stage of the analysis of the collected data aimed at the determination of the statistical properties of the RSSI signal at different transmitter–receiver distances, i.e., RSSI = f (d), for stationary objects located in a large hall inside a building. RSSI measurements were carried out according to the SCA1 and SCA2 scenarios described in Section 2.3. Figure 6 shows a series of RSSI values collected during the measurement session according to the SCA1 test scenario for selected distances.
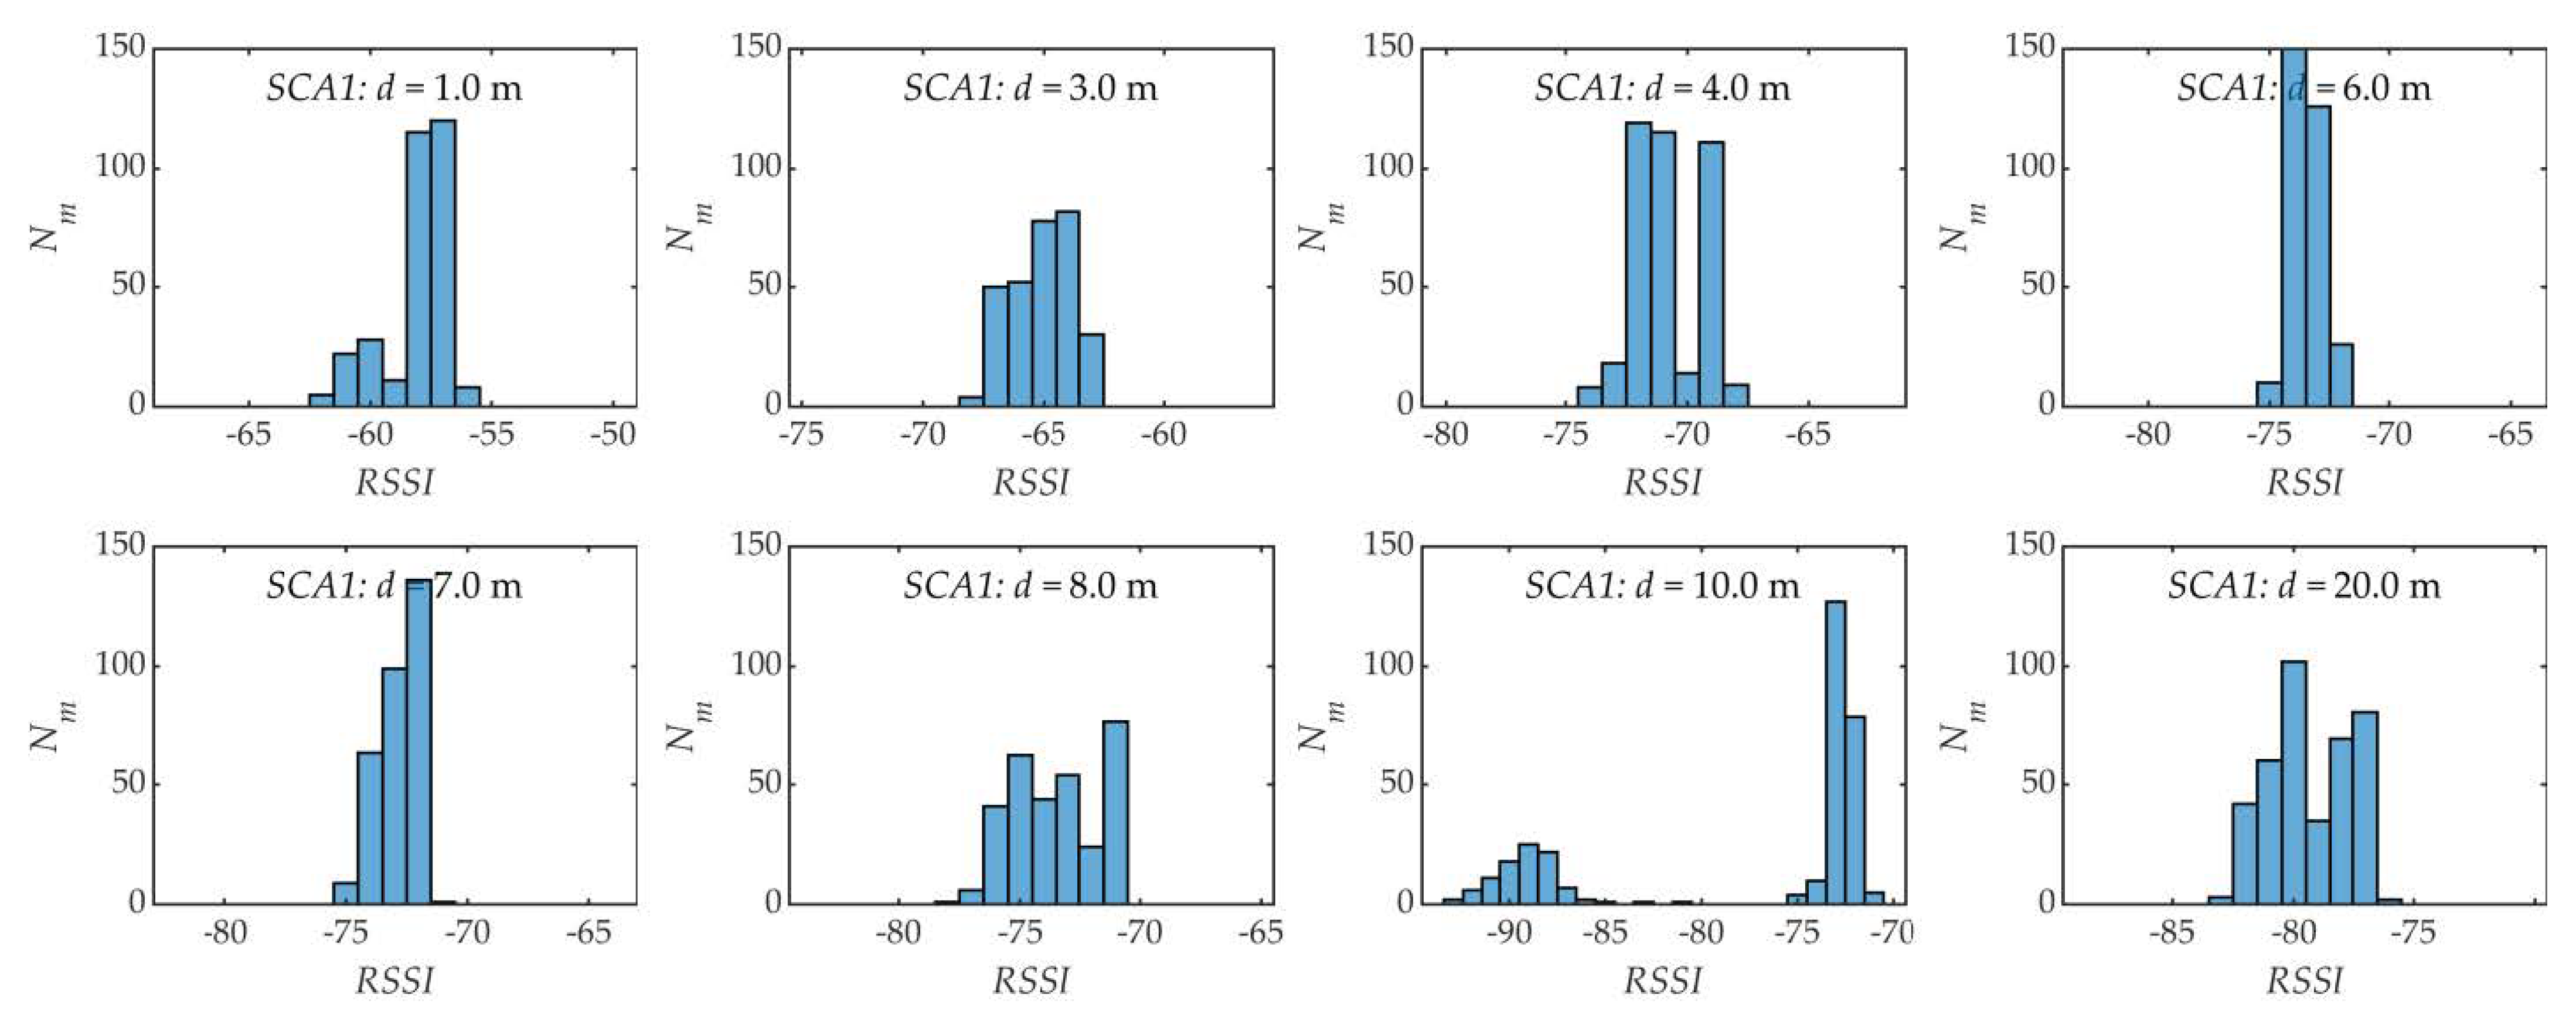
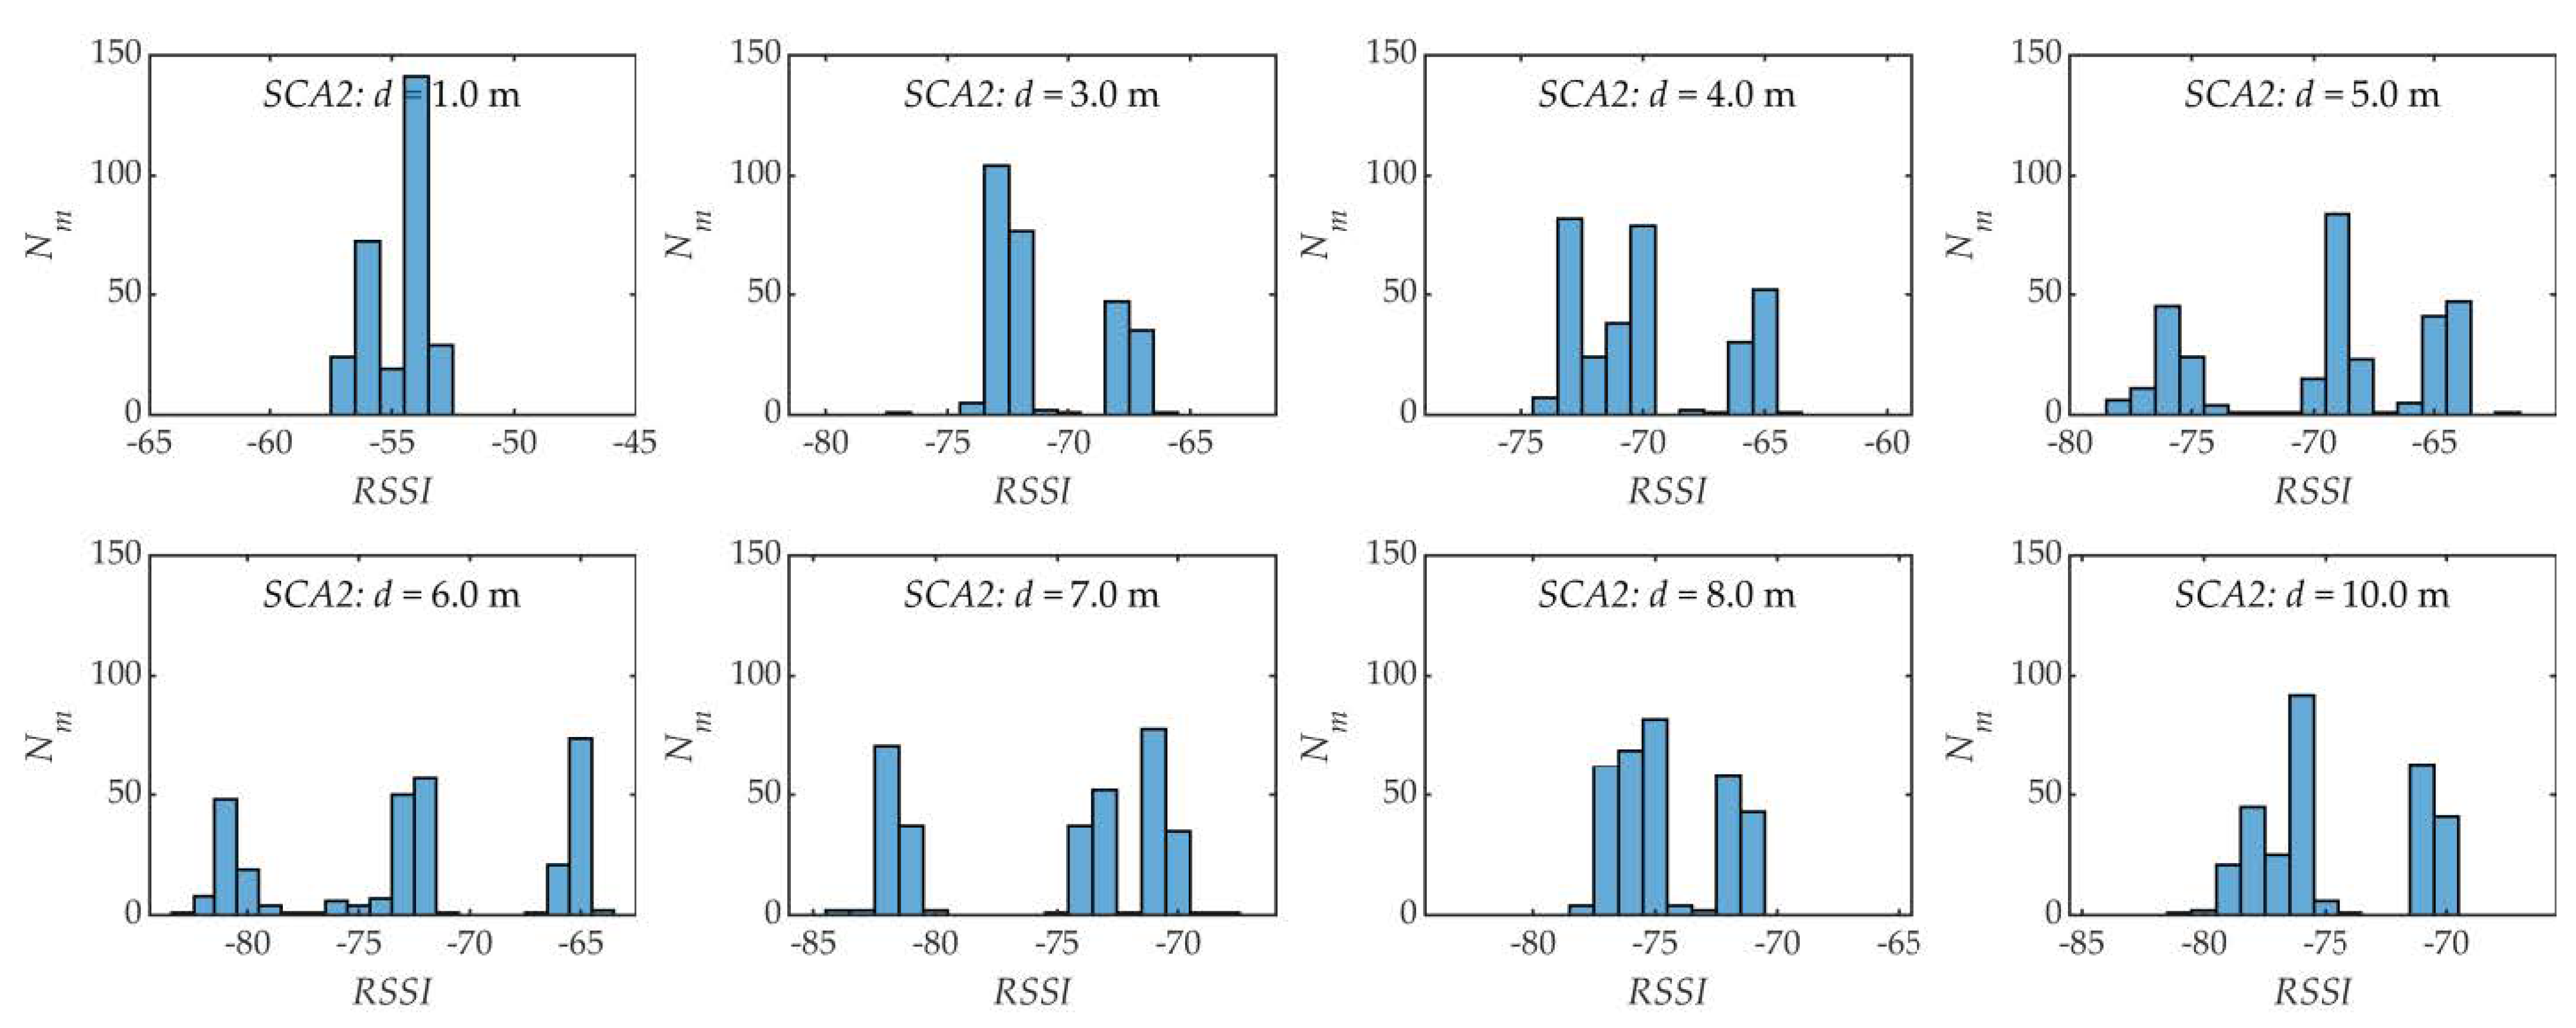
As it can be seen in Figure 6, the RSSI values of the signal depend on the distance, which is consistent with the theoretical analysis. However, although the received signal comes from a stationary transmitter, its power varies considerably over time. The random nature of the signal level is obvious. Its analysis is facilitated by the histograms of the RSSI value distributions presented in Figure 7 and Figure 8. They show the number of measurements Nm with specific RSSI values from the entire series for selected points PAm placed at specific distances d from the locator node.
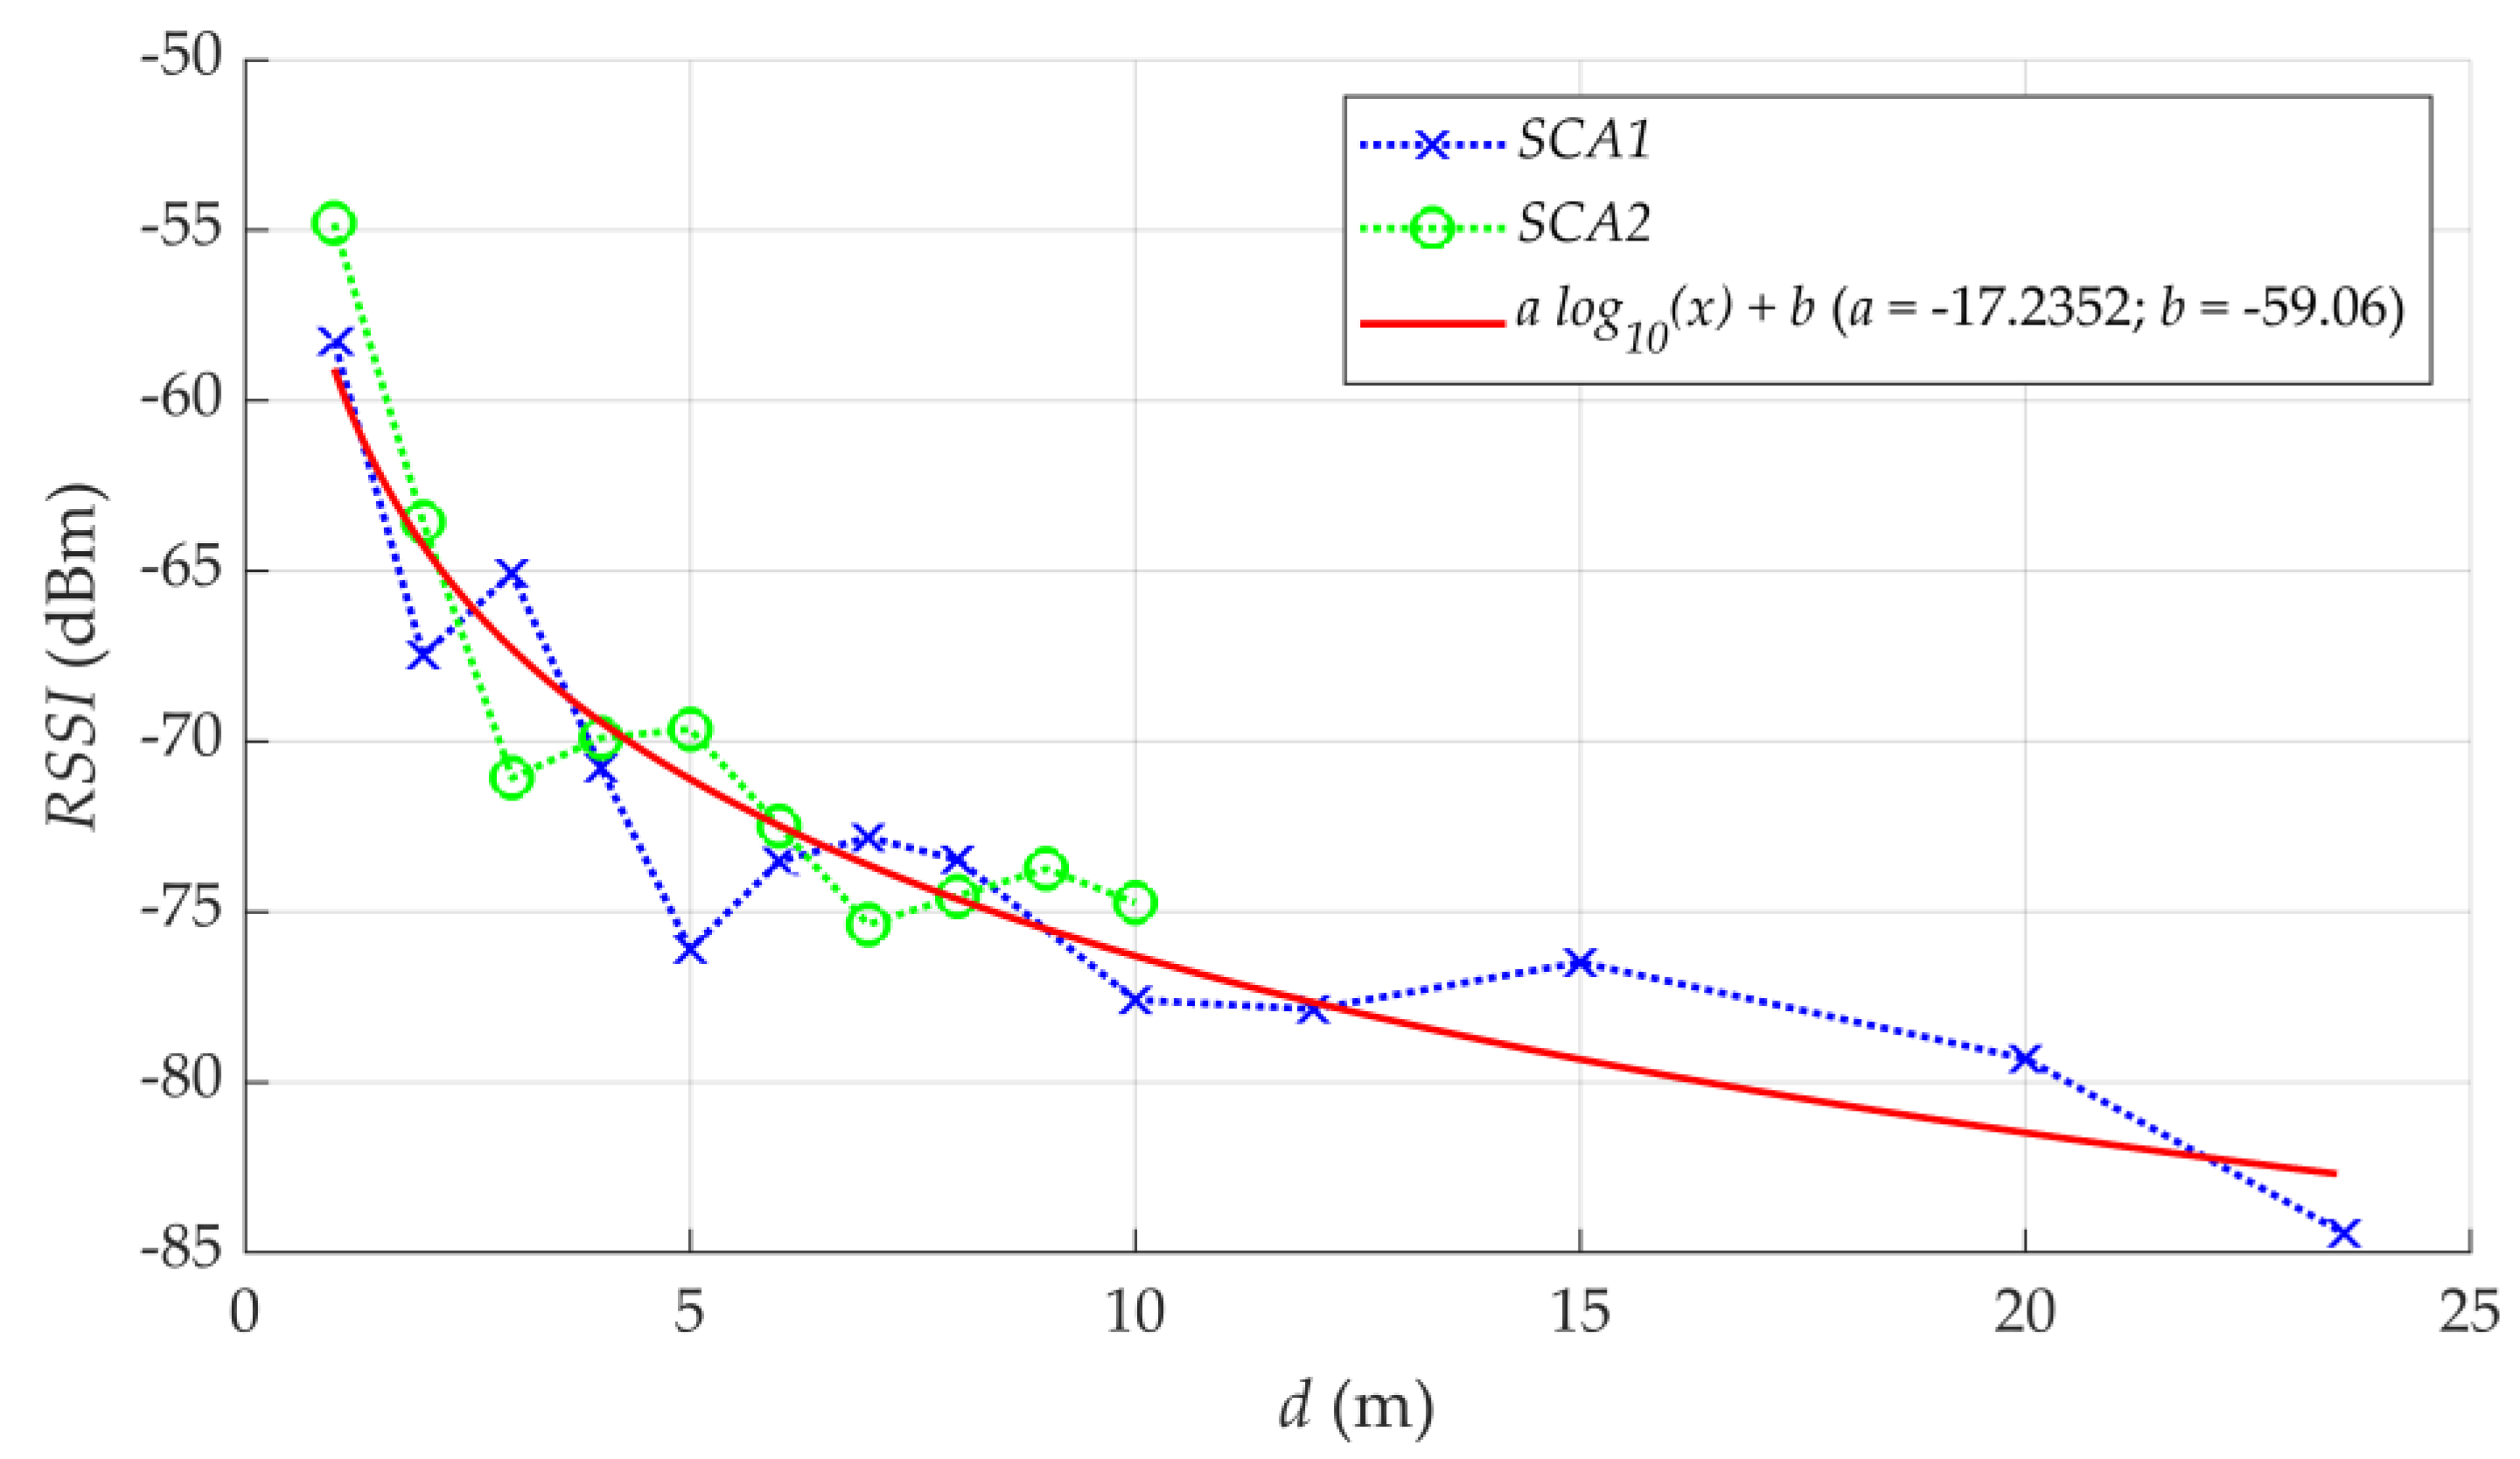
The analysis of the histograms presented in Figure 7 and Figure 8 does not confirm the assumption of the Gaussian nature of disturbances, often found in the literature. In addition, a comparison of the RSSI distributions obtained in the SCA1 and SCA2 test scenarios reveals differences at the same distances. This results from the multipath effect. In fact, with a Bluetooth system operating in the 2.4 GHz band, the wavelength is approximately 12.5 cm, so the transmission path differences of a few centimeters that are unavoidable in confined spaces will cause fluctuations in the signal level. As a result, the distribution of the RSSI may take on the form of a bimodal or multi-modal-like distribution [28]. The bimodal distribution is visible in Figure 7 (for d = 10 m) and Figure 8 (for d = 3 m, 8 m and 10 m), while the multimodal distribution is shown in Figure 8 (for d = 5 m, 6 m and 7 m). The mean values ( m R S S I ) and standard deviations ( σ R S S I ) of the series of RSSI measurements performed according to the SCA1 and SCA2 test scenarios are summarized in Table 1, and m R S S I as function of d is also presented in Figure 9. The figure also shows a logarithmic model of the function m R S S I = f ( d ) in the form (2), which is based on Model (1).
m R S S I ( d ) = a · l o g 10 ( d ) + b
where d is the distance between the receiver and the transmitter, while a and b are parameters whose values depend on the type of equipment and the environment.
The identification of parameters a and b of Model (2) was carried out with the use of the nonlinear least squares method using the Levenberg–Marquardt (LM) algorithm [29]. Model (2) with the parameter values a and b, obtained in this identification, is shown in Figure 9. Other algorithms can also be used, e.g., nonlinear least squares (NLS), the semidefinite programming (SDM) method and the recently developed weighted three minimum distances (WTM) method [30].
As it can be seen in the analysis of data presented in Table 1 and Figure 9, the mean value of RSSI of both measurements series (SCA1 and SCA2) decreases logarithmically with distance, although local deviations from this trend, due to interference, are visible. Therefore, it may be concluded that in the tested system, the information about the RSSI of the received Bluetooth signal makes it possible to determine the distance between the transmitter and the receiver with a certain accuracy depending on the environment.
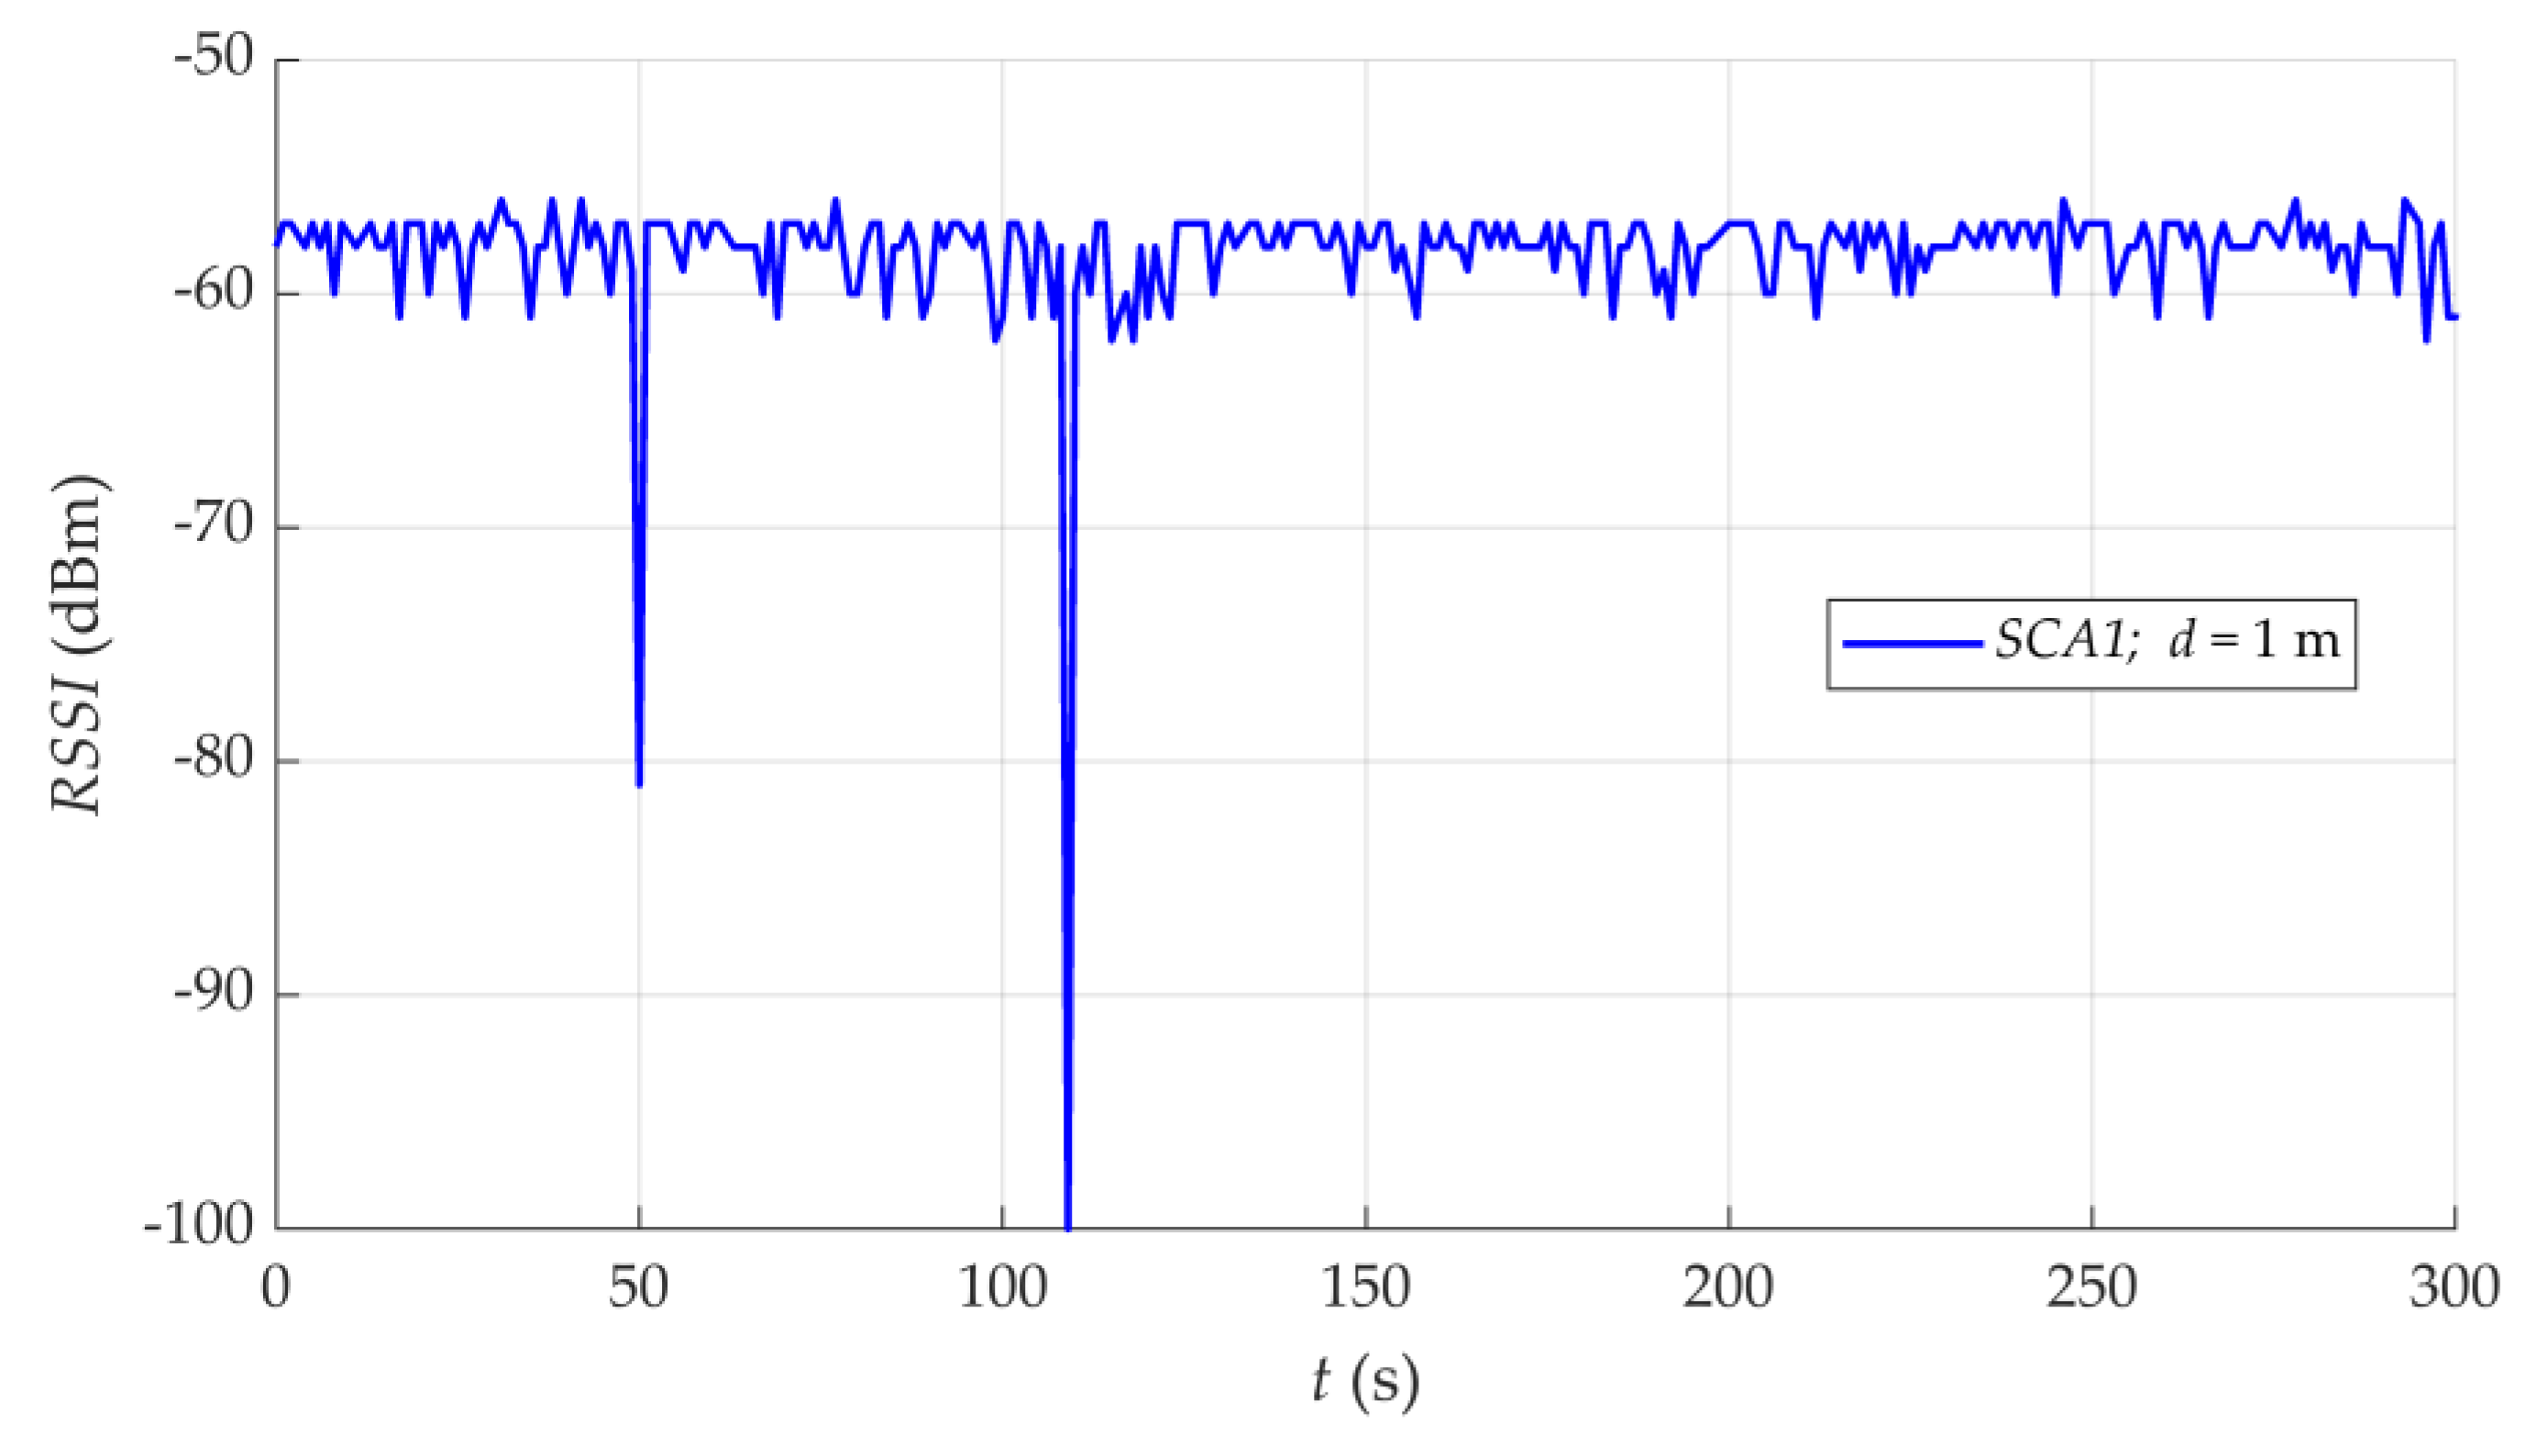
Additional statistical analysis of the obtained RSSI measurements allowed for determining the occasional occurrence of outliers. An example of their registration is shown in Figure 10.
Outliers result in a significant increase in estimation errors. Therefore, the applied estimation algorithms should take into account the a posteriori probability of the measurement channel state or should be able to detect and eliminate such measurements [31,32,33].

3.2. Influence of the Environment on the Properties of the RSSI and Data Processing Method

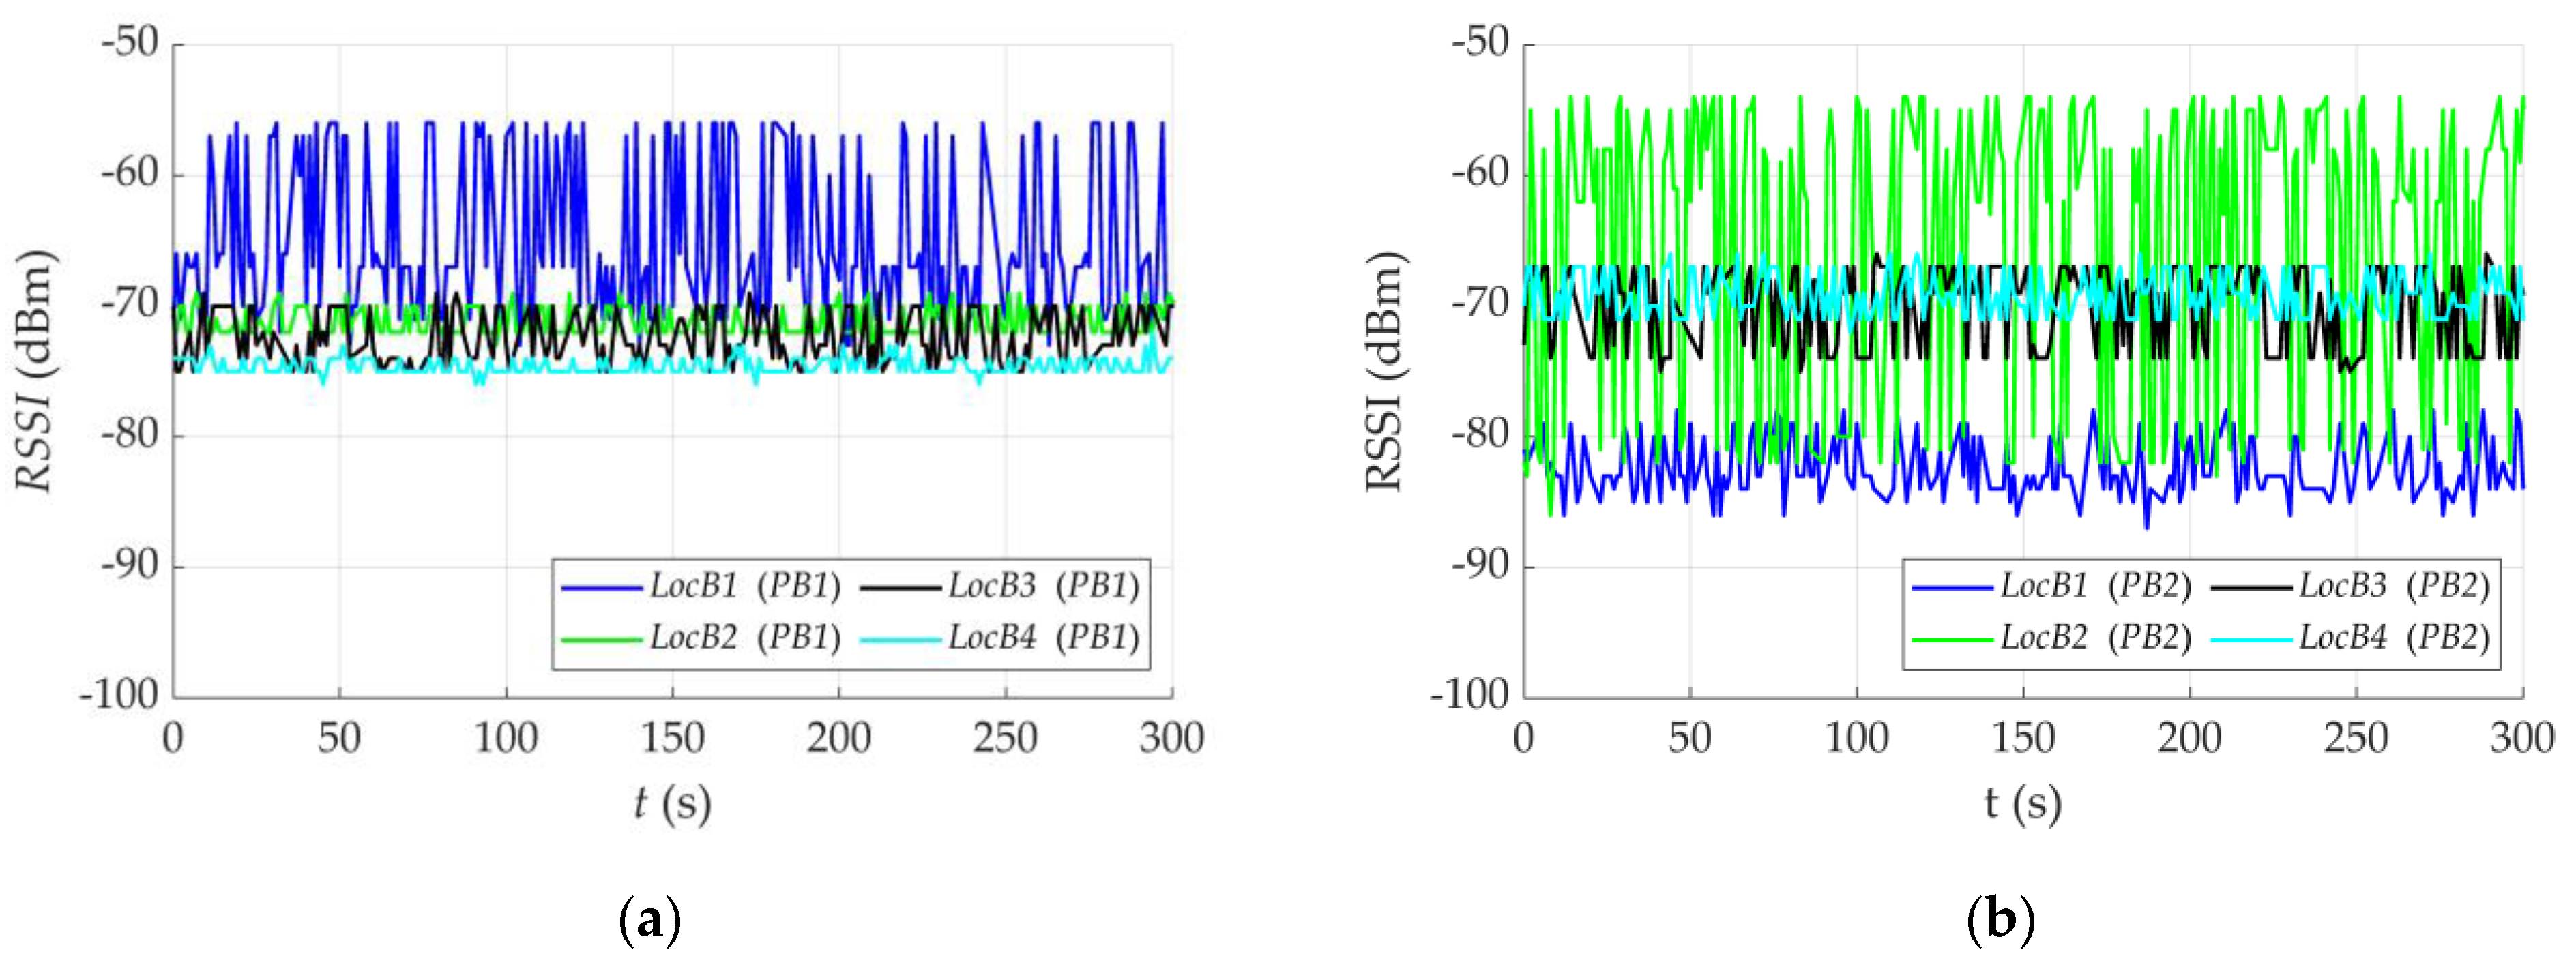
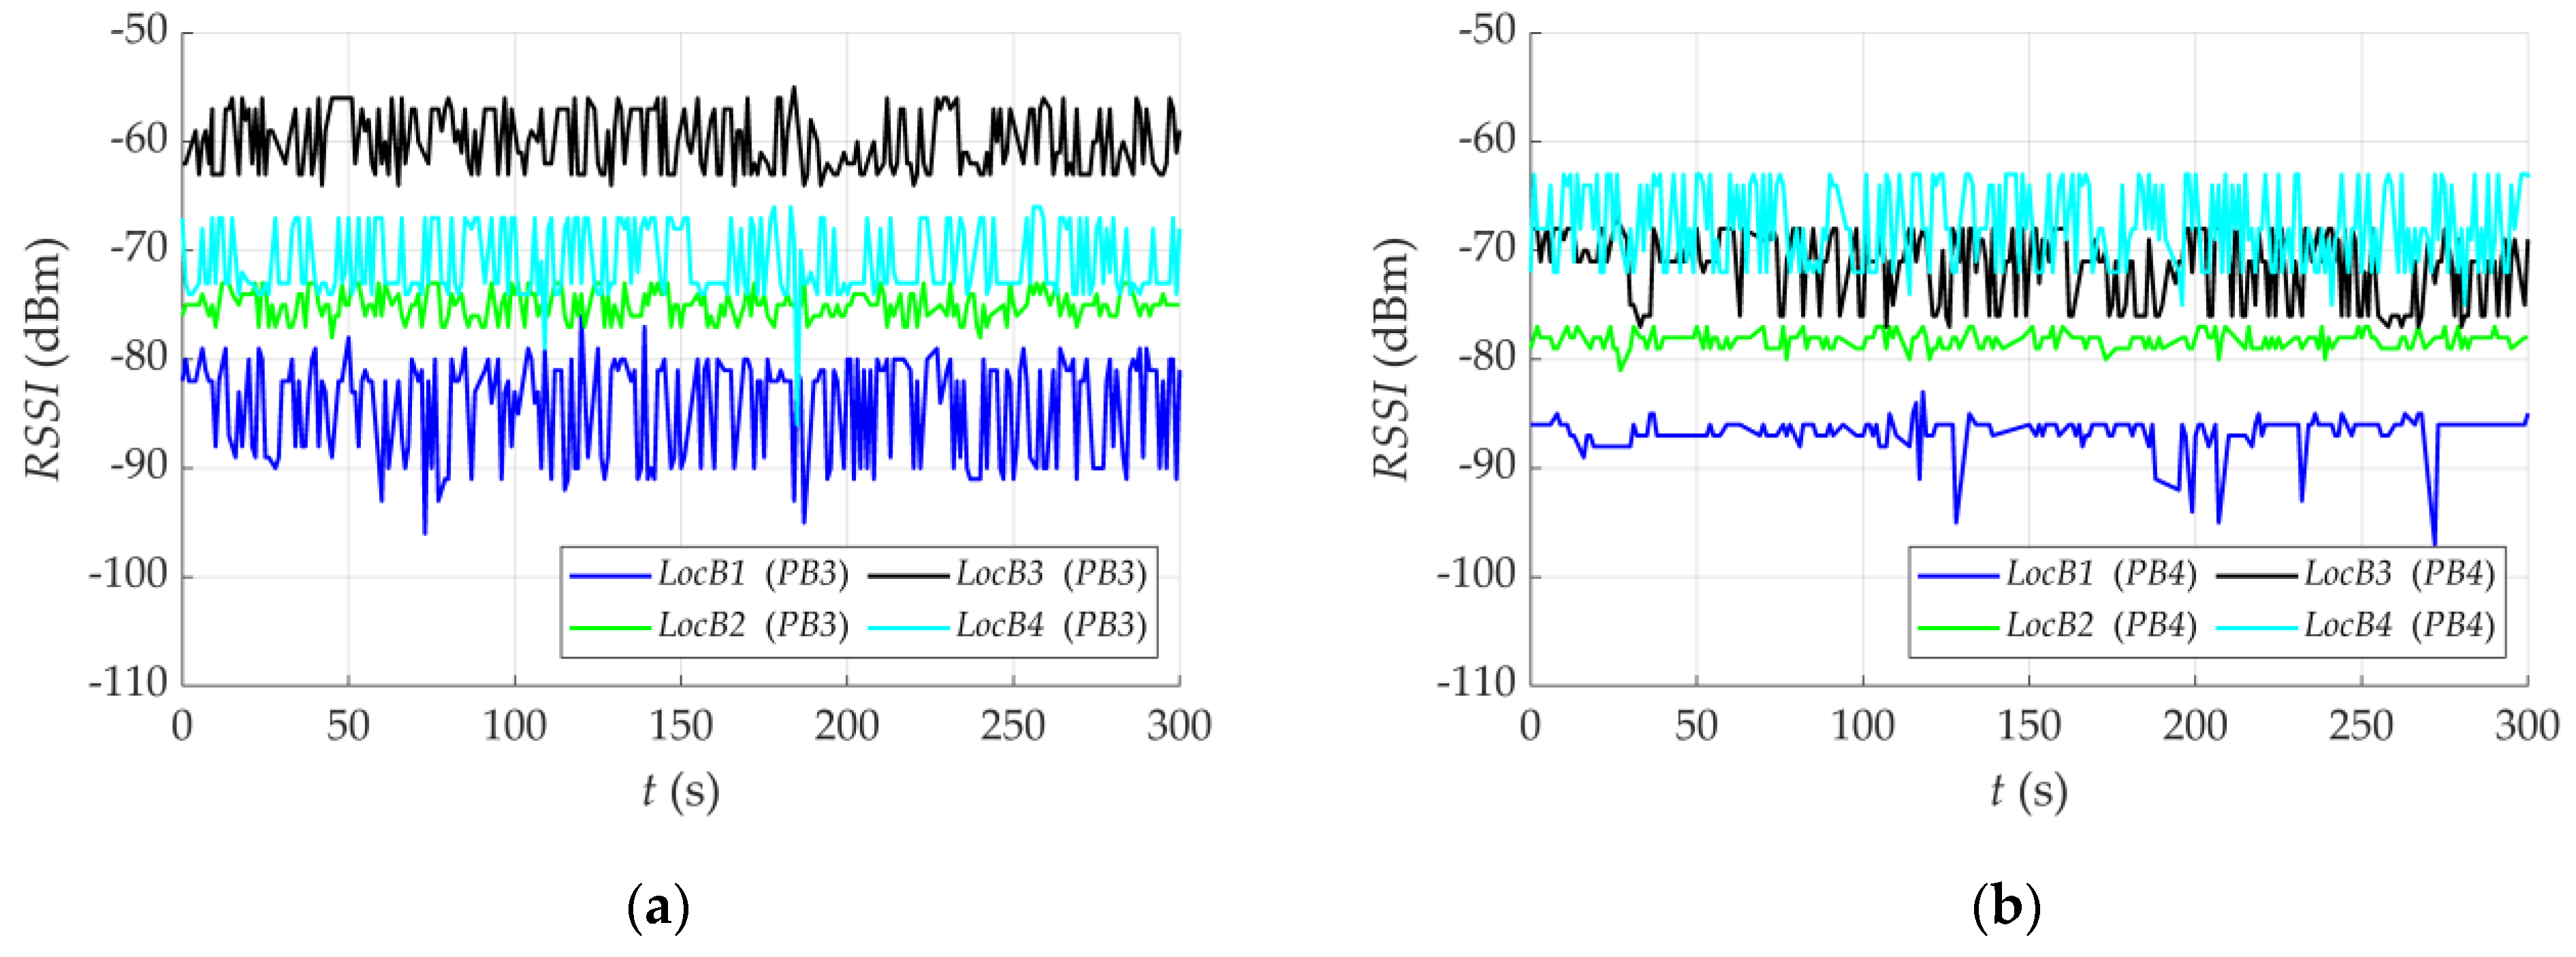
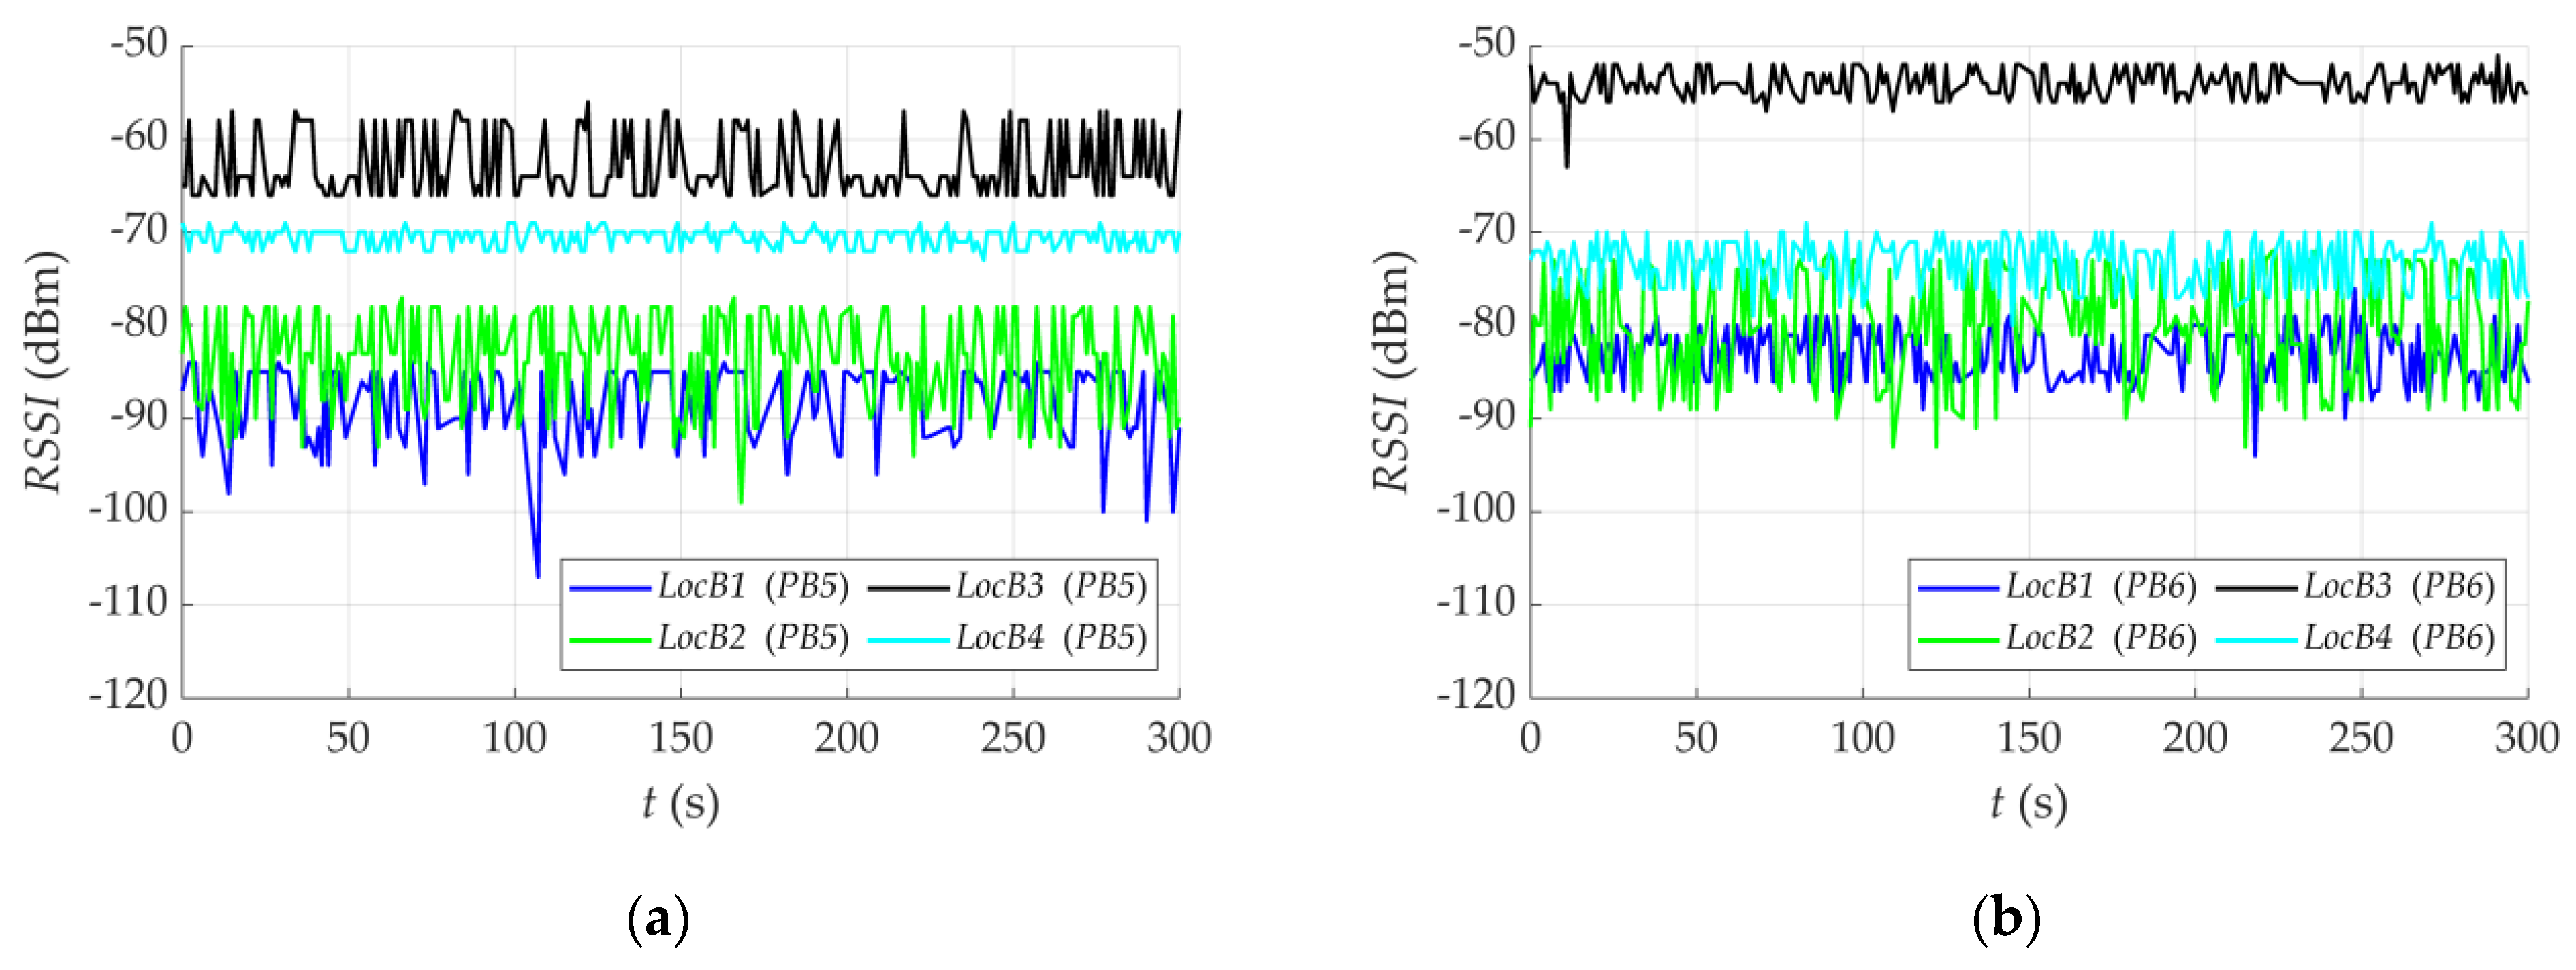
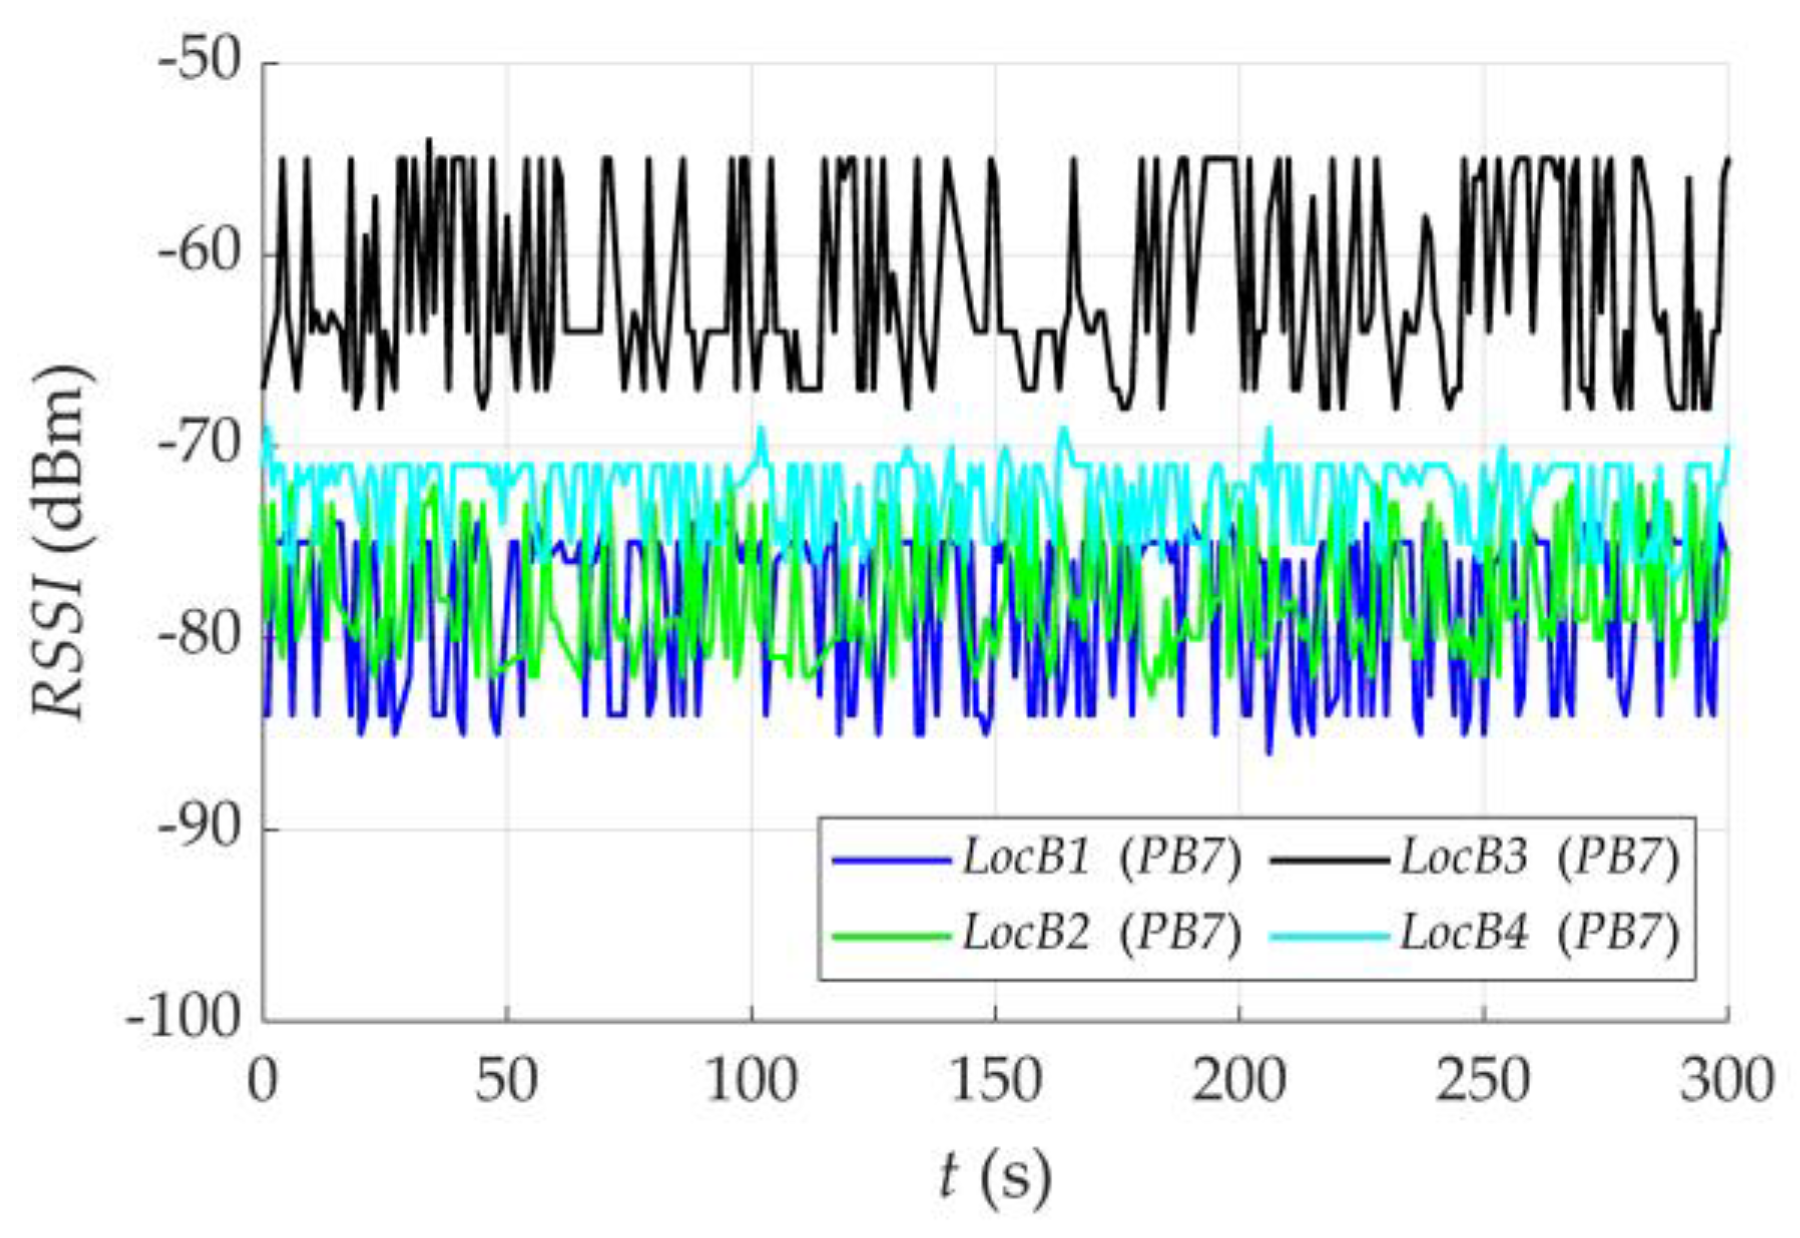
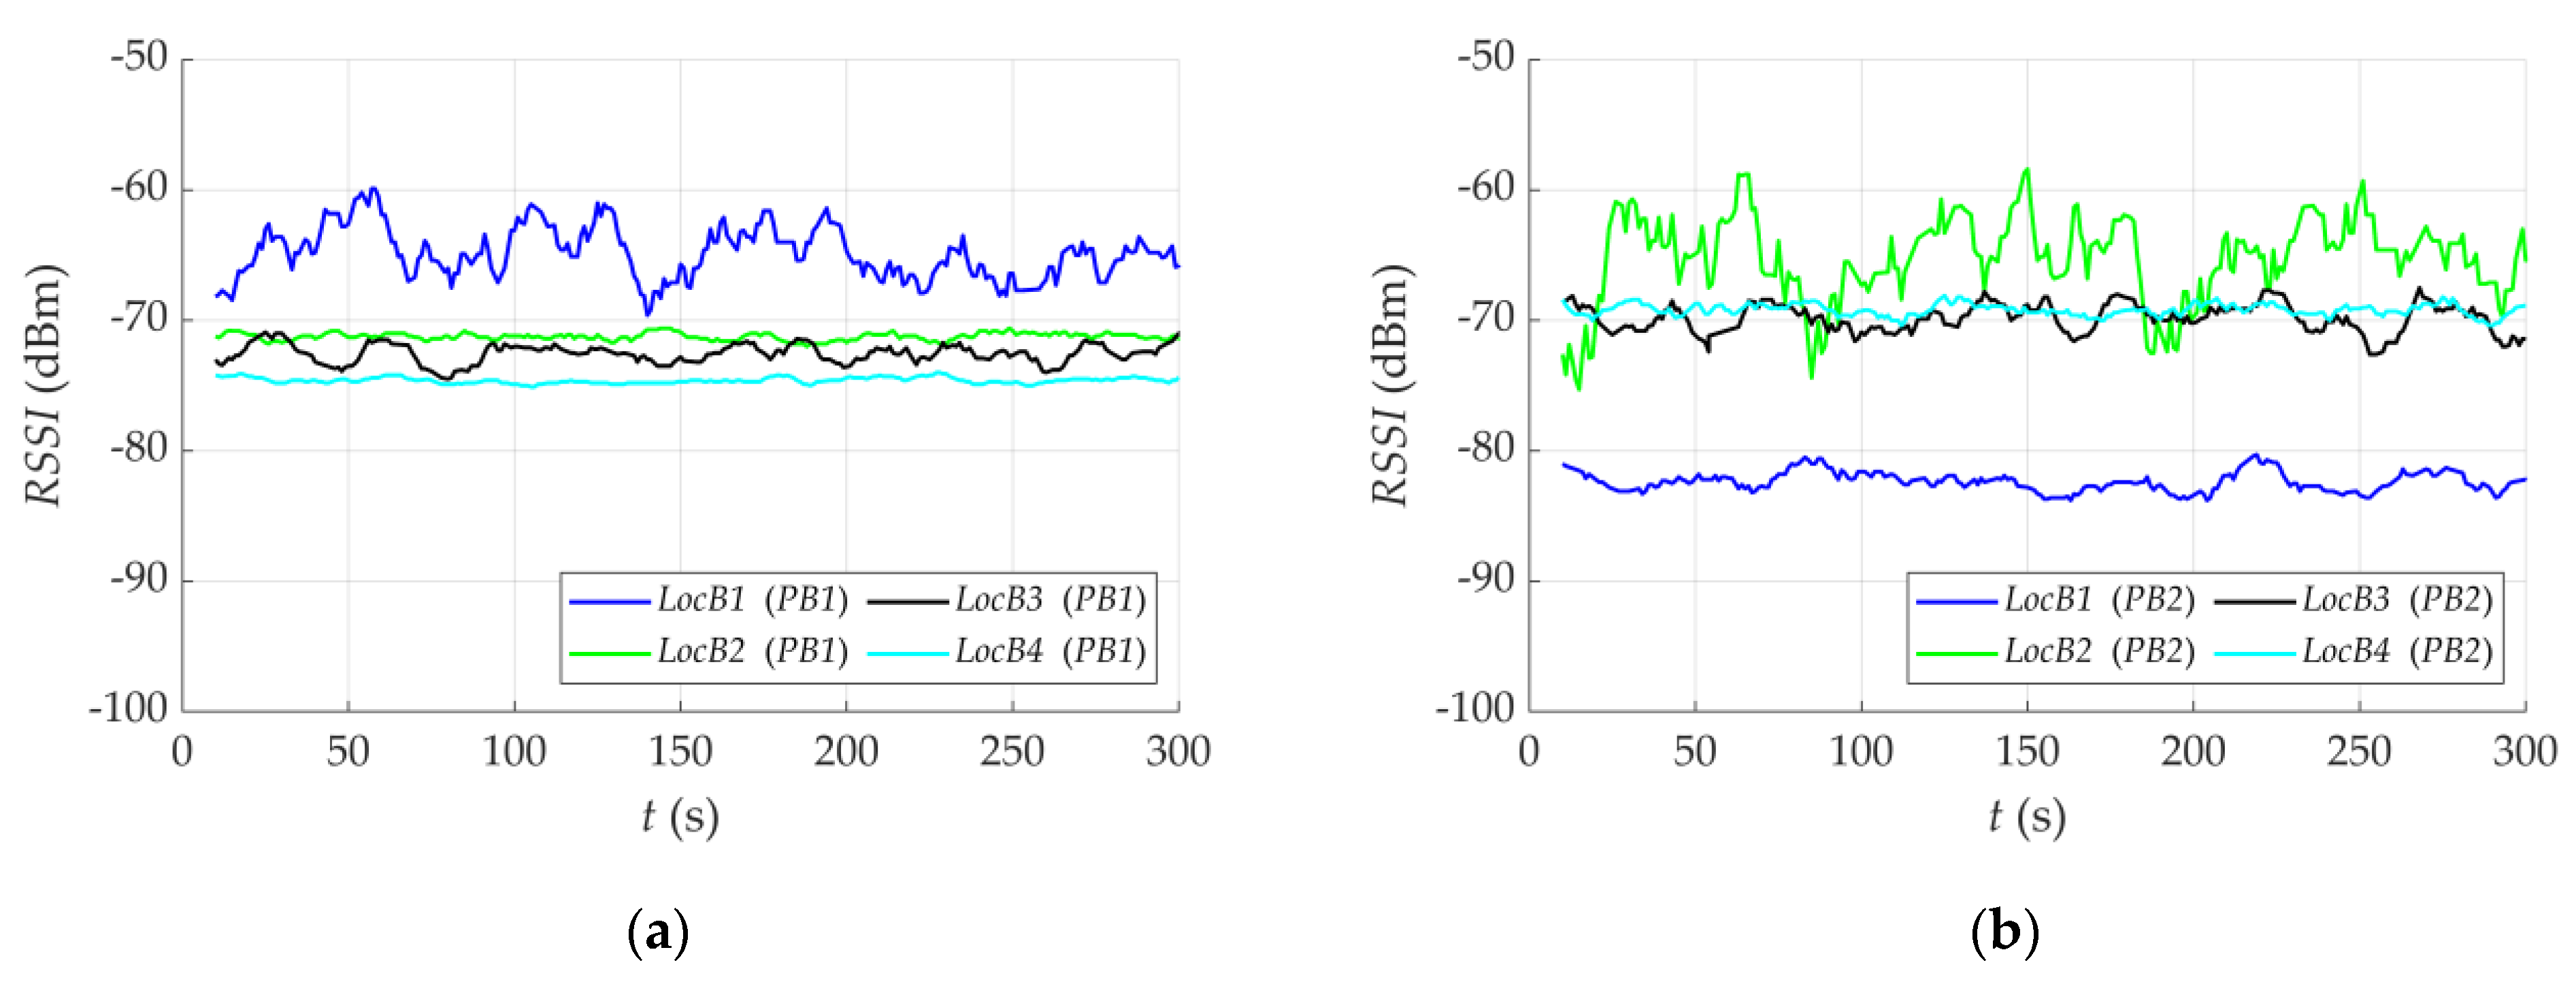
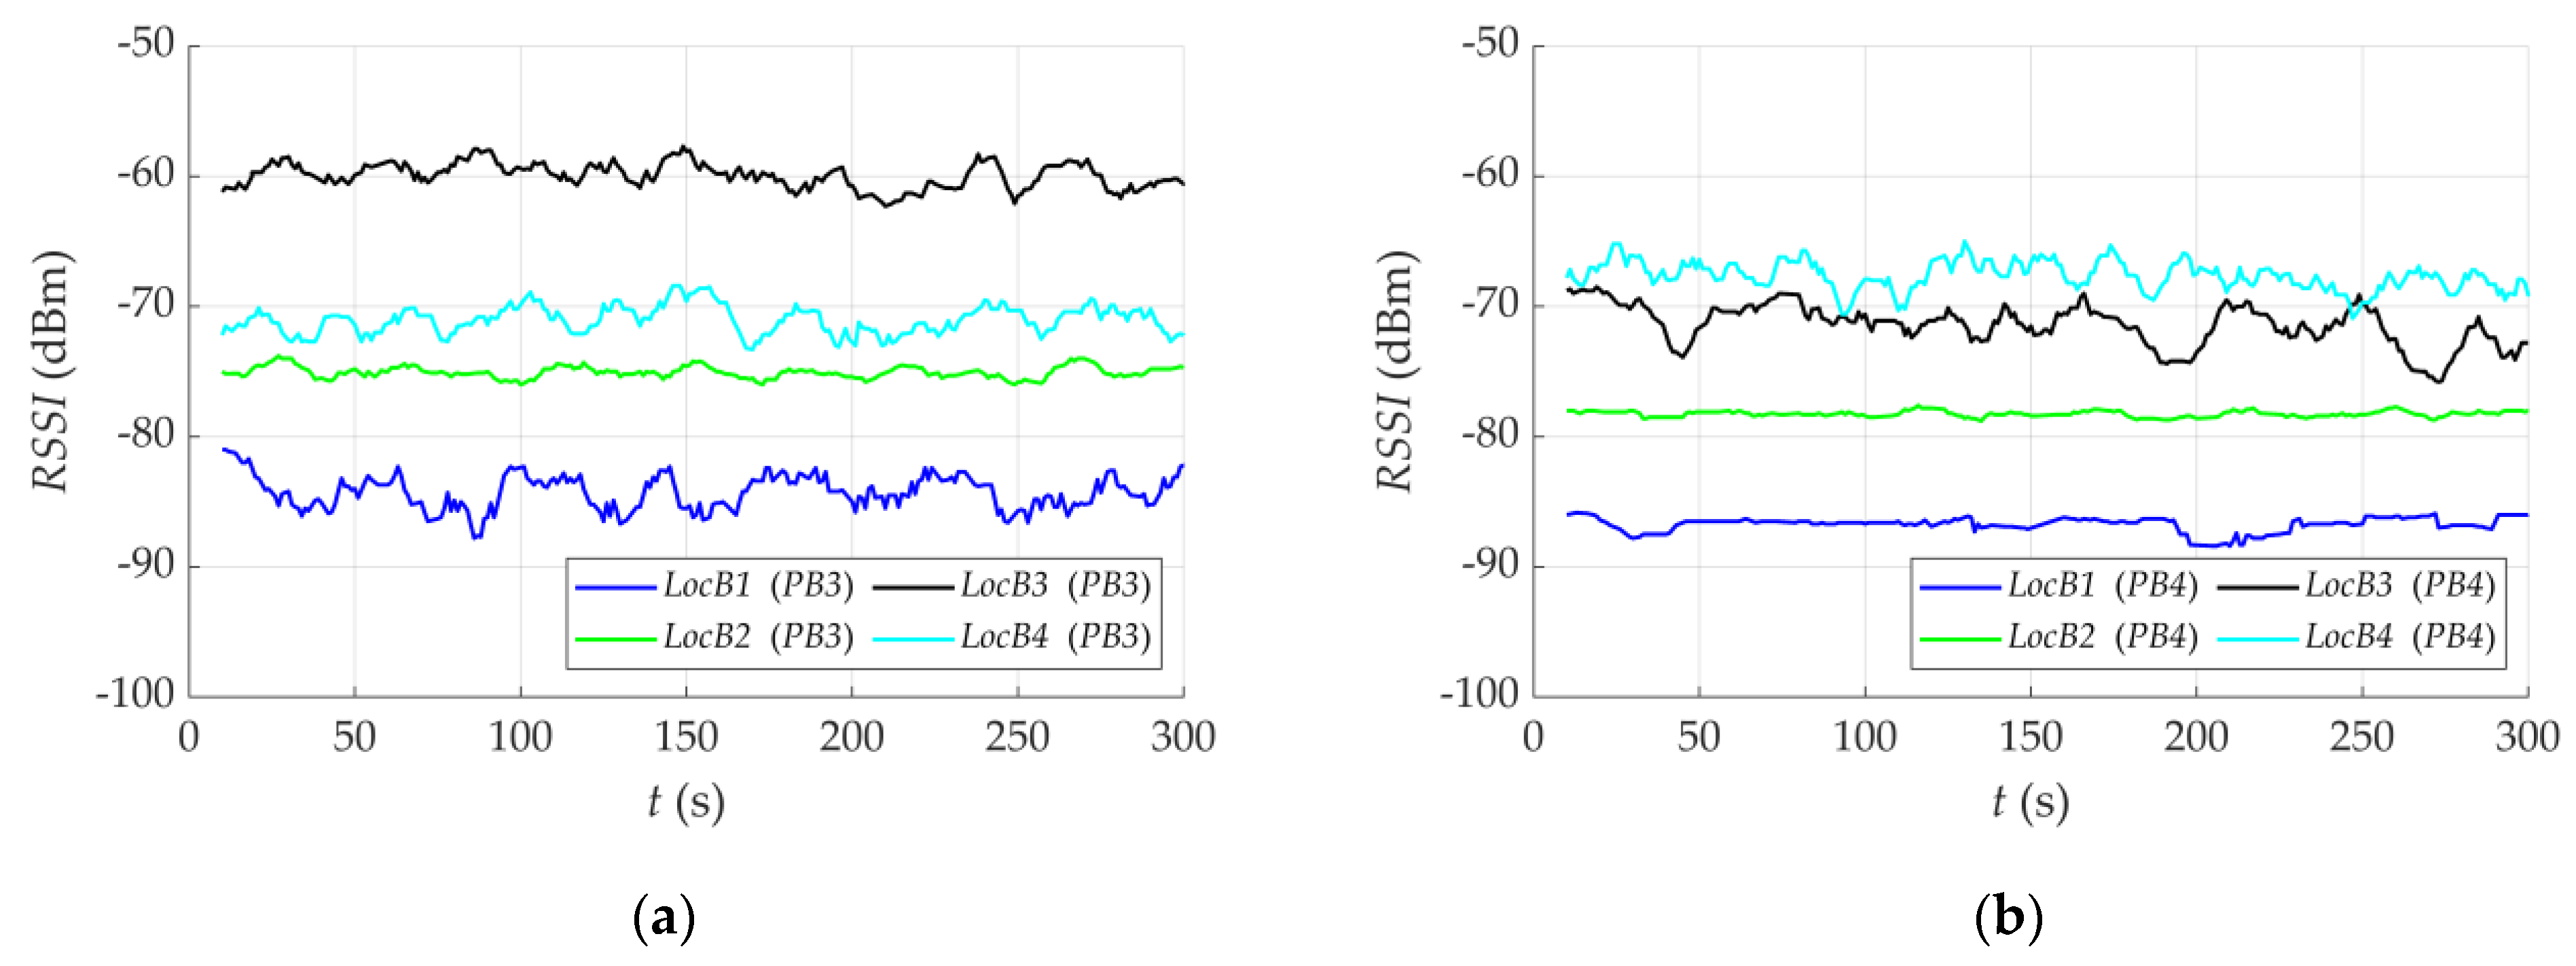
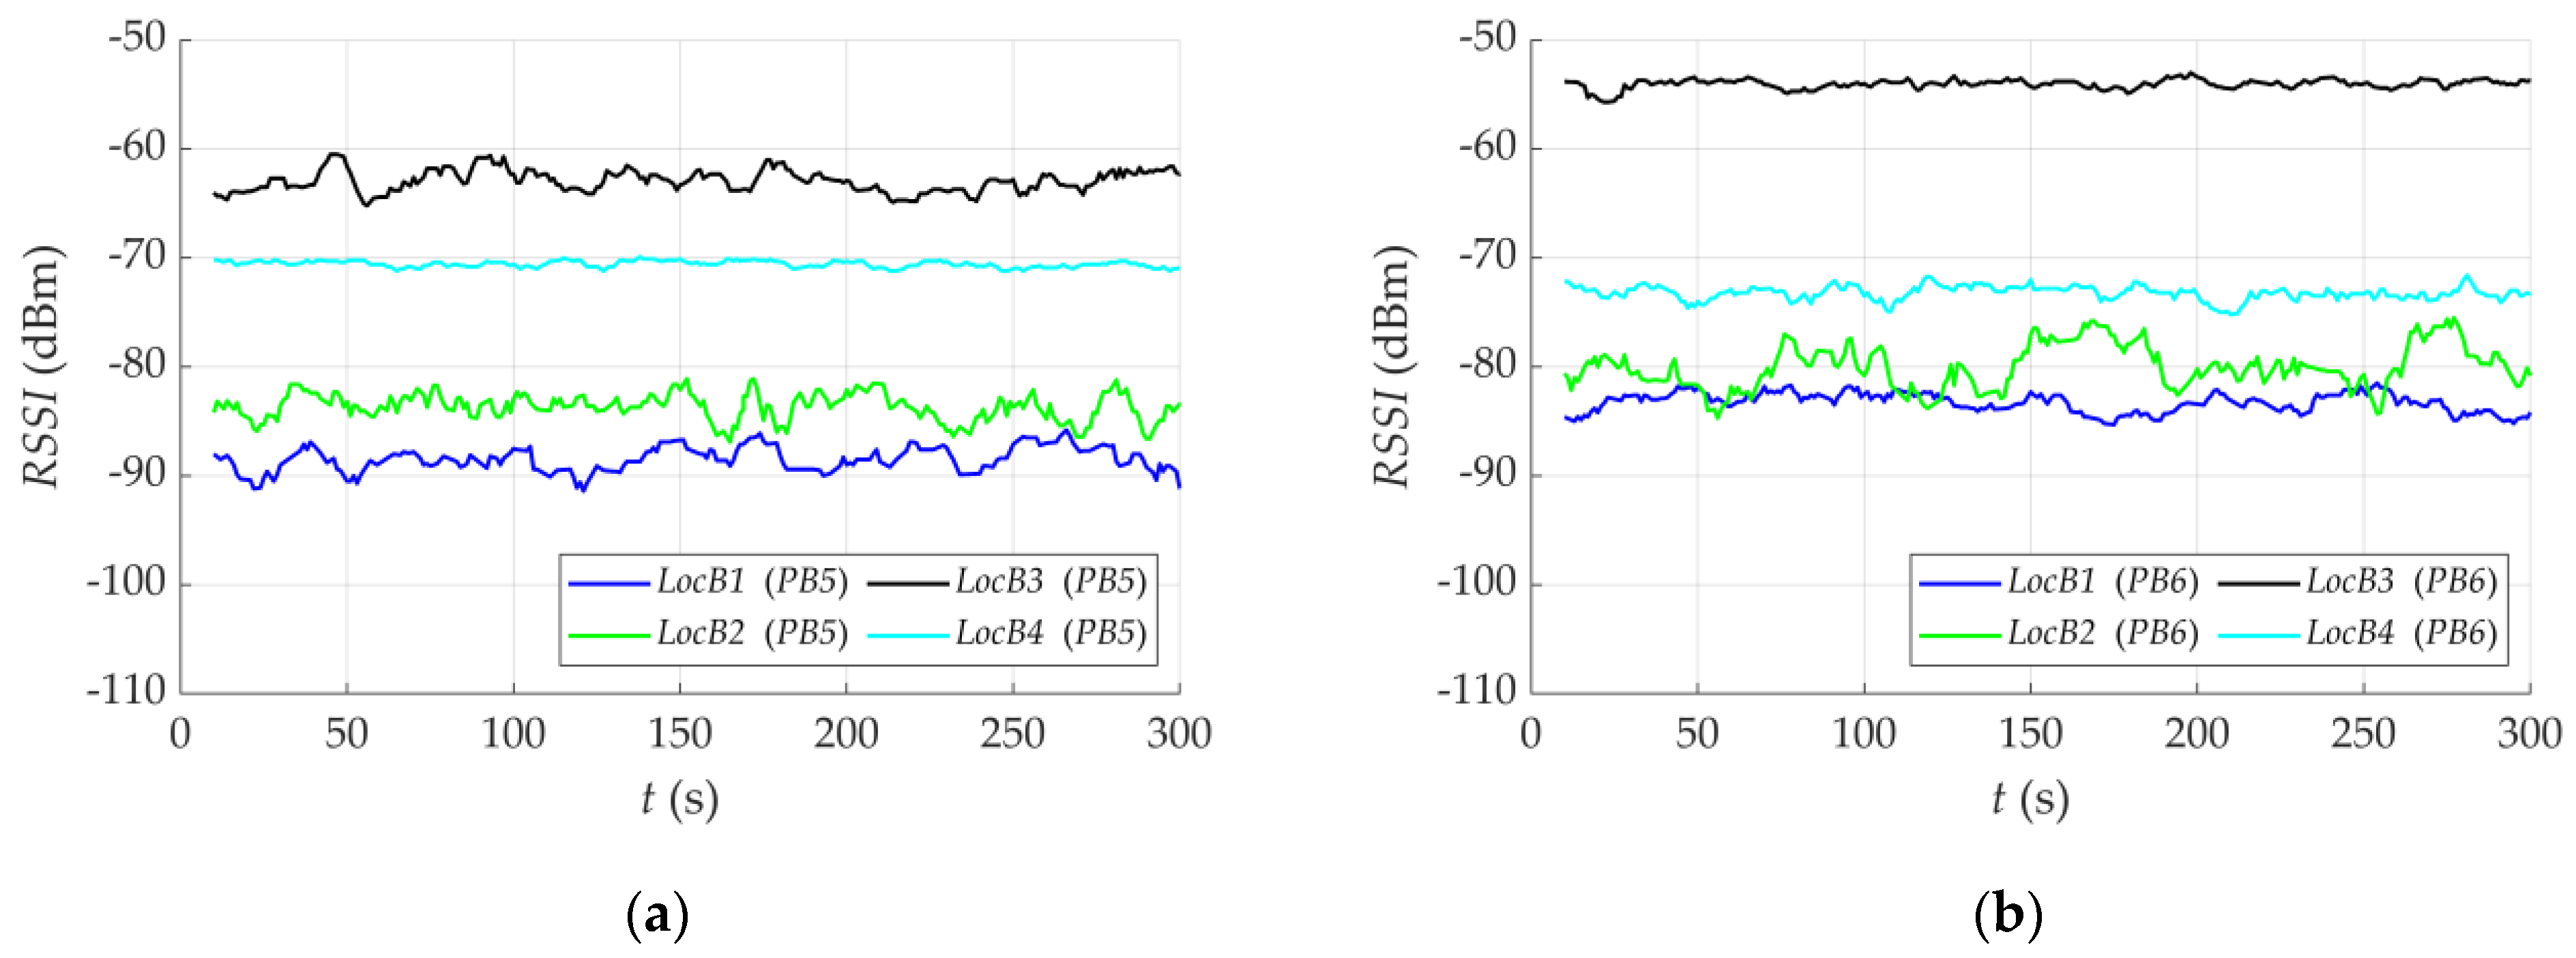
The main subject of the research stage presented in this section is the analysis of the environmental influence on the RSSI values for the purpose of selecting the appropriate data processing method allowing determining the nearest locator node. Measurements were carried out as described in Section 2.4. Figure 11, Figure 12, Figure 13 and Figure 14 show the measurements of the RSSI value obtained by four locator nodes LocBn (LocB1–LocB4) for the object placed at the locations PBm (PB01–PB07), as shown in Figure 3.
The analysis of Figure 11, Figure 12, Figure 13 and Figure 14 allows concluding that the measured RSSI signal is stochastic with the mean value and standard deviation depending on the object location and its surroundings. These parameters, determined for particular PBm locations, are presented in Table 2. To make the data presented in Table 2 easier to analyze, the table cells corresponding to the situation where the PBm location is geometrically closest to the LocBn locator node are marked with a color. The colors in the table correspond to the line colors representing the locator nodes in Figure 11, Figure 12, Figure 13 and Figure 14.
The analysis of the RSSI signals presented in Figure 11, Figure 12, Figure 13 and Figure 14 shows that in the case of a locator node placed in a wide space without the presence of additional interference sources (LocB3), the instantaneous RSSI value of the signal received by LocB3 in the case of object locations PB3, PB5, PB6 and PB7 closest to LocB3 is much higher than the RSSI value in other locator nodes (see Figure 12a, Figure 13a,b and Figure 14). This allows for the proper determination of the locator node closest to the localized object (Bluetooth transmitter). Unfortunately, such a direct approach to the construction of the decision process may not bring correct results in the case of small spaces (e.g., a narrow corridor—LocB4) or in the presence of sources of potential interference (LocB2, LocB1), which is visible in Figure 11a,b and Figure 12b. This makes it necessary to use a statistical signal analysis.
As it results from the analysis of the data shown in Table 2, the mean RSSI values are lowest for the locator node LocBn closest to the PBm point. However, a high level of RSSI signal variance is noticeable when the locator node operates under difficult conditions (small space, presence of interference sources). Due to the above, the potential possibility of using the RSSI to indicate the locator node closest to the object is clear; however, a processing method is required to reduce the variance of the estimates [34,35]. For this purpose, the use of an average filter is proposed. In this case, the resulting RSSIM(k) value can be calculated as follows:
R S S I M ( k ) = 1 M m = 0 M 1 R S S I ( k m )
where k is the index of the current time moment, and M is the width of the moving window.
Finally, the choice of the i-th locator node as closest to the object is based on the highest R S S I M i ( k ) value.
L o c i ( k ) = a r g max i = 1 N R S S I M i ( k )
where L o c i ( k ) is the locator node chosen as the closest to the object, and N is the number of all locator nodes.
The effectiveness of the proposed method (3) is illustrated in Figure 15, Figure 16, Figure 17 and Figure 18, which show RSSI sequences averaged in a moving window with a width of M = 10 for four locator nodes (LocB1, LocB2, LocB3, LocB4) and an object placed at locations PBm (PB1,…, PB7). The comparison of the RSSI filtered sequences shown in Figure 15, Figure 16, Figure 17 and Figure 18 with the corresponding unfiltered RSSI sequences, presented in Figure 11, Figure 12, Figure 13 and Figure 14, provides some confirmation of the filtration efficiency.
As it results from the analysis of Figure 15, Figure 16, Figure 17 and Figure 18, the use of an averaging filter with a window width adequately chosen due to the surrounding conditions allows in practically all cases to clearly indicate the locator node closest to the object. Only in the case of the locator node placed in the vicinity of the metal frame of the elevator shaft and the metal railing (LocB2), there are occasional erroneous detections (shown in Figure 15b). These errors resulted in the selection of locator nodes that are 5.5 m and approx. 10 m away.
The window width M is an important parameter, the increase in which, on the one hand, reduces the variance of the estimates, but on the other hand, deteriorates their dynamics.
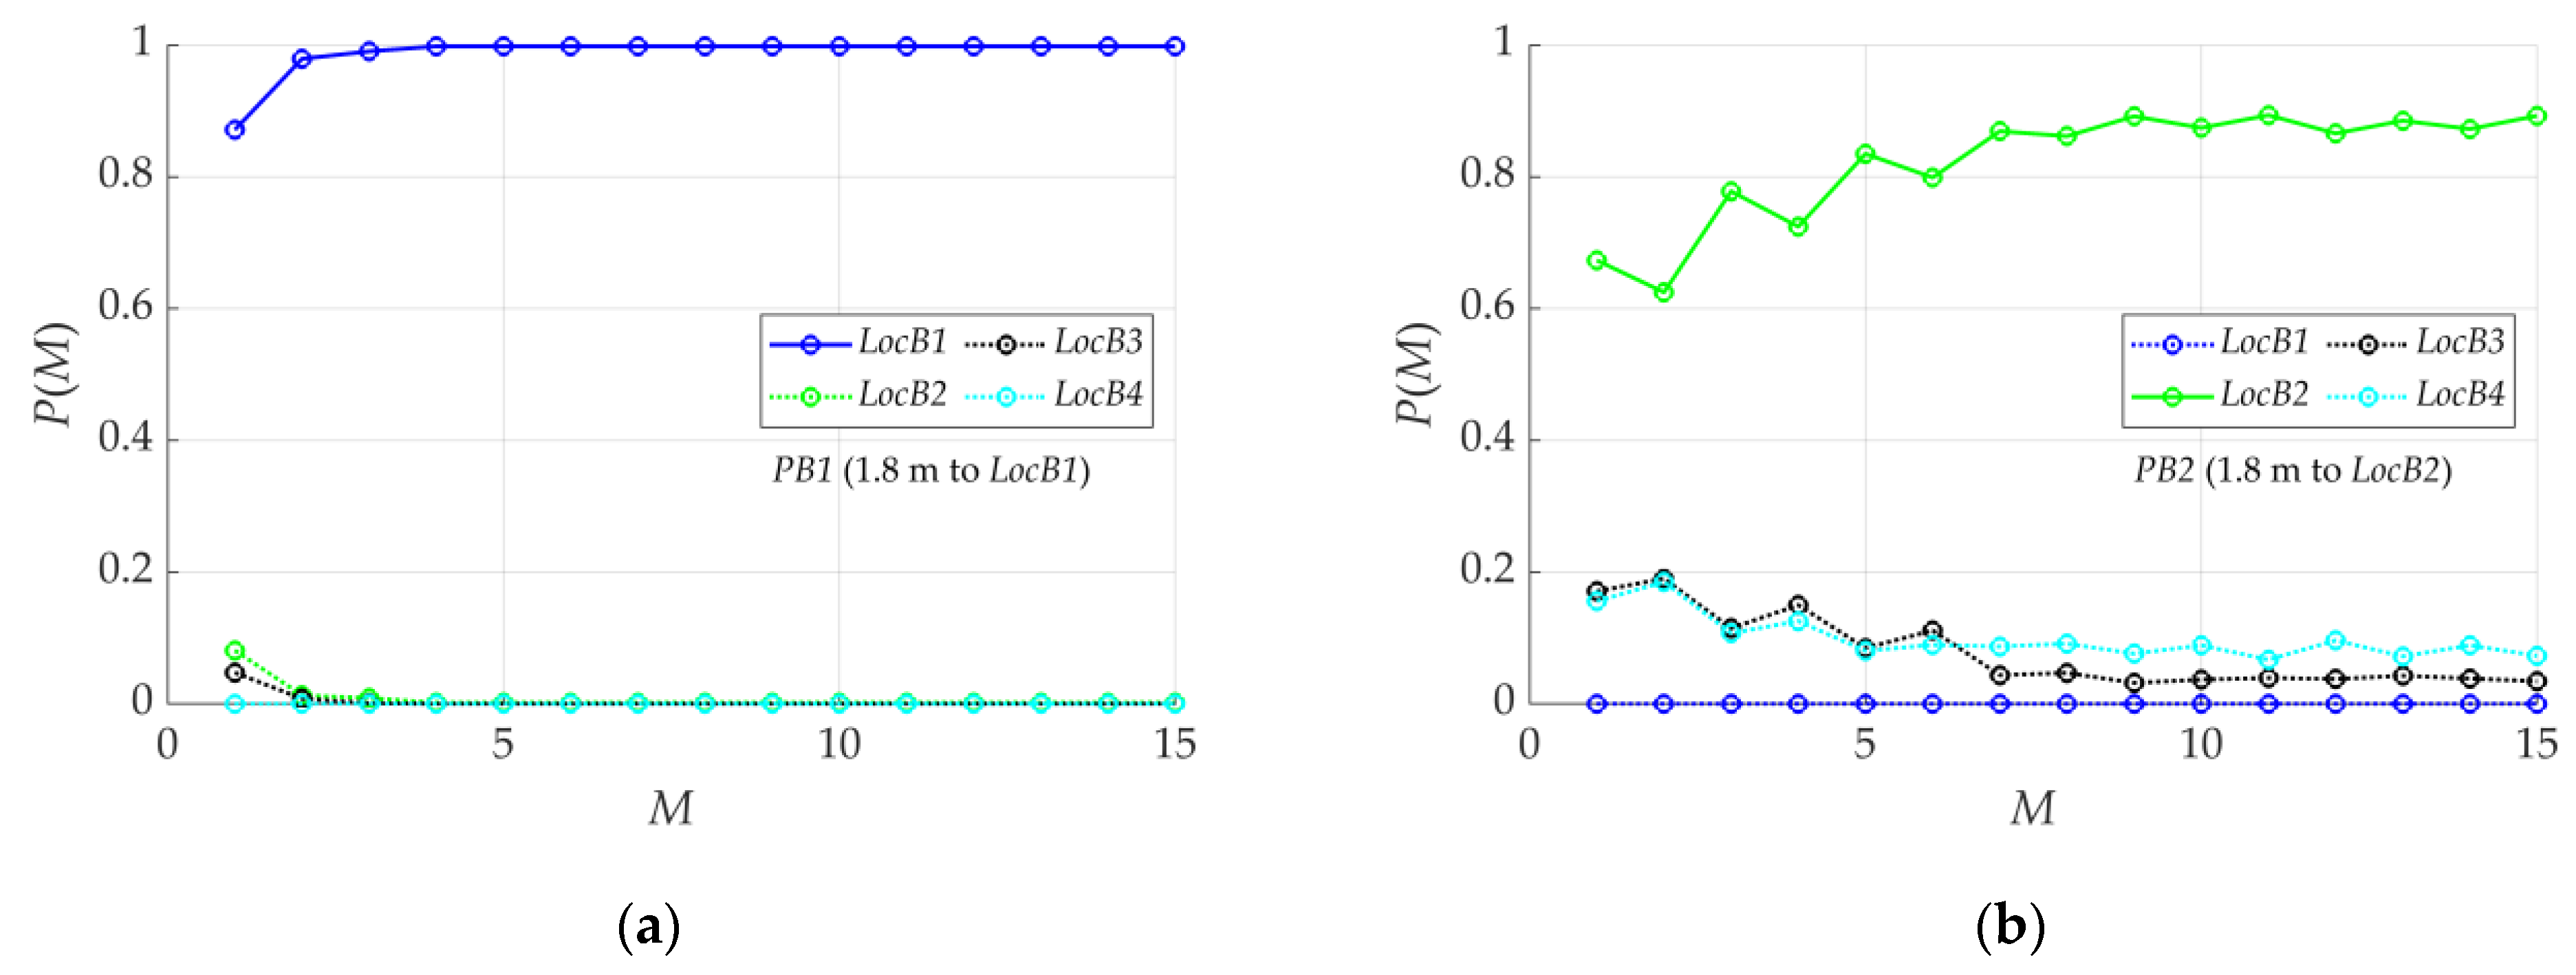
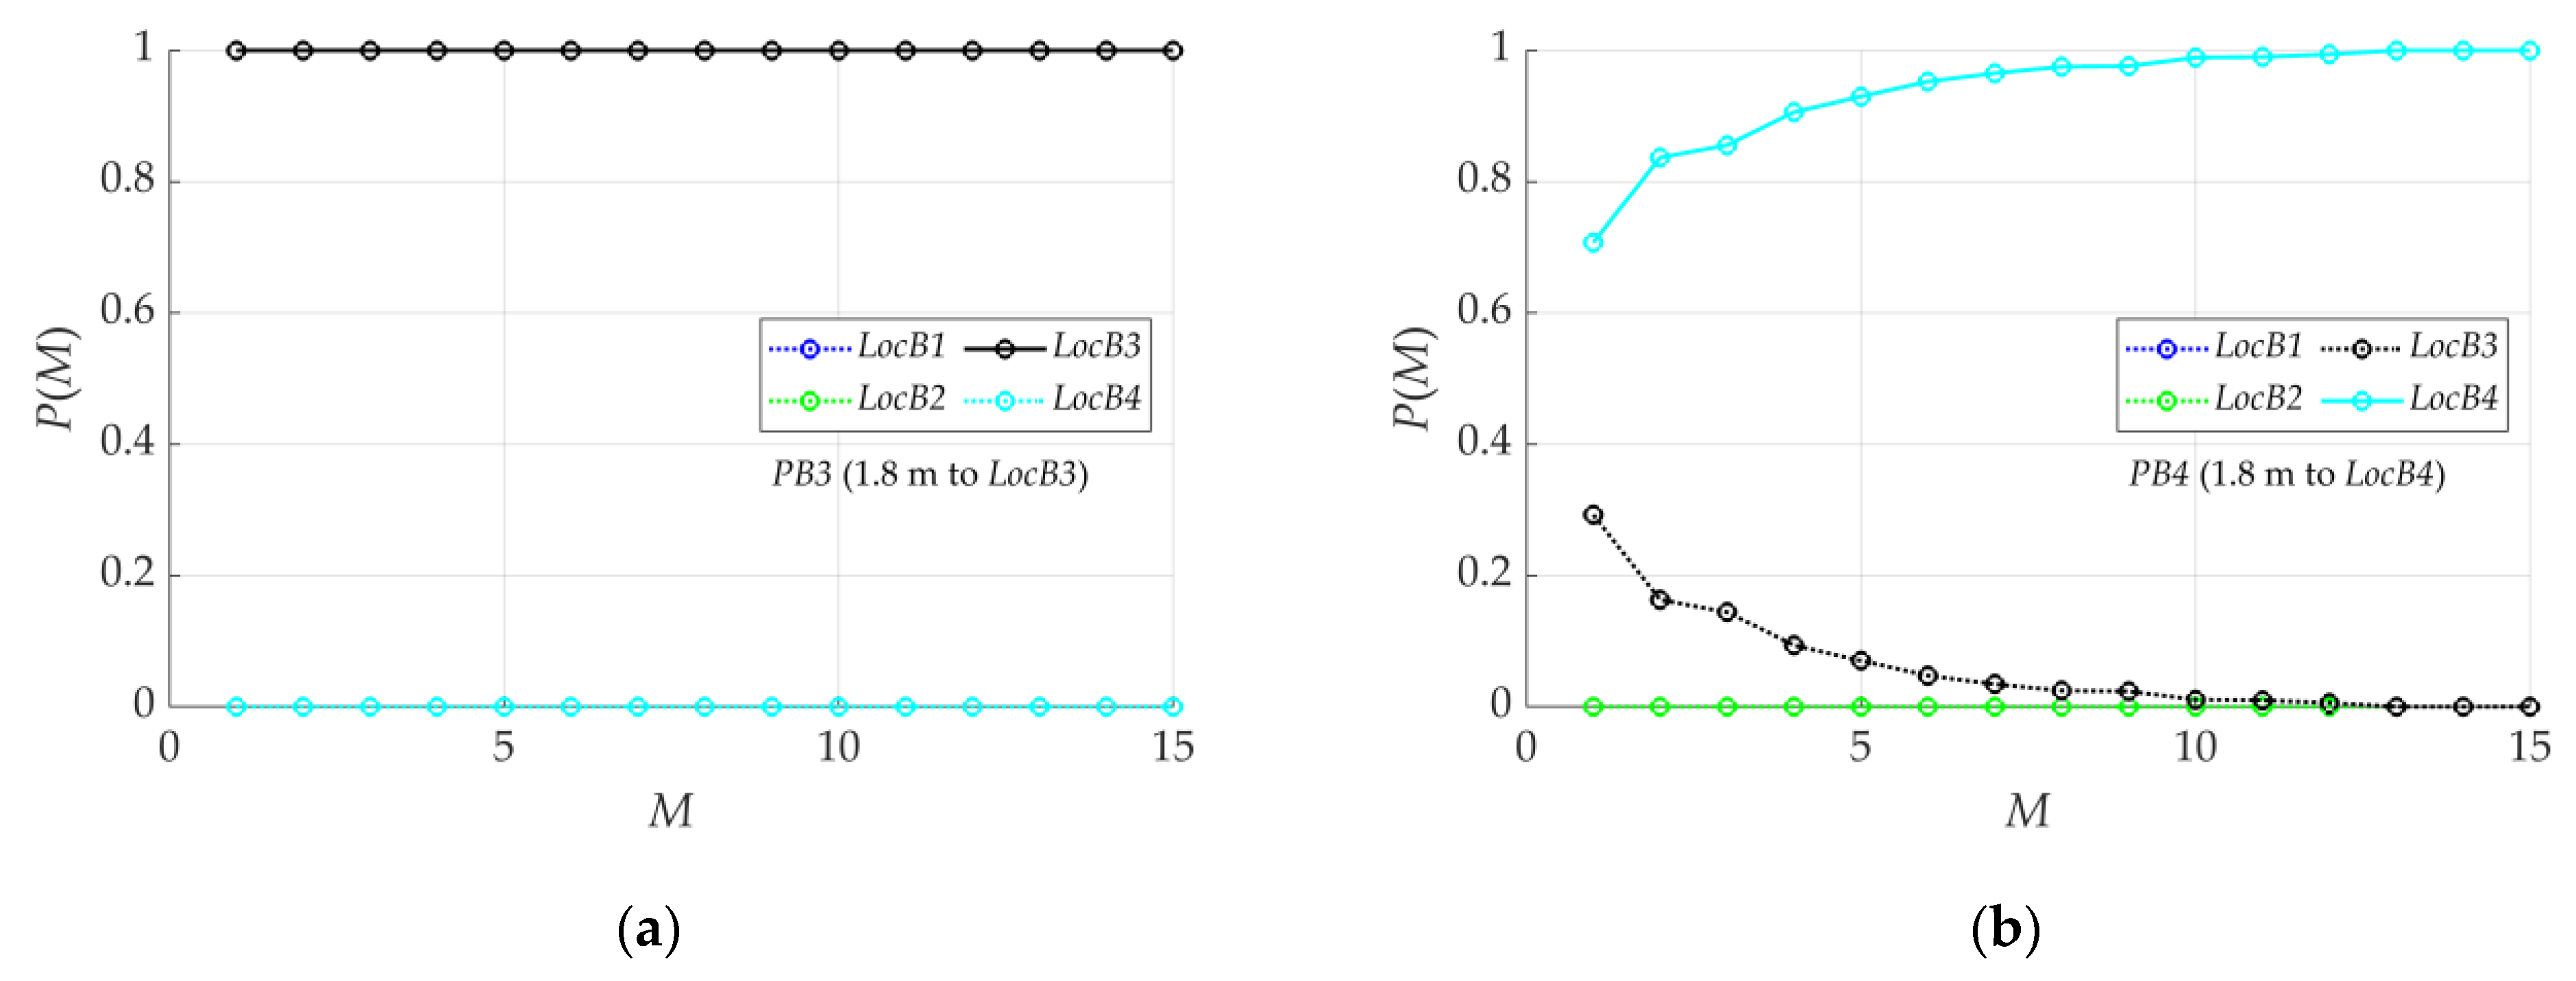
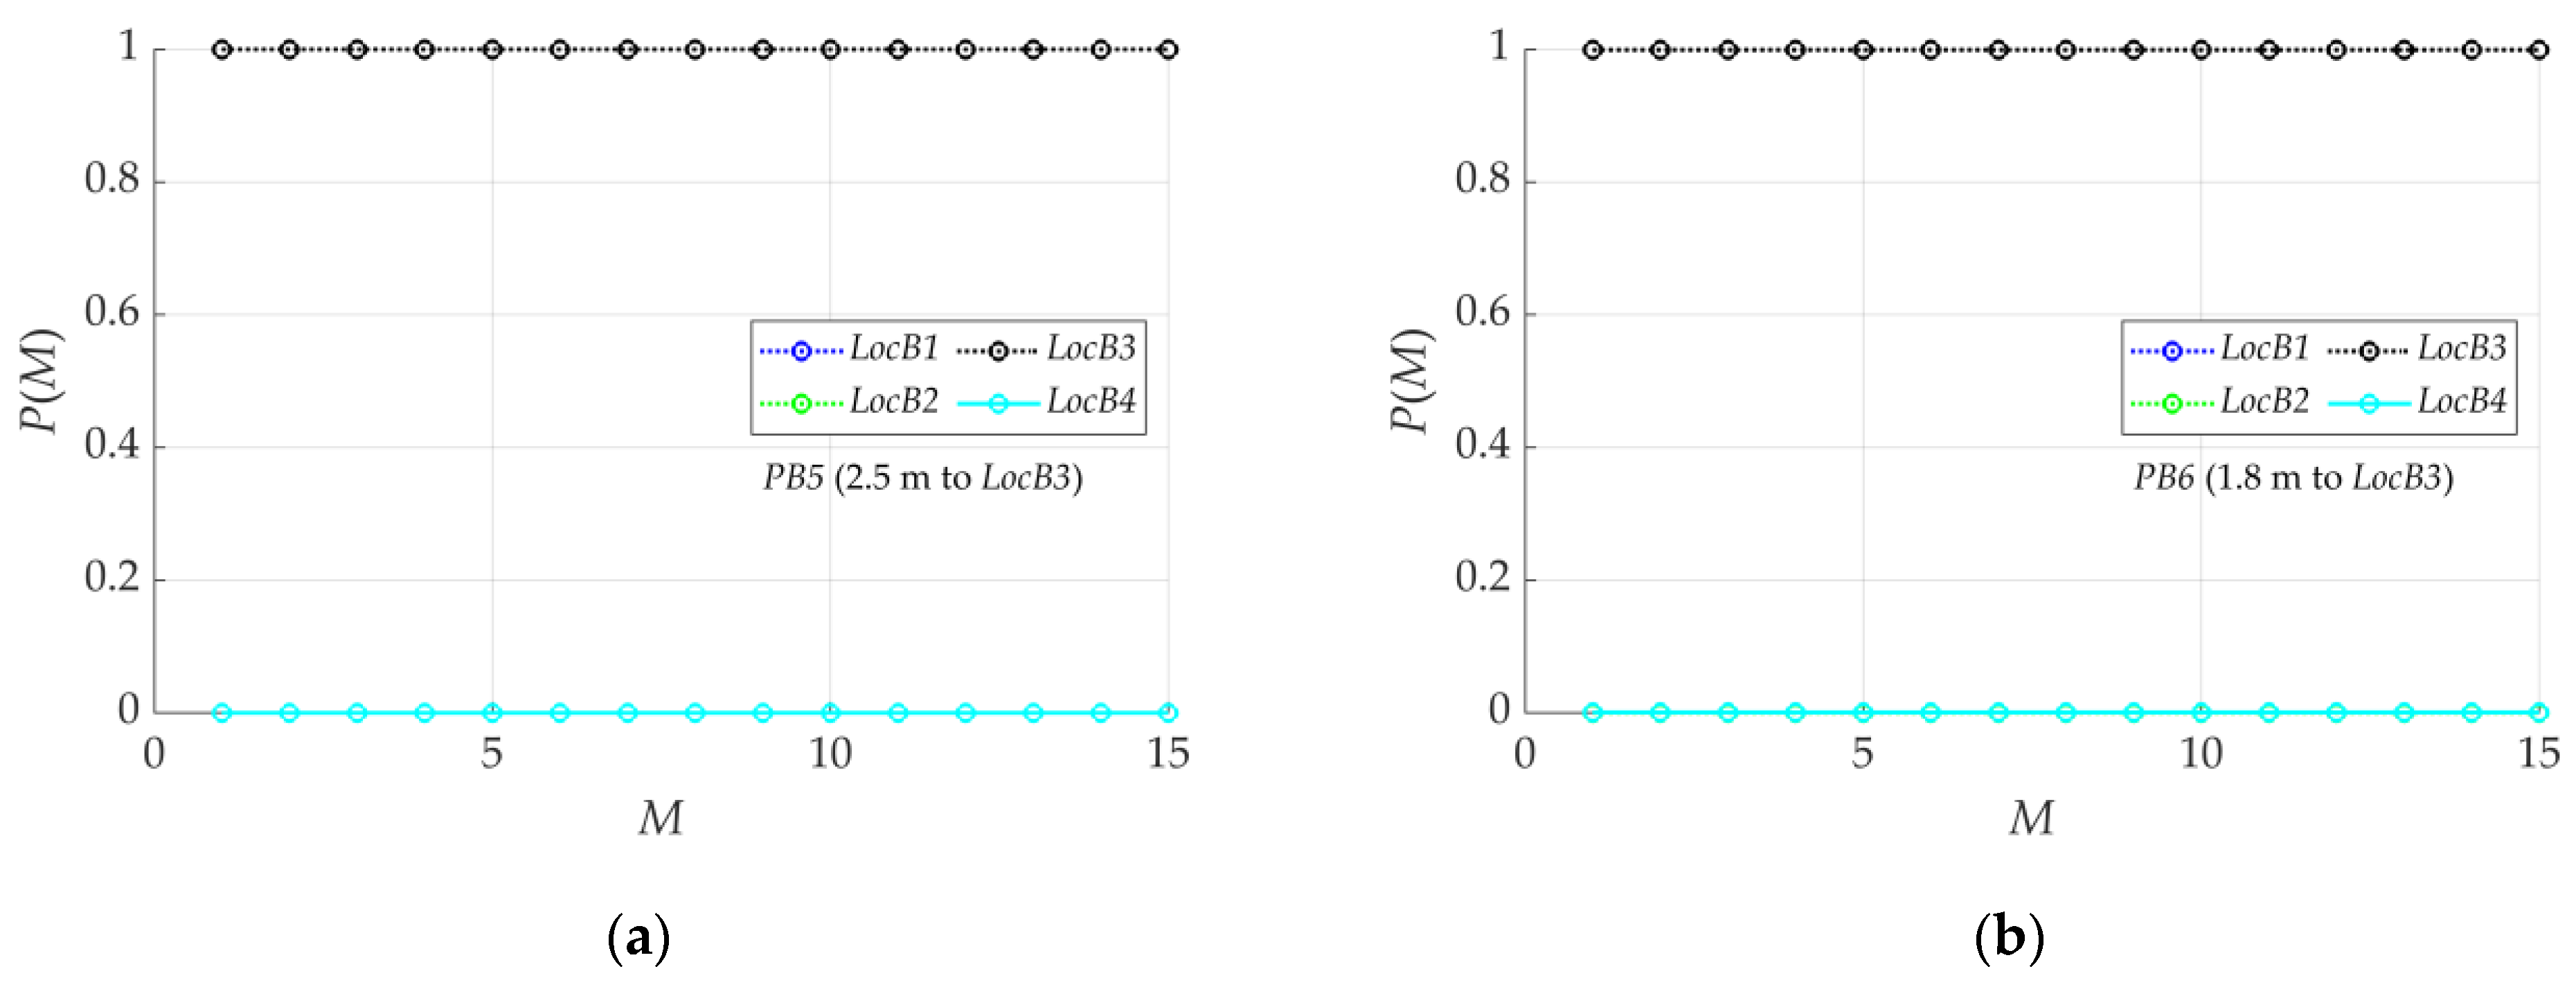
For this reason, this parameter should be selected optimally, taking into account the conditions under which the locator node works. The rules for the selection of the M value can be formulated on the basis of the probability of each locator node detection, the closest one to a given object location and the neighboring ones, depending on the width M of the moving window. Such characteristics for object locations PB1–PB6 are presented in Figure 19, Figure 20 and Figure 21.
The analysis of the results presented in Figure 19, Figure 20 and Figure 21 should begin from the object locations PB3, PB5 and PB6 placed in front of the LocB3 locator node, which is not subject to interferences and disturbances. As it can be seen in Figure 20a and Figure 21a,b, in the above case, the correct nearest locator node is indicated with a probability p = 1 already for M = 1, without the need to use an averaging filter. However, as it can be inferred from Figure 20b, in the case of location PB4 placed in a narrow corridor, the correct nearest locator node is indicated with the probability p = 1 for M > 12. Moreover, in this case, for M = 1, the probability of detecting the correct locator node is approximately p = 0.7, and the locator node distant approximately 5 m from locator PB4 is pointed out with the probability p = 0.3. Figure 19b shows the characteristics of the point PB2 closest to the LocB2 locator node, which is subject to strong interference. As shown in the figure, the correct detection is performed with the probability within the range of p = 0.6 ÷ 0.9 for M = 1 ÷ 10. The remaining detections, with the probability P ∈ < 0.05; 0.2 > fall on LocB3 and LocB4 distant by approx. 5.5 m and approx. 10 m from LocB2.
From the above analysis, the following conclusions can be drawn:
  • The proposed system allows to indicate the nearest locator node based on RSSI analysis;
  • The system should have the capability to set the value of the M parameter individually for each locator node;
  • The optimal value of the M parameter depends on the locator surroundings; and
  • In the case of a locator node operating in difficult conditions (small space, presence of interference sources), the accuracy of the location can be estimated at approx. 10 m.
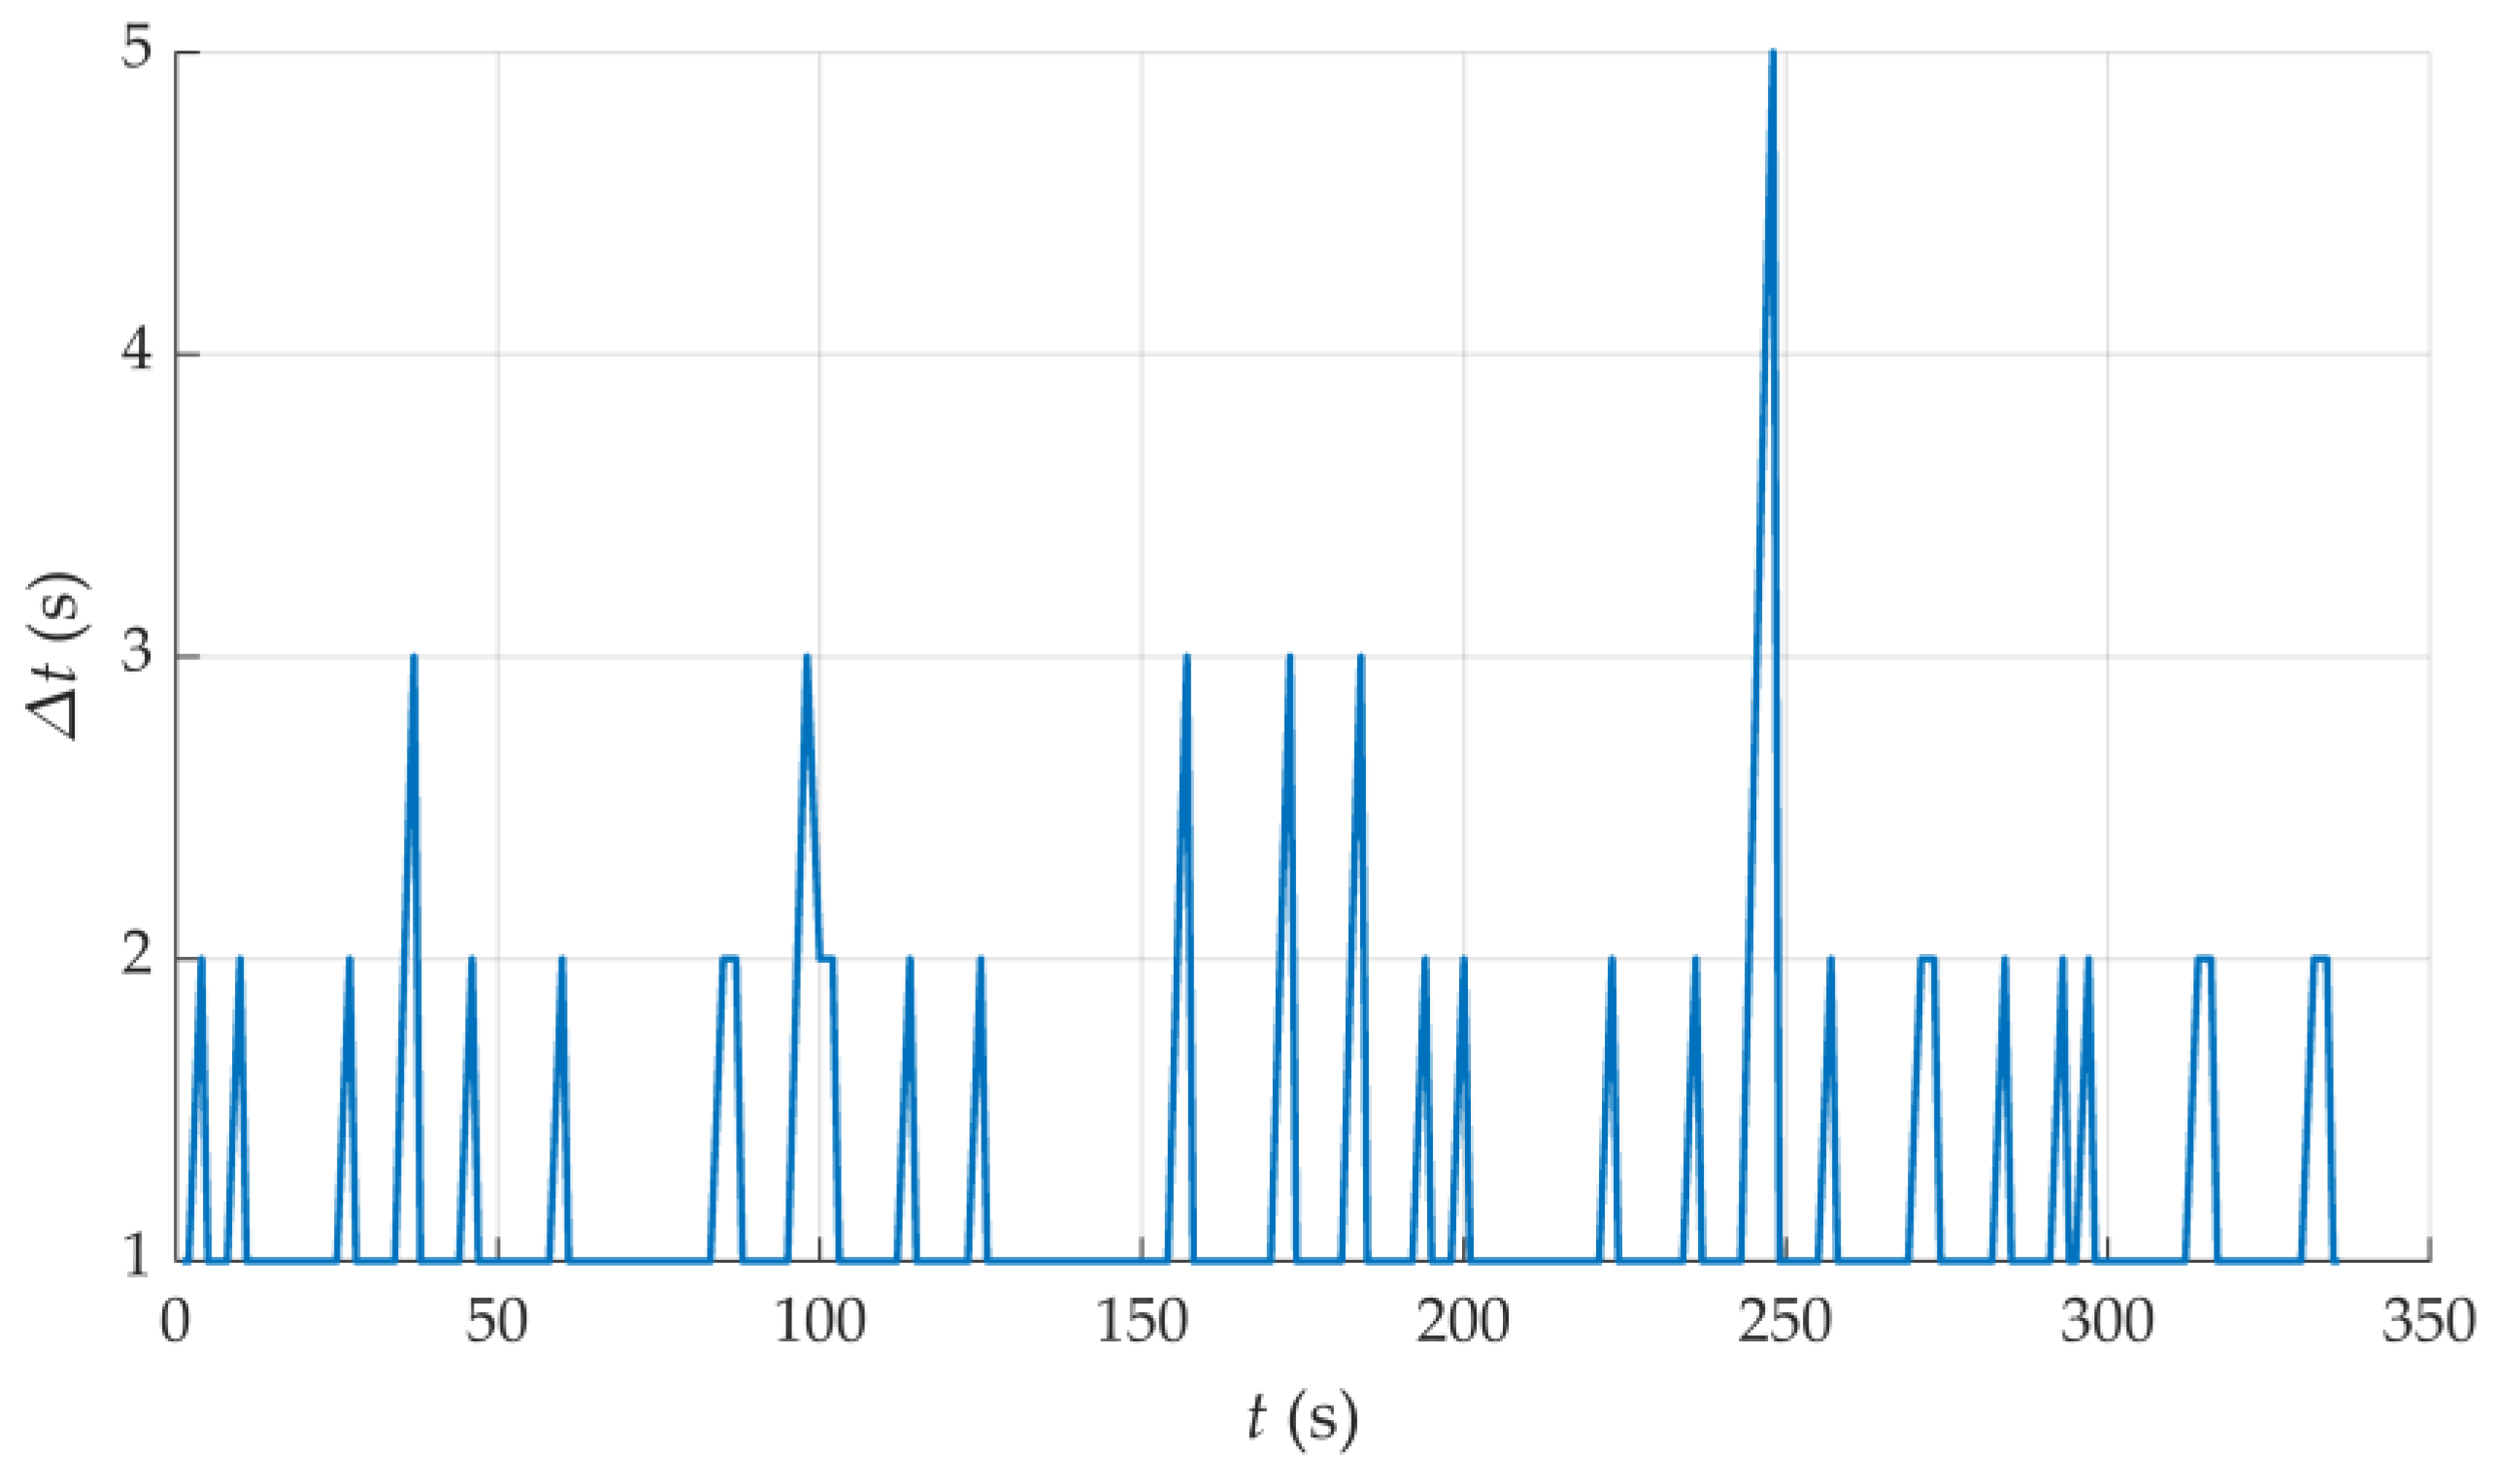
An additional factor that should be taken into account during the construction of the supervision system is the presence of delays in the measurement process. They can affect the reliability and accuracy of the determined location. Therefore, it was the subject of additional research. Figure 22 shows an example of the time intervals between successive measurements of the RSSI value obtained by the locator node LocB1 and object location PB1, while Table 3 shows the probability of occurrence of various delays for locator nodes LocBn and all object locations PBm. The probability was estimated by calculating the relative frequencies.
As can be seen in Figure 22, the time intervals between successive measurements of RSSI values obtained by the LocB1 locator node are usually 1 s, i.e., equal to the sampling period. However, as it can be noticed, there are also delays of a higher value. The data in Table 3 show that the probability of the occurrence of delays greater than 1 s is approximately 0.15. Moreover, the probability of occurrence of a time delay of 5 or more sampling periods is almost 0.01. Therefore, the data processing algorithms should take this phenomenon into account, for example by extrapolating the last measured value, extrapolating the mean or trend value, or using tracking methods with uneven sampling [22,36].

3.3. Analysis of the Effectiveness of Object Detection and the Localization Accuracy of the Experimental Installation of the Evacuation Supervision System

The RSSI measurements analyzed in this section were obtained in the system presented in Section 2.5. A series of tests were carried out for stationary objects. Measurements of RSSI were carried out each time for about 5 min with increased frequency, allowing the registration of the average number NPCm = 7938 of measurements in a single location. The number of measurements made by each LocCn locator node for each PCm object location is given in Table 4. Table 5 lists the distances between the projections on the floor plane of the object positions (PC01–PC15) and locator nodes (LocC1–LocC6) presented in Figure 4.
Based on the data presented in Table 4 and Table 5, the basic properties of the evacuation supervision system can be analyzed.
The analysis of the number of RSSI measurements obtained by each locator node LocCn for each object location PCm presented in Table 4, together with the analysis of the data on distances presented in Table 5, as well as the placement of the locator nodes and object positions presented in Figure 4, lead to the following conclusions regarding the system properties:
  • The tested locator nodes detect the object with the same frequency within a radius of approx. 28 m, which proves that the object is fully detected in this distance range;
  • The tested locator nodes can detect an object within a radius of approx. 32 m, but the detection capability decreases by about 50% (see PC10, PC11 and PC12 observed by LocC7), from which it can be concluded that the practical maximum detection range in this system is approx. 35 m;
  • The locator nodes can detect an object despite partial shadowing (see detections by LocC5 and LocC6); and
  • The locator nodes are unable to detect the object in the case of obscuration that occurs in a perpendicular long corridor (see no LocC7 detections except for PC10, PC11 and PC12).
In order to assess the system effectiveness, the probability of selecting the LocCn locator node as the closest to the wristband placed at each of the PCm locations was determined. The research was carried out both on the current data (i.e., M = 1) and using the averaging algorithm (2) with the moving window of the width M within the range from M = 2 to M = 15. The probability was estimated based on the relative frequency. Two selected cases, representing extreme situations, are presented in Table 6 and Table 7.
As it can be concluded from the data on the PC02 point included in Table 7, in the case of good propagation conditions, the system correctly and unambiguously (probability p = 1) determines the locator node which is geometrically closest to the band. On the other hand, in the case of worse propagation conditions, the variance of RSSI measurements increases, and therefore, apart from the locator node geometrically closest to the wristband, further locator nodes are designated. An example of such a situation is illustrated in Table 6 for the object location PC01. The analysis of the data presented in Table 6 also shows the effectiveness of the proposed data processing method and enables the formulation of recommendations for the minimum width M of the moving window. The analysis of the probability of selecting appropriate locator nodes for all PCm locations leads to recommendations that M ≥ 5 should be assumed.
In order to estimate the accuracy of determining the position in the evacuation supervision system, the following parameters were calculated: the average estimation error and the probability of assigning, as the wristband location, the position of the locator node distant by at least d meters. On this basis, the maximum error was also estimated.
The mean error of the position estimation in the test installation can be calculated as the expected value of the distance error using the following relationship:
  b d ¯ = n = 1 N n m = 1 N m d n m P n m
where dnm is the distance between the m-th location (PCm) of the wristband and the n-th locator node (LocCn) (see Table 4), Nn is the number of wristband locations, Nm is the number of locator nodes and Pnm is the probability of selecting the LocCn as the closest one to the location PCm.
The mean error of the position estimation for different widths M of the moving window is presented in Table 8.
As it results from the data presented in Table 8, the mean error of the position estimation in the case of test scenario C, and with the use of the proposed filtration method, does not exceed 3.5 m. It should be noticed that with the increase in the width M of the moving window, the mean error decreases slightly.
The proposed method determines the location of the object through the coordinates of the locator node designated as the closest one. Therefore, in order to estimate the maximum error, the probability of assigning a locator node distant to the wristband by at least d meters was determined. The results for test scenario C and selected distances d for different moving window widths M are shown in Table 9. Additionally, the case of M = 5 is illustrated in Figure 23.
As shown in Table 9, in the case of using a window width of M = 5, the probability of assigning a locator node to the wristband distant by at least 10 m is p = 0.0261—that is, the accuracy better than 10 m is obtained with probability p = 0.9739, and 12 m with p = 0.9971. The results included in Table 9 also show that in the case of M ≥ 5, the probability of detecting the wristband by a locator node at a distance of more than 17 m is equal to p = 0. Therefore, when the proposed data processing method and the parameter M ≥ 5 are used, the value of distance d = 17 m should be considered as the maximum error of the wristband location.

3.4. The Procedure for Determining the Location of the Object in the Experimental Evacuation Supervision System

In the proposed system, the location of the object was determined by designating the closest locator node. The series of measurements carried out as described in Section 2.5 were saved in .csv files, which were then imported and analyzed using a mathematical environment. The code of the main procedure for determining the nearest locator node is shown in Listing 1.
Listing 1. The code of the main procedure for determining the nearest locator node.
function [object_position] = lf_OnParsedMessage(receiver,time_stamp,target,rssi)
% function of estimating the nearest locator with the use of an averaging filter
% in a moving window with the size M -> the nearest locator identifier is returned
% receiver, time_stamp, target, rssi—measurement record:
% receiver name, current time, transmitter name, measured RSSI
% object_position — [object identifier, localizer identifier]
% fuM_rssi      — matrix with the latest RSSI measurements for all localizers
% fuM_time      — time matrix of the latest RSSI measurements for all localizers
% t_del          — time after which expired entries are removed from fuM_rssi, fuM_time matrices
% M_so           — moving window size
global fuM_rssi fuM_time M_so t_del

if strcmp(receiver, ‘LOC-1’) rec_num = 1;
elseif strcmp(receiver, ‘LOC-2’) rec_num = 2;
elseif strcmp(receiver, ‘LOC-3’) rec_num = 3;
elseif strcmp(receiver, ‘LOC-4’) rec_num = 4;
elseif strcmp(receiver, ‘LOC-5’) rec_num = 5;
elseif strcmp(receiver, ‘LOC-6’) rec_num = 6;
elseif strcmp(receiver, ‘LOC-7’) rec_num = 7;
end

if strcmp(target, ‘Wristband-001’) targ_num = 1;
end

% adding a new measurement to the filter matrix
if M_so>1
fuM_rssi(2:M_so,rec_num) = fuM_rssi(1:(M_so-1),rec_num);
fuM_time(2:M_so,rec_num) = fuM_time(1:(M_so-1),rec_num);
end
fuM_rssi(1,rec_num) = rssi;
fuM_time(1,rec_num) = time_stamp;

% erasing items older than t_del [s]
ind_t_del = (time_stamp-fuM_time)>t_del;
fuM_rssi(ind_t_del) = NaN;
fuM_time(ind_t_del) = NaN;

% average RSSI for every localizer
fuM_rssi_tmp = fuM_rssi;
ind = isnan(fuM_rssi);
fuM_rssi_tmp(ind) = 0;
rssi_mean = sum(fuM_rssi_tmp,1)./sum(~ind,1);

% the nearest localizer
[~,ind] = max(rssi_mean,[],’omitnan’);
obj_num = ind;
object_position = [targ_num,obj_num];
end
The tests were carried out in batch mode, while the proposed method is suitable for a real-time system, as the measured average execution time of the estimation procedure is approx. 35 µs (for M = 15, calculations performed on a PC with an Advanced Micro Devices, Inc.—AMD Ryzen 5 1500× Quad-Core 3.50 GHz processor).

4. Conclusions

This paper presents the experimental system for localizing an evacuated person, which is part of the evacuation management system for buildings. The paper presents preliminary research, the selection of data processing methods and the test results of the created experimental network of an evacuation management system. The localization method belongs to the class of proximity-type methods and is based on the RSSI information of BLE signals that the locator node (Bluetooth receiver) provides based on information about the strength of the signal received from the transmitter, which is a personal wristband. The proposed solution is simple, with no need for additional synchronization of time or angle measurement circuits, and uses information typically available in Bluetooth devices. However, it is less accurate than methods based on TOF or AOA, which require specialized expensive components such as UWB modules. The created network is a low-budget implementation with low-cost elements used to build the system.
It should be noted that the hardware implementation and software integration of the system, as well as the design and implementation of the localization algorithms, were successfully carried out. Tests carried out in a building made it possible to conclude that the system allowed a maximum detection range of 35 m, with full detection of the wristband achieved at distances of up to 28 m. It was found that the locator nodes were able to detect the object despite shading. The study shows that in the case of the installation, where locator nodes were placed at distances between 6 m and 12 m, an accuracy better than 12 m was obtained with probability p = 0.997, while an accuracy better than 10 m was obtained with probability p = 0.974.
The average error of the position estimation determined for a series of measurements with objects located in different places was about 3.5 m. As shown in the paper, for large spaces, the system does not require additional RSSI data filtering methods, while for small spaces, such as narrow corridors, or in the presence of obstacles, it is necessary to introduce data filtering to reduce the variance. An averaging filter with a moving window of width M was tested. The study shows that M ≥ 5 should be considered, with M = 5 appearing to be optimal in the tested system. It should be noted that the proposed method of determining the position has a very low computational load, which allows the implementation of an extensive real-time system on a typical personal computer.
This research is a precursor to the development of a framework that will integrate a real-time building information model (BIM) and Bluetooth-based indoor location system to dynamically provide personalized evacuation route recommendations and detailed directions to a person responsible for the building evacuation process [37].
In conclusion, it can be stated that the system should be classified as a coarse position determination system. It has features such as low cost, simplicity, flexibility, use of commonly available elements and low computational load requirements allowing high processing speed. Such a system is directly transferable to other applications such as the supervision of the movement of people or goods, or mobile robots in buildings, warehouse spaces or production halls, so it can also find applications in Industry 4.0 [38,39].

Author Contributions

Conceptualization, D.J., M.S., A.Z. and W.W.; methodology, D.J., M.S., A.Z. and W.W.; software, D.J., A.Z. and K.K.; validation, D.J., M.S., A.Z. and W.W.; formal analysis, D.J., A.I. and W.W.; investigation, D.J., M.S., A.Z. and W.W.; resources, D.J., M.S., A.Z., A.I., K.K. and W.W.; data curation, D.J., A.I. and W.W.; writing—original draft preparation, D.J., A.I. and W.W.; writing—review and editing, D.J., A.I. and W.W.; visualization, D.J., M.S. and W.W.; supervision, W.W.; project administration, W.W.; funding acquisition, W.W. All authors have read and agreed to the published version of the manuscript.

Funding

This research is supported by National Centre for Research and Development (Poland), project “Things are for people (Rzeczy są dla ludzi)/0014/2020”, “ESWSE—Electronic Effective Evacuation Assistance System”, realized by Bialystok University of Technology and Moose sp. z o. o.

Institutional Review Board Statement

Not applicable.

Informed Consent Statement

Not applicable.

Data Availability Statement

Not applicable.

Conflicts of Interest

The authors declare no conflict of interest.

References

  1. ISO/IEC 24730-1:2014; Information Technology—Real-Time Locating Systems (RTLS). 2014. Available online: http://www.iso.org/iso/catalogue_detail.htm?csnumber=59801 (accessed on 7 July 2022).
  2. Jachimczyk, B.; Dziak, D.; Kulesza, W.J. Using the Fingerprinting Method to Customize RTLS Based on the AoA Ranging Technique. Sensors 2016, 16, 876. [Google Scholar] [CrossRef] [PubMed] [Green Version]
  3. Bae, Y. Robust Localization for Robot and IoT Using RSSI. Energies 2019, 12, 2212. [Google Scholar] [CrossRef] [Green Version]
  4. Grzechca, D.; Hanzel, K. The positioning accuracy based on the UWB technology for an object on circular trajectory. Int. J. Electron. Telecommun. 2018, 64, 487–494. [Google Scholar] [CrossRef]
  5. Depari, A.; Flammini, A.; Fogli, D.; Magrino, P. Indoor Localization for Evacuation Management in Emergency Scenarios. In Proceedings of the 2018 Workshop on Metrology for Industry 4.0 and IoT, Brescia, Italy, 16–18 April 2018; pp. 146–150. [Google Scholar] [CrossRef]
  6. Zhuang, Y.; Yang, J.; Li, Y.; Qi, L.; El-Sheimy, N. Smartphone-Based Indoor Localization with Bluetooth Low Energy Beacons. Sensors 2016, 16, 596. [Google Scholar] [CrossRef] [Green Version]
  7. Yan, J.; Tiberius, C.C.J.M.; Janssen, G.J.M.; Teunissen, P.J.G.; Bellusci, G. Review of range-based positioning algorithms. IEEE Aerosp. Electron. Syst. Mag. 2013, 28, 2–27. [Google Scholar] [CrossRef] [Green Version]
  8. Petrović, M.; Ciężkowski, M.; Romaniuk, S.; Wolniakowski, A.; Miljković, Z. A Novel Hybrid NN-ABPE-Based Calibration Method for Improving Accuracy of Lateration Positioning System. Sensors 2021, 21, 8204. [Google Scholar] [CrossRef]
  9. Ciężkowski, M.; Romaniuk, S.; Wolniakowski, A. Apparent beacon position estimation for accuracy improvement in lateration positioning system. Measurement 2020, 153, 107400. [Google Scholar] [CrossRef]
  10. Patwari, N.; Ash, J.N.; Kyperountas, S.; Hero, A.O.; Moses, R.L.; Correal, N.S. Locating the nodes: Cooperative localization in wireless sensor networks. IEEE Signal Process. Mag. 2005, 22, 54–69. [Google Scholar] [CrossRef]
  11. Guvenc, I.; Chong, C.C. A Survey on TOA Based Wireless Localization and NLOS Mitigation Techniques. IEEE Commun. Surv. Tutor. 2009, 11, 107–124. [Google Scholar] [CrossRef]
  12. Naik, G.A.; Khedekar, M.P.; Krishnamoorthy, M.; Patil, S.D.; Deshmukh, R.N. Comparison of RSSI techniques in Wireless Indoor Geolocation. In Proceedings of the National Conference on Computing and Communication Systems, Durgapur, India, 21–22 November 2012; pp. 1–5. [Google Scholar] [CrossRef]
  13. Xiaolong, S.; Shengqi, Y.; Jian, H.; Zhangqin, H. Improved localization algorithm based on RSSI in low power Bluetooth network. In Proceedings of the 2nd International Conference on Cloud Computing and Internet of Things (CCIOT), Dalian, China, 22–23 October 2016; pp. 134–137. [Google Scholar] [CrossRef]
  14. Zhu, X.; Feng, Y. RSSI-based Algorithm for Indoor Localization. Commun. Netw. 2013, 5, 37–42. [Google Scholar] [CrossRef]
  15. Su, W.; Liu, E.; Augé, A.C.; Garcia-Villegas, E.; Wang, R.; You, J. Design and Realization of Precise Indoor Localization Mechanism for Wi-Fi Devices. KSII Trans. Internet Inf. Syst. 2016, 10, 5985–6004. [Google Scholar] [CrossRef]
  16. Botta, M.; Simek, M. Adaptive Distance Estimation Based on RSSI in 802.15.4 Network. Radioengineering 2013, 22, 1162–1168. [Google Scholar]
  17. Hashim, H.A.; Mohammed, S.L.; Gharghan, S.K. Path Loss Model-Based PSO for Accurate Distance Estimation in Indoor Environments. J. Commun. 2018, 13, 712–722. [Google Scholar] [CrossRef] [Green Version]
  18. Abhayawardhana, V.S.; Wassell, I.J.; Crosby, D.; Sellars, M.P.; Brown, M.G. Comparison of empirical propagation path loss models for fixed wireless access systems. In Proceedings of the IEEE 61st Vehicular Technology Conference, Stockholm, Sweden, 30 May–1 June 2005; Volume 1, pp. 73–77. [Google Scholar] [CrossRef]
  19. Obeidat, H.; Shuaieb, W.; Obeidat, O.; Abd-Alhameed, R. A Review of Indoor Localization Techniques and Wireless Technologies. Wirel. Pers. Commun. 2021, 119, 289–327. [Google Scholar] [CrossRef]
  20. Zhou, H.; Liu, J. An Enhanced RSSI-based Framework for Localization of Bluetooth Devices. In Proceedings of the 2022 IEEE International Conference on Electro Information Technology (eIT), Mankato, MN, USA, 19–21 May 2022; pp. 296–304. [Google Scholar] [CrossRef]
  21. Yang, T.; Cabani, A.; Chafouk, H. A Survey of Recent Indoor Localization Scenarios and Methodologies. Sensors 2021, 21, 8086. [Google Scholar] [CrossRef]
  22. Janczak, D.; Sankowski, M.; Grishin, Y. Measurement Fusion Using Maximum-likelihood Estimation of Ballistic Trajectories. IET Radar Sonar Navig. 2016, 10, 834–843. [Google Scholar] [CrossRef]
  23. Ristic, B.; Arulampalam, S.; Gordon, N. Beyond the Kalman Filter: Particle Filters for Tracking Applications; Artech House Radar Library; Artech House: Boston, MA, USA, 2004. [Google Scholar]
  24. Bałazy, P.; Gut, R.; Knap, P. Positioning algorithm for AGV autonomous driving platform based on artificial neural networks. Robot. Syst. Appl. 2021, 1, 41–45. [Google Scholar] [CrossRef]
  25. Xiong, J.; Qin, Q.; Zeng, K. A Distance Measurement Wireless Localization Correction Algorithm Based on RSSI. In Proceedings of the Seventh International Symposium on Computational Intelligence and Design, Hangzhou, China, 13–14 December 2014; pp. 276–278. [Google Scholar] [CrossRef]
  26. Wang, B.; Zhou, S.; Liu, W.; Mo, Y. Indoor localization based on curve fitting and location search using received signal strength. IEEE Trans. Ind. Electron. 2015, 62, 572–582. [Google Scholar] [CrossRef]
  27. Bullmann, M.; Fetzer, T.; Ebner, F.; Ebner, M.; Deinzer, F.; Grzegorzek, M. Comparison of 2.4 GHz WiFi FTM- and RSSI-Based Indoor Positioning Methods in Realistic Scenarios. Sensors 2020, 20, 4515. [Google Scholar] [CrossRef]
  28. Liu, W.; Kulin, M.; Kazaz, T.; Shahid, A.; Moerman, I.; De Poorter, E. Wireless Technology Recognition Based on RSSI Distribution at Sub-Nyquist Sampling Rate for Constrained Devices. Sensors 2017, 17, 2081. [Google Scholar] [CrossRef] [Green Version]
  29. Meng, H.; Yuan, F.; Yan, T.; Zeng, M. Indoor Positioning of RBF Neural Network Based on Improved Fast Clustering Algorithm Combined with LM Algorithm. IEEE Access 2018, 7, 5932–5945. [Google Scholar] [CrossRef]
  30. Du, J.; Yuan, C.; Yue, M.; Ma, T. A Novel Localization Algorithm Based on RSSI and Multilateration for Indoor Environments. Electronics 2022, 11, 289. [Google Scholar] [CrossRef]
  31. Grishin, Y.P.; Janczak, D. A Robust Fixed-Lag Smoothing Algorithm in the Presence of Correlated Outliers. In Proceedings of the 2008 International Radar Symposium, Wroclaw, Poland, 21–23 May 2008; pp. 1–4. [Google Scholar] [CrossRef]
  32. Jańczak, D. Interferences Suppression in Data Fusion Systems. Prz. Elektrotechniczny 2012, 88, 313–316. [Google Scholar]
  33. Gupta, M.; Gao, J.; Aggarwal, C.C.; Han, J. Outlier Detection for Temporal Data: A Survey. IEEE Trans. Knowl. Data Eng. 2014, 26, 2250–2267. [Google Scholar] [CrossRef]
  34. Janczak, D.; Grishin, Y.P.; Nikolajew, A. An Adaptive Target Tracking Algorithm for Fluctuating Signals. In Proceedings of the SPIE 7502, Photonics Applications in Astronomy, Communications, Industry, and High-Energy Physics Experiments 2009, 750219, Wilga, Poland, 25–31 May 2009; pp. 362–369. [Google Scholar] [CrossRef]
  35. Crassidis, J.L.; Junkins, J.L. Optimal Estimation of Dynamic Systems, 2nd ed.; Chapman & Hall/CRC applied mathematics & nonlinear science; CRC Press: Boca Raton, FL, USA, 2012. [Google Scholar]
  36. Bar-Shalom, Y.; Li, X.-R.; Kirubarajan, T. Estimation with Applications to Tracking and Navigation; John Wiley & Sons, Inc.: New York, NY, USA, 2001. [Google Scholar]
  37. Cuinas, I. An Introduction to Cybersecurity at Physical Layer: Obstacles at Radio Channel to Mitigate Hackers’ Chance. Elektron. Ir Elektrotechnika 2020, 26, 58–65. [Google Scholar] [CrossRef]
  38. Mustafa, M.; Alshare, M.; Bhargava, D.; Neware, R.; Singh, B.; Ngulube, P. Perceived Security Risk Based on Moderating Factors for Blockchain Technology Applications in Cloud Storage to Achieve Secure Healthcare Systems. Comput. Math. Methods Med. 2022, 2022, 6112815. [Google Scholar] [CrossRef]
  39. Slanina, Z. Comprehensive study of parking houses for smart cities. IFAC-PapersOnLine 2022, 55, 1–12. [Google Scholar] [CrossRef]
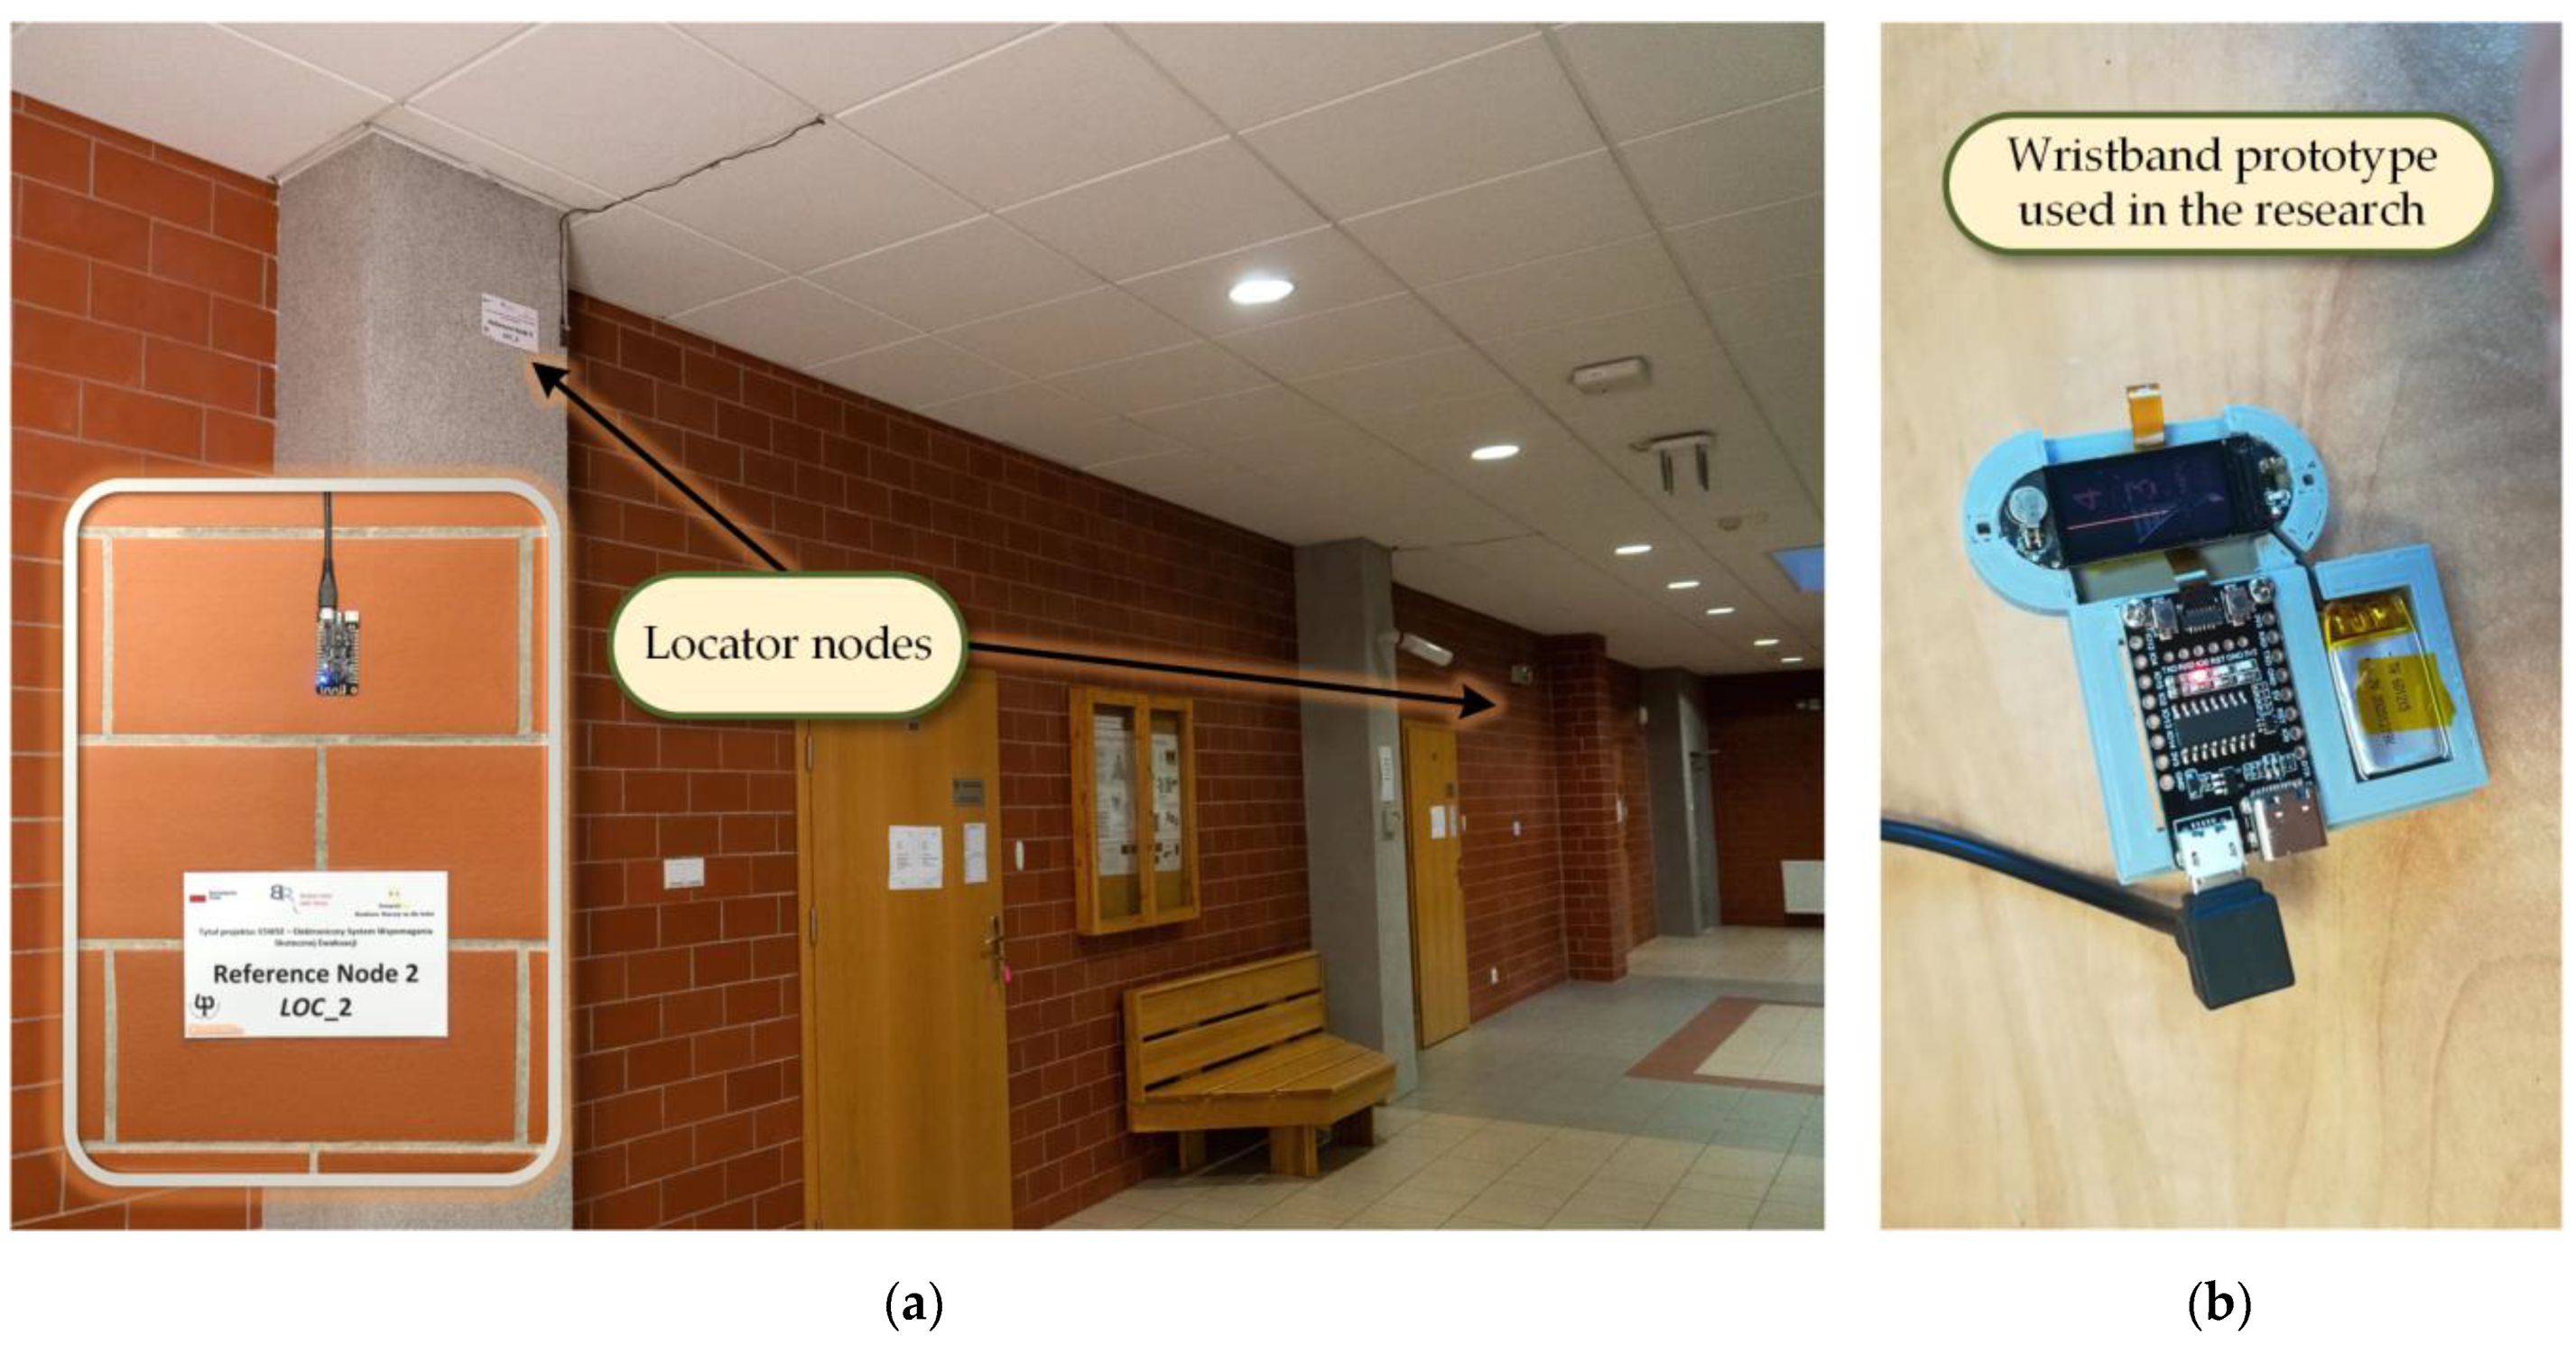
Figure 1. (a) The locator node (receiver). (b) The wristband module (transmitter) connected to the programmer.
Energies 15 08832 g001
Figure 2. Situation sketch showing the performed series of measurements SCA1 (blue color) and SCA2 (green color) in Stage A studies.
Energies 15 08832 g002
Figure 3. Situation sketch showing the mutual placement of locator nodes (LocB1, LocB2, LocB3, LocB4) and object locations (PB1, PB2,…, PB7) in Stage B surveys.
Energies 15 08832 g003
Figure 4. Location of the wristband (PC01,…, PC15) and its position relative to the locator nodes (LocC1,…, LocC7) during a series of measurements in Stage C.
Energies 15 08832 g004
Figure 5. The position of the locator node and wristband placement during the series of measurements in Stage C.
Energies 15 08832 g005
Figure 6. Series of RSSI measurements for an object located at transmitter–receiver distances d: 0.5 m; 2 m; 12 m; 23.6 m.
Energies 15 08832 g006
Figure 7. Histograms of the distribution of RSSI values for measurement points at different distances d from LocA1 for the SCA1 test scenario.
Energies 15 08832 g007
Figure 8. Histograms of the distribution of RSSI values for measurement points at different distances d from LocA2 for the SCA2 test scenario.
Energies 15 08832 g008
Figure 9. Changes in the mean value of the RSSI series of measurements depending on the distance in the SCA1 and SCA2 test scenarios and the logarithmic Model (2).
Energies 15 08832 g009
Figure 10. Examples of outliers in RSSI measurements.
Energies 15 08832 g010
Figure 11. Measurements of RSSI values obtained by four locator nodes for an object placed 1.8 m from the receiver: (a) LocB1 (location PB01); (b) LocB2 (location PB02).
Energies 15 08832 g011
Figure 12. Measurements of RSSI values obtained by four locator nodes for an object placed 1.8 m from the receiver: (a) LocB3 (location PB3); (b) LocB4 (location PB4).
Energies 15 08832 g012
Figure 13. Measurements of RSSI values obtained by four locator nodes for an object placed in front of the LocB3 receiver at a distance of (a) 2.5 m (location PB5); (b) 1.0 m (location PB6).
Energies 15 08832 g013
Figure 14. Measurements of RSSI values obtained by four locator nodes for an object placed in front of the LocB3 receiver at a distance of 0.5 m (location PB7).
Energies 15 08832 g014
Figure 15. RSSI sequences averaged in a moving window with a width of M = 10 for four locator nodes and an object located at a distance of 1.8 m from the receiver: (a) LocB1 (location PB1); (b) LocB2 (location PB2).
Energies 15 08832 g015
Figure 16. RSSI sequences averaged in a moving window with a width of M = 10 for four locator nodes and an object located at a distance of 1.8 m from the receiver: (a) LocB3 (location PB3); (b) LocB4 (location PB4).
Energies 15 08832 g016
Figure 17. RSSI sequences averaged in a moving window with a width of M = 10 for four locator nodes and an object placed in front of the LocB3 receiver at a distance of (a) 2.5 m (location PB5); (b) 1.0 m (location PB6).
Energies 15 08832 g017
Figure 18. RSSI sequences averaged in a moving window with a width of M = 10 for four locator nodes and an object placed in front of the LocB3 receiver at a distance of 0.5 m (location PB7).
Energies 15 08832 g018
Figure 19. Probability of detecting each of the locator nodes depending on the width M of the moving window for an object located at a distance of 1.8 m from the receiver: (a) LocB1 (location PB1); (b) LocB2 (location PB2).
Energies 15 08832 g019
Figure 20. Probability of detecting each of the locator nodes depending on the width M of the moving window for an object located at a distance of 1.8 m from the receiver: (a) LocB3 (location PB3); (b) LocB4 (location PB4).
Energies 15 08832 g020
Figure 21. Probability of detecting each of the locator nodes depending on the width M of the moving window for an object placed in front of the LocB3 receiver at a distance of (a) 2.5 m (location PB5); (b) 1.0 m (location PB6).
Energies 15 08832 g021
Figure 22. An example of the time intervals between successive measurements of the RSSI value obtained by the locator node LocB1 and object location PB1.
Energies 15 08832 g022
Figure 23. Probability of choosing a locator node that is located at least d meters from the wristband in the case of M = 5.
Energies 15 08832 g023
Table 1. The mean values ( m R S S I ) and standard deviations ( σ R S S I ) of the series of RSSI measurements performed according to the SCA1 and SCA2 test scenarios.
d [m]1.02.03.04.05.06.07.08.09.010.012.015.020.023.6
SCA1mRSSI−58.3−67.5−65.1−70.8−76.1−73.5−72.8−73.5-−77.6−77.9−76.5−79.3−84.4
σ R S S I 3.03.21.31.42.31.20.91.8-7.62.35.11.72.0
SCA2mRSSI−54.8−63.6−71.1−69.9−69.6−72.5−75.4−74.5−73.7−74.7----
σ R S S I 1.73.52.43.04.56.04.92.24.83.2----
Table 2. Mean values (mRSSI) and standard deviations (σRSSI) of the RSSI for different LocBn–PBm combinations. The colored cells represent the nearest locator node to the PBm location, where: LocB1 (blue), LocB2 (green), LocB3 (grey), LocB4 (cyan).
LocB1LocB2LocB3LocB4
PB1mRSSI−64.9−71.2−72.5−74.6
σRSSI6.01.01.90.6
PB2mRSSI−82.4−64.9−70.0−69.2
σRSSI2.211.33.01.7
PB3mRSSI−84.2−75.0−60.0−71.0
σRSSI4.51.32.73.2
PB4mRSSI−86.7−78.3−71.3−67.6
σRSSI1.70.83.23.7
PB5mRSSI−88.6−83.7−62.9−70.5
σRSSI4.25.03.40.9
PB6mRSSI−83.3−80.0−54.1−73.3
σRSSI2.66.11.52.6
PB7mRSSI−78.3−77.7−61.7−72.5
σRSSI4.33.55.02.1
Table 3. Probability of occurrence of various delays for locator nodes LocBn and all object locations PBm.
Probability of Delay
Δt =1 s2 s3 s4 s5 s6 s7 s8 s
LocB10.8190.1120.0410.0140.0040.0020.0030.041
LocB20.8830.1170.0420.0150.0050.0020.0000.042
LocB30.8750.1220.0420.0130.0050.0020.0010.042
LocB40.8290.1070.0360.0120.0040.0020.0000.036
Table 4. The number of measurements for each location.
NPCmLocC1LocC2LocC3LocC4LocC5LocC6LocC7
PC011657166816431609166900
PC021637161015761634163700
PC031619159416441047158600
PC041430117214531479104800
PC051011136814011410135800
PC0615371526153915141508230
PC07147814821447143614623470
PC081135313951386140313806930
PC0821586164616521588161414390
PC091339134813781363138410700
PC1013101509154115291536154249
PC11100313981435144513941431385
PC12161316741623170616511628794
PC13108211861487152714469810
PC141046139814321448139740
PC15106014601437148210386230
Table 5. The distances between the projections on the floor plane of the object positions and locator nodes.
d [m]LocC1LocC2LocC3LocC4LocC5LocC6LocC7
PC010.3210.0416.0628.0222.6927.4638.09
PC022.128.0514.0626.0220.7525.8837.05
PC034.116.0512.0624.0218.8124.3536.10
PC046.114.0510.0622.0216.9022.9035.24
PC058.112.068.0720.0215.0021.5434.47
PC0610.100.306.0718.0213.1320.2933.80
PC0712.101.984.0716.0211.3119.1633.23
PC0814.103.972.0814.029.5718.1832.78
PC0916.105.970.3112.027.9417.3832.45
PC1018.107.971.9610.026.5316.7832.24
PC1120.109.963.958.035.4916.4132.15
PC1222.1011.965.956.035.0616.2732.19
PC1324.1013.967.954.035.4016.3832.35
PC1426.1015.969.942.046.3816.7332.63
PC1528.1017.9611.940.307.7617.3033.03
Table 6. Probability of designating a LocCn locator node as the closest one to the wristband placed at PC01 location with different window widths M.
PCm; MLocC1LocC2LocC3LocC4LocC5LocC6LocC7
PC01; M = 10.69430.16540.11590.02040.004000
PC01; M = 20.86780.08970.03870.00320.000600
PC01; M = 30.84130.11020.04820.0002000
PC01; M = 40.90400.06900.02670.0004000
PC01; M = 50.92510.05650.01850000
PC01; M = 60.94540.04070.01400000
PC01; M = 70.95610.03450.00950000
PC01; M = 80.95820.03350.00830000
PC01; M = 90.96690.02610.00700000
PC01; M = 100.97070.02320.00610000
PC01; M = 110.97490.02150.00360000
PC01; M = 120.98200.01440.00350000
PC01; M = 130.98370.01360.00270000
PC01; M = 140.98970.00740.00290000
PC01; M = 150.99000.00720.00280000
Table 7. Probability of designating a LocCn locator node as the closest one to the wristband placed at the PC02 location with different window widths M.
PCm; MLocC1LocC2LocC3LocC4LocC5LocC6LocC7
PC02; M = 11000000
PC02; M = 21000000
PC02; M = 31000000
PC02; M = 41000000
PC02; M = 51000000
PC02; M = 61000000
PC02; M = 71000000
PC02; M = 81000000
PC02; M = 91000000
PC02; M = 101000000
Table 8. The mean error of the position estimation for different widths M of the moving window.
M123456789101112131415
b d ¯ [m]3.553.383.423.383.373.353.343.323.293.293.293.303.313.303.29
Table 9. The probability of assigning a locator node distant to the wristband by at least d meters.
d > 2d > 4d > 6d > 8d > 10d > 12d > 14d > 16d > 17d > 18d > 20d > 22d > 24d > 26d > 28
M = 10.67630.35480.24770.07070.02870.01350.01170.01170.00160.00160.00160.00160.00130.00130.0013
M = 20.66710.34670.22530.06070.01940.00580.00550.00550.00020.00020.00020.00020.00020.00020.0002
M = 30.66740.34840.23030.06870.02440.00510.00500.00501.6 × 10−51.6 × 10−51.6 × 10−51.6 × 10−51.6 × 10−51.6 × 10−51.6 × 10−5
M = 40.65900.34280.22620.07120.02460.00360.00360.00362.4 × 10−52.4 × 10−52.4 × 10−52.4 × 10−52.4 × 10−52.4 × 10−52.4 × 10−5
M = 50.65350.33850.22470.07450.02610.00290.00290.00290000000
M = 60.64980.33570.22310.07580.02600.00240.00240.00240000000
M = 70.64900.33620.22210.07520.02460.00200.00200.00200000000
M = 80.64730.33550.21850.07370.02150.00170.00170.00170000000
M = 90.64430.33270.21320.07120.01820.00150.00150.00150000000
M = 100.64380.33330.21380.07190.01800.00140.00140.00140000000
M = 110.64260.33220.21450.07370.01920.00110.00110.00110000000
M = 120.64120.33150.21570.07520.01990.00090.00090.00090000000
M = 130.64080.33120.21730.07720.02140.00090.00090.00090000000
M = 140.63960.33020.21620.07670.02070.00080.00080.00080000000
M =150.63850.32900.21500.07640.02040.00060.00060.00060000000
Publisher’s Note: MDPI stays neutral with regard to jurisdictional claims in published maps and institutional affiliations.