

Structural Characterization of Polysaccharide Derived from Gastrodia elata and Its Immunostimulatory Effect on RAW264.7 Cells
Abstract
1. Introduction
2. Results
2.1. Extraction and Purification of Polysaccharides
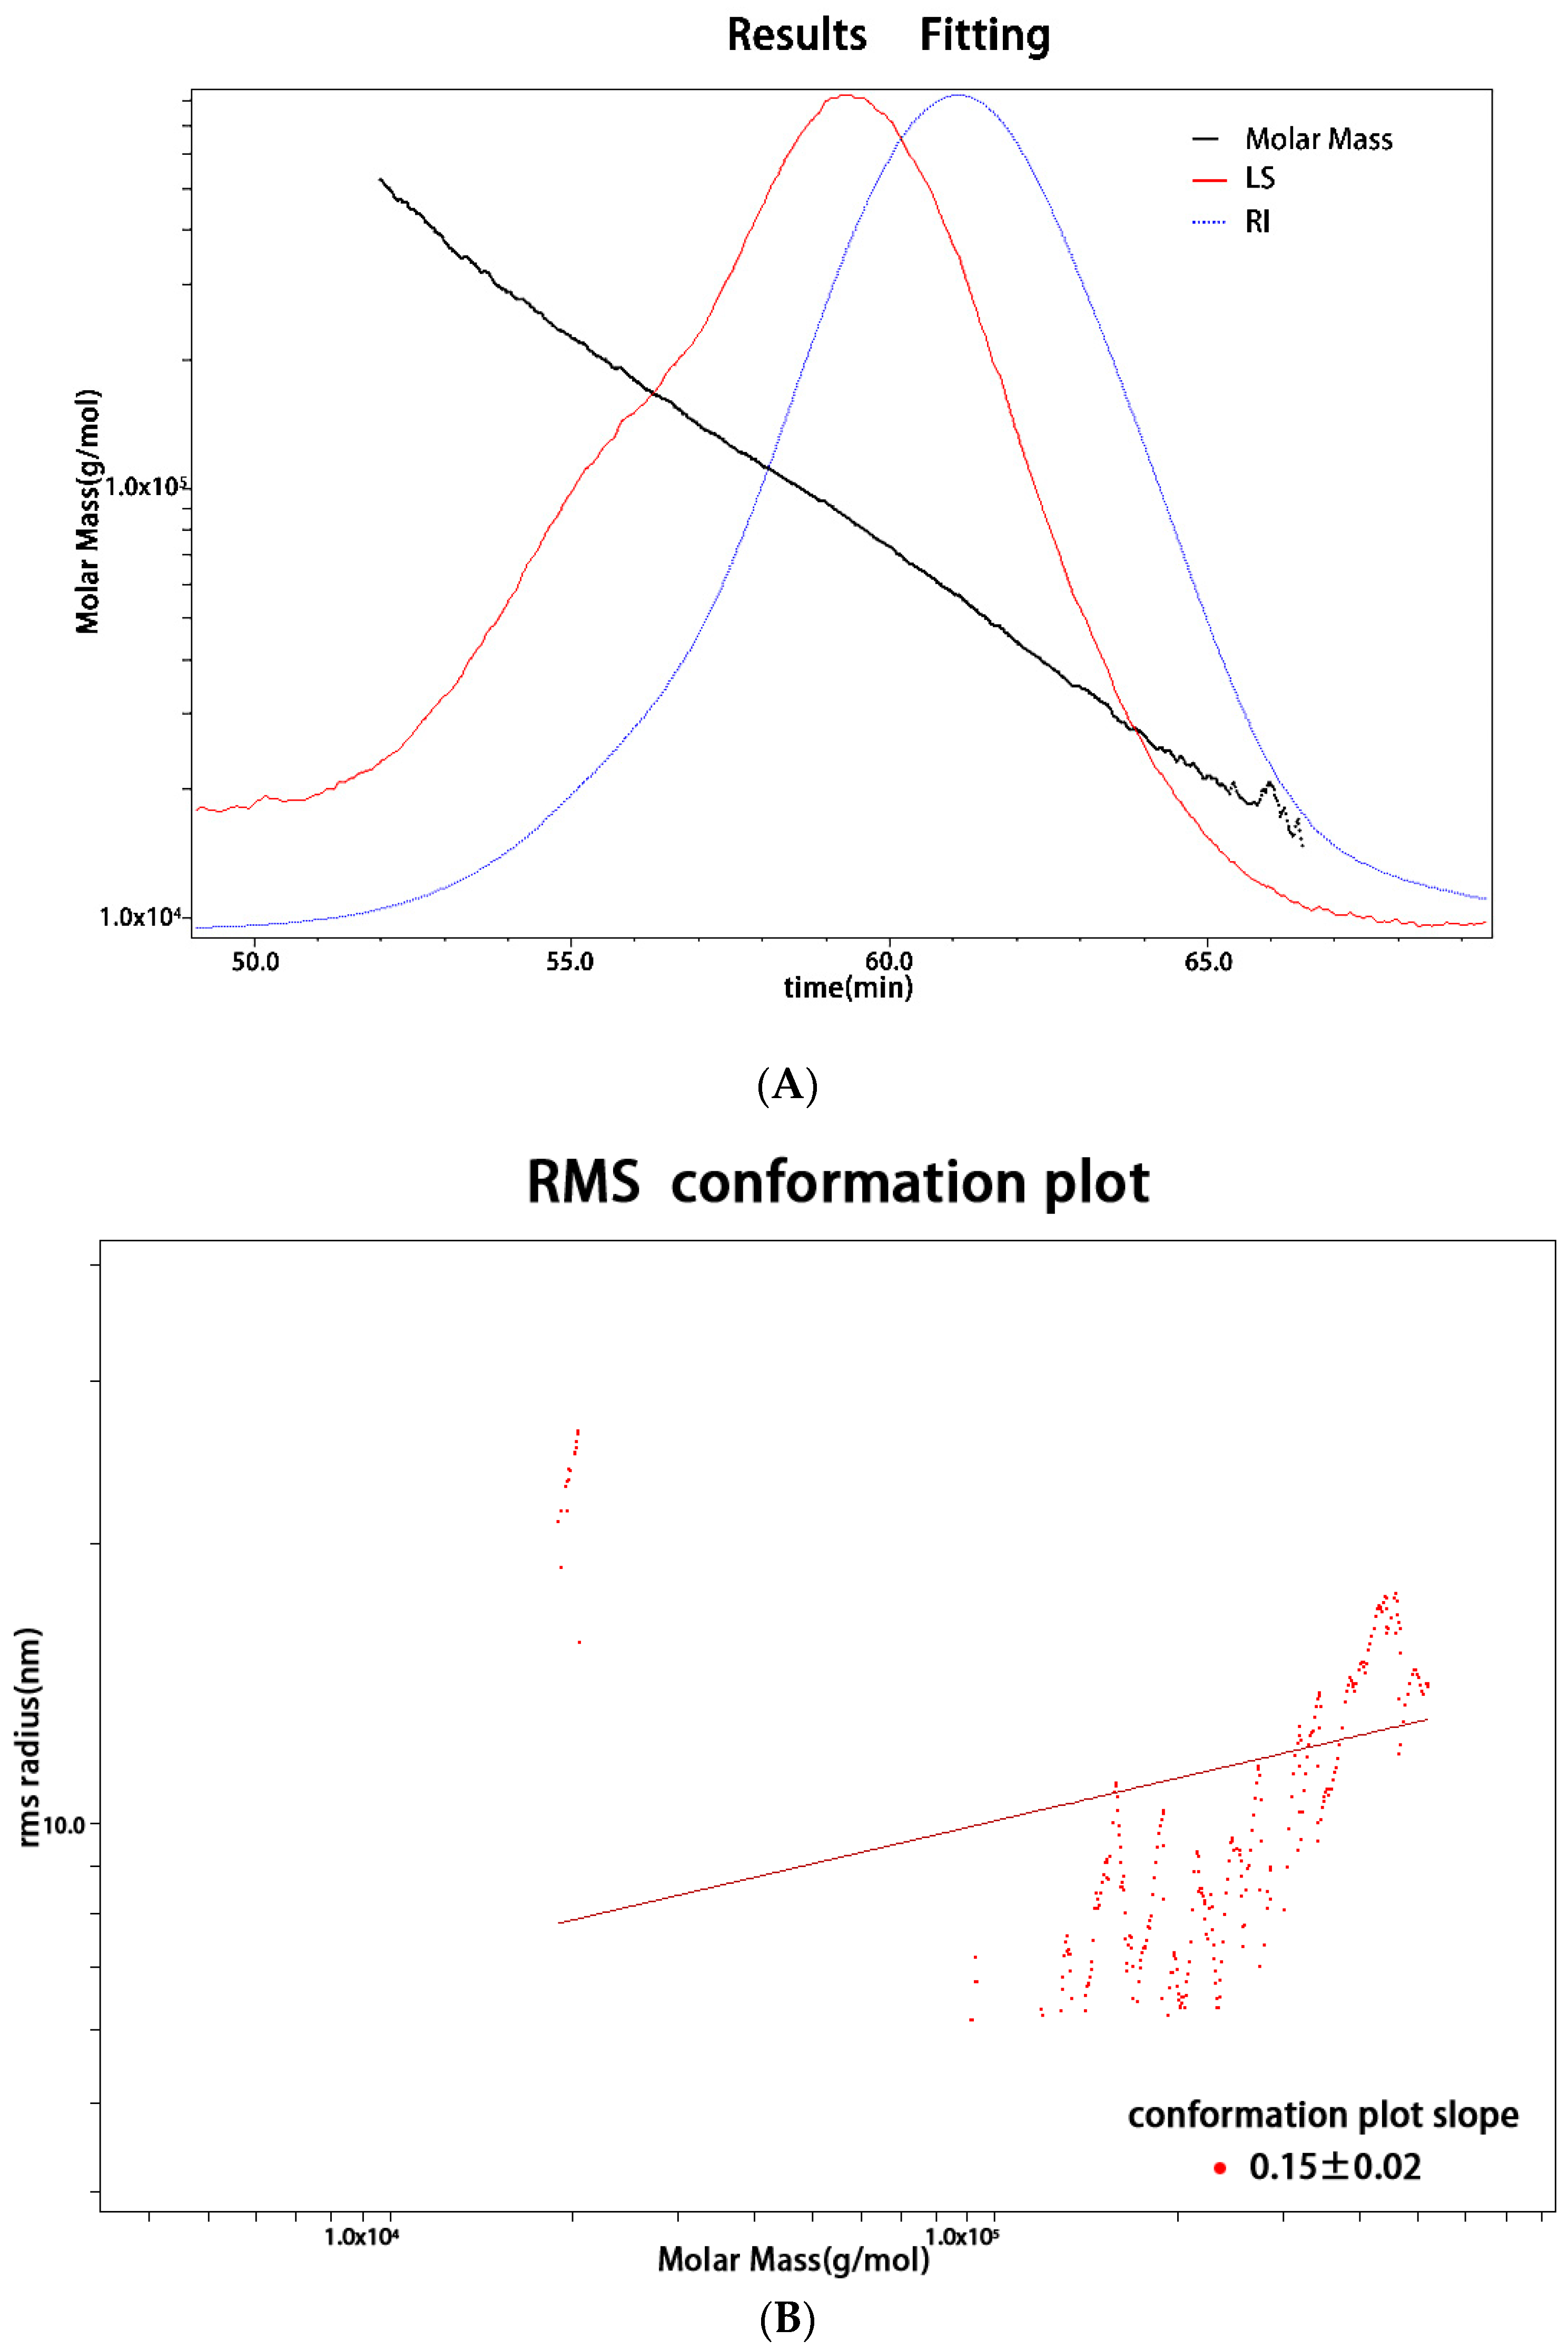
2.2. Monosaccharide Composition and Molecular Weight
2.3. FT-IR Analysis
2.4. Methylation Analysis
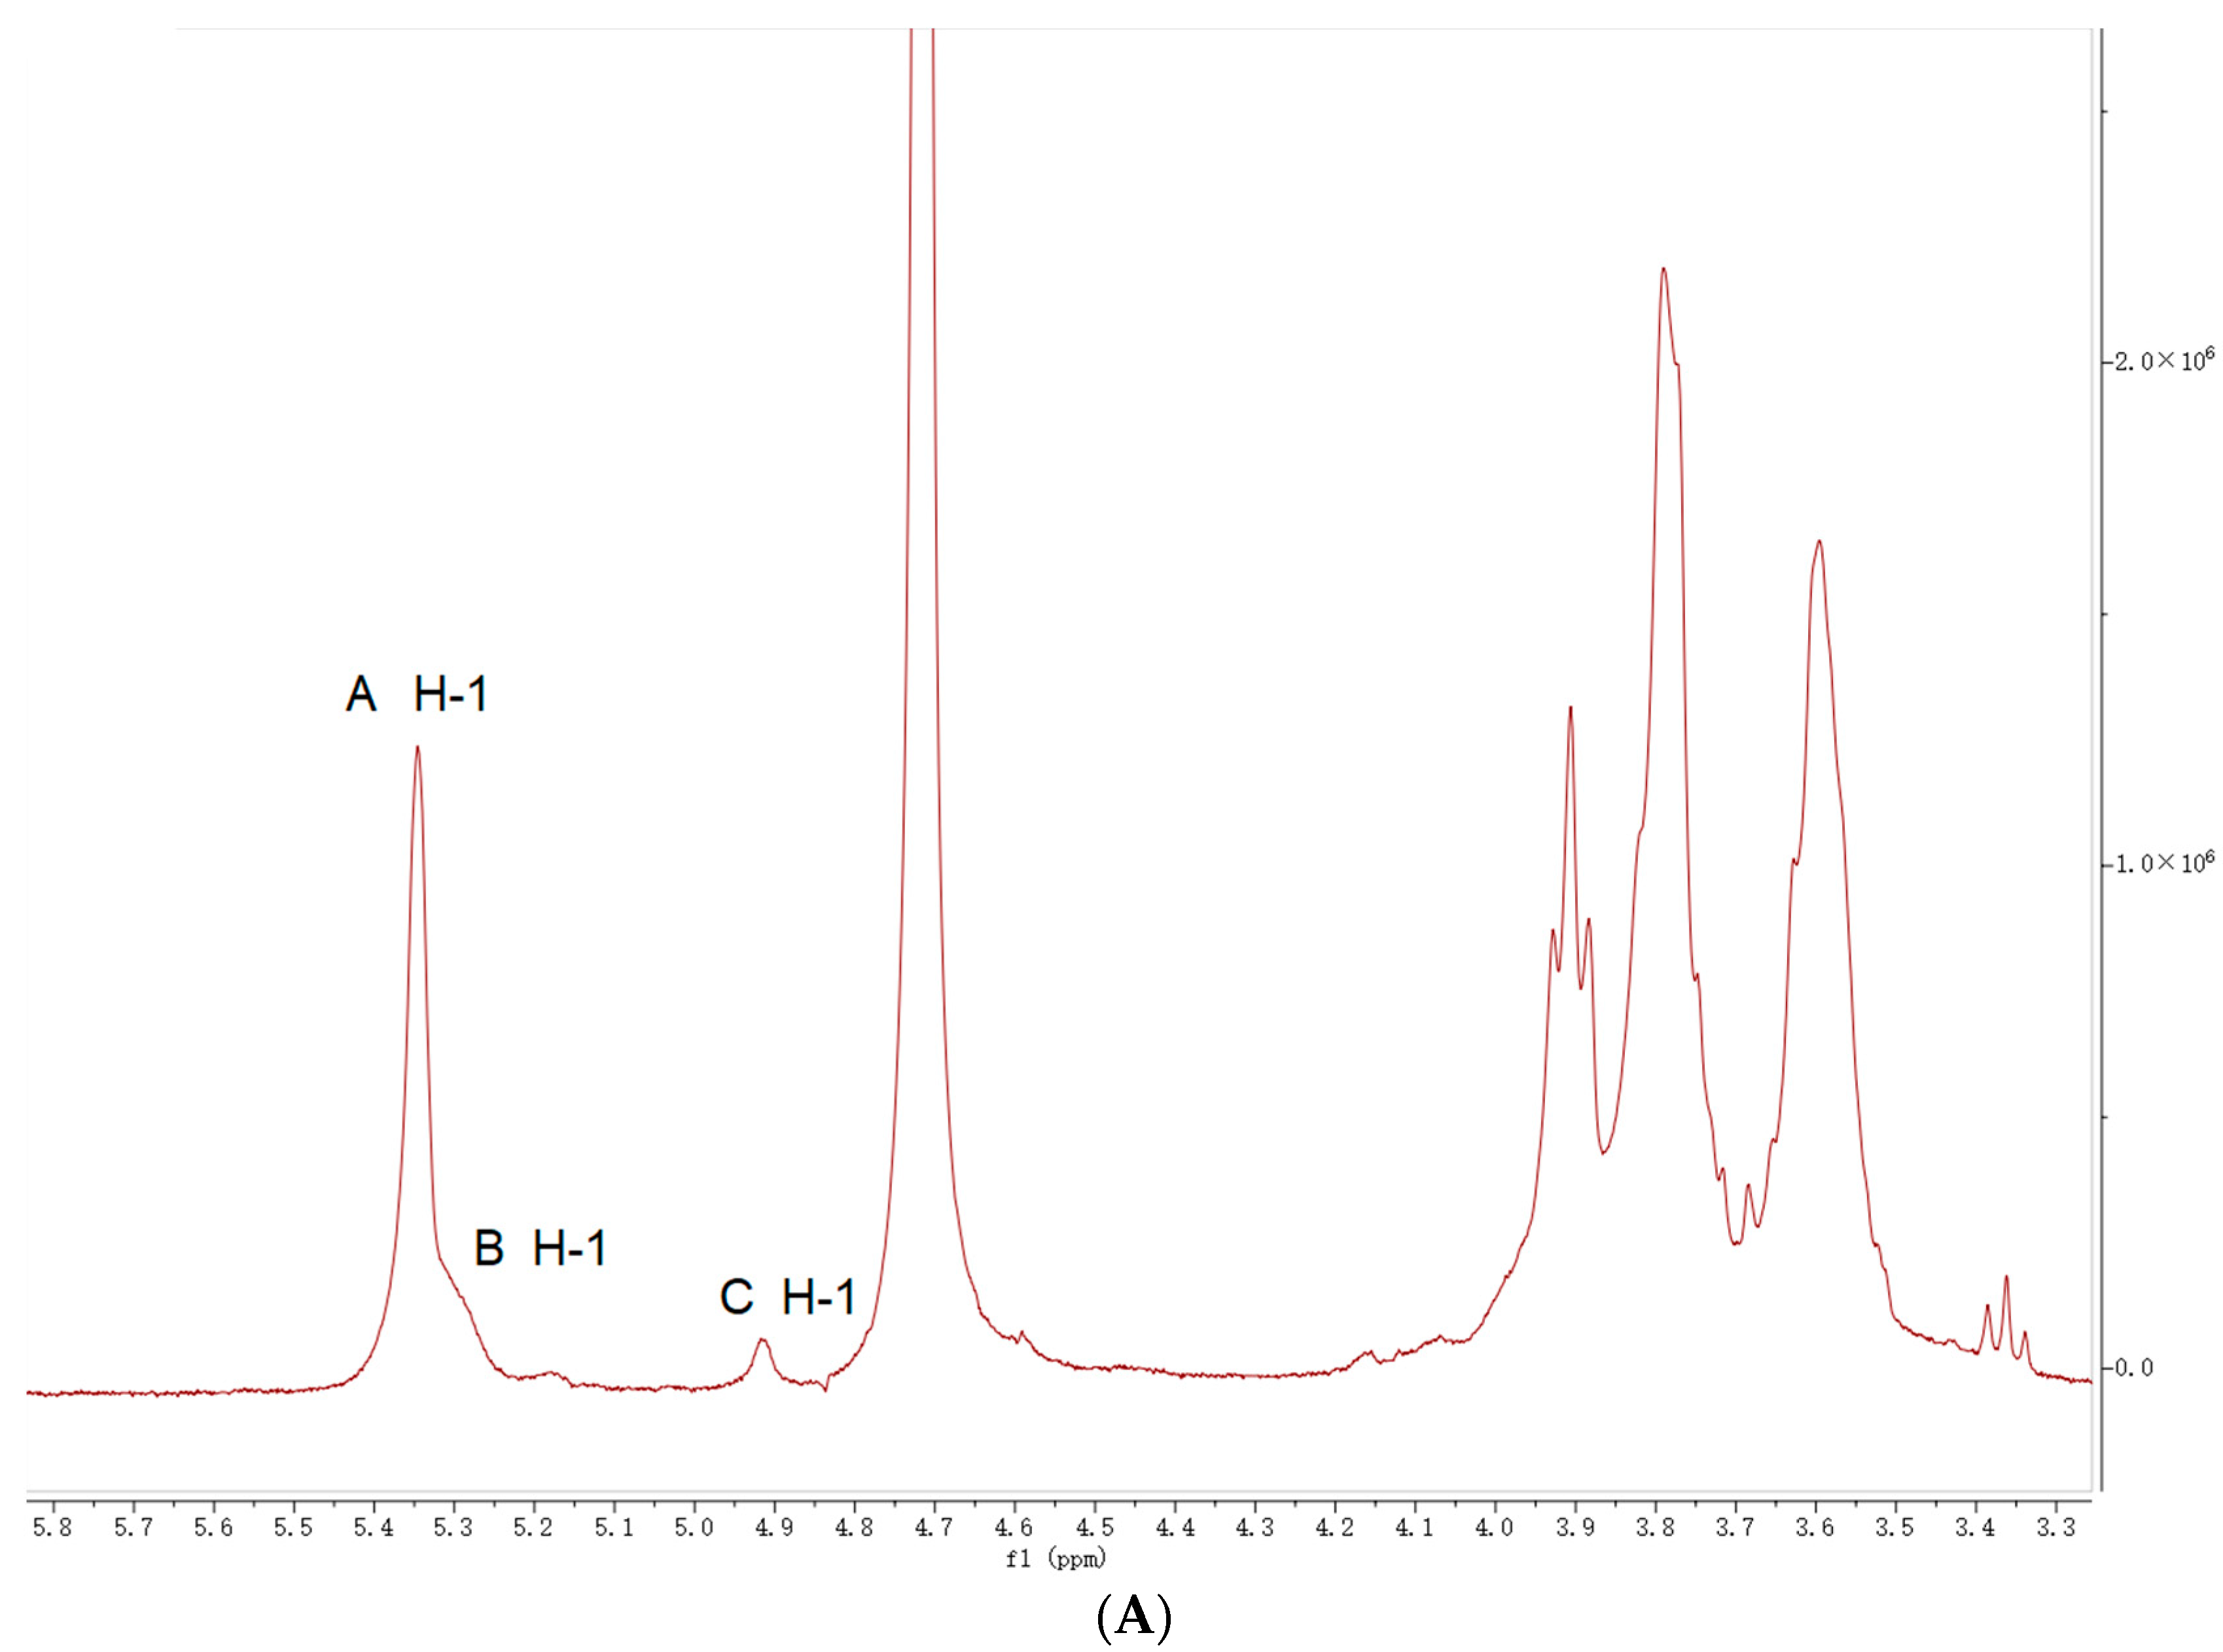
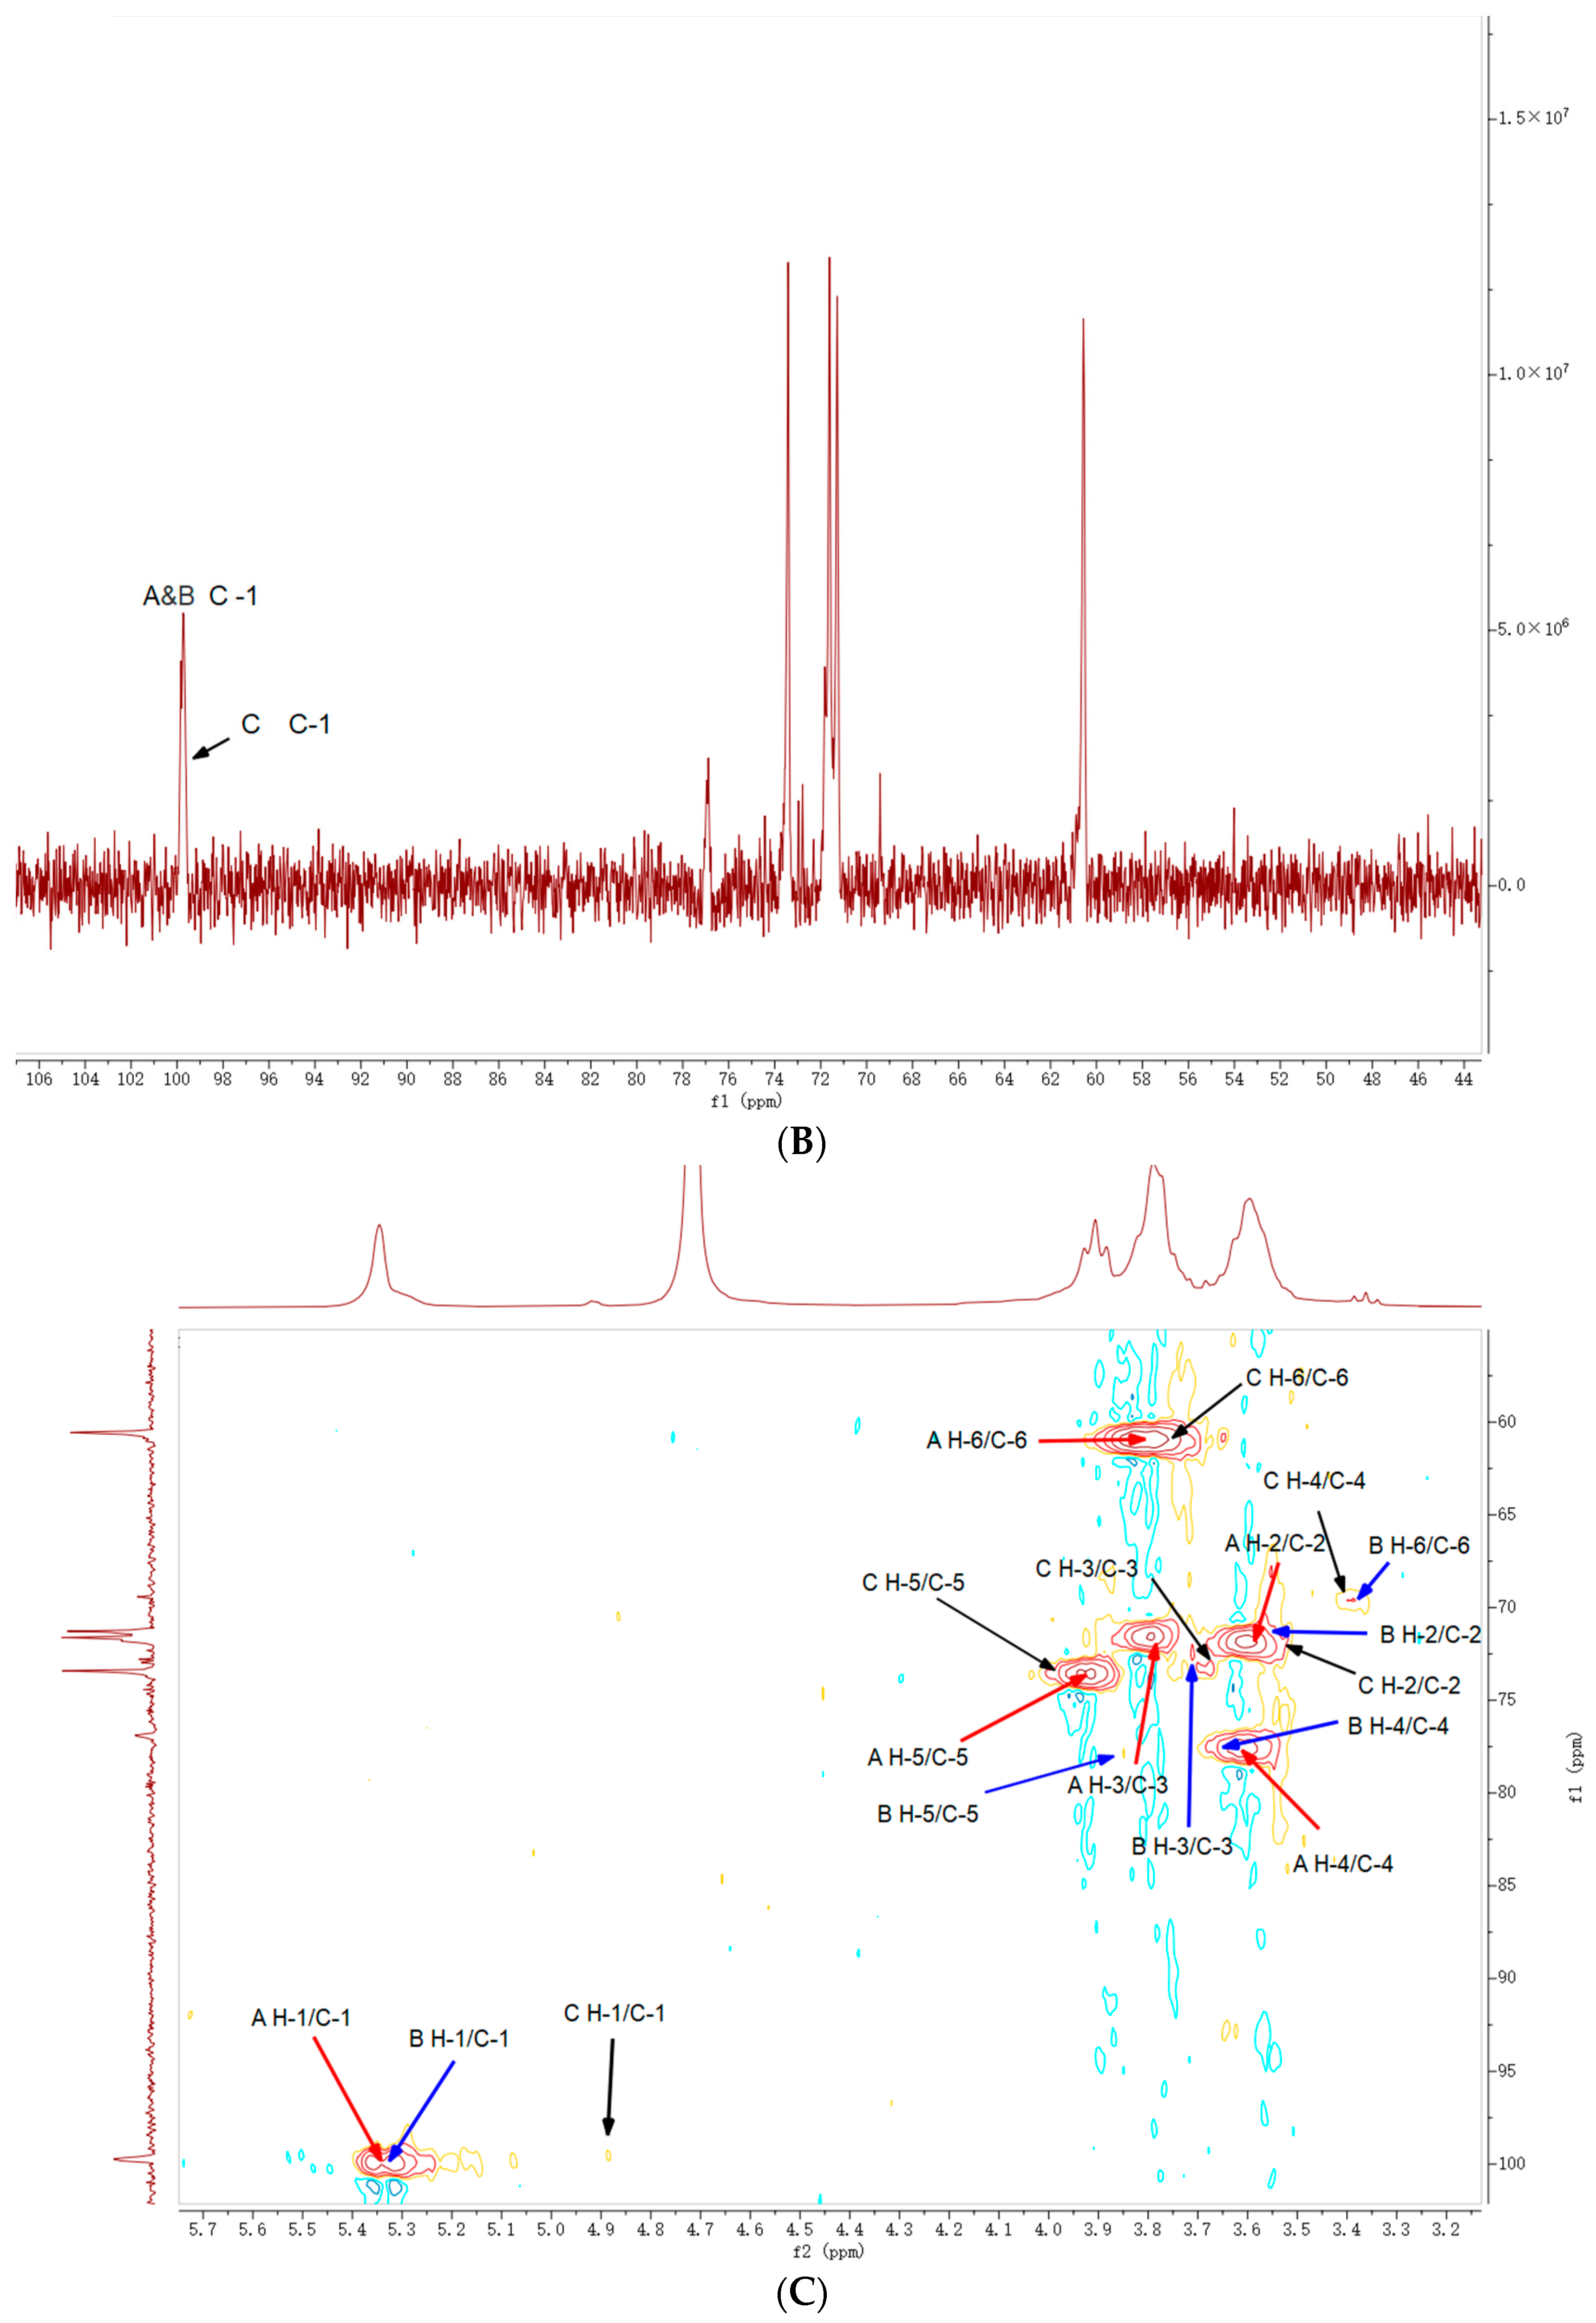
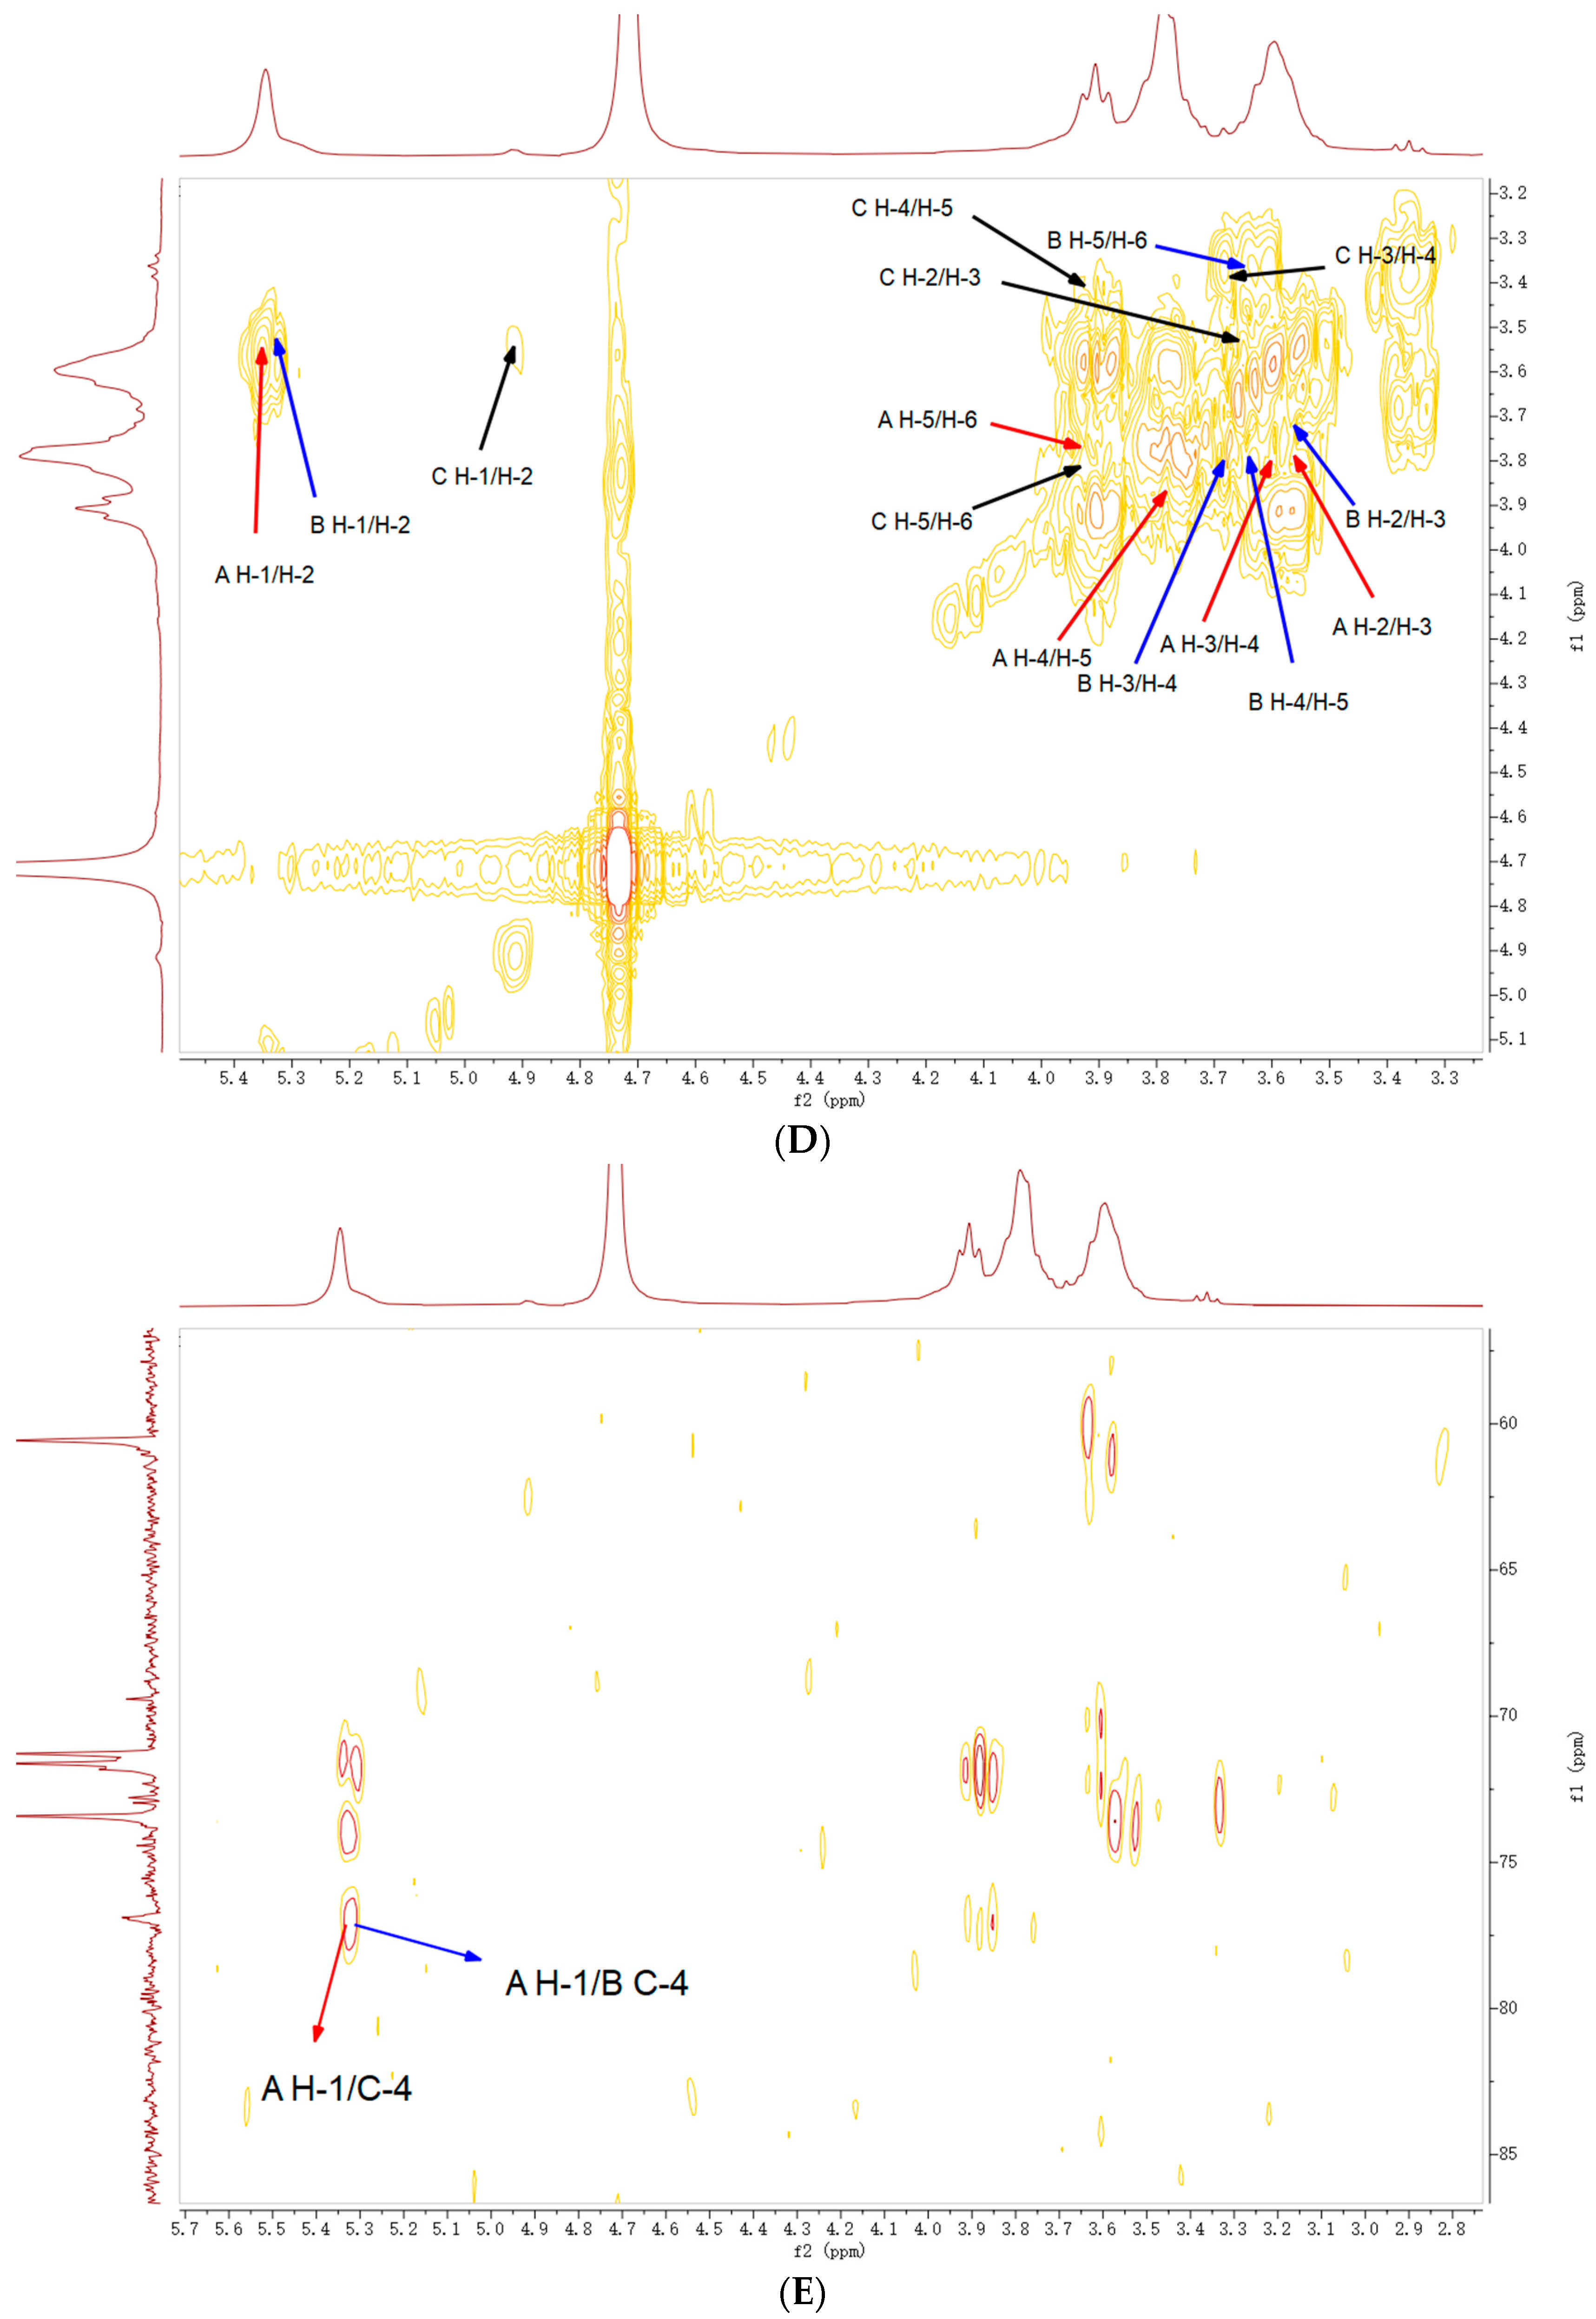
2.5. NMR Analysis
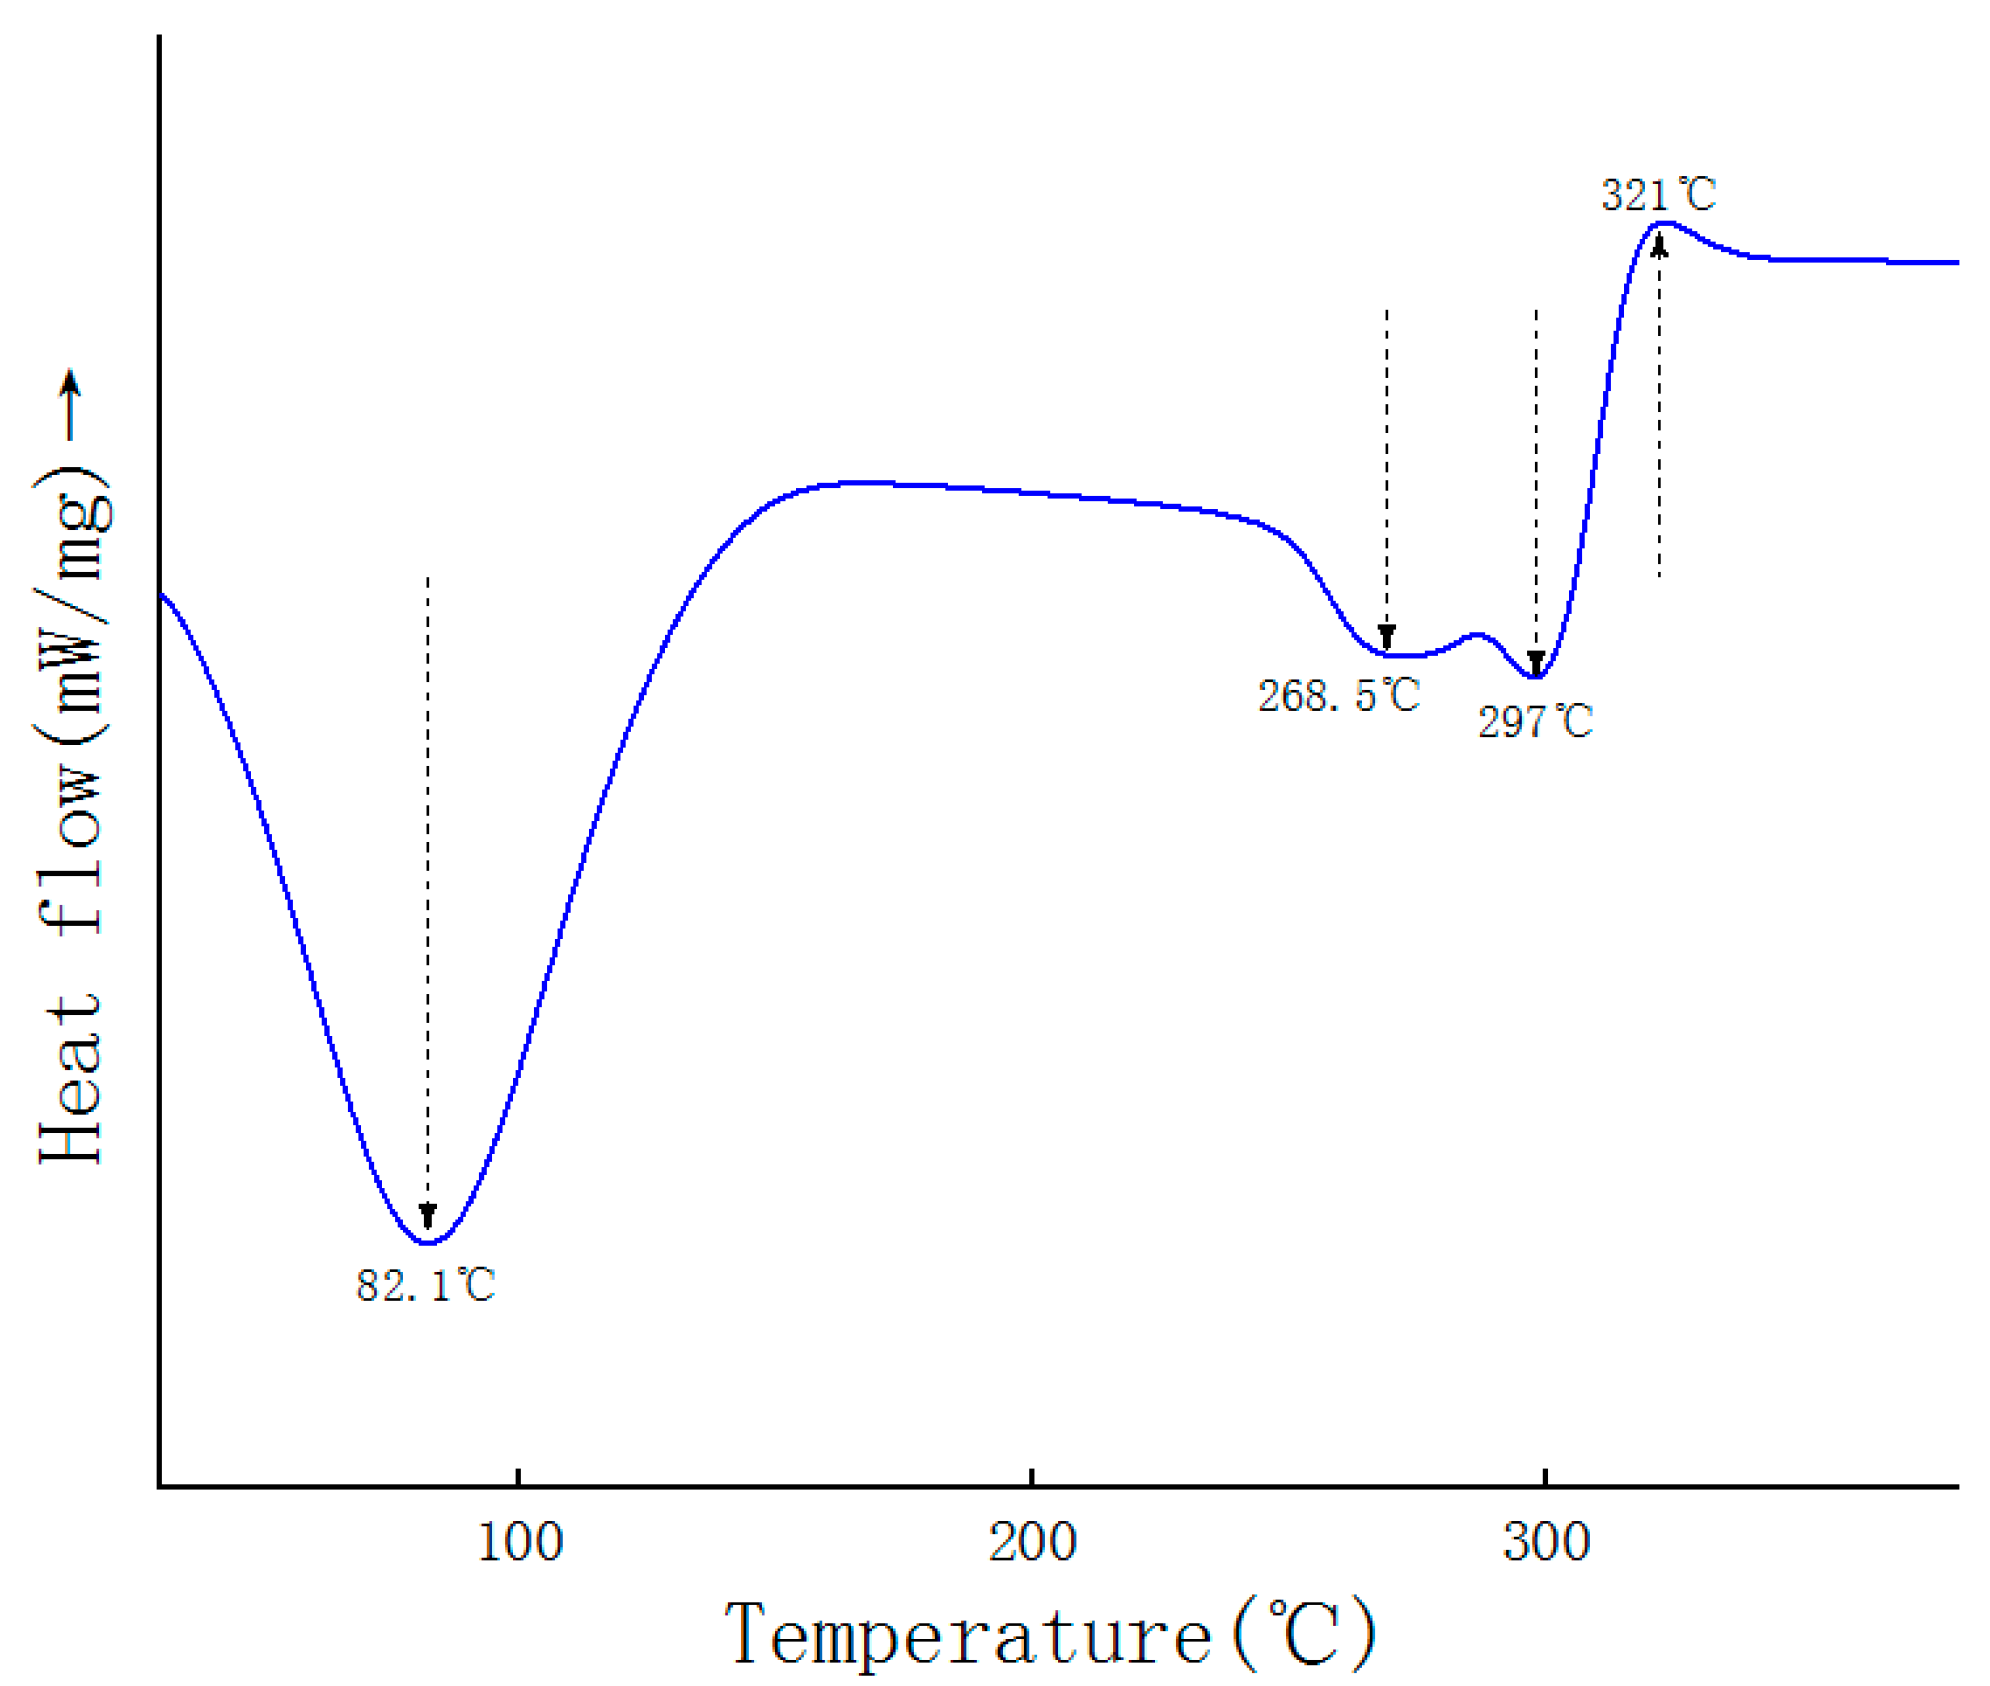
2.6. DSC Analysis
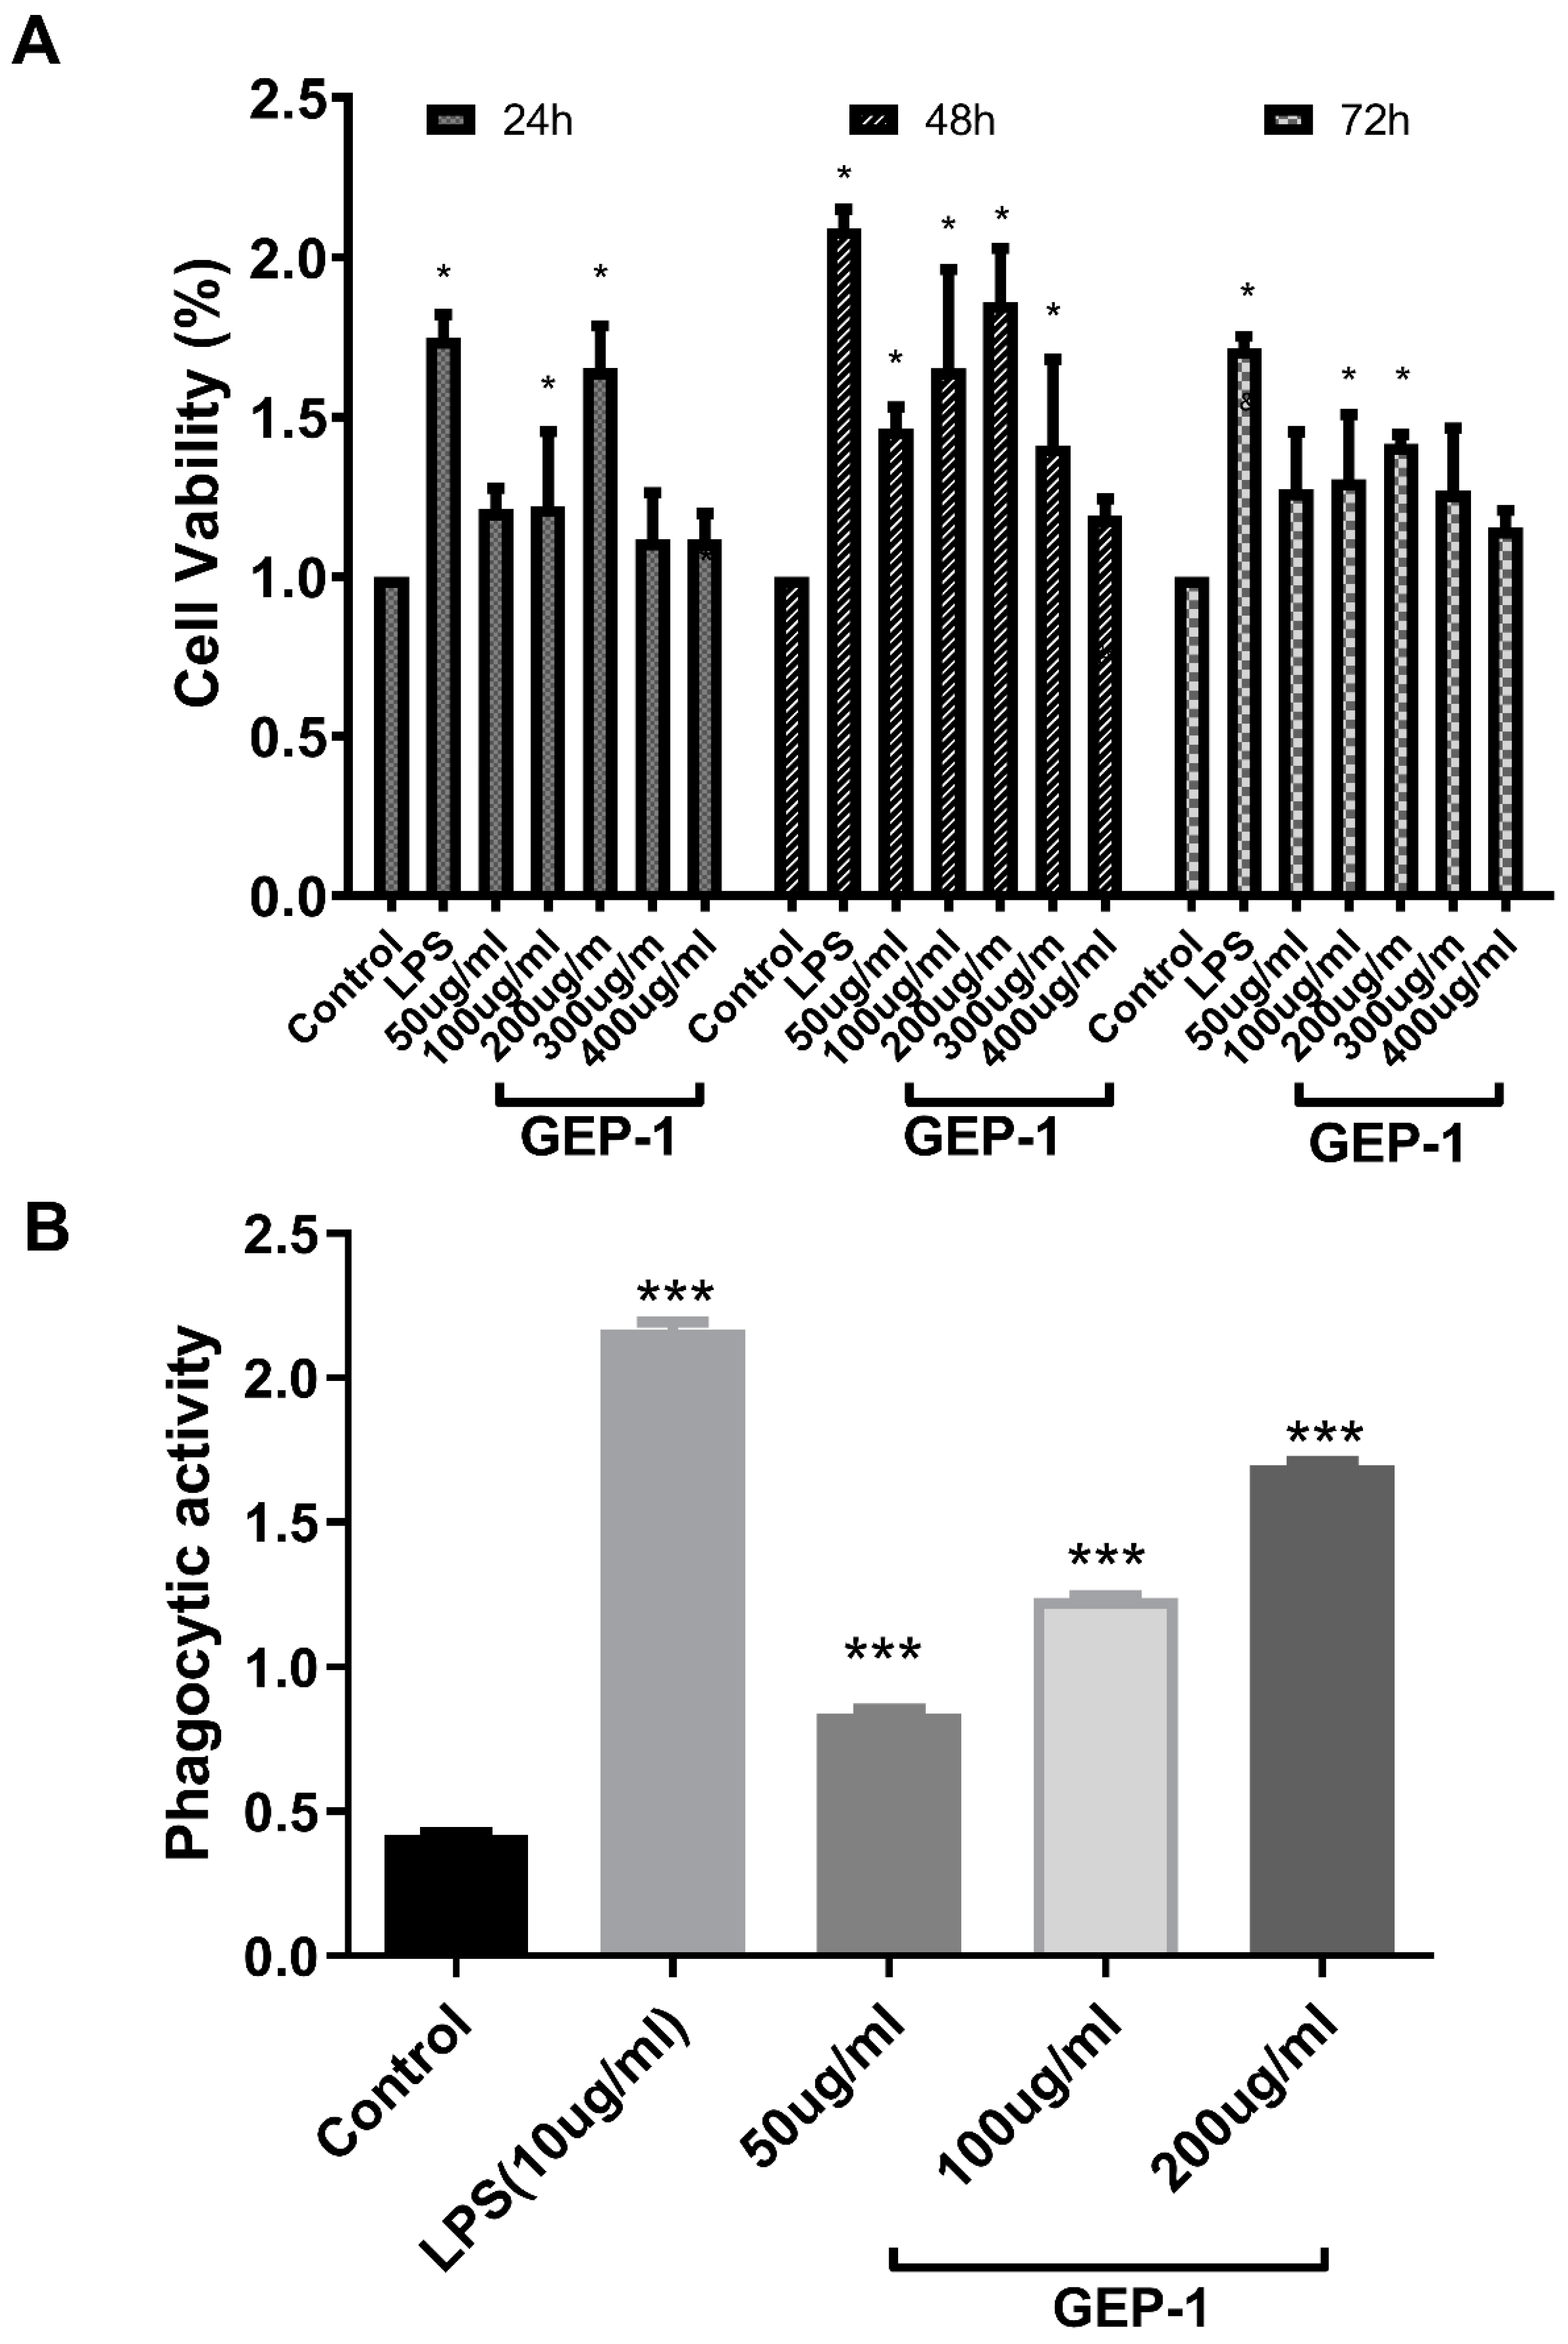
2.7. Cell Proliferative and Phagocytic Activities
2.8. Cytokine and NO Levels
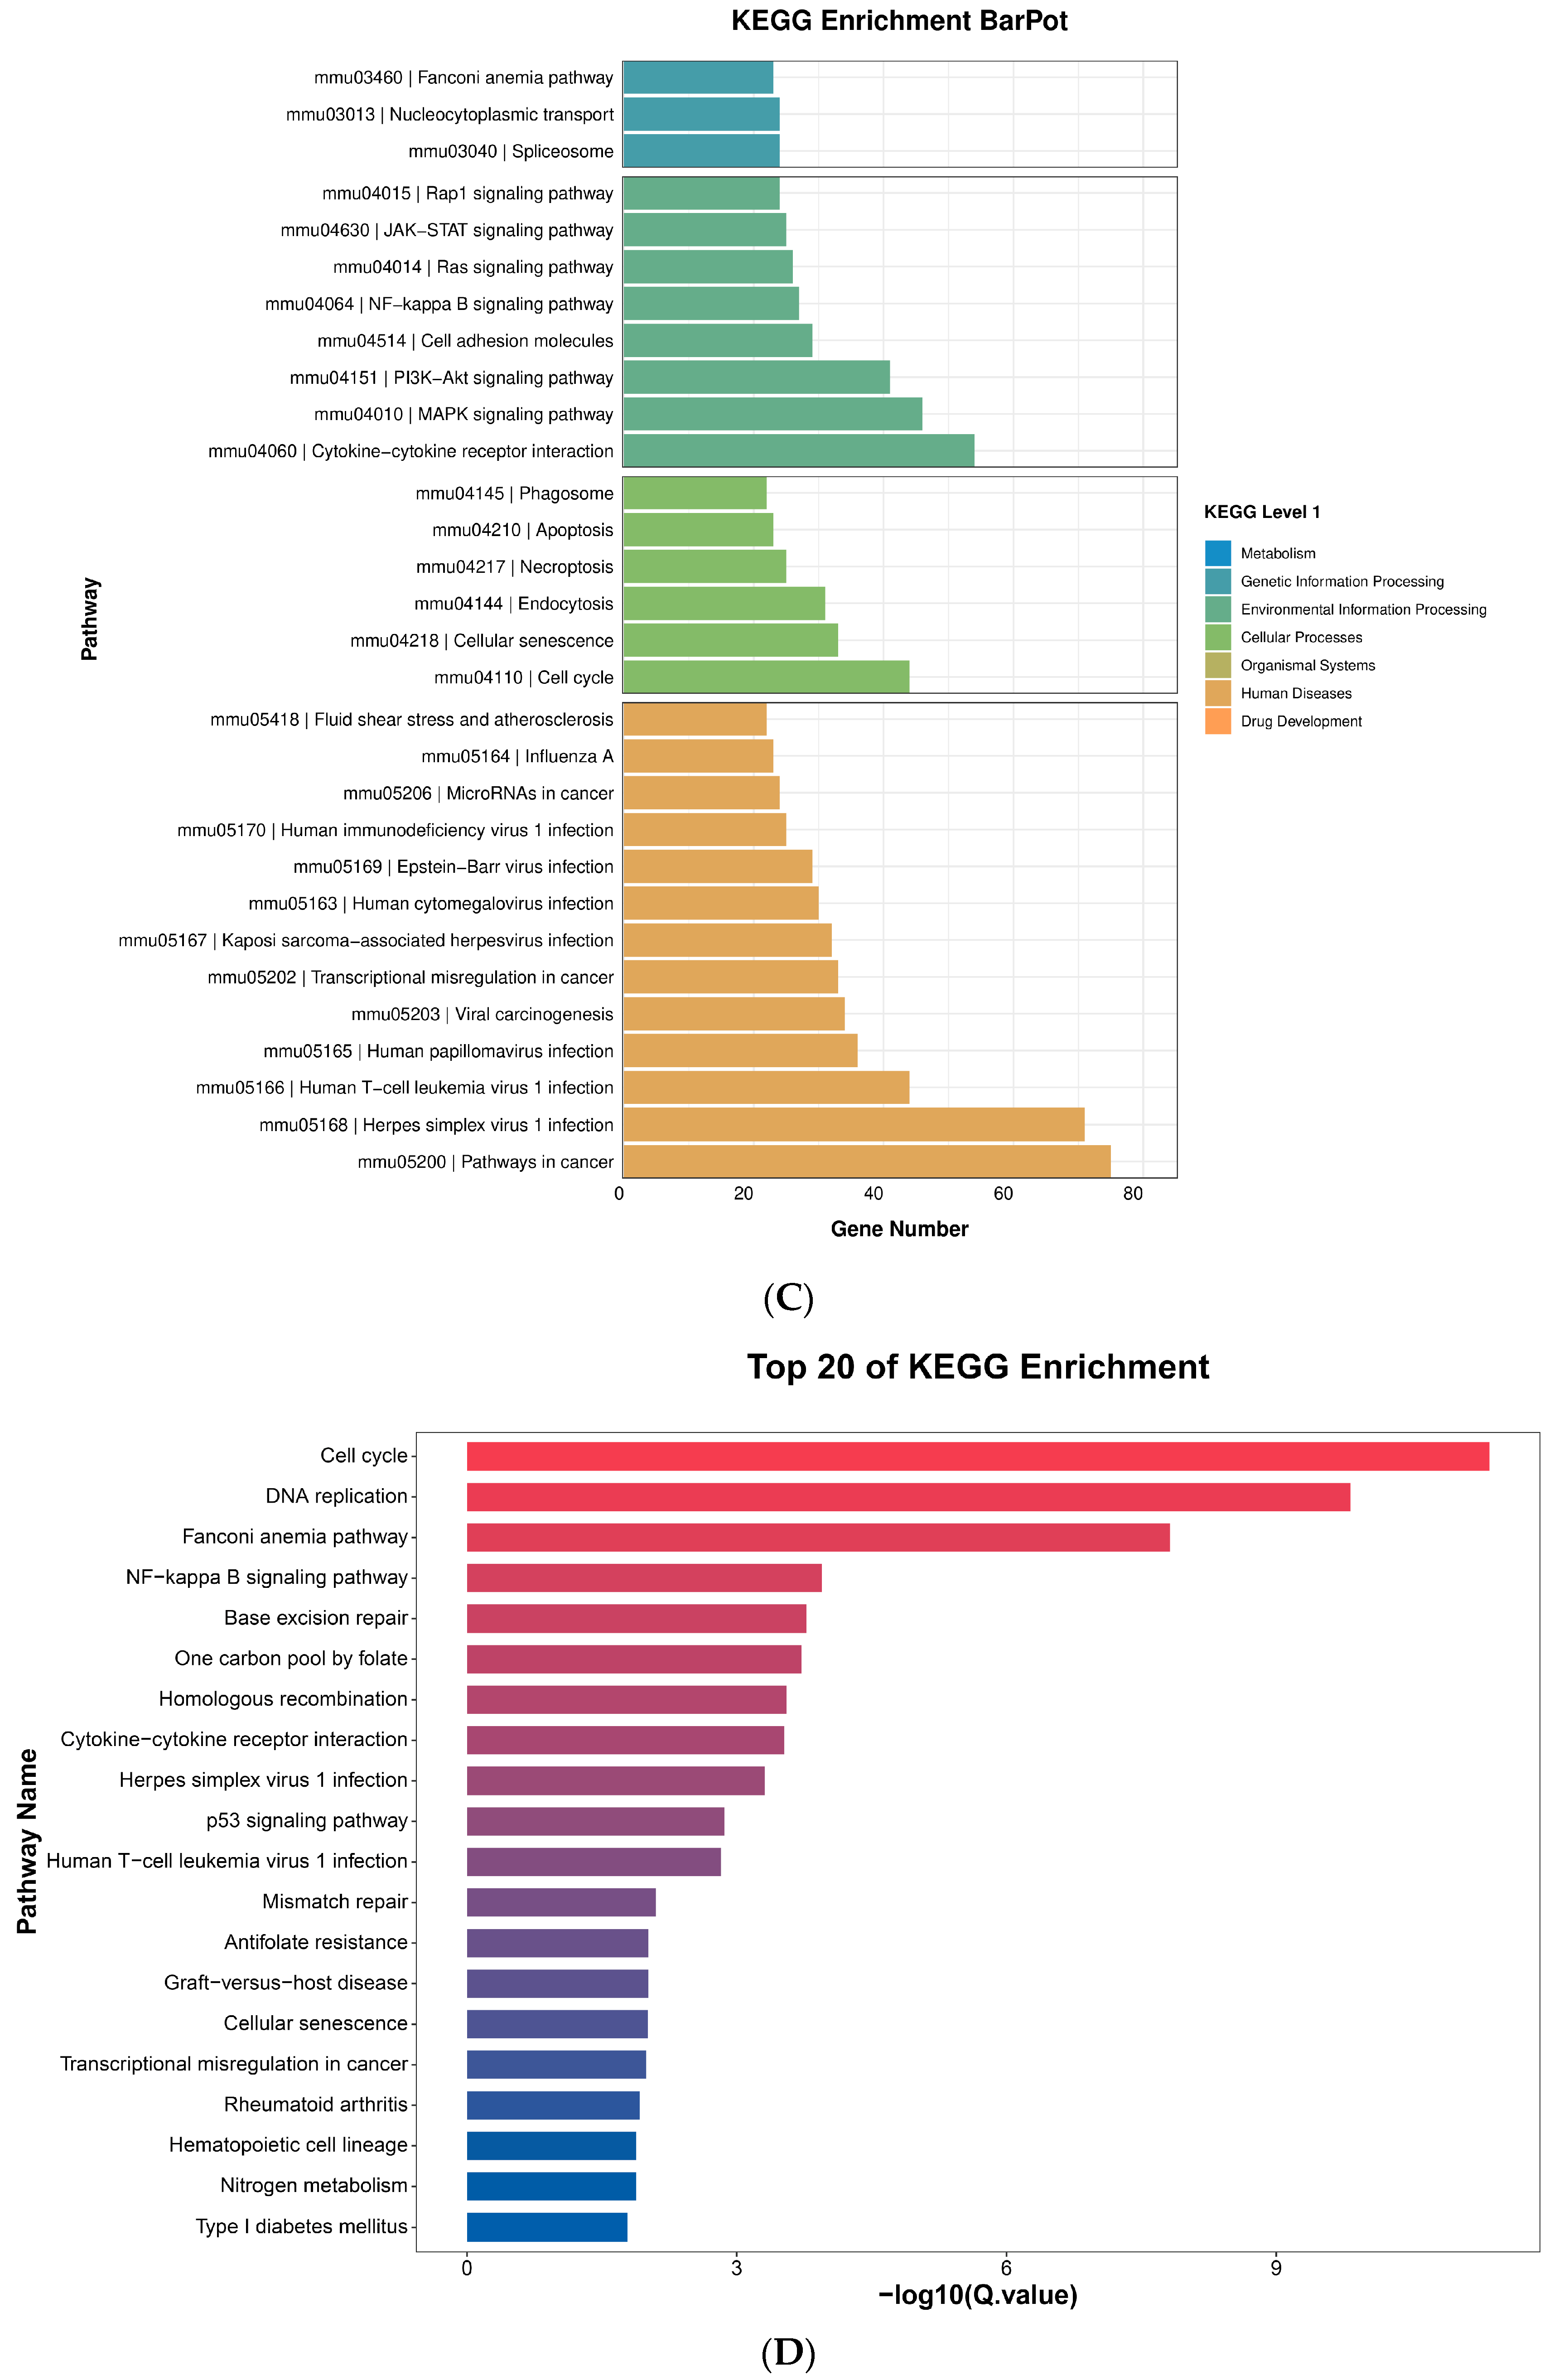
2.9. Transcriptomic Analysis
2.10. Pathway Analysis
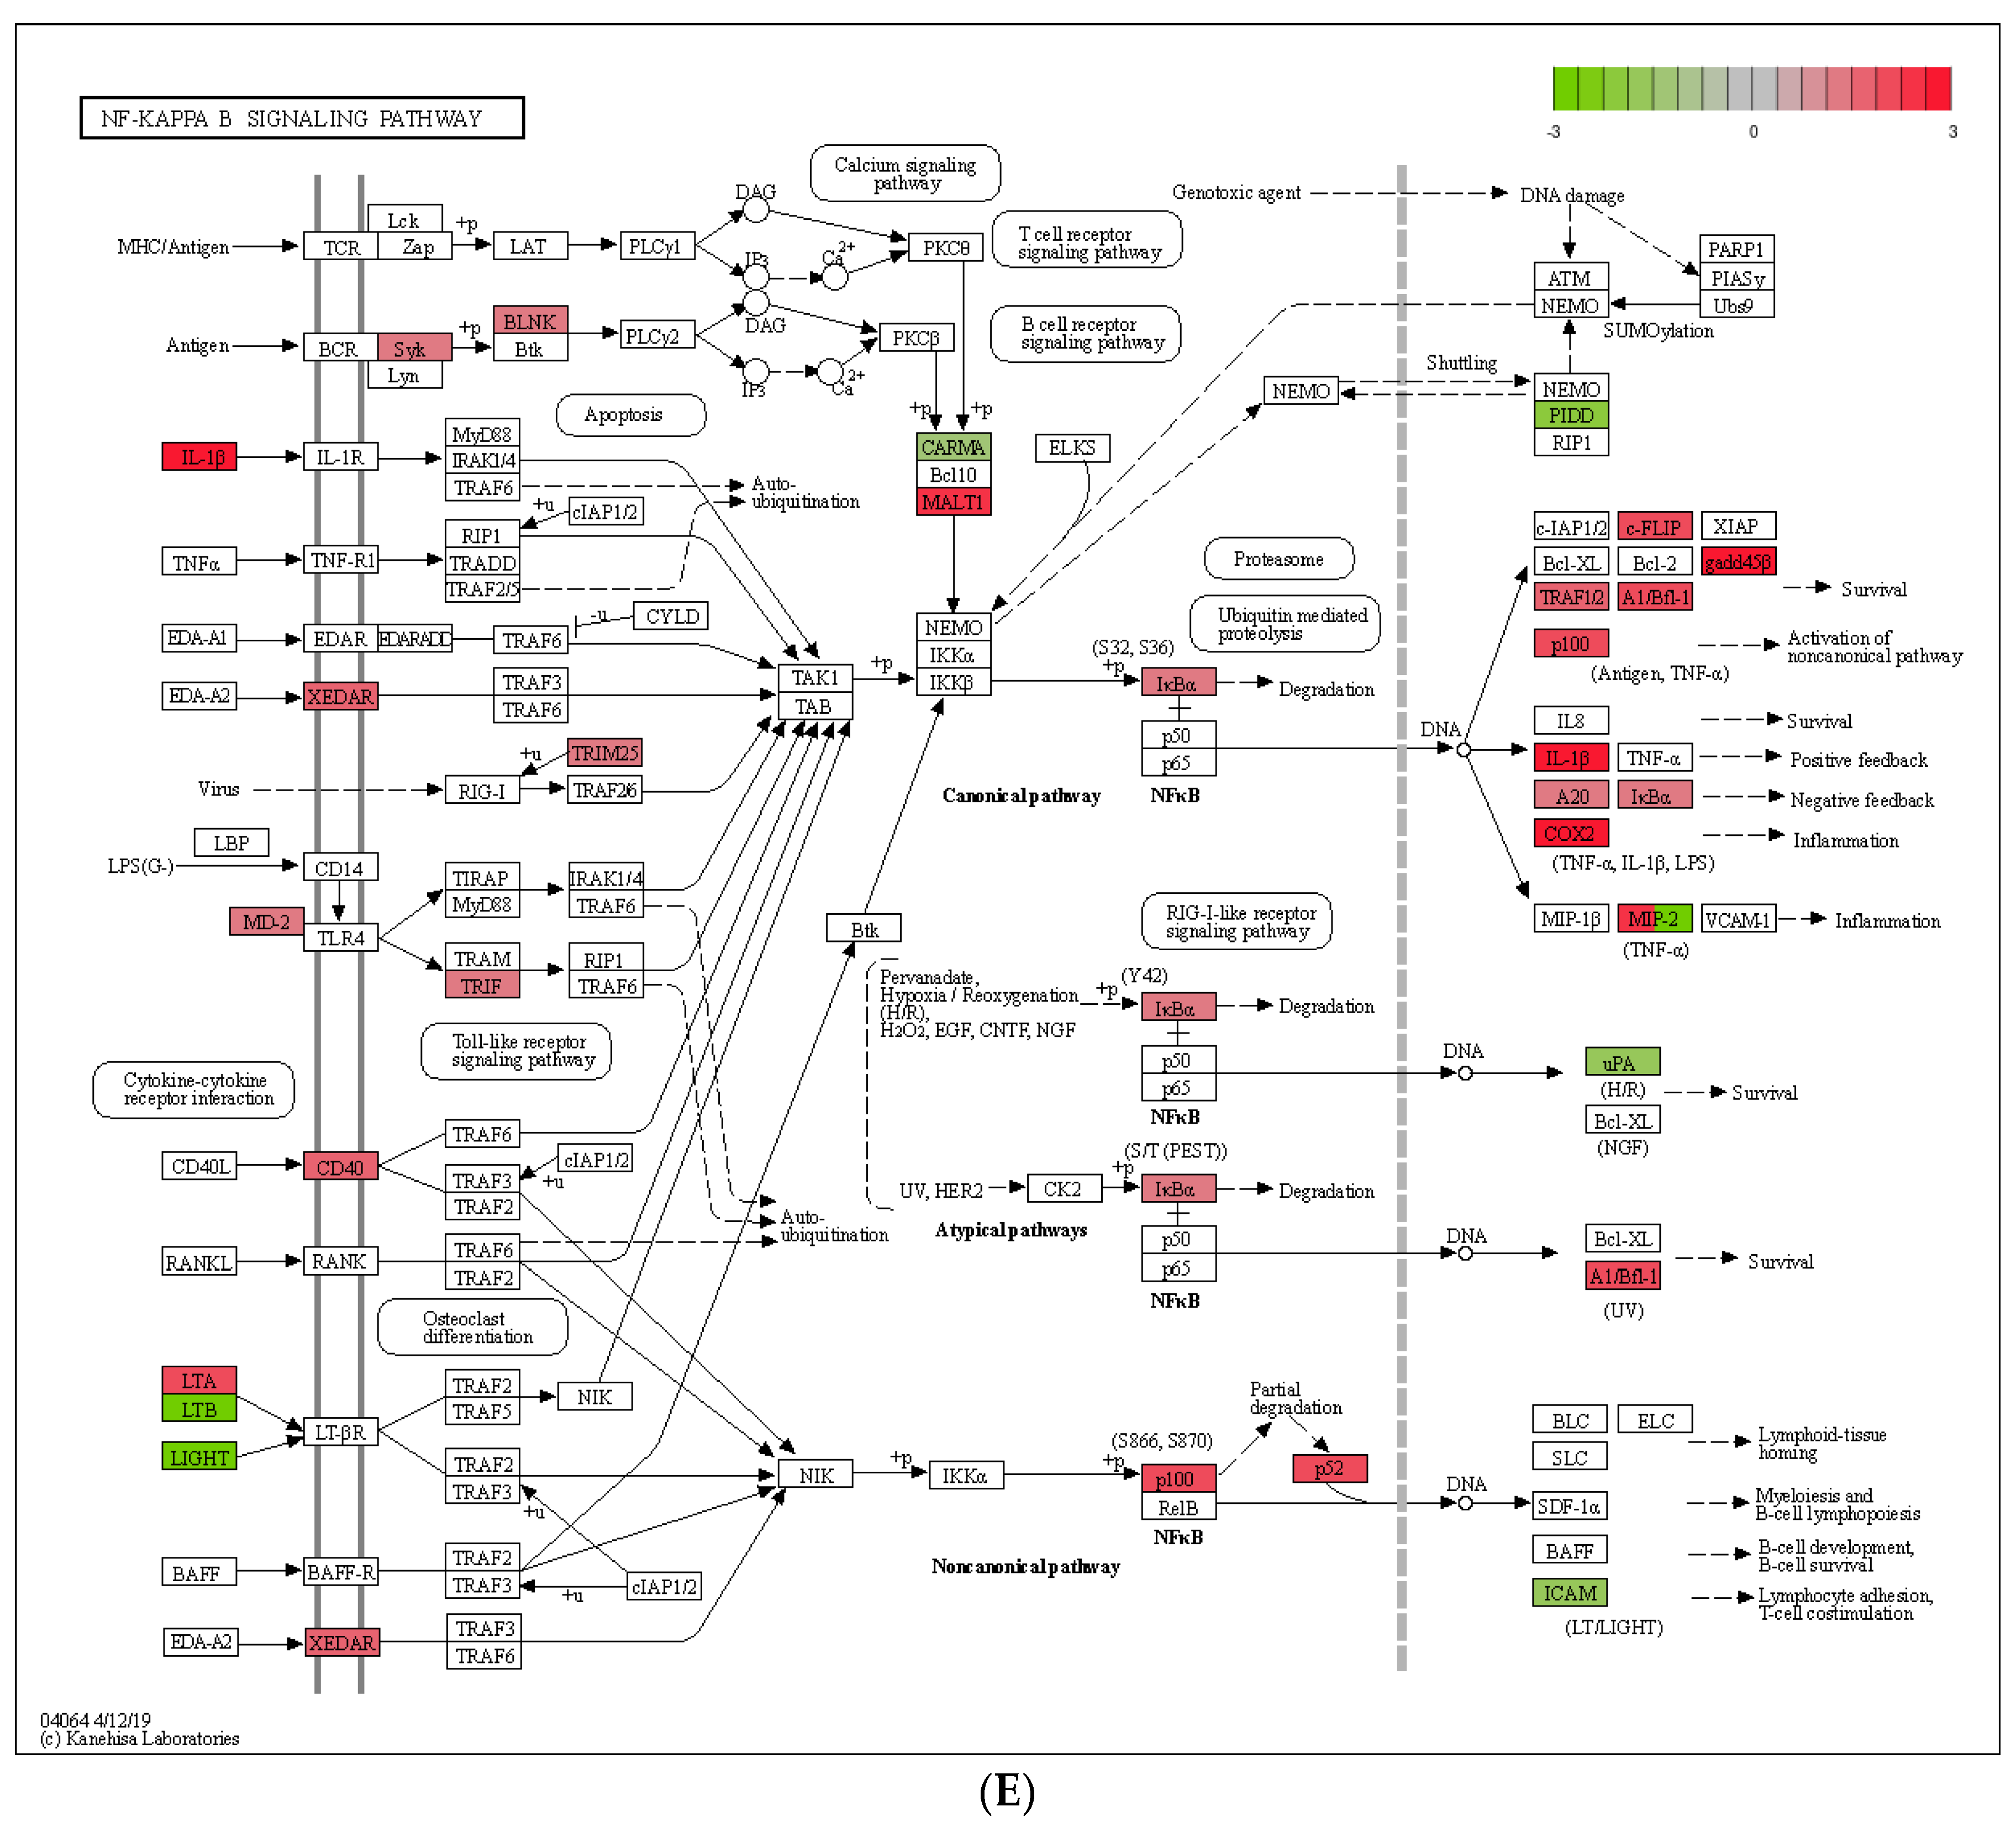
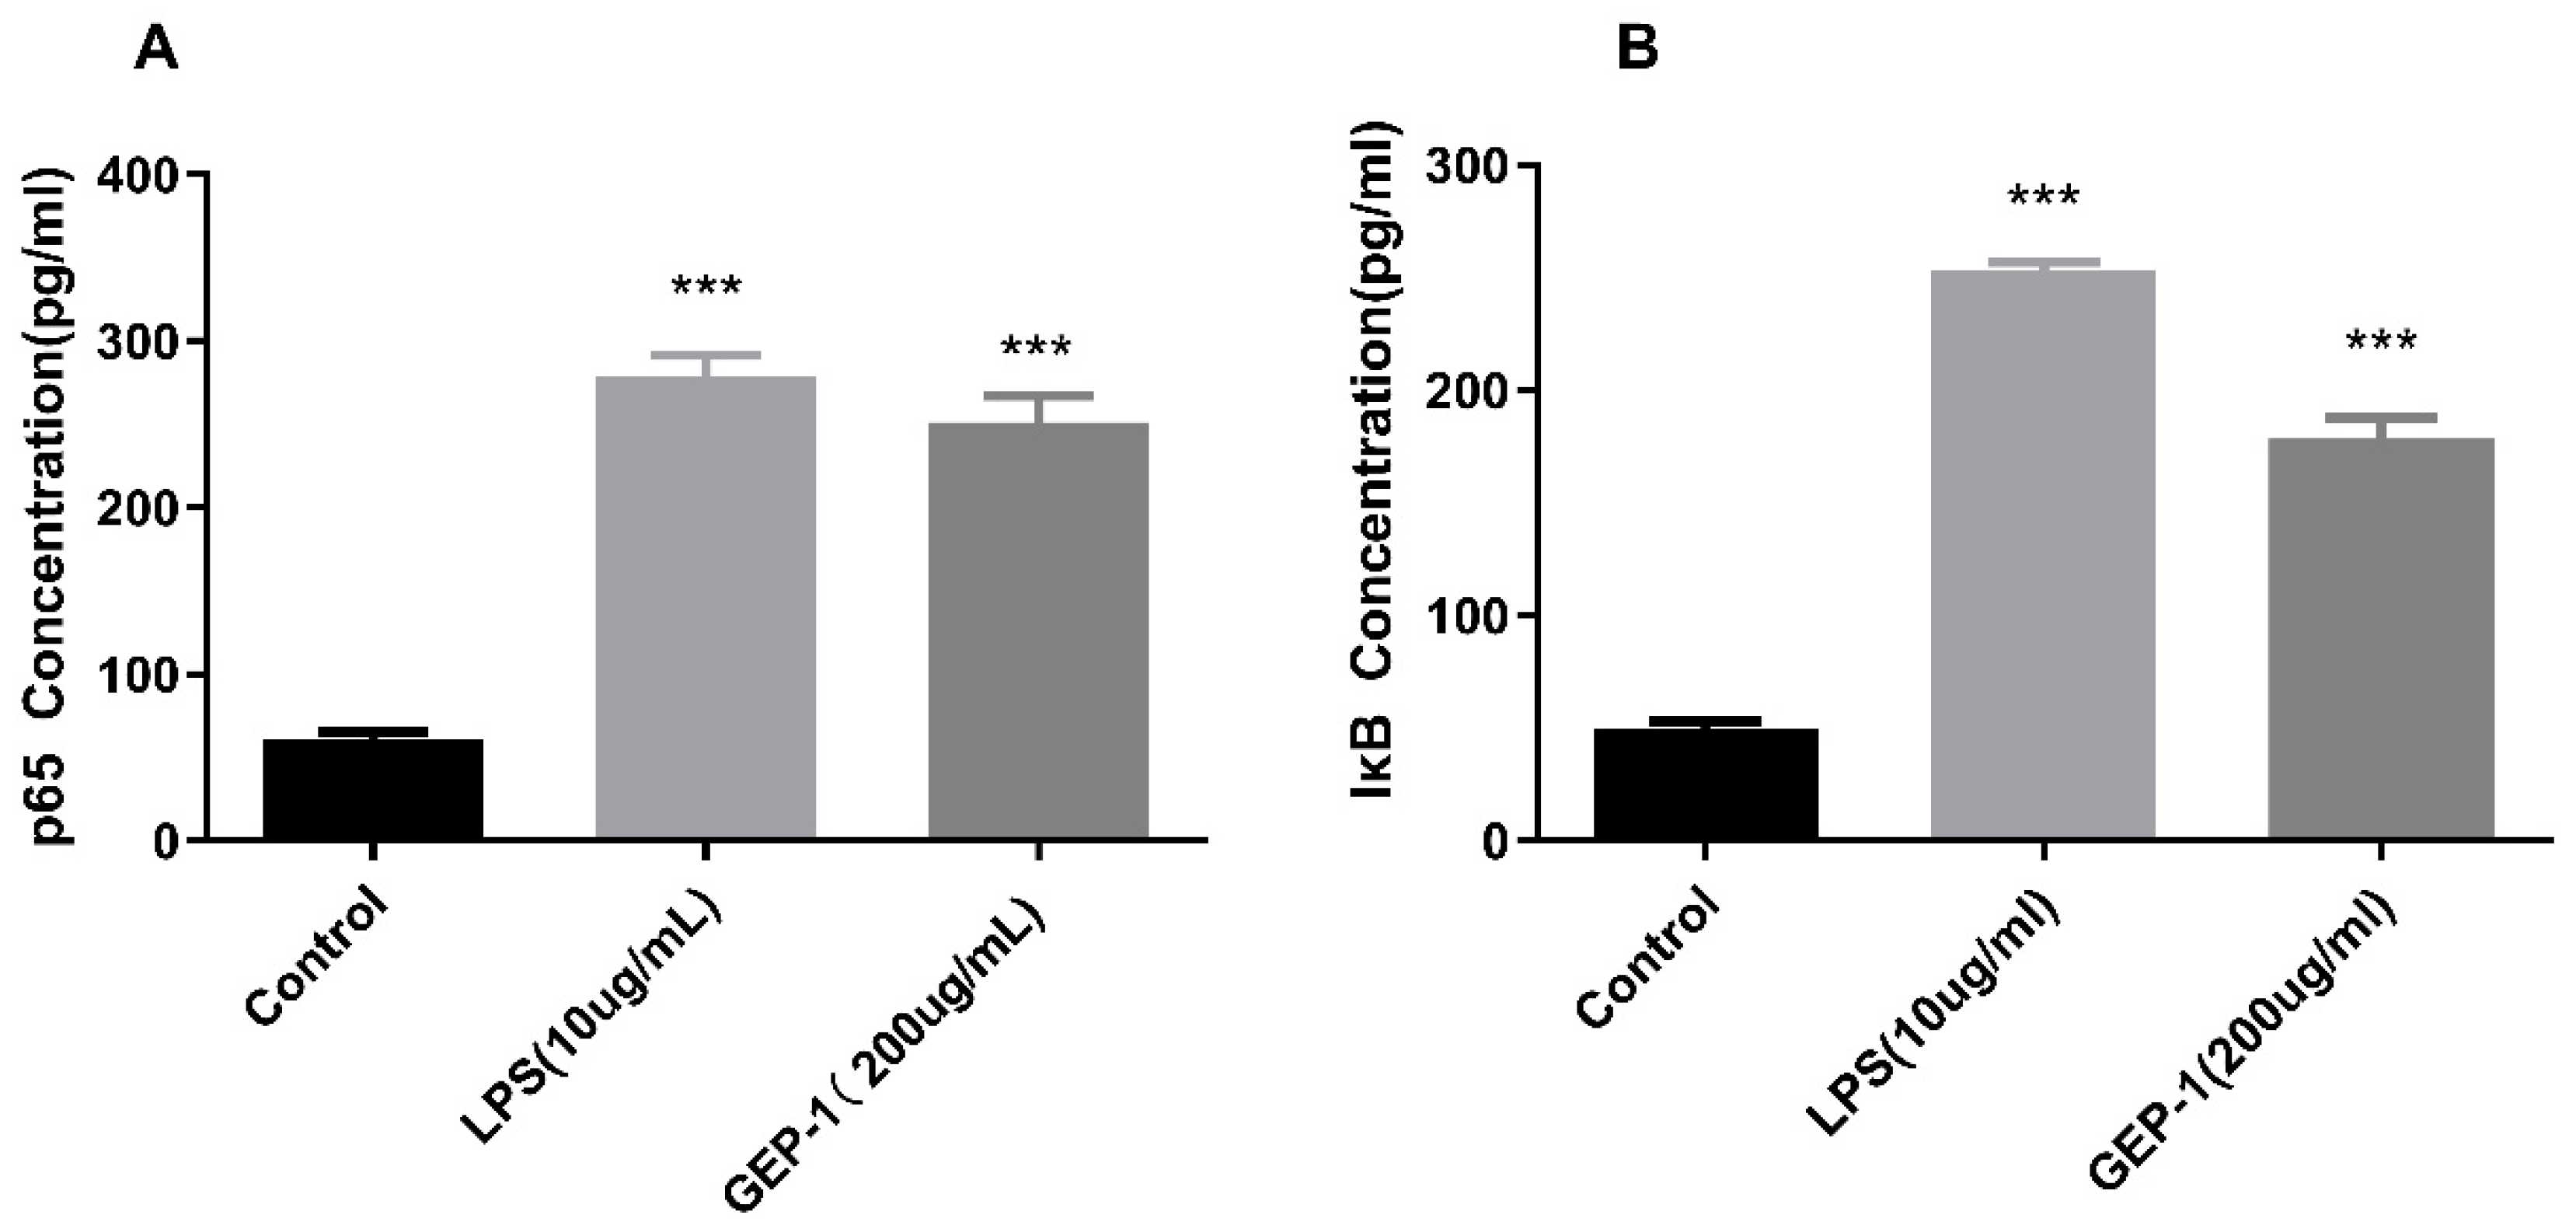
2.10.1. NF-κB Assay
2.10.2. NF-κB Pathway Inhibition Assay
3. Discussion
4. Materials and Method
4.1. Materials and Reagents
4.2. Extraction and Purification of Polysaccharide from G. elata
4.3. Structure Characterization
4.3.1. Determination of Molecular Weight
4.3.2. Determination of Monosaccharide Composition
4.3.3. Fourier Transform Infrared Spectroscopy (FT-IR)
4.3.4. Methylation Analysis
4.3.5. NMR Analysis
4.3.6. Differential Scanning Calorimetry (DSC) Analysis
4.4. Immunomodulatory Activity
4.4.1. Cell Culture
4.4.2. Cell Proliferation Assay
4.4.3. Phagocytic Activity Assay
4.4.4. Assay of Cytokine Secretion
4.4.5. Assay of NO Production
4.4.6. RT-qPCR Assay of Cytokine and NO
- IL-1β: F: GACCTGGGCTGTCCTGATG
- R: GAGTGATACTGCCTGCCTGAA
- TNFα: F: TCTCATTCCTGCTTGTGG
- R: ACTTGGTGGTTTGCTACG
- iNOS: F: CTCGGGTTGAAGTGGTATGC
- R: CCTCCAGGATGTTGTAGCG
4.4.7. RNA-Sequence Assay
4.4.8. Pathway Assay
4.4.9. Pathway Inhibition Assay
4.5. Statistical Analysis
Author Contributions
Funding
Institutional Review Board Statement
Informed Consent Statement
Data Availability Statement
Acknowledgments
Conflicts of Interest
Sample Availability
References
- Zhan, H.-D.; Zhou, H.-Y.; Sui, Y.-P.; Du, X.-L.; Wang, W.-H.; Dai, L.; Sui, F.; Huo, H.-R.; Jiang, T.-L. The rhizome of Gastrodia elata Blume—An ethnopharmacological review. J. Ethnopharmacol. 2016, 189, 361–385. [Google Scholar] [CrossRef]
- Wu, C.-R.; Hsieh, M.-T.; Huang, S.-C.; Peng, W.-H.; Chang, Y.-S.; Chen, C.-F. Effects of Gastrodia elata and its active constituents on scopolamine-induced amnesia in rats. Planta Med. 1996, 62, 317–321. [Google Scholar] [CrossRef] [PubMed]
- Shin, E.J.; Bach, J.H.; Nguyen, T.T.; Jung, B.D.; Oh, K.W.; Kim, M.J.; Jang, C.G.; Ali, S.F.; Ko, S.K.; Yang, C.H.; et al. Gastrodia elata Bl Attenuates Cocaine-Induced Conditioned Place Preference and Convulsion, but not Behavioral Sensitization in Mice: Importance of GABA(A) Receptors. Curr. Neuropharmacol. 2011, 9, 26–29. [Google Scholar] [CrossRef] [PubMed]
- Liu, J.; Mori, A. Antioxidant and free radical scavenging activities of Gastrodia elata Bl. and Uncaria rhynchophylla (Miq.) Jacks. Neuropharmacology 1992, 31, 1287–1298. [Google Scholar] [CrossRef]
- Wang, Z.; Li, Y.; Liu, D.; Mu, Y.; Dong, H.; Zhou, H.; Guo, L.; Wang, X. Four new phenolic constituents from the rhizomes of Gastrodia elata Blume. Nat. Prod. Res. 2019, 33, 1140–1146. [Google Scholar] [CrossRef] [PubMed]
- Liu, Z.-K.; Ng, C.-F.; Shiu, H.-T.; Wong, H.-L.; Chin, W.-C.; Zhang, J.-F.; Lam, P.-K.; Poon, W.-S.; Lau, C.B.-S.; Leung, P.-C.; et al. Neuroprotective effect of Da Chuanxiong Formula against cognitive and motor deficits in a rat controlled cortical impact model of traumatic brain injury. J. Ethnopharmacol. 2018, 217, 11–22. [Google Scholar] [CrossRef]
- Shi, L. Bioactivities, isolation and purification methods of polysaccharides from natural products: A review. Int. J. Biol. Macromol. 2016, 92, 37–48. [Google Scholar] [CrossRef]
- Tang, C.; Sun, J.; Liu, J.; Jin, C.; Wu, X.; Zhang, X.; Chen, H.; Gou, Y.; Kan, J.; Qian, C.; et al. Immune-enhancing effects of polysaccharides from purple sweet potato. Int. J. Biol. Macromol. 2019, 123, 923–930. [Google Scholar] [CrossRef] [PubMed]
- Yao, Y.; Zhu, Y.; Ren, G. Immunoregulatory activities of polysaccharides from mung bean. Carbohydr. Polym. 2016, 139, 61–66. [Google Scholar] [CrossRef] [PubMed]
- Dong, C.; Hayashi, K.; Mizukoshi, Y.; Lee, J.; Hayashi, T. Structures of acidic polysaccharides from Basella rubra L. and their antiviral effects. Carbohydr. Polym. 2011, 84, 1084–1092. [Google Scholar] [CrossRef]
- Lee, J.; Takeshita, A.; Hayashi, K.; Hayashi, T. Structures and antiviral activities of polysaccharides from Sargassum trichophyllum. Carbohydr. Polym. 2011, 86, 995–999. [Google Scholar] [CrossRef]
- Zhang, L.; Hu, Y.; Duan, X.; Tang, T.; Shen, Y.; Hu, B.; Liu, A.; Chen, H.; Li, C.; Liu, Y. Characterization and antioxidant activities of polysaccharides from thirteen boletus mushrooms. Int. J. Biol. Macromol. 2018, 113, 1–7. [Google Scholar] [CrossRef] [PubMed]
- Fan, J.; Feng, H.; Yu, Y.; Sun, M.; Liu, Y.; Li, T.; Sun, X.; Liu, S.; Sun, M. Antioxidant activities of the polysaccharides of Chuanminshen violaceum. Carbohydr. Polym. 2017, 157, 629–636. [Google Scholar] [CrossRef] [PubMed]
- Yu, M.; Ji, Y.; Qi, Z.; Cui, D.; Xin, G.; Wang, B.; Cao, Y.; Wang, D. Anti-tumor activity of sulfated polysaccharides from Sargassum fusiforme. Saudi Pharm. J. 2017, 25, 464–468. [Google Scholar] [CrossRef] [PubMed]
- Ming, J.; Liu, J.; Wu, S.; Guo, X.; Chen, Z.; Zhao, G. Structural Characterization and Hypolipidemic Activity of a Polysaccharide PGEB-3H from the Fruiting Bodies of Gastrodia elata Blume. Procedia Eng. 2012, 37, 169–173, ISSN 1877-7058. [Google Scholar] [CrossRef]
- Chen, X.; Cao, D.; Zhou, L.; Jin, H.; Dong, Q.; Yao, J.; Ding, K. Structure of a polysaccharide from Gastrodia elata Bl., and oligosaccharides prepared thereof with anti-pancreatic cancer cell growth activities. Carbohydr. Polym. 2011, 86, 1300–1305, ISSN 0144-8617. [Google Scholar] [CrossRef]
- Huo, J.; Lei, M.; Zhou, Y.; Zhong, X.; Liu, Y.; Hou, J.; Long, H.; Zhang, Z.; Tian, M.; Xie, C.; et al. Structural characterization of two novel polysaccharides from Gastrodia elata and their effects on Akkermansia muciniphila. Int. J. Biol. Macromol. 2021, 186, 501–509. [Google Scholar] [CrossRef]
- Gordon, S. The role of the macrophage in immune regulation. Res. Immunol. 1998, 149, 685–688. [Google Scholar] [CrossRef]
- Su, J.Q.; Liu, X.B.; Zhang, X.Y.; Chu, X.L. Research progress on immune regulation of plant polysaccharides. Hubei Agric. Sci. 2018, 57, 10–13. [Google Scholar]
- Han, B.; Baruah, K.; Cox, E.; Vanrompay, D.; Bossier, P. Structure-Functional Activity Relationship of Glucans from the Perspective of Immunomodulation: A Mini-Review. Front. Immunol. 2020, 11, 658. [Google Scholar] [CrossRef]
- Tao, J.H. Effects of polysaccharides from non-medicinal parts of chrysanthemum on inflammatory bowel disease. J. Nanjing Univ. Tradit. Chin. Med. 2017, 33, 1–174. [Google Scholar]
- Flórez-Fernández, N.; Torres, M.D.; González-Muñoz, M.J.; Domínguez, H. Potential of intensification techniques for the extraction and depolymerization of fucoidan. Algal Res. 2018, 30, 128–148. [Google Scholar] [CrossRef]
- Mukhopadhyay, S.; Plüddemann, A.; Gordon, S. Macrophage Pattern Recognition Receptors in Immunity, Homeostasis and Self Tolerance. In Target Pattern Recognition in Innate Immunity. Advances in Experimental Medicine and Biology; Kishore, U., Ed.; Springer: New York, NY, USA, 2019; Volume 653. [Google Scholar] [CrossRef]
- Wang, Y.; Shen, X.; Yin, K.; Miao, C.; Sun, Y.; Mao, S.; Liu, D.; Sheng, J. Structural characteristics and immune-enhancing activity of fractionated polysaccharides from Athyrium multidentatum (Doll.) Ching. Int. J. Biol. Macromol. 2022, 205, 76–89. [Google Scholar] [CrossRef] [PubMed]
- Wu, Y.; Liu, J.; Hao, H.; Hu, L.; Zhang, X.; Luo, L.; Zeng, J.; Zhang, W.; Wong, I.N. Riming Huang, A new polysaccharide from Caulerpa chemnitzia induces molecular shifts of immunomodulation on macrophages RAW264.7. Food Chem. X 2022, 14, 100313. [Google Scholar] [CrossRef]
- Wyatt, P.J. Light scattering and the absolute characterization of macromolecules. Anal. Chim. Acta 1993, 272, 1–40. [Google Scholar] [CrossRef]
- Yao, H.; Wang, J.; Yin, J.; Nie, S.; Xie, M. A review of NMR analysis in polysaccharide structure and conformation: Progress, challenge and perspective. Food Res. Int. 2021, 143, 110290. [Google Scholar] [CrossRef] [PubMed]
- Shi, X.; Li, O.; Yin, J.; Nie, S. Structure identification of α-glucans from Dictyophora echinovolvata by methylation and 1D/2D NMR spectroscopy. Food Chem. 2019, 271, 338–344. [Google Scholar] [CrossRef] [PubMed]
- Gaudet, P.; Logie, C.; Lovering, R.C.; Kuiper, M.; Lægreid, A.; Thomas, P.D. Gene Ontology representation for transcription factor functions. Biochim. Biophys. Acta (BBA)-Gene Regul. Mech. 2021, 1864, 194752. [Google Scholar] [CrossRef]
- Sofi, M.Y.; Shafi, A.; Masoodi, K.Z. Chapter 17—KEGG database. In Bioinformatics for Everyone; Elsevier: Amsterdam, The Netherlands, 2021. [Google Scholar] [CrossRef]
- Apostolova, E.; Lukova, P.; Baldzhieva, A.; Katsarov, P.; Nikolova, M.; Iliev, I.; Peychev, L.; Trica, B.; Oancea, F.; Delattre, C.; et al. Immunomodulatory and Anti-Inflammatory Effects of Fucoidan: A Review. Polymers 2020, 12, 2338. [Google Scholar] [CrossRef]
- Wu, N.; Wen, Z.-S.; Xiang, X.-W.; Huang, Y.-N.; Gao, Y.; Qu, Y.-L. Immunostimulative Activity of Low Molecular Weight Chitosans in RAW264.7 Macrophages. Mar. Drugs 2015, 13, 6210–6225. [Google Scholar] [CrossRef]
- Yuan, Q.; Xie, F.; Tan, J.; Yuan, Y.; Mei, H.; Zheng, Y.; Sheng, R. Extraction, structure and pharmacological effects of the polysaccharides from Cordyceps sinensis: A review. J. Funct. Foods 2022, 89, 104909. [Google Scholar] [CrossRef]
- Brade, H.; Brade, L.; Rietschel, E.T. Structure-activity relationships of Bacterial lipopolysaccharides (Endotoxins): Current and future aspects. Zent. Bakteriol. Mikrobiol. Hyg. A Med. Microbiol. Infect. Dis. Virol. Parasitol. 1988, 268, 151–179. [Google Scholar] [CrossRef]
- Sweeney, R.P.; Lowary, T.L. New insights into lipopolysaccharide assembly and export. Curr. Opin. Chem. Biol. 2019, 53, 37–43. [Google Scholar] [CrossRef] [PubMed]
- Xu, Z.; Lin, R.; Hou, X.; Wu, J.; Zhao, W.; Ma, H.; Fan, Z.; Li, S.; Zhu, Y.; Zhang, D. Immunomodulatory mechanism of a purified polysaccharide isolated from Isaria cicadae Miquel on RAW264.7 cells via activating TLR4-MAPK-NF-κB signaling pathway. Int. J. Biol. Macromol. 2020, 164, 4329–4338. [Google Scholar] [CrossRef] [PubMed]
- Li, K.; Qiu, H.; Yan, J.; Shen, X.; Wei, X.; Duan, M.; Yang, J. The involvement of TNF-α and TNF-β as proinflammatory cytokines in lymphocyte-mediated adaptive immunity of Nile tilapia by initiating apoptosis. Dev. Comp. Immunol. 2020, 115, 103884. [Google Scholar] [CrossRef]
- Shen, C.-Y.; Zhang, W.-L.; Jiang, J.-G. Immune-enhancing activity of polysaccharides from Hibiscus sabdariffa Linn. via MAPK and NF-kB signaling pathways in RAW264.7 cells. J. Funct. Foods 2017, 34, 118–129. [Google Scholar] [CrossRef]
- Wen, Y.; Bi, S.; Hu, X.; Yang, J.; Li, C.; Li, H.; Yu, D.B.; Zhu, J.; Song, L.; Yu, R. Structural characterization and immunomodulatory mechanisms of two novel glucans from Morchella importuna fruiting bodies. Int. J. Biol. Macromol. 2021, 183, 145–157. [Google Scholar] [CrossRef]
- Capece, D.; Verzella, D.; Flati, I.; Arboretto, P.; Cornice, J.; Franzoso, G. NF-κB: Blending metabolism, immunity, and inflammation. Trends Immunol. 2022, 43, 757–775, ISSN 1471-4906. [Google Scholar] [CrossRef]
- Rong, L.; Li, G.; Zhang, Y.; Xiao, Y.; Qiao, Y.; Yang, M.; Wei, L.; Bi, H.; Gao, T. Structure and immunomodulatory activity of a water-soluble α-glucan from Hirsutella sinensis mycelia. Int. J. Biol. Macromol. 2021, 189, 857–868, ISSN 0141-8130. [Google Scholar] [CrossRef]
- Li, S.; Yang, Z.; Tian, H.; Ren, S.; Zhang, W.; Wang, A. Effects of dietary carbohydrate/lipid ratios on non-specific immune responses, antioxidant capacity, hepatopancreas and intestines histology, and expression of TLR-MAPK/NF-κB signaling pathway-related genes of Procambarus clarkii. Fish Shellfish Immunol. 2022, 124, 219–229, ISSN 1050-4648. [Google Scholar] [CrossRef]
- Kramer, I.M. Chapter 13—Activation of the Innate Immune System: The Toll-Like Receptor-4 and Signaling through Ubiquitinylation. In Signal Transduction, 3rd ed.; Academic Press: Boston, MA, USA, 2016; pp. 741–775. ISBN 9780123948038. [Google Scholar] [CrossRef]
- Chen, Y.; Zhou, R.; He, L.; Wang, F.; Yang, X.; Teng, L.; Li, C.; Liao, S.; Zhu, Y.; Yang, Y.; et al. Okra polysaccharide-2 plays a vital role on the activation of RAW264.7 cells by TLR2/4-mediated signal transduction pathways. Int. Immunopharmacol. 2020, 86, 106708. [Google Scholar] [CrossRef] [PubMed]
- Jiang, S.; Yin, H.; Li, R.; Shi, W.; Mou, J.; Yang, J. The activation effects of fucoidan from sea cucumber Stichopus chloronotus on RAW264.7 cells via TLR2/4-NF-κB pathway and its structure-activity relationship. Carbohydr. Polym. 2021, 270, 118353. [Google Scholar] [CrossRef]
- Kim, H.S.; Kim, Y.J.; Lee, H.K.; Ryu, H.S.; Kim, J.S.; Yoon, M.J.; Kang, J.S.; Hong, J.T.; Kim, Y.; Han, S.-B. Activation of macrophages by polysaccharide isolated from Paecilomyces cicadae through toll-like receptor 4. Food Chem. Toxicol. 2012, 50, 3190–3197. [Google Scholar] [CrossRef] [PubMed]
- Zhang, M.; Yan, M.; Yang, J.; Li, F.; Wang, Y.; Feng, K.; Wang, S.; Lin, N.; Wang, Y.; Yang, B. Structural characterization of a polysaccharide from Trametes sanguinea Lloyd with immune-enhancing activity via activation of TLR4. Int. J. Biol. Macromol. 2022, 206, 1026–1038, ISSN 0141-8130. [Google Scholar] [CrossRef] [PubMed]
- Zheng, Z.; Huang, Q.; Ling, C. Water-soluble yeast β-glucan fractions with different molecular weights: Extraction and separation by acidolysis assisted-size exclusion chromatography and their association with proliferative activity. Int. J. Biol. Macromol. 2018, 123, 269–279. [Google Scholar] [CrossRef]
- Wang, L.; Zhang, B.; Xiao, J.; Huang, Q.; Li, C.; Fu, X. Physicochemical, functional, and biological properties of water-soluble polysaccharides from Rosa roxburghii Tratt fruit. Food Chem. 2018, 249, 127–135. [Google Scholar] [CrossRef]
- Han, Y.; Wu, Y.; Li, G.; Li, M.; Yan, R.; Xu, Z.; Lei, H.; Sun, Y.; Duan, X.; Hu, L.; et al. Structural characterization and transcript-metabolite correlation network of immunostimulatory effects of sulfated polysaccharides from green alga Ulva pertusa. Food Chem. 2020, 342, 128537. [Google Scholar] [CrossRef]
- Wang, X.; Tian, J.; Zhang, X.; Tang, N.; Rui, X.; Zhang, Q.; Dong, M.; Li, W. Characterization and Immunological Activity of Exopolysaccharide from Lacticaseibacillus paracasei GL1 Isolated from Tibetan Kefir Grains. Foods 2022, 11, 3330. [Google Scholar] [CrossRef]
- Bustin, S.A.; Mueller, R. Real-time reverse transcription PCR and the detection of occult disease in colorectal cancer. Mol. Asp. Med. 2006, 27, 192–223, ISSN 0098-2997. [Google Scholar] [CrossRef]


| Sample | Monosaccharide | Molar Ratio (%) |
|---|---|---|
| GEP-1 | Ara | 2.189 |
| Gal | 4.791 | |
| Glc | 92.035 | |
| Man | 0.342 |
| Sample | Linkage | Methylated Sugars | Molecular Weight (MW) | Molar Ratio (%) |
|---|---|---|---|---|
| t-Ara(f) | 1,4-di-O-acetyl-2,3,5-tri-O-methyl arabinitol | 279 | 0.603 | |
| t-Glc(p) | 1,5-di-O-acetyl-2,3,4,6-tetra-O-methyl glucitol | 323 | 7.587 | |
| 4-Gal(p) | 1,4,5-tri-O-acetyl-2,3,6-tri-O-methyl galactitol | 351 | 0.719 | |
| GEP-1 | 4-Glc(p) | 1,4,5-tri-O-acetyl-2,3,6-tri-O-methyl glucitol | 351 | 82.659 |
| 3,4-Glc(p) | 1,3,4,5-tetra-O-acetyl-2,6-di-O-methyl glucitol | 379 | 0.520 | |
| 2,4-Gal(p) | 1,2,4,5-tetra-O-acetyl-3,6-di-O-methyl galactitol | 379 | 0.435 | |
| 4,6-Glc(p) | 1,4,5,6-tetra-O-acetyl-2,3-di-O-methyl glucitol | 379 | 6.034 | |
| 3,6-Gal(p) | 1,3,5,6-tetra-O-acetyl-2,4-di-O-methyl galactitol | 379 | 1.444 |
| Code | Residues | Chemical Shifts (ppm) | |||||
|---|---|---|---|---|---|---|---|
| H1/C1 | H2/C2 | H3/C3 | H4/C4 | H5/C5 | H6/C6 | ||
| A | ⟶4)-α-Glcp-(1⟶ |
5.33 99.62 |
3.58 71.91 |
3.73 73.69 |
3.61 77.51 |
3.90 71.66 |
3.80 60.97 |
| B | ⟶4,6)-α-Glcp-(1⟶ |
5.28 99.75 |
3.55 71.84 |
3.67 73.61 |
3.81 77.34 |
3.63 71.92 |
3.37 69.88 |
| C | t-Glcp→ |
4.91 99.47 |
3.53 72.71 |
3.66 72.92 |
3.32 70.24 |
3.91 72.37 |
3.78 60.83 |
Publisher’s Note: MDPI stays neutral with regard to jurisdictional claims in published maps and institutional affiliations. |
© 2022 by the authors. Licensee MDPI, Basel, Switzerland. This article is an open access article distributed under the terms and conditions of the Creative Commons Attribution (CC BY) license (https://creativecommons.org/licenses/by/4.0/).
Share and Cite
Guan, H.; Ling, X.; Xu, J.; Zhu, Y.; Zhang, J.; Liu, X. Structural Characterization of Polysaccharide Derived from Gastrodia elata and Its Immunostimulatory Effect on RAW264.7 Cells. Molecules 2022, 27, 8059. https://doi.org/10.3390/molecules27228059
Guan H, Ling X, Xu J, Zhu Y, Zhang J, Liu X. Structural Characterization of Polysaccharide Derived from Gastrodia elata and Its Immunostimulatory Effect on RAW264.7 Cells. Molecules. 2022; 27(22):8059. https://doi.org/10.3390/molecules27228059
Chicago/Turabian StyleGuan, Hao, Xi Ling, Juan Xu, Yongquan Zhu, Jiayan Zhang, and Xiangyi Liu. 2022. "Structural Characterization of Polysaccharide Derived from Gastrodia elata and Its Immunostimulatory Effect on RAW264.7 Cells" Molecules 27, no. 22: 8059. https://doi.org/10.3390/molecules27228059
APA StyleGuan, H., Ling, X., Xu, J., Zhu, Y., Zhang, J., & Liu, X. (2022). Structural Characterization of Polysaccharide Derived from Gastrodia elata and Its Immunostimulatory Effect on RAW264.7 Cells. Molecules, 27(22), 8059. https://doi.org/10.3390/molecules27228059