
Phenolic Compounds Recovery from Blood Orange Peels Using a Novel Green Infrared Technology Ired-Irrad®, and Their Effect on the Inhibition of Aspergillus flavus Proliferation and Aflatoxin B1 Production


 ,
,  ,
,  ,
,  ,
,  and
and 
Abstract
1. Introduction
2. Results and Discussion
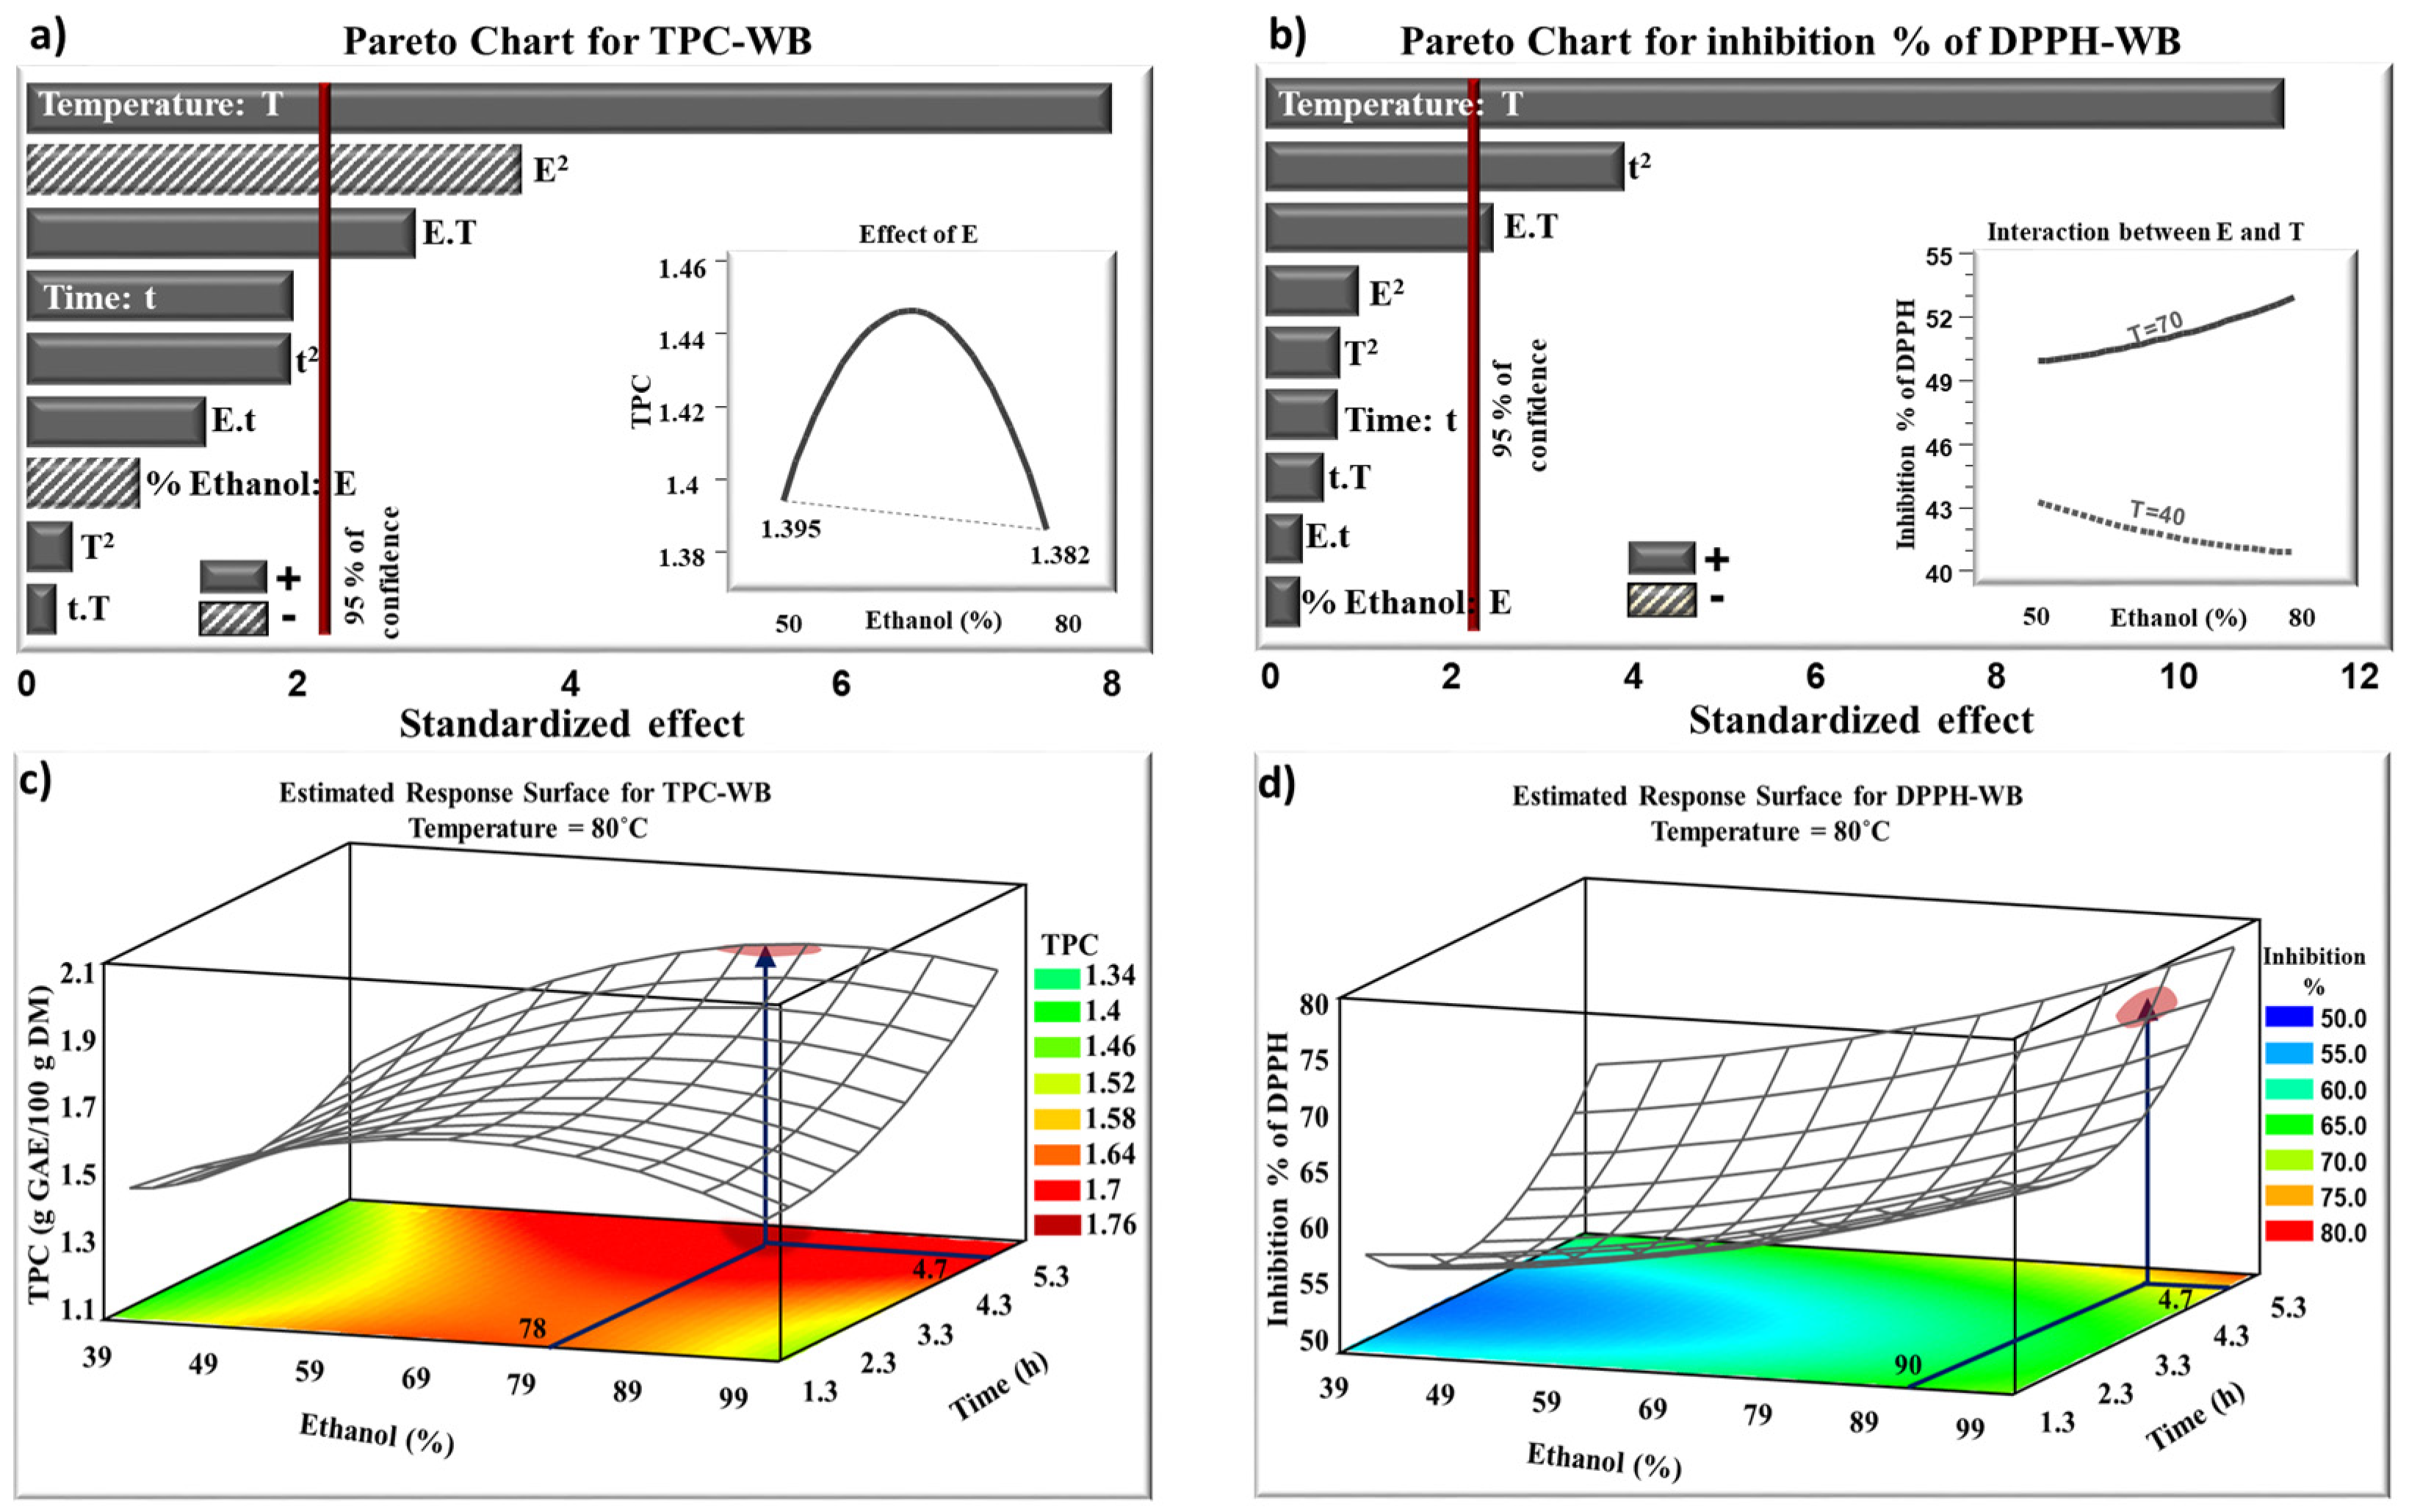
2.1. Water Bath Extraction
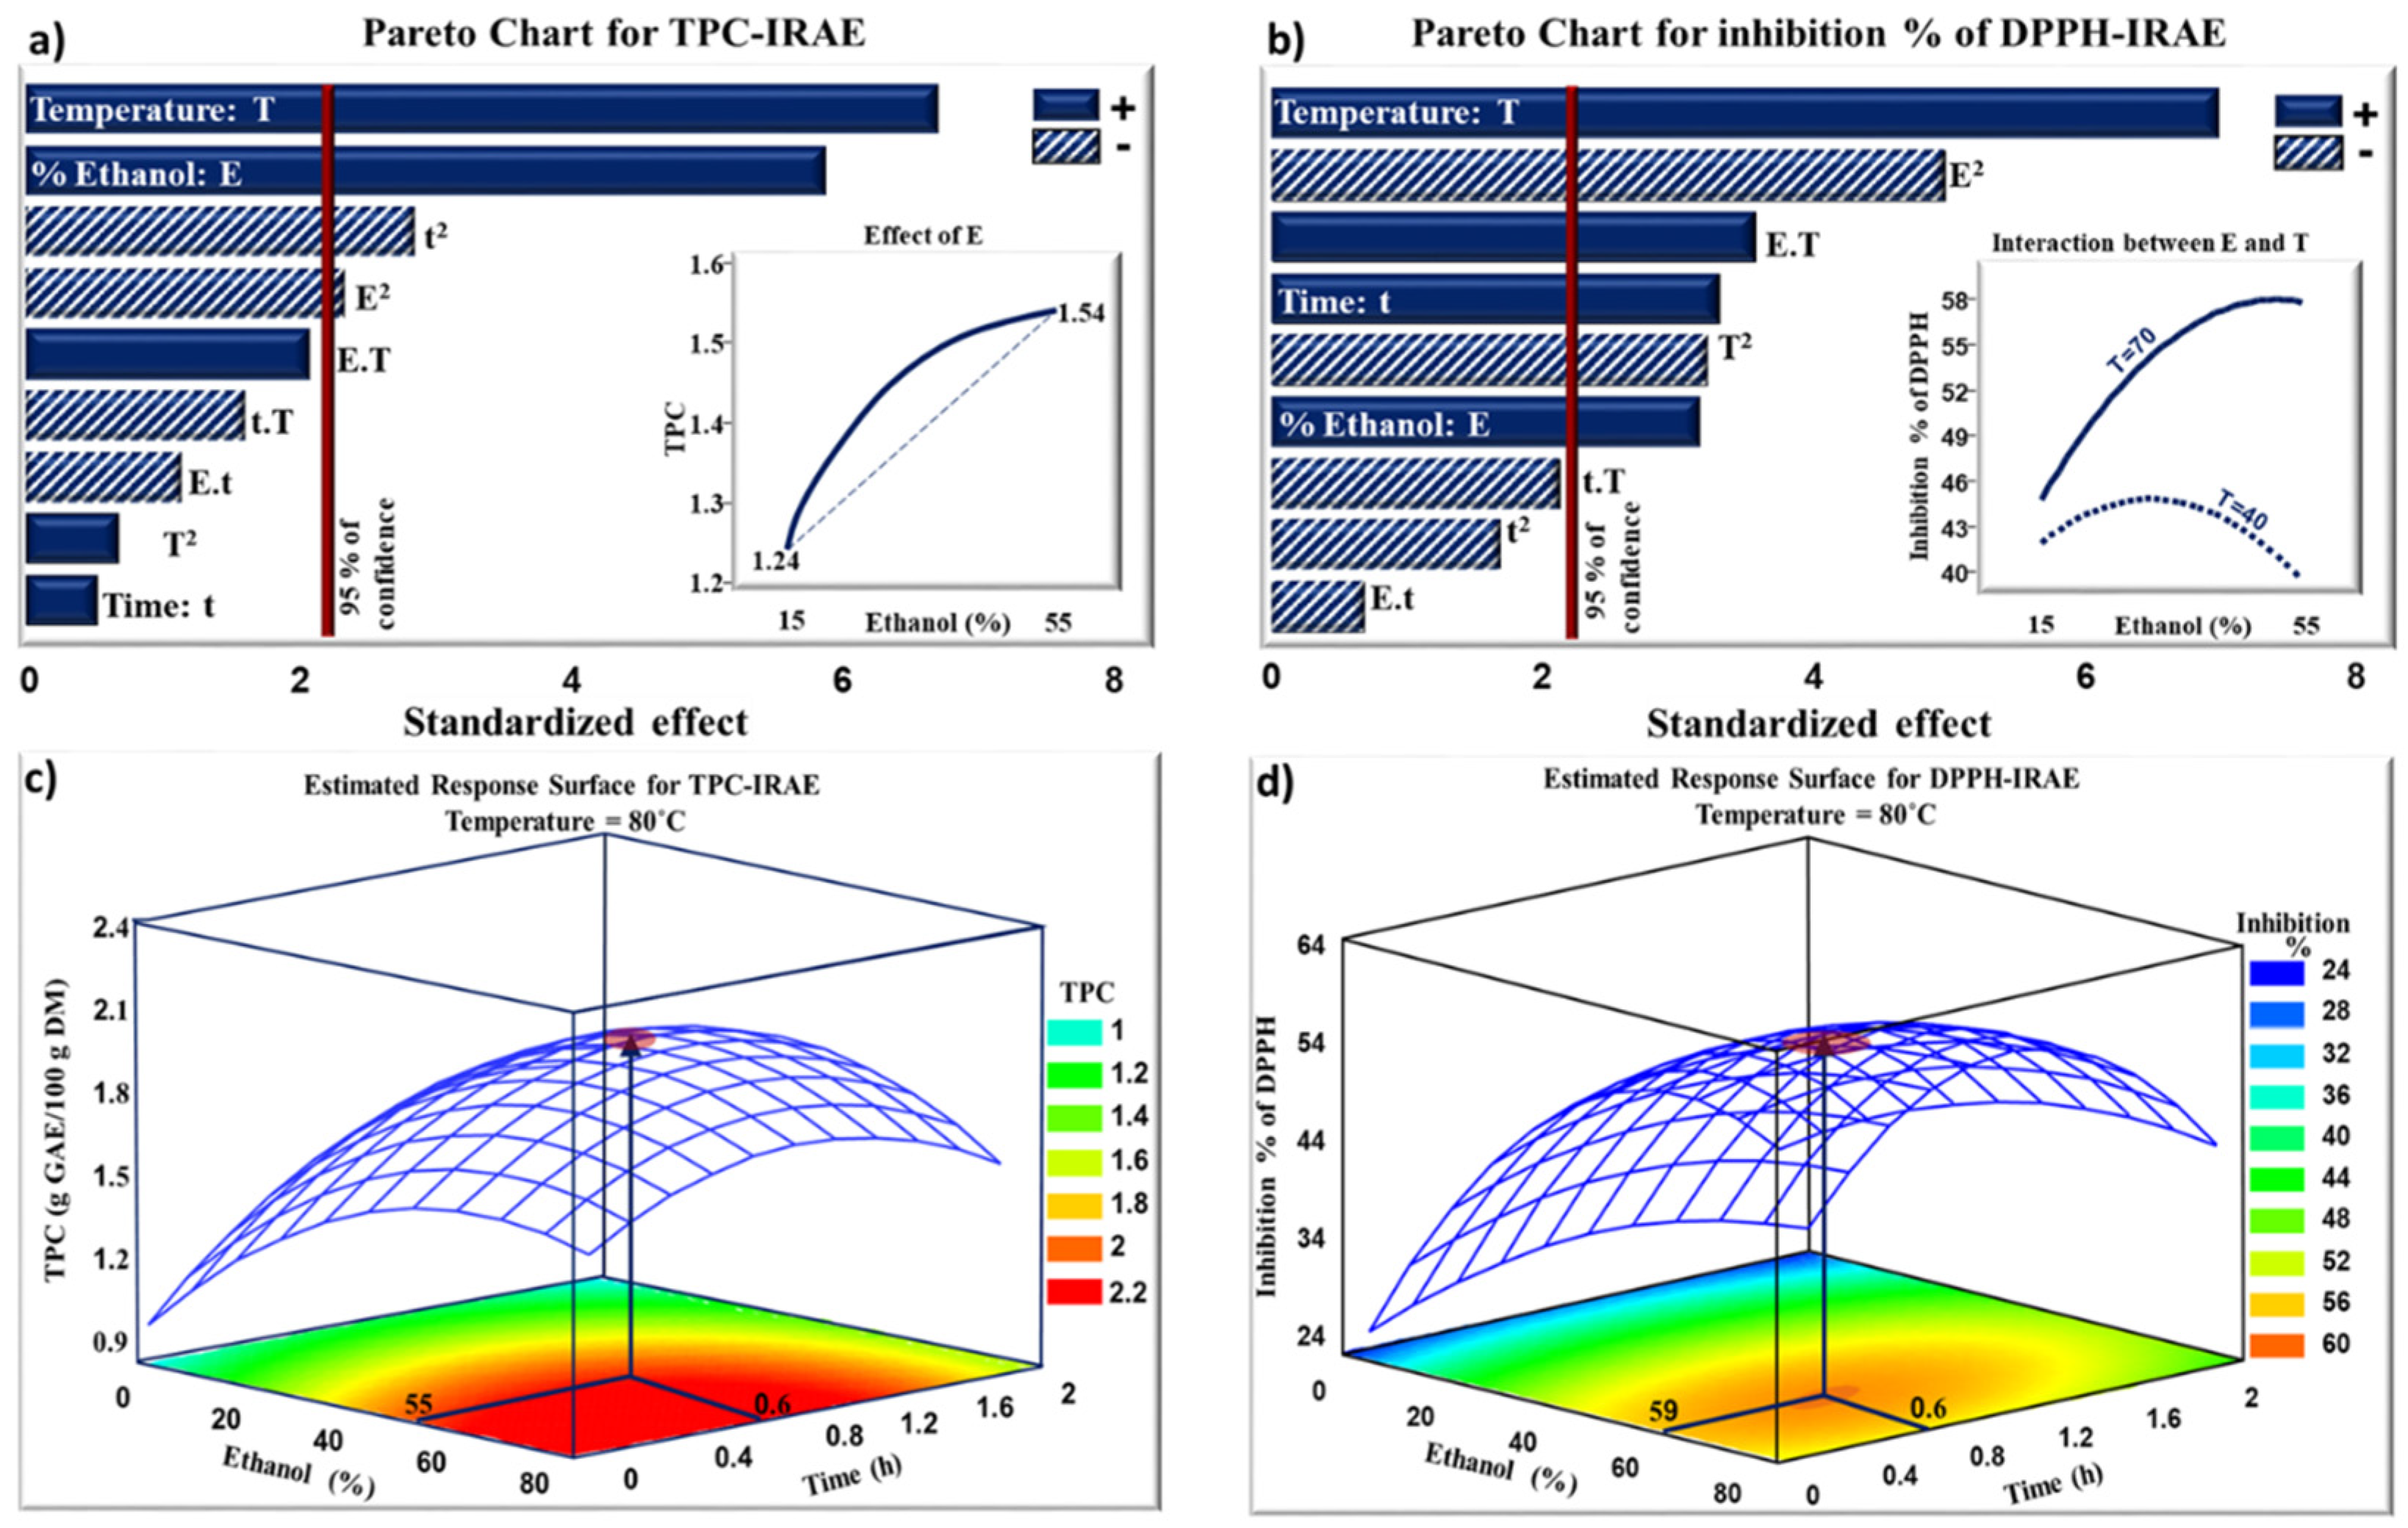
2.2. Infrared-Assisted Extraction
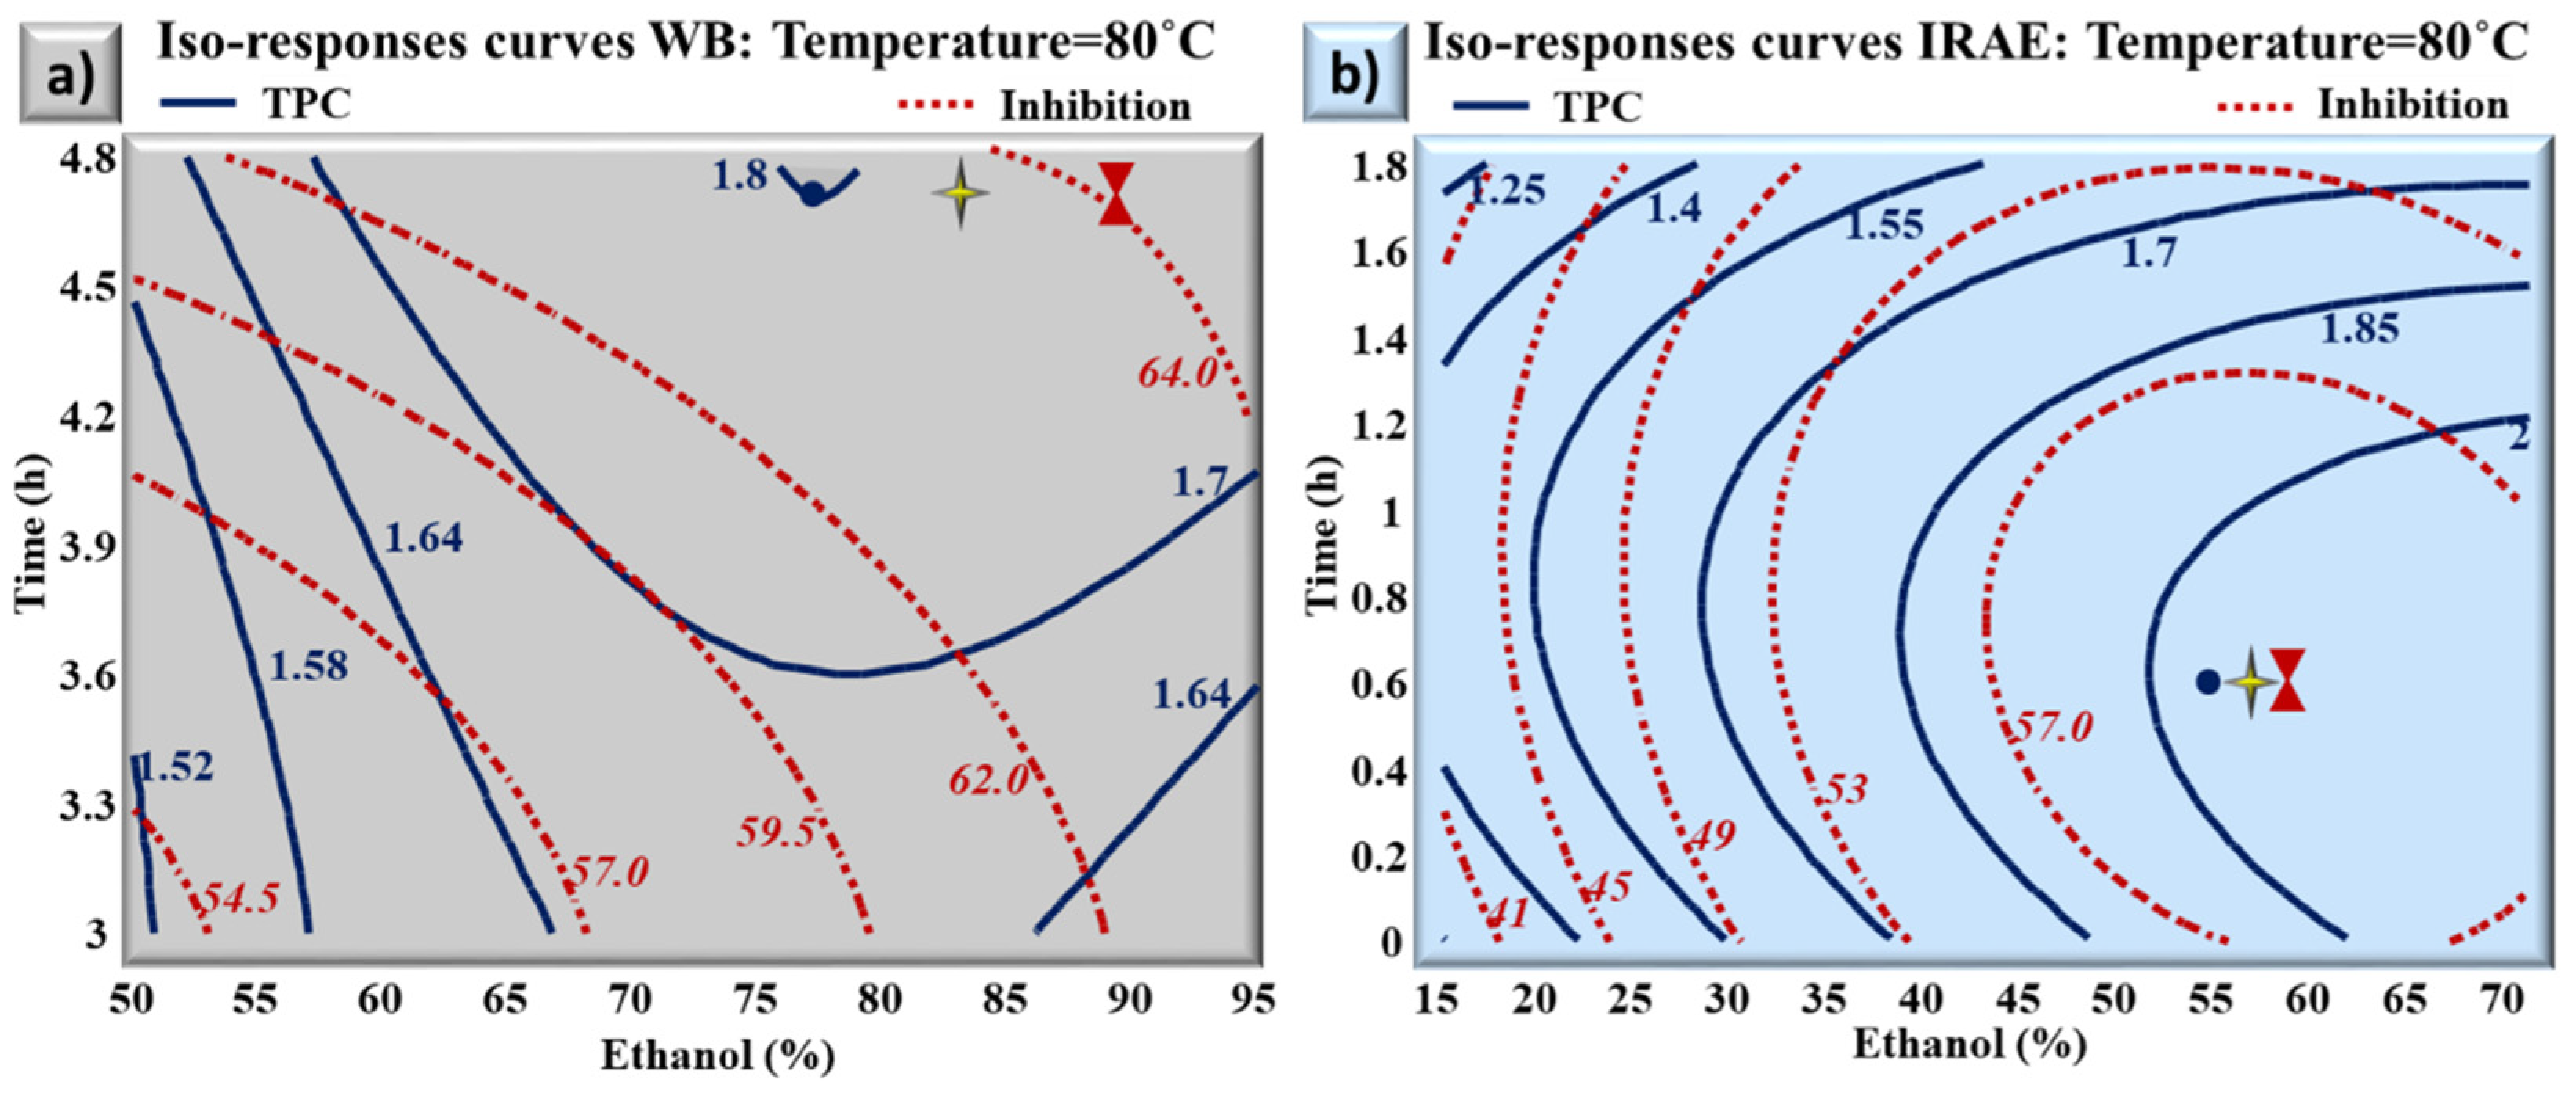
2.3. Multiple Response Optimization: Comparison between the Optimums Obtained with Water Bath Extraction and Infrared-Assisted Extraction
2.4. Concentrations and Diversity of Phenolic Compounds Extracted from Orange Peels
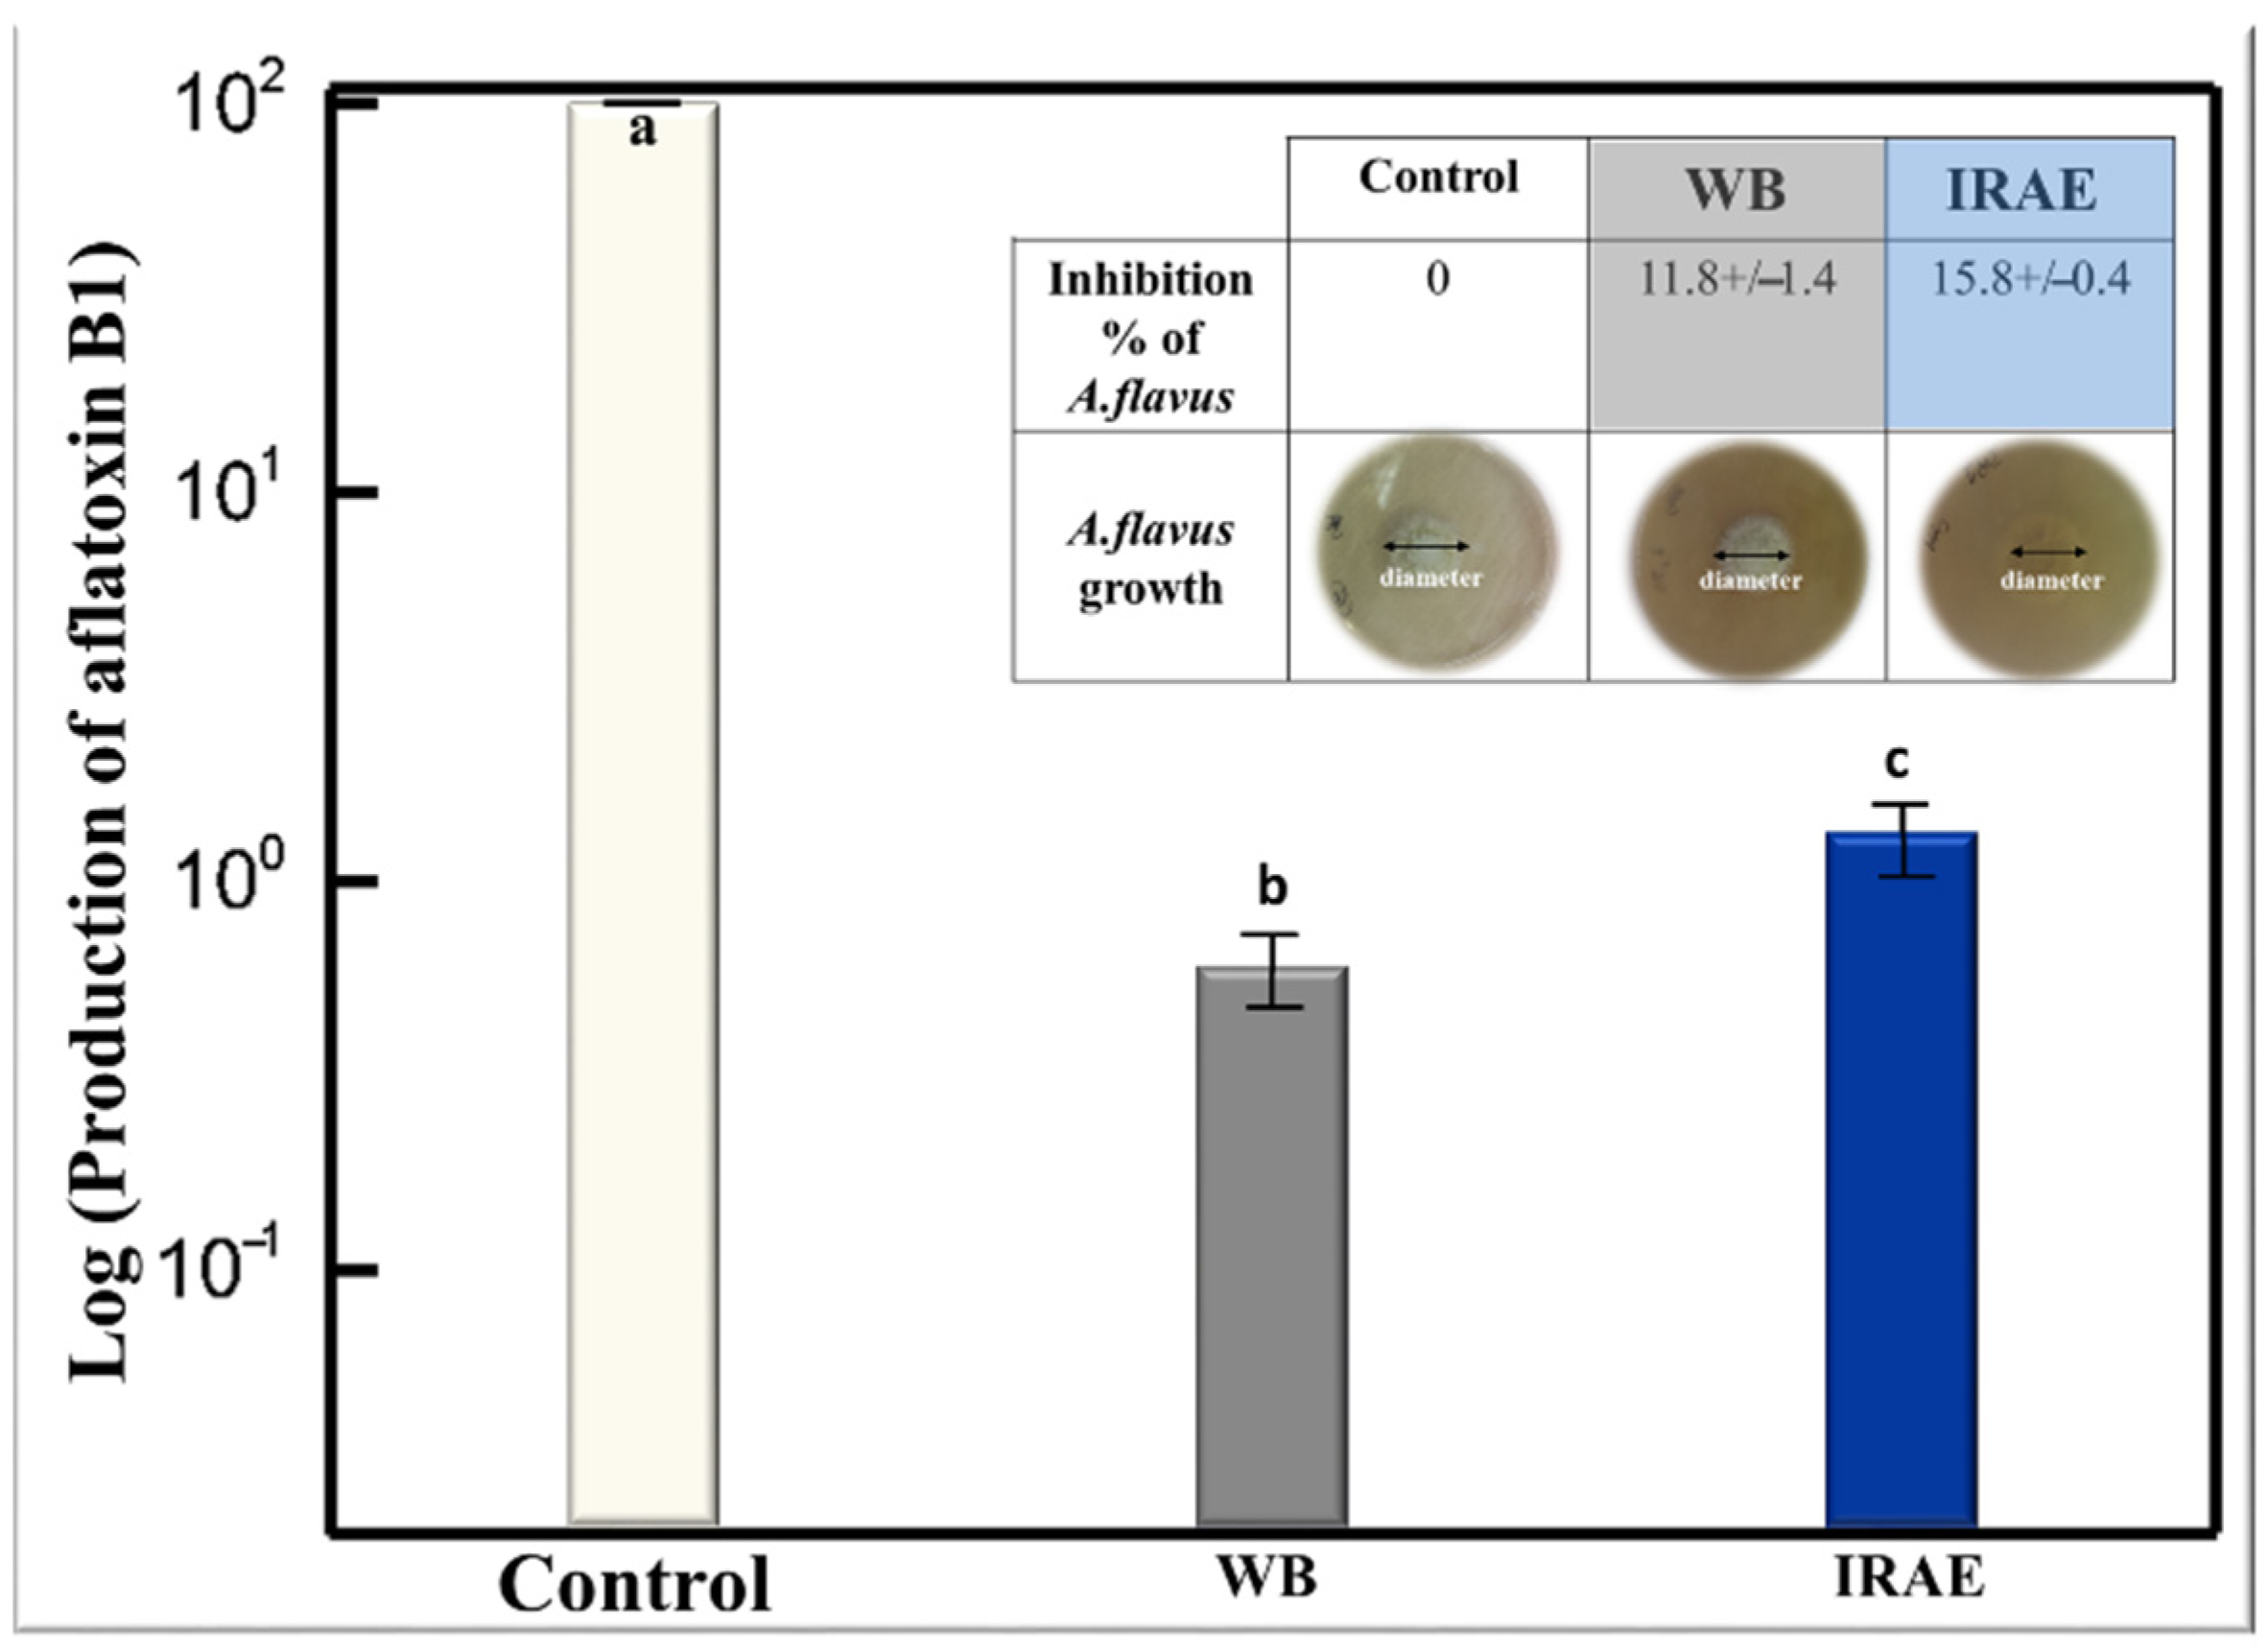
2.5. Antifungal Activity
3. Materials and Methods
3.1. Raw Material
3.2. Extraction Techniques
3.2.1. Water Bath Extraction
3.2.2. Infrared-Assisted Extraction
3.3. Experimental Designs
3.4. Analysis
3.4.1. Total Phenolic Compounds (TPC)
3.4.2. Antiradical Activity
3.4.3. High Performance Liquid Chromatography Analyses
3.4.4. Antifungal Activity
3.4.5. AFB1 Extraction and HPLC Analysis
3.4.6. Statistical Analysis
4. Conclusions
5. Patent
Author Contributions
Funding
Institutional Review Board Statement
Informed Consent Statement
Data Availability Statement
Conflicts of Interest
Sample Availability
References
- Ahmad, S.; Zeb, A.; Ayaz, M.; Murkovic, M. Characterization of phenolic compounds using UPLC–HRMS and HPLC–DAD and anti-cholinesterase and anti-oxidant activities of Trifolium repens L. leaves. Eur. Food Res. Technol. 2019, 246, 485–496. [Google Scholar] [CrossRef]
- Chacar, S.; Itani, T.; Hajal, J.; Saliba, Y.; Louka, N.; Faivre, J.-F.; Maroun, R.; Fares, N. The Impact of Long-Term Intake of Phenolic Compounds-Rich Grape Pomace on Rat Gut Microbiota. J. Food Sci. 2017, 83, 246–251. [Google Scholar] [CrossRef] [PubMed]
- Rehman, Z.U. Citrus peel extract—A natural source of antioxidant. Food Chem. 2006, 99, 450–454. [Google Scholar] [CrossRef]
- Selvi, A.T.; Joseph, G.; Jayaprakasha, G. Inhibition of growth and aflatoxin production in Aspergillus flavus by Garcinia indica extract and its antioxidant activity. Food Microbiol. 2003, 20, 455–460. [Google Scholar] [CrossRef]
- Elaridi, J.; Bassil, M.; Kharma, J.A.; Daou, F.; Hassan, H.F. Analysis of Aflatoxin M1 in Breast Milk and Its Association with Nutritional and Socioeconomic Status of Lactating Mothers in Lebanon. J. Food Prot. 2017, 80, 1737–1741. [Google Scholar] [CrossRef] [PubMed]
- Elaridi, J.; Dimassi, H.; Hassan, H. Aflatoxin M1 and ochratoxin A in baby formulae marketed in Lebanon: Occurrence and safety evaluation. Food Control 2019, 106, 106680. [Google Scholar] [CrossRef]
- Gizachew, D.; Chang, C.-H.; Szonyi, B.; De La Torre, S.; Ting, W.-T.E. Aflatoxin B1 (AFB1) production by Aspergillus flavus and Aspergillus parasiticus on ground Nyjer seeds: The effect of water activity and temperature. Int. J. Food Microbiol. 2019, 296, 8–13. [Google Scholar] [CrossRef] [PubMed]
- Khoury, A.E.; Rizk, T.; Lteif, R.; Azouri, H.; Delia, M.-L.; Lebrihi, A. Fungal contamination and Aflatoxin B1 and Ochratoxin A in Lebanese wine–grapes and musts. Food Chem. Toxicol. 2008, 46, 2244–2250. [Google Scholar] [CrossRef]
- Bluma, R.; Amaiden, M.; Daghero, J.; Etcheverry, M. Control ofAspergillussectionFlavigrowth and aflatoxin accumulation by plant essential oils. J. Appl. Microbiol. 2008, 105, 203–214. [Google Scholar] [CrossRef]
- Sdiri, S.; Cuenca, J.; Navarro, P.; Salvador, A.; Bermejo, A. New triploids late-maturing mandarins as a rich source of antioxidant compounds. Eur. Food Res. Technol. 2009, 246, 225–237. [Google Scholar] [CrossRef]
- Guimarães, R.; Barros, L.; Barreira, J.C.; Sousa, M.J.; Carvalho, A.M.; Ferreira, I.C. Targeting excessive free radicals with peels and juices of citrus fruits: Grapefruit, lemon, lime and orange. Food Chem. Toxicol. 2010, 48, 99–106. [Google Scholar] [CrossRef] [PubMed]
- Maksoud, S.; Abdel-Massih, R.M.; Rajha, H.N.; Louka, N.; Chemat, F.; Barba, F.J.; Debs, E. Citrus aurantium L. Active Constituents, Biological Effects and Extraction Methods. An Updated Review. Molecules 2021, 26, 5832. [Google Scholar] [CrossRef] [PubMed]
- Londoño-Londoño, J.; de Lima, V.R.; Lara, O.; Gil, A.; Pasa, T.B.C.; Arango, G.J.; Pineda, J.R.R. Clean recovery of antioxidant flavonoids from citrus peel: Optimizing an aqueous ultrasound-assisted extraction method. Food Chem. 2010, 119, 81–87. [Google Scholar] [CrossRef]
- Li, B.B.; Smith, B.; Hossain, M.M. Extraction of phenolics from citrus peels II. Enzyme-assisted extraction method. Sep. Purif. Technol. 2006, 48, 189–196. [Google Scholar] [CrossRef]
- Nakajima, V.M.; Macedo, G.A.; Macedo, J.A. Citrus bioactive phenolics: Role in the obesity treatment. LWT 2014, 59, 1205–1212. [Google Scholar] [CrossRef]
- Lou, S.-N.; Lai, Y.-C.; Hsu, Y.-S.; Ho, C.-T. Phenolic content, antioxidant activity and effective compounds of kumquat extracted by different solvents. Food Chem. 2016, 197, 1–6. [Google Scholar] [CrossRef]
- Sharma, K.; Mahato, N.; Cho, M.H.; Lee, Y.R. Converting citrus wastes into value-added products: Economic and environmently friendly approaches. Nutrition 2016, 34, 29–46. [Google Scholar] [CrossRef]
- Maroun, R.G.; Rajha, H.N.; Vorobiev, E.; Louka, N. Emerging Technologies for the Recovery of Valuable Compounds From Grape Processing By-Products. In Handbook of Grape Processing By-Products Sustainable Solutions; Galanakis, C.M., Ed.; Academic Press (Elsevier): Amsterdam, the Netherlands, 2017. [Google Scholar] [CrossRef]
- Sillero, L.; Prado, R.; Labidi, J. Simultaneous microwave-ultrasound assisted extraction of bioactive compounds from bark. Chem. Eng. Process. Process Intensif. 2020, 156, 108100. [Google Scholar] [CrossRef]
- Vázquez, M.B.; Andreatta, A.; Martini, R.; Montoya, S.N.; Cabrera, J.; Comini, L. Optimization of pretreatment with microwaves prior the pressurized hot water extraction of anthraquinones from Heterophyllaea pustulata, using Doehlert experimental design. Chem. Eng. Process. Process Intensif. 2020, 155, 108055. [Google Scholar] [CrossRef]
- Miccio, M.; Pierri, R.; Cuccurullo, G.; Metallo, A.; Brachi, P. Process intensification of tomato residues drying by microwave heating: Experiments and simulation. Chem. Eng. Process. Process Intensif. 2020, 156, 108082. [Google Scholar] [CrossRef]
- Rezzoug, S.-A.; Louka, N. Thermomechanical process intensification for oil extraction from orange peels. Innov. Food Sci. Emerg. Technol. 2009, 10, 530–536. [Google Scholar] [CrossRef]
- Rezzoug, S.A.; Baghdadi, M.W.; Louka, N.; Boutekedjiret, C.; Allaf, K. Study of a new extraction process: Controlled instan-taneous decompression. Application to the extraction of essential oil from rosemary leaves. Flavour Fragr. J. 1998, 13, 251–258. [Google Scholar] [CrossRef]
- Díaz-Reinoso, B.; Moure, A.; Domínguez, H. Ethanol-modified supercritical co2 extraction of chestnut burs antioxidants. Chem. Eng. Process. Process Intensif. 2020, 156, 108092. [Google Scholar] [CrossRef]
- Fratianni, A.; Niro, S.; Messia, M.C.; Panfili, G.; Marra, F.; Cinquanta, L. Evaluation of carotenoids and furosine content in air dried carrots and parsnips pre-treated with pulsed electric field (PEF). Eur. Food Res. Technol. 2019, 245, 2529–2537. [Google Scholar] [CrossRef]
- EL Kantar, S.; Boussetta, N.; Lebovka, N.; Foucart, F.; Rajha, H.N.; Maroun, R.G.; Louka, N.; Vorobiev, E. Pulsed electric field treatment of citrus fruits: Improvement of juice and polyphenols extraction. Innov. Food Sci. Emerg. Technol. 2018, 46, 153–161. [Google Scholar] [CrossRef]
- Abi-Khattar, A.-M.; Rajha, H.N.; Abdel-Massih, R.M.; Habchi, R.; Maroun, R.G.; Debs, E.; Louka, N. “Intensification of Vaporization by Decompression to the Vacuum” (IVDV), a novel technology applied as a pretreatment to improve polyphenols extraction from olive leaves. Food Chem. 2020, 342, 128236. [Google Scholar] [CrossRef]
- Chemat, F.; Rombaut, N.; Meullemiestre, A.; Turk, M.; Perino, S.; Fabiano-Tixier, A.-S.; Abert-Vian, M. Review of Green Food Processing techniques. Preservation, transformation, and extraction. Innov. Food Sci. Emerg. Technol. 2017, 41, 357–377. [Google Scholar] [CrossRef]
- Qu, Y.; Li, C.; Zhang, C.; Zeng, R.; Fu, C. Optimization of infrared-assisted extraction of Bletilla striata polysaccharides based on response surface methodology and their antioxidant activities. Carbohydr. Polym. 2016, 148, 345–353. [Google Scholar] [CrossRef]
- El Kantar, S.; Rajha, H.N.; Maroun, R.G.; Louka, N. Intensification of polyphenols extraction from orange peels using infrared as a novel and energy saving pretreatment. J. Food Sci. 2020, 85, 414–420. [Google Scholar] [CrossRef]
- D’Alessandro, L.G.; Kriaa, K.; Nikov, I.; Dimitrov, K. Ultrasound assisted extraction of polyphenols from black chokeberry. Sep. Purif. Technol. 2012, 93, 42–47. [Google Scholar] [CrossRef]
- Garcia-Castello, E.M.; Rodriguez-Lopez, A.D.; Mayor, L.; Ballesteros, R.; Conidi, C.; Cassano, A. Optimization of conventional and ultrasound assisted extraction of flavonoids from grapefruit (Citrus paradisi L.) solid wastes. LWT 2015, 64, 1114–1122. [Google Scholar] [CrossRef]
- Waszkowiak, K.; Gliszczyńska-Świgło, A. Binary ethanol–water solvents affect phenolic profile and antioxidant capacity of flaxseed extracts. Eur. Food Res. Technol. 2015, 242, 777–786. [Google Scholar] [CrossRef]
- Librán, C.M.; Mayor, L.; Garcia-Castello, E.M.; Vidal-Brotons, D. Polyphenol extraction from grape wastes: Solvent and pH effect. Agric. Sci. 2013, 04, 56–62. [Google Scholar] [CrossRef]
- Hegazy, A.E.; Ibrahium, M.I. Antioxidant Activities of Orange Peel Extracts. World Appl. Sci. J. 2012, 18, 684–688. [Google Scholar] [CrossRef]
- Lagha-Benamrouche, S.; Madani, K. Phenolic contents and antioxidant activity of orange varieties (Citrus sinensis L. and Citrus aurantium L.) cultivated in Algeria: Peels and leaves. Ind. Crop. Prod. 2013, 50, 723–730. [Google Scholar] [CrossRef]
- Cai, Y.; Yu, Y.; Duan, G.; Li, Y. Study on infrared-assisted extraction coupled with high performance liquid chromatography (HPLC) for determination of catechin, epicatechin, and procyanidin B2 in grape seeds. Food Chem. 2011, 127, 1872–1877. [Google Scholar] [CrossRef]
- Rajha, H.N.; Chacar, S.; Afif, C.; Vorobiev, E.; Louka, N.; Maroun, R.G. β-Cyclodextrin-Assisted Extraction of Polyphenols from Vine Shoot Cultivars. J. Agric. Food Chem. 2015, 63, 3387–3393. [Google Scholar] [CrossRef]
- Rajha, H.N.; El Darra, N.; Vorobiev, E.; Louka, N.; Maroun, R.G. An Environment Friendly, Low-Cost Extraction Process of Phenolic Compounds from Grape Byproducts. Optimization by Multi-Response Surface Methodology. Food Nutr. Sci. 2013, 04, 650–659. [Google Scholar] [CrossRef]
- Rajha, H.N.; Abi-Khattar, A.-M.; El Kantar, S.; Boussetta, N.; Lebovka, N.; Maroun, R.G.; Louka, N.; Vorobiev, E. Comparison of aqueous extraction efficiency and biological activities of polyphenols from pomegranate peels assisted by infrared, ultrasound, pulsed electric fields and high-voltage electrical discharges. Innov. Food Sci. Emerg. Technol. 2019, 58, 102212. [Google Scholar] [CrossRef]
- Abi-Khattar, A.-M.; Rajha, H.N.; Abdel-Massih, R.M.; Maroun, R.G.; Louka, N.; Debs, E. Intensification of Polyphenol Extraction from Olive Leaves Using Ired-Irrad®, an Environmentally-Friendly Innovative Technology. Antioxidants 2019, 8, 227. [Google Scholar] [CrossRef]
- Chen, Y.; Duan, G.; Xie, M.; Chen, B.; Li, Y. Infrared-assisted extraction coupled with high-performance liquid chromatography for simultaneous determination of eight active compounds in Radix Salviae miltiorrhizae. J. Sep. Sci. 2010, 33, 2888–2897. [Google Scholar] [CrossRef] [PubMed]
- Wang, S.; Zhang, L.; Yang, P.; Chen, G. Infrared-assisted tryptic proteolysis for peptide mapping. PROTEOMICS 2008, 8, 2579–2582. [Google Scholar] [CrossRef]
- Chen, Q.; Liu, T.; Chen, G. Highly Efficient Proteolysis Accelerated by Electromagnetic Waves for Peptide Mapping. Curr. Genom. 2011, 12, 380–390. [Google Scholar] [CrossRef] [PubMed][Green Version]
- Iranshahi, M.; Rezaee, R.; Parhiz, H.; Roohbakhsh, A.; Soltani, F. Protective effects of flavonoids against microbes and toxins: The cases of hesperidin and hesperetin. Life Sci. 2015, 137, 125–132. [Google Scholar] [CrossRef] [PubMed]
- Caceres, I.; El Khoury, R.; Medina; Lippi, Y.; Naylies, C.; Atoui, A.; El Khoury, A.; Oswald, I.P.; Bailly, J.-D.; Puel, O. Deciphering the Anti-Aflatoxinogenic Properties of Eugenol Using a Large-Scale q-PCR Approach. Toxins 2016, 8, 123. [Google Scholar] [CrossRef]
- Holmes, R.A.; Boston, R.S.; Payne, G.A. Diverse inhibitors of aflatoxin biosynthesis. Appl. Microbiol. Biotechnol. 2008, 78, 559–572. [Google Scholar] [CrossRef]
- Mo, H.Z.; Zhang, H.; Wu, Q.H.; Bin Hu, L. Inhibitory effects of tea extract on aflatoxin production byAspergillus flavus. Lett. Appl. Microbiol. 2013, 56, 462–466. [Google Scholar] [CrossRef]
- Singleton, V.L.; Orthofer, R.; Lamuela-Raventós, R.M. Analysis of total phenols and other oxidation substrates and antioxidants by means of Folin-Ciocalteu reagent. In Methods in Enzymology; Academic Press: Cambridge, MA, USA, 1999; Volume 299, pp. 152–178. [Google Scholar]
- Brand-Williams, W.; Cuvelier, M.E.; Berset, C. Use of a free radical method to evaluate antioxidant activity. LWT Food Sci. Technol. 1995, 28, 25–30. [Google Scholar] [CrossRef]


| Run | Ethanol (%) Real [Coded] Value | Time (h) Real [Coded] Value | Temperature (°C) Real [Coded] Value | TPC (g GAE/100 g DM) | Inhibition % of DPPH | |
|---|---|---|---|---|---|---|
| Factorial Design | 1 | 50 [−1] | 2 [−1] | 40 [−1] | 1.36 | 46.04 |
| 2 | 80 [+1] | 2 [−1] | 40 [−1] | 1.20 | 42.45 | |
| 3 | 50 [−1] | 4 [+1] | 40 [−1] | 1.37 | 44.24 | |
| 4 | 80 [+1] | 4 [+1] | 40 [−1] | 1.33 | 43.50 | |
| 5 | 50 [−1] | 2 [−1] | 70 [+1] | 1.48 | 50.52 | |
| 6 | 80 [+1] | 2 [−1] | 70 [+1] | 1.55 | 55.01 | |
| 7 | 5 0 [−1] | 4 [+1] | 70 [+1] | 1.54 | 52.17 | |
| 8 | 80 [+1] | 4 [+1] | 70 [+1] | 1.67 | 55.75 | |
| Center Points | 9 | 65 [0] | 3 [0] | 55 [0] | 1.40 | 45.59 |
| 10 | 65 [0] | 3 [0] | 55 [0] | 1.38 | 44.69 | |
| 11 | 65 [0] | 3 [0] | 55 [0] | 1.50 | 46.49 | |
| 12 | 65 [0] | 3 [0] | 55 [0] | 1.46 | 46.93 | |
| 13 | 65 [0] | 3 [0] | 55 [0] | 1.44 | 45.29 | |
| 14 | 65 [0] | 3 [0] | 55 [0] | 1.47 | 49.77 | |
| Star Points | 15 | 39.8 [−α] | 3 [0] | 55 [0] | 1.33 | 48.88 |
| 16 | 90.2 [+α] | 3 [0] | 55 [0] | 1.24 | 48.06 | |
| 17 | 65 [0] | 1.3 [−α] | 55 [0] | 1.48 | 51.27 | |
| 18 | 65 [0] | 4.7 [+α] | 55 [0] | 1.50 | 53.29 | |
| 19 | 65 [0] | 3 [0] | 29.8 [−α] | 1.28 | 37.64 | |
| 20 | 65 [0] | 3 [0] | 80.2 [+α] | 1.58 | 58.74 |
| Run | Ethanol (%) Real [Coded] Value | Time (h) Real [Coded] Value | Temperature (°C) Real [Coded] Value | TPC (g GAE/100 g DM) | Inhibition % of DPPH | |
|---|---|---|---|---|---|---|
| Factorial Design | 1 | 15 [−1] | 0.5 [−1] | 40 [−1] | 0.95 | 34.75 |
| 2 | 55 [+1] | 0.5 [−1] | 40 [−1] | 1.22 | 36.06 | |
| 3 | 15 [−1] | 1.5 [+1] | 40 [−1] | 1.12 | 47.54 | |
| 4 | 55 [+1] | 1.5 [+1] | 40 [−1] | 1.30 | 42.95 | |
| 5 | 15 [−1] | 0.5 [−1] | 70 [+1] | 1.18 | 42.79 | |
| 6 | 55 [+1] | 0.5 [−1] | 70 [+1] | 1.79 | 54.10 | |
| 7 | 15 [−1] | 1.5 [+1] | 70 [+1] | 1.19 | 44.26 | |
| 8 | 55 [+1] | 1.5 [+1] | 70 [+1] | 1.60 | 56.39 | |
| Center Points | 9 | 35 [0] | 1 [0] | 55 [0] | 1.39 | 54.10 |
| 10 | 35 [0] | 1 [0] | 55 [0] | 1.47 | 55.90 | |
| 11 | 35 [0] | 1 [0] | 55 [0] | 1.34 | 48.85 | |
| 12 | 35 [0] | 1 [0] | 55 [0] | 1.50 | 52.95 | |
| 13 | 35 [0] | 1 [0] | 55 [0] | 1.48 | 47.38 | |
| 14 | 35 [0] | 1 [0] | 55 [0] | 1.48 | 52.62 | |
| Star Points | 15 | 1.36 [−α] | 1 [0] | 55 [0] | 1.17 | 39.34 |
| 16 | 68.6 [+α] | 1 [0] | 55 [0] | 1.52 | 45.74 | |
| 17 | 35 [0] | 0.16 [−α] | 55 [0] | 1.27 | 46.39 | |
| 18 | 35 [0] | 1.84 [+α] | 55 [0] | 1.34 | 51.64 | |
| 19 | 35 [0] | 1 [0] | 29.8 [−α] | 1.21 | 36.39 | |
| 20 | 35 [0] | 1 [0] | 80.2 [+α] | 1.90 | 55.57 |
| Extraction Technique | R2 (Percent) | Equation |
|---|---|---|
| WB | 90.45 | TPC = 1.55 + 0.01E − 0.24t −0.01T − 0.0002E2 + 0.002Et + 0.0002ET + 0.02t2 + 0.0002tT + 0.00002T2 |
| 93.26 | Inhibition % of DPPH = 87.46 − 0.69E − 13.03t − 0.35T + 0.002E2 + 0.02Et + 0.007ET + 1.81t2 + 0.03tT + 0.002T2 | |
| IRAE | 91.08 | TPC = 0.22 + 0.01E + 1.12t + 0.002T − 0.0001E2 − 0.004Et + 0.0002ET − 0.28t2 − 0.007tT + 0.00007T2 |
| 92.24 | Inhibition % of DPPH = −15.95 + 0.17E + 30.92t + 1.31T − 0.009E2 − 0.06Et + 0.01ET − 4.69t2 − 0.27tT − 0.01T2 |
| Extraction Technique (Optimal Conditions) | Multiple Optimum | Predicted Values | Experimental Values |
|---|---|---|---|
| WB (T = 80 °C t = 4.7 h E = 83%) | TPC g GAE/100 g DM | 1.78 | 1.77 ± 0.040 |
| Inhibition % | 63.5 | 61.7 ± 0.32 | |
| IRAE (T = 80 °C t = 0.6 h E = 57%) | TPC g GAE/100 g DM | 2.1 | 2.2 ± 0.043 |
| Inhibition % | 60 | 61.5 ± 0.24 |
| Phenolic Compound (mg/100 g DM) | WB | IRAE |
|---|---|---|
| Gallic acid | 2.33 ± 0.20 | 2.44 ± 0.042 |
| Resveratrol | 28.46 ± 2.16 | 34.89 ± 0.54 |
| Quercetin | 5.50 ± 0.79 | 6.47 ± 0.58 |
| Caffeic acid | nd | 0.16 ± 0.050 |
| Hesperidin | 286.67 ± 0.60 | 355.60 ± 0.89 |
Publisher’s Note: MDPI stays neutral with regard to jurisdictional claims in published maps and institutional affiliations. |
© 2022 by the authors. Licensee MDPI, Basel, Switzerland. This article is an open access article distributed under the terms and conditions of the Creative Commons Attribution (CC BY) license (https://creativecommons.org/licenses/by/4.0/).
Share and Cite
El Kantar, S.; Rajha, H.N.; El Khoury, A.; Koubaa, M.; Nachef, S.; Debs, E.; Maroun, R.G.; Louka, N. Phenolic Compounds Recovery from Blood Orange Peels Using a Novel Green Infrared Technology Ired-Irrad®, and Their Effect on the Inhibition of Aspergillus flavus Proliferation and Aflatoxin B1 Production. Molecules 2022, 27, 8061. https://doi.org/10.3390/molecules27228061
El Kantar S, Rajha HN, El Khoury A, Koubaa M, Nachef S, Debs E, Maroun RG, Louka N. Phenolic Compounds Recovery from Blood Orange Peels Using a Novel Green Infrared Technology Ired-Irrad®, and Their Effect on the Inhibition of Aspergillus flavus Proliferation and Aflatoxin B1 Production. Molecules. 2022; 27(22):8061. https://doi.org/10.3390/molecules27228061
Chicago/Turabian StyleEl Kantar, Sally, Hiba N. Rajha, André El Khoury, Mohamed Koubaa, Simon Nachef, Espérance Debs, Richard G. Maroun, and Nicolas Louka. 2022. "Phenolic Compounds Recovery from Blood Orange Peels Using a Novel Green Infrared Technology Ired-Irrad®, and Their Effect on the Inhibition of Aspergillus flavus Proliferation and Aflatoxin B1 Production" Molecules 27, no. 22: 8061. https://doi.org/10.3390/molecules27228061
APA StyleEl Kantar, S., Rajha, H. N., El Khoury, A., Koubaa, M., Nachef, S., Debs, E., Maroun, R. G., & Louka, N. (2022). Phenolic Compounds Recovery from Blood Orange Peels Using a Novel Green Infrared Technology Ired-Irrad®, and Their Effect on the Inhibition of Aspergillus flavus Proliferation and Aflatoxin B1 Production. Molecules, 27(22), 8061. https://doi.org/10.3390/molecules27228061