Abstract
Assessment of roadway safety in real-time is a necessary component for providing proactive safety countermeasures to ensure the continued safety and efficiency of roadways. A framework for utilizing data from connected vehicles and other probe sources is proposed in this study. Connected vehicles present an opportunity to provide live fingerprinting and activity monitoring on roadways. Taking advantage of high-resolution trajectory data streaming directly from connected vehicles, variables are extracted and the relationship with crashes are explored utilizing statistical and machine learning models. Hard acceleration events, in conjunction with segment miles are shown to have strong positive correlations with historical crash outcomes as proven by OLS, Poisson and Gradient Booster regression models. An XGBoost classification model is then trained to predict the real-time instances of crash outcomes at 5 min temporal bins with high levels of accuracy when trained with data including the real-time segment speed, reference speed, segment miles, a segment crash risk factor and other variables related to the difference in speeds between consecutive segments as well as the hour of the day. A weighted ensemble model achieved the best performance with an accuracy of 0.95. The results present evidence that the framework can capitalize on the richness of data available via connected vehicles and is implementable as a component in Advanced Traffic Management Systems for the analysis of safety critical situations in real-time.
1. Introduction
Roadway crashes still present a major public health issue, as the global yearly tally of deaths due to vehicular crashes amounts to over 1.35 million, and injuries up to 50 million [1]. Given that the increase in traffic demand correlates positively with population growth and economic growth, there is a valid expectation that the traffic safety problem could worsen as countries seek to improve the economic conditions of the people. In the United States of America alone, roadway vehicle travel accounts for up to 87% of the 1.1 billion trips carried out daily [2]. The domain of traffic safety has over the years investigated the relationships between several roadway factors and their contribution to roadway crashes [3,4,5,6]. The traditional approach to safety analysis has relied historically on physical infrastructure, crash data, manual data collection, and usually inferential statistical modeling to evaluate the safety of the road networks [3,4]. Although this approach has seen a lot of success over the years, there is still much to be desired regarding more proactive approaches to traffic safety [4,7,8,9]. In recent years, studies have demonstrated that the advancement of commercially available and inexpensive real-time disaggregated vehicle data has the potential to be utilized to develop real-time crash prediction models [3,4,10], yet what is missing is a referenceable data processing and modelling framework of how the currently available data, and the potential variables that can be extracted from them in their current form, can be used to develop deployable detection and prediction models of safety critical situations, which this study seeks to provide.
With the advancement in traffic data collection efforts, many agencies in the United States and around the world have upgraded and updated the amount and types of traffic data they collect. Traffic volume data on specific roadway segments and at specific locations, which traditionally have been collected utilizing detectors and manual counting efforts, can now be collected utilizing CCTV video feeds as well [10]. The aggregated speeds along roadway segments can now be monitored in real time with vehicle probe data from different sensors such as GPS, WiFi and Bluetooth devices, as well as monitored and collected from video data, granting transportation agencies the ability to assess situations on the roadway as they unfold [11,12,13,14].
In more recent years, the process for modeling crash data has employed the use of modern approaches such as deep learning and machine learning methods [15,16]. This has expanded the scope of analysis for many areas of transportation research from data collection to data generation, network safety optimization and traffic safety analysis [15,16,17,18,19,20]. As data accessibility, which used to be the biggest drawback to employing these modern models, is no longer an issue, the potential for more analysis use cases within the transportation domain has grown. Machine learning models are still not without their disadvantages. Although they present high performance and accuracies, this comes at the cost of their difficulty with regard to explainability [20]. The processing capacity for these large streams of real-time data made available through CV sensors and other sensors tend to overwhelm existing datacenter infra-structure data processing capabilities and the inherent benefits are delayed or unenjoyed [21]. Robust ETL pipelines are necessary to handle these large data streams in a timely manner. These disadvantages are also prevalent in deep learning models which also require higher levels of data resolutions as well as computational resources to train, deploy and monitor [17,19,22,23].
The benefit of short-term traffic state data for real-time traffic network assessment spans multiple use cases, including network congestion [16], dynamic traffic signal timing, and many more use cases [9,10,19]. The challenge with real-time safety assessment begins with the data collection process. Unlike volume and speed that are continuous states of traffic which can be measured at a regular time interval, crashes are discrete random events. Roadway crashes are usually rare occurrences on the roadway network and as such, the mechanism for their analysis usually involves compiling historical data over a lengthy period, presenting a difficulty for real-time analysis as the causal factors that contribute to the crash situation may not be captured in the moment due to data underreporting and inconsistencies with the collection efforts across different transportation agencies. As such, in the absence of crash data, many studies have moved towards relying on surrogate safety measures that present a certain quantifiable level of risk to be estimated [24]. In this study the temporal threshold for defining real-time is limited to 5 min bins, defined by the availability of the data and the practical implications of the framework.
As the domain of traffic safety analysis expands with the introduction of new data sources, as well as analysis approaches, researchers are now able to redefine their evaluation methodologies. While most safety analysts prefer the traditional statistical approaches for their ease of expandability, others have decided to focus on newer machine learning and deep learning methods for the higher accuracies of their predictions [9,25,26]. The disparity between the preferences is also reflected in the choice of variables used, as the traditional approach relies on spatially aggregated data for macroscopic analysis and link level crash prediction analysis. This approach limits the resolution and scope of parameters that can be involved in the analysis process. While some agencies have adopted an approach that involves extracting information from video feeds to remedy this situation, the scope of effort involved in such a venture is tasking and currently impractical for real-time analysis.
To address some of these research gaps, this study proposes a framework that involves utilizing disaggregate vehicle trajectory data from connected vehicles deployed within the transportation network. The framework is conceptualized and presented below (Figure 1). This framework defines a process for extracting different variables from a high-resolution data source and exploring their potential application as useful signals for detecting potential safety critical situations. As the general state of traffic on our roadways is dynamic and subject to the influence of the different actions of the roadway users, it is important to have a framework that can capitalize on monitoring the continued changes with as wide a footprint as possible. This has been the motivation of most transportation agencies to establish traffic monitoring centers that utilize a network of CCTV cameras to continuously monitor the situation of the roadway. The disadvantage of this system is that it is limited to areas where the technology is present and real-time extraction of the necessary data is challenging. Thus, collecting information from vehicles as they are engaged on the roadway prior to crash occurrences, it is possible to explore the relationships between the traffic state and the crash outcome. With validated relationships, it is possible to develop and deploy models that can monitor the state of the transportation network in real-time and respond to potential risks in a more proactive manner.
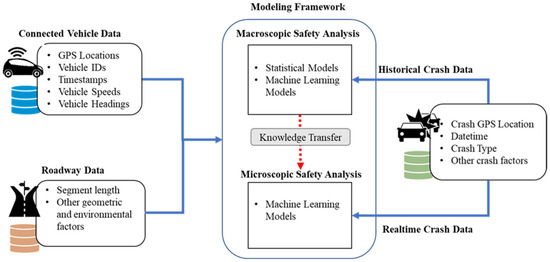
Figure 1.
General Proposed Framework of Safety Assessment.
This study aims to explore the microscopic traffic states at a desirable level of spatial and temporal aggregation, to learn relationships between various variables that can be collected in real-time and the potential for detecting a crash outcome. The research poses and addresses the following questions, are there any variables which can be extracted from connected vehicles that have a strong influence on roadway safety? Can these variables help traffic safety engineers develop models that can detect or predict crashes? There is a general lack of studies that have tried to develop such frameworks for real-time evaluation, and the few that have done so utilized different data sources and approaches [9,10,25]. The structure of this paper defines a usable framework to meet this challenge is as follows; Section 1 introduces the paper presenting the motivation and objective of the study. A literature review is presented in Section 2 that explores the traditional approaches to traffic safety analysis and the current research done exploring the potential for real-time safety analysis. Section 3 is a materials and methods chapter that presents the different datasets utilized in this study and the methodologies employed to first evaluate the usefulness of new variables, and then capitalize on the potential of these variables for safety critical situation detection. Section 4 is the results of the multistage analysis framework, followed by the discussions on the results in Section 5 and finally the conclusions of the outcome of the study as Section 6.
2. Literature Review
Traffic safety studies have primarily been reliant on aggregated crash data compiled over an extended period. This general approach to traffic safety analysis limits the scope of involvement of influential factors since event level variables are usually not preserved in the aggregation process. Statistical count models used in the analysis of crash counts are usually employed during analysis where spatial aggregation at the geometric infrastructure level allows for the involvement of static geometric factors as explanatory variables. As such, the most employed explanatory variables include network-link level factors such as segment length (geometric factor) and AADT (Average Annual Daily Traffic) as a traffic state factor [4,27,28,29].
For studies that look to analyze crashes at the event level to preserve the unique event level factors, the scope of analysis is usually limited to injury severity as the response variable. This approach to traffic safety analysis has presented us with a wealth of information in relation to factors such as driver characteristics and behaviors [30], as well as observable event level factors related to the environment like weather and lighting, and how they relate to the injury severity outcome of crashes [6,30,31].
With the wealth of new data being gathered by different sensors on our roadways, ranging from traffic volumes from embedded sensors and videos, to averaged roadway segment speeds from probe vehicles and videos, data is now being collected and processed at the microscopic level to aid in the improvement of the transportation network [16,25]. One such source of data is vehicle trajectory data collected from connected vehicles deployed within the transportation network. The consensus surrounding the impact of connected vehicles on the safety of the transportation network varies with regard to level of penetration, but usually sways towards an improvement on the overall system [32,33]. The direction of some studies looking at the potential benefit of connected vehicles are focused on extracting useful information from connected vehicle data [34] to deploy in the analysis of roadway events. Since connected vehicles provide a stream of continuous data factors such as speed, heading, and the general location of the connected vehicle within the transportation network system, this has made it possible for real time analysis of specific situations within a wider footprint on the transportation network system where these connected vehicles are present. Situations such as congestion management through the detection of slowdowns on roadway segments via the analysis of connected vehicle data are made possible as a result [25,35].
With regard to traffic safety analysis and the implementation of connected vehicle data, studies have looked at developing surrogate safety metrics from the collective analysis of different parameters extracted from connected vehicle data, such as hard accelerations and hard decelerations as well as vehicular jerk [8]. These metrics have come to be collectively known as driving volatility and have proven to be an especially useful proxy for crash risk situations. Since volatility measures deviations from acceptable driving behavior, this data can help guide safety analysts towards responding to instantaneous safety critical situations on roadways.
As microscopic driving behaviors have become explorable through the development of volatility metrics from real-time vehicle trajectory data, there have been research studies that have explored the relationships between these metrics and crash [9,25]. However, what is lacking in the literature is a framework for real-time analysis that combines both an investigation of which of these volatility metrics are best suited to be used as a proxy for crash outcomes, and models that can then utilize these metrics to predict and detect safety critical situations to a high degree of accuracy to enable stakeholders such as traffic engineers, law enforcement and first responders, to proactively deal with these situations in an efficient and effective manner.
3. Materials and Methods
To develop the proposed framework, an initial process of data gathering, and pre-processing is conducted. The first two sources of data pertaining to connected vehicle probe data are procured from Otonomo (San Francisco, CA, USA)—a private company founded in 2015 that provides vehicle trajectory data from a fleet of over 50 million connected vehicles, as well as from INRIX, also a private company founded in 2005. Whereas the data provided by Otonomo is at a disaggregated level from individual vehicles providing information every 3 s, INRIX aggregates traffic-related information from road sensors as well as GPS-enabled vehicles and mobile devices provided at 5 min temporal intervals. Real-time trajectory data from individual vehicles are thus extracted from the Otonomo data, whereas segment level aggregated data for speed and travel time are extracted from the INRIX data. The data is collected for the spatial boundary of the City of Saint Louis in the state of Missouri, from the period of 1 August 2021 to 31 October 2021, amounting to over 40 million datapoints from more than 30,000 unique vehicle IDs.
The crash data on the other hand is provided by the Missouri Department of Transportation for a period of ten years from 2010 to 2019, as well as crash data that occurred within the Saint Louis City boundary for the same period when the connected vehicle data is gathered. With the crash data serving as the response variable, a series of both statistical and machine learning models are deployed. Firstly, the relationships between real-time sourceable variables that can be extracted from the connected vehicle data in tandem with other static roadway and environmental factors, and the occurrence of crashes, are explored. Linear regression models (OLS) including Poisson regression are utilized, followed by a Gradient Boosted (GB) regression. This is followed up with a machine learning classification model that utilizes the variables evaluated in the initial phase to do incident detection (Figure 2).
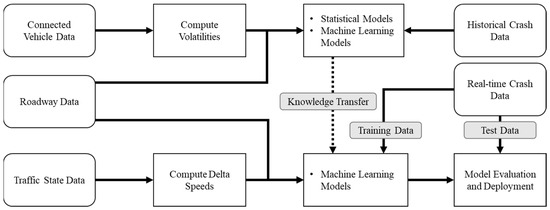
Figure 2.
Real-time Crash Detection Modeling Framework.
3.1. Data Pre-Processing
Before the analysis can be conducted, it is necessary to process the available data into a usable form that can be modeled. The data pre-processing includes data cleaning as well as transformation of the raw data inputs into other variables. Data related to connected vehicles undergoes a series of transformations before they can be employed within the models, beginning with the disaggregated vehicle level data from Otonomo from which a series of different metrics are derived.
Driving volatility as a proxy for driver erratic driving behavior is utilized in this study. Extreme instantaneous driving behavior has been proven to be correlated with crashes by previous studies [26,34,36]. This study utilizes defined measures of hard longitudinal accelerations and hard longitudinal decelerations, derived from the disaggregated vehicle level data as measures of volatility. The volatilities are computed by first measuring the rate of change of speed, by finding the difference between the current state speed and previous state speed over the time interval between data points for every unique vehicle. A threshold for normal acceleration and deceleration behavior is then computed for 5 km per hour speed bins within 2 standard deviations of the observed values. All values falling outside the 2-sigma threshold are considered volatile events as they deviate from the threshold of observed normal driving (Figure 3).
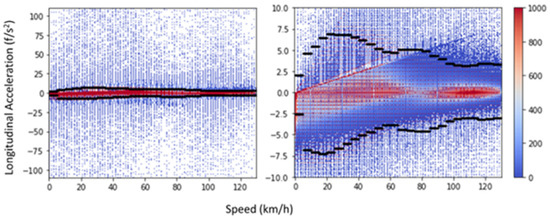
Figure 3.
Volatility thresholds computed from connected vehicle data (Color denotes density values of scatter point cloud with blue denoting low density and red denoting higher density).
With regard to the INRIX data, since segment speeds are averaged at a spatial level of segment links, the transformation involved in the pre-process involves deriving a metric of the difference in average speed between successive segments. This metric is described as the delta-speed and is theorized to be a useful link level measure of traffic state that can help indicate situations at different segments on the roadway [28].
The crash data utilized in this study is provided in two forms. The first dataset is historical crash data with geocoded and timestamped information to provide spatial and temporal context to the crash situation. Similarly, crashes that occurred during the data gathering phase of the connected vehicle data are also provided with the same level of information. In this regard, it is possible to model the relationships between the developed real-time proxy safety measures at an aggregated roadway link level.
From the connected vehicle data, we can then extract variables such as aggregated average segment speed, average hard acceleration values, average hard deceleration values, as well as counts of hard acceleration and hard deceleration events. Given that the data is streaming at a frequency of every 3 s, it is possible to define high resolution temporal bins, but due to data availability constraints, the study settled on a 5 min temporal bin.
3.2. Historical Crash Data Analysis
Given that this study seeks to capitalize on factors that are developed from real-time streaming data, the first step of the analysis process begins with trying to understand and draw out any relationships between these variables and crash situations. By investigating the intrinsic nature of both the spatial and temporal of the occurrences of these situations and crash events, it is possible to evaluate the usefulness of these factors and justify their deployment, either as surrogates for safety critical situations, or as useful explanatory variables in further models.
Historical crash data also allows us to define the risk profile of individual roadway segments by computing crash rate per million vehicle miles per year, in combination with segment miles and AADT data. This allows the analysis to factor in the potential safety risks of individual segments in calibrating the likelihood of the occurrence of crashes on each segment.
Analysis of historic crashes coupled with roadway and traffic state factors, as well as driving volatility metrics, are done at the roadway segment level with an hour-of-day component to account for the observed heterogeneity in traffic states through the day. The analysis process involves the use of logistic regression models as well as Poisson Regression models which have been employed extensively with much success for crash count modeling, and then finally a Gradient Boosted (GB) regression, a machine learning model, which lends itself to higher level of accuracy for the analysis process.
3.2.1. Linear Regression (OLS)
Early traffic accidents analysis deployed simple linear regression models with an assumed normality of distributed errors [37]. These models are still widely used for their simplicity and ease of explanation, usually in the investigation of newly developed explanatory factors. The general form of the linear regression model for crash analysis can be expressed as shown in Equation (1).
where, is the response variable representing crash frequency of the crash dataset θ, Dist(θ) is the model distribution, a vector representing different explanatory variables, β a vector of the regression coefficients, and is the error terms of the model.
3.2.2. Poisson Regression
The Poisson regression model is a count model more suitable for the analysis of crash data than the OLS model since OLS are prone to make predictions that are non-integer values. The Poisson model also has the advantage of a skewed, discrete distribution, and the restriction of predicted values to non-negative numbers, which is consistent with the nature of crash data since most datasets have a high zero value observation and crashes cannot be negative in value. The Poisson model assumes that the errors follow a Poisson distribution, and models the natural log of the response variable, as a linear function of the coefficients, expressed in Equation (2).
where is the probability of a crash occurring times on segment per specific period, and is the Poisson parameter for segment , which is numerically equivalent to segment ’s expected crash frequency per year, .
3.2.3. Gradient Boosted Regression
Machine learning approaches are rising in popularity due to their high performance in safety analysis. One such approach, gradient boosting has been applied in the case of both regression and classification models to improve their accuracies. Gradient Boosted Regression produces a predictive model in the form of an ensemble of several simple decision tree models with the capability of handling large datasets without preprocessing, resistance to outliers, capability to handle missing data, robustness to complex data, and resistance to overfitting [29]. The decision tree algorithm from which the gradient boosting technique is derived further is explained more succinctly by Zhang et al. [35]. The gradient boosting algorithm (Equation (3)) capitalizes on an ensemble of weak decision tree predictors to build a more robust prediction algorithm.
where x is a set of explanatory factors, f(x) is the approximation of the response variable, g(x, γn) are single decision trees with the parameter γn indicating the split variables β(n = 1, 2,…, n) are the coefficients and determine how each single tree is to be combined.
3.3. Microscopic Real-Time Prediction Modeling
While most safety analysis of roadway crashes are done in hindsight through the collective aggregation of crash data and observable influencing factors, real-time event prediction requires developing and deploying a model that continually collects and analyzes data streams with factors that are constantly available. Most factors utilized in crash modeling can only be collected post-event, certain factors such as traffic state variables and some static factors pertaining to the roadway and environment can and have been utilized in recent times for real-time analysis [7,10,25]
Connected vehicle (CV) data presents an opportunity to assess and analyze the state of traffic flow network in real-time. Averaged traffic speeds on a segment and counts of volatile driving events, continually measured withing a brief period grants safety practitioners’ deeper insight in assessing the situation on individual roadway segments within the wider transportation network. This study employs the XGBoost Classification algorithm to predict the crash situation of a particular roadway segment at a particular time interval. Although the crash data can involve multiple events occurring within the defined time interval, the data is transformed into binary outcome of y = 0 representing no crash event and y = 1 signifying that at least one crash event has occurred.
XGBoost Classification
XGBoost is an advanced form of gradient boosting algorithm that includes regularization of parameters to improve upon speed and accuracy. Although XGBoost tends to achieve higher accuracies, this comes at the cost of intrinsic interpretability of the decision trees. XGBoost has proven to be incredibly fast, portable, scalable, and reliable, and as such is a preferred machine learning prediction model candidate for its ease of use [30].
4. Results
4.1. Exploratory Data Analysis
Table 1 presents the general description of the key variables employed in the modeling phase of this study. After the pre-processing stage, microscopic volatile driving events computed from the CV data are aggregated at the segment level.

Table 1.
Description of Key Independent Variables.
As the data aggregation occurs at the segment level, conflation of CV data values to the respective segments based on spatial proximity and direction of flow is carried out. The descriptive statistics of the final merged datasets developed from combining the segment level data at different temporal intervals, with the crash datasets are provided in Table 2.
Table 2.
Descriptive Statistics of Variables and Crash Data.
An initial spatial exploratory analysis is done by developing an hour of day heatmap of the different aggregated values of observed counts of hard decelerations and crashes.
Counts of hard deceleration events as well as historical crash events are spatially conflated to roadway links based on hour of the day they occurred. The roadway segment links are then ordered and indexed by virtue of their connectedness and direction of traffic flow. A clear spatial and temporal relationship can be observed between these two variables (Figure 4) strengthening the prior hypothesis that hard decelerations can serve as a suitable surrogate for crashes, if necessary, as is consistent with the literature [8,34,38]. This relationship is further explored in another study that utilized an entropy based localized bivariate analysis to define the spatial and temporal relationship between hard decelerations and crash hotspots, concluding on an observed positive linear relationship in 63.21 percent of the coverage area of the study region, as well as a concave relationship in 20.37 percent and convex relationship in 14.23 percent of the study region [39].
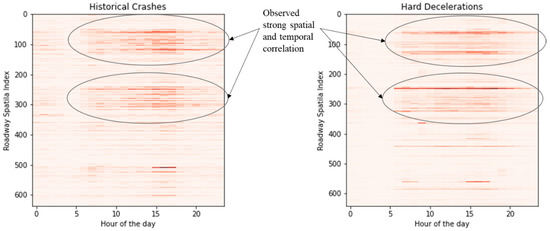
Figure 4.
Heatmaps of Deceleration Counts and Crash Counts by Spatial Index and Hour of Day.
4.2. Crash Data Modeling Results
The results of the initial stage of modeling for OLS, Poisson, and GB regression, as well as model evaluation performance metrics on the historical crash dataset are provided in Table 3 and Table 4 below. Evaluation of the accuracies of each model is done through measuring the mean absolute errors (MAE) and root mean squared errors (RMSE) on a portion of the data held back from the modeling process, as well as a Cumulative Residual (CURE) plot as suggested by Hauer [40] as a means of visually and objectively determining which model has a general overall better performance.
Table 3.
Statistical Modeling Results of Historical Crash Data.
Table 4.
Model Evaluation.
The results from the OLS and Poisson models show common significant variables with consistent direction of influence of the factors (either negative or positive). As expected, the segment length and number of volatile hard deceleration events are shown to be significant in both models, with a positive influence on the outcome of a crash event. With a baseline of midnight hour, there is a perceived reduction in outcome of crashes between the hours of 3 a.m. to 5 a.m., and then an increase in the instance crash outcome for the active hours of the day at 8 a.m., and between 12 noon to 6 p.m.
From the results, the GB model shows the best overall performance. The general overall performance can also be decided via the visual assessment of the CURE (Cumulative Residual) plots. It can be observed (Figure 5) that the GB regression model has the least performance issues as influenced by outliers. Since the CURE plot is a sum of many independent random variables, and is approximately normally distributed, about 95% of the probability is expected to fall within two standard deviations from the mean [40].
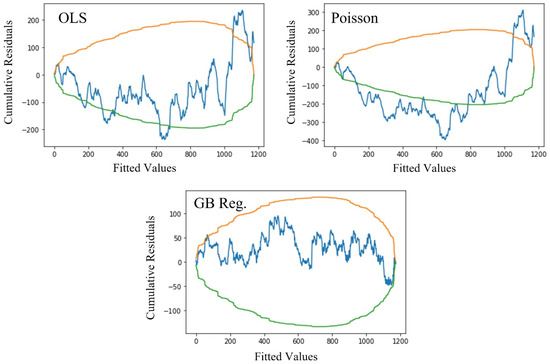
Figure 5.
CURE plots of OLS, Poisson, and GB Regression models. Orange denotes upper boundary, green denotes lower boundary and blue is the plot of the observed cumulative residual from model predictions.
4.3. Real-Time Crash Detection Modeling Results
As real-time detection modeling is done via a classification model, the detection accuracy is measured in conjunction with precision and recall values. The dataset for the real-time crash detection is unbalanced with non-crash events outnumbering crash events by an enormous amount, which may pose issues with the validity of the model accuracy. This presents a challenge to the modeling process which can be overcome via several different strategies. The modeling process is performed on different combinations of the dataset utilizing data resampling techniques including random under sampling and SMOTE, as well as an ensemble model.
Table 5 presents the results of the modeling outcome. With 80% of the data used in training and 20% held back from testing, the models are evaluated based on the performance of accurate classification on the test data. Finally, the ROC and AUC curves of the modeling outcome, as well as the feature importance of the variables deployed in the final models are provided below (Figure 6 and Figure 7).
Table 5.
XGBoost Modeling Results.
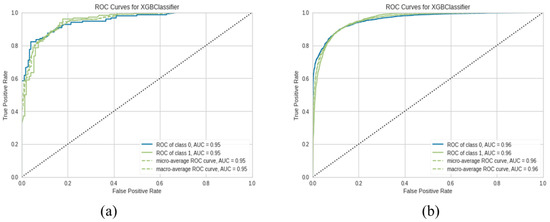
Figure 6.
Comparison of ROC and AUC for (a) Under sampled data; (b) SMOTE data models.
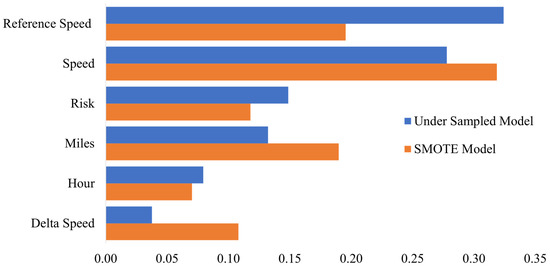
Figure 7.
Feature Importance Comparison of detection models.
Results from XGBoost classification models show high accuracies for both sampling techniques. The difference in accuracy between the two sampling techniques is 1.1% with the SMOTE model showing an improved recall rate and F-1 score. For the ensemble models, the accuracy of the unweighted models is 0.91 whilst that of the weighted models is 0.95, an increase of 4.4%. The ROC-AUC curves of the under sampled model show an AUC value of 0.95 and that for the SMOTE model shows an AUC value of 0.96.
5. Discussion
OLS and Poisson models suggest that longer segments with higher instances of high deceleration occurring are more prone to crashes. This much is expected as it is consistent with general safety literature. It can also be observed that specific hours of the day have higher susceptibility to crashes occurring, which can be explained by the various levels traffic volumes on the roadway at different times. The crash detection models, also with remarkably high levels of accuracy, are very dependent on the measures of average speeds and the reference speeds of roadway segments during the time intervals. The risk profile of each segment of roadway, developed from the historic crash information and length of the roadway segment also rank at the mid of importance of factors employed in the modeling, whilst the hour of day and delta speed are the lowest ranked variables.
With the ability to collect, in real-time, vehicle trajectory information and detect the locations where hard decelerations are occurring more frequently, it is possible to explore where the risk for crashes to occur is highest and deploy safety countermeasures. Predicting where crashes may occur using aggregate measures of average segment speed information, the difference in the average speed between segments and the hour of the day when the data is available, as well as roadway level information such as historical crash risk and segment length (miles), is possible with the current available data sources. Connected Vehicle data has presented the potential to provide insights that will lead to immediate benefits with respect to roadway safety. Variables such as average speeds and the number of occurrences of volatile driving events within a 5 min time frame have proven very valuable in the assessment of real-time traffic safety on roadways. Augmenting the information gleaned from the historical crash data analysis with the detection models, a clear picture of the state of safety of the roadway network can be developed. The XGBoost model also has the advantage of ease of use due to short training times and transferability. The model can be retained and reinforced to fit newer dimensions of scale and scope if necessary. This framework takes advantage of the veracity, velocity, and volume of kinematic data streaming from connected vehicles to complement the existing traffic management operations and is currently under evaluation for its potential use as a viable safety component for Advanced Traffic Management Systems (Figure 8).
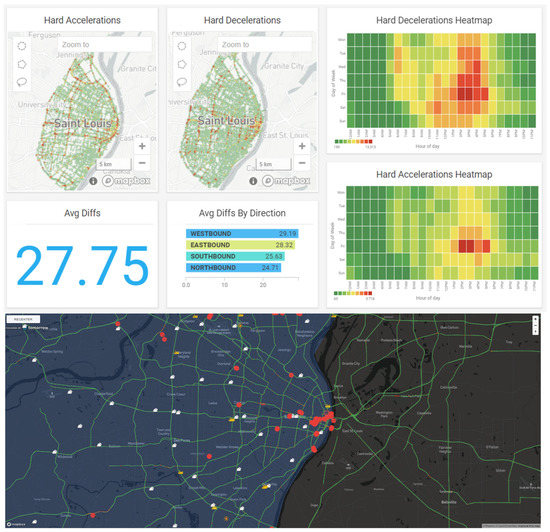
Figure 8.
Real-time roadway safety management dashboard.
6. Conclusions
This study proposed a framework to assess the safety of roadways in real-time utilizing data from various sources including connected vehicles (CV). With the trajectory information CVs (Connected Vehicle) provide, it is possible to extract traffic state information such as average segment speeds, as well as information pertaining to volatile driving behavior on various roadway segments. Hard deceleration events are proven to be significantly correlated with crash location and a useful surrogate for observing potential areas of substantial risk. Speed information from various sources including CVs can also be aggregated at the segment level, and a combination of these factors with other roadway level factors such as segment length and the per million vehicle mile crash risk computed from historical crash data, crash detection models can be trained and deployed.
Detection of crash event locations utilizing classification models in real-time is proven to be feasible for developing advanced traffic management systems that are safety focused. As earlier studies have proven, machine learning models have the potential to accommodate real-time crash prediction with relatively high accuracies [25,41]. The main conclusions from this study are as follows:
- High resolution Connected Vehicle Data can provide a source of valuable information with regard to useful variables extracted from vehicle kinematics for safety modelling implications.
- OLS and Poisson models show that driving volatility metrics such as hard deceleration counts are statically significant and have a positive relationship with locations of historically high crash events.
- XGBoost model are computationally fast, easy to train and flexible to reinforce with new information and achieve high accuracies for crash prediction for traffic state data collected in 5 min intervals, with accuracies of 0.88–0.95 and AUC of 0.95–0.96, making them a great candidate model for the current framework.
- The average real-time measured speed of the roadway segment in conjunction to the general reference speed are crucial factors for detecting in real-time where crashes are most likely to have occurred.
The practical implication of this study is to explore the growing potential for utilizing variables extracted from connected vehicle data in developing and deploying a safety analysis framework, and how it is being deployed as a traffic safety component in an ATMS. Considering that crash data as it occurs in real-time is only validated through CCTV feeds when available [14] and on-site reports, with the advantage of connected vehicles providing live fingerprinting of multiple roadway links with information of the traffic state and driver behaviors in real-time, this framework as it is being applied, helps in detecting potential safety critical situations, and monitoring the cascading effect on network travel speeds and congestion in locations where the infrastructure for active monitoring (such as CCTV) is unavailable, given that proactive deployment of emergency response is crucial to resolving safety critical issues and preventing them from escalating. The current framework with the proposed data processing and XGBoost modeling approach results in AUC of 0.95–0.96 and accuracies from 0.88–0.95, which is a great improvement in comparison with other studies reporting AUC of 0.77 for AdaBoost models [41] and accuracies of 0.85 for Random Forest model [25].
As this study’s main goal is to develop a useable framework with the current existing data, it is not without limitations. At the time of the study, the penetration rate of CVs within the area of observation was below 2% to about 10%, given factors such as roadway classification and time of day, and this presents an issue of sparseness with regard to data availability in less travelled local roadway links. Although given the low penetration rates, the amounts of data points extracted within the analysis period constituted almost 40 million points from about 30,000 vehicles, with generally observed high concentrations on freeway links. Similarly, higher penetration levels will eventually demand a more robust framework to stream and process the vast amounts of data produced as a result. Other statistical summary values of driving volatilities such as the averages of accelerations and decelerations, as well their standard deviations can be utilized in the framework with higher degrees or reliability when penetration levels improve. Finally, the temporal bandwidths for data aggregation can be improved, and the influence of extreme weather conditions which have not been accounted for in this current study are all under consideration for future studies.
Author Contributions
The authors confirm contribution to the paper as follows: study conception and design: A.R.M. and Y.A.-G.; data collection: A.R.M. and Y.A.-G.; analysis and interpretation of results: A.R.M. and Y.A.-G.; draft manuscript preparation: A.R.M. and Y.A.-G. All authors have read and agreed to the published version of the manuscript.
Funding
This research received no external funding.
Institutional Review Board Statement
Not applicable.
Informed Consent Statement
Not applicable.
Data Availability Statement
Data sharing not applicable.
Acknowledgments
The Authors would like to acknowledge the Missouri Department of Transportation for their support with providing the necessary data for this project.
Conflicts of Interest
The authors declare no conflict of interest. The funder had no role in the design of the study; in the collection, analyses, or interpretation of data; in the writing of the manuscript, or in the decision to publish the results.
References
- World Health Organization Global Status Report on Road Safety 2018. Available online: https://www.who.int/publications/i/item/9789241565684 (accessed on 24 July 2022).
- Santos, A.; Mcguckin, N.; Nakamoto, H.Y.; Gray, D.; Liss, S. Summary of Travel Trends: 2009 National Household Travel Survey; Federal Highway Administration: Washington, DC, USA, 2011.
- Lee, C.; Saccomanno, F.; Hellinga, B. Analysis of Crash Precursors on Instrumented Freeways. Transp. Res. Rec. 2002, 1784, 1–8. [Google Scholar] [CrossRef]
- Abdel-Aty, M.; Uddin, N.; Pande, A.; Abdalla, M.F.; Hsia, L. Predicting Freeway Crashes from Loop Detector Data by Matched Case-Control Logistic Regression. Transp. Res. Rec. 2004, 1897, 88–95. [Google Scholar] [CrossRef]
- Wu, J.; Subramanian, R.; Craig, M.; Starnes, M.; Longthorne, A. The Effect of Earlier or Automatic Collision Notification on Traffic Mortality by Survival Analysis. Traffic Inj. Prev. 2013, 14, S50–S57. [Google Scholar] [CrossRef]
- Bagloee, S.A.; Asadi, M. Crash analysis at intersections in the CBD: A survival analysis model. Transp. Res. Part A Policy Pract. 2016, 94, 558–572. [Google Scholar] [CrossRef]
- Parsa, A.B.; Movahedi, A.; Taghipour, H.; Derrible, S.; Mohammadian, A. (Kouros) Toward safer highways, application of XGBoost and SHAP for real-time accident detection and feature analysis. Accid. Anal. Prev. 2020, 136, 105405. [Google Scholar] [CrossRef] [PubMed]
- Kamrani, M.; Wali, B.; Khattak, A.J. Can Data Generated by Connected Vehicles Enhance Safety?: Proactive Approach to Intersection Safety Management. Transp. Res. Rec. J. Transp. Res. 2017, 2659, 80–90. [Google Scholar] [CrossRef]
- Yu, R.; Han, L.; Zhang, H. Trajectory data based freeway high-risk events prediction and its influencing factors analyses. Accid. Anal. Prev. 2021, 154, 106085. [Google Scholar] [CrossRef]
- Christoforou, Z.; Cohen, S.; Karlaftis, M.G. Integrating Real-Time Traffic Data in Road Safety Analysis. Procedia Soc. Behav. Sci. 2012, 48, 2454–2463. [Google Scholar] [CrossRef]
- Chen, M.; Chien, S.I.J. Dynamic Freeway Travel-Time Prediction with Probe Vehicle Data: Link Based Versus Path Based. Transp. Res. Rec. 2001, 1768, 157–161. [Google Scholar] [CrossRef]
- Mahajan, V.; Katrakazas, C.; Antoniou, C. Crash Risk Estimation Due to Lane Changing: A Data-Driven Approach Using Naturalistic Data. In IEEE Transactions on Intelligent Transportation Systems; IEEE: New York, NY, USA, 2020; Volume 23, pp. 3756–3765. [Google Scholar] [CrossRef]
- Lin, Y.; Li, L.; Jing, H.; Ran, B.; Sun, D. Automated traffic incident detection with a smaller dataset based on generative adversarial networks. Accid. Anal. Prev. 2020, 144, 105628. [Google Scholar] [CrossRef]
- Mandal, V.; Mussah, A.R.; Jin, P.; Adu-Gyamfi, Y. Artificial Intelligence-Enabled Traffic Monitoring System. Sustainability 2020, 12, 9177. [Google Scholar] [CrossRef]
- Rahim, M.A.; Hassan, H.M. A deep learning based traffic crash severity prediction framework. Accid. Anal. Prev. 2021, 154, 106090. [Google Scholar] [CrossRef] [PubMed]
- Chakraborty, P.; Adu-Gyamfi, Y.O.; Poddar, S.; Ahsani, V.; Sharma, A.; Sarkar, S. Traffic Congestion Detection from Camera Images using Deep Convolution Neural Networks. Transp. Res. Board 2018, 2672, 222–231. [Google Scholar] [CrossRef]
- Yu, R.; Li, Y.; Shahabi, C.; Demiryurek, U.; Liu, Y. Deep learning: A generic approach for extreme condition traffic forecasting. In Proceedings of the 17th SIAM International Conference on Data Mining (SDM), Houston, TX, USA, 27–29 April 2017; pp. 777–785. [Google Scholar]
- Yao, H.; Wu, F.; Ke, J.; Tang, X.; Jia, Y.; Lu, S.; Gong, P.; Li, Z.; Ye, J.; Chuxing, D. Deep Multi-View Spatial-Temporal Network for Taxi Demand Prediction. In Proceedings of the 32nd AAAI Conference on Artificial Intelligence, New Orleans, LA, USA, 2–7 February 2018; pp. 2588–2595. [Google Scholar] [CrossRef]
- Jiang, W.; Zhang, L. Geospatial data to images: A deep-learning framework for traffic forecasting. Tsinghua Sci. Technol. 2019, 24, 52–64. [Google Scholar] [CrossRef]
- Almamlook, R.E.; Kwayu, K.M.; Alkasisbeh, M.R.; Frefer, A.A. Comparison of Machine Learning Algorithms for Predicting Traffic Accident Severity. In Proceedings of the 2019 IEEE Jordan International Joint Conference on Electrical Engineering and Information Technology (JEEIT), Amman, Jordan, 9–11 April 2019; IEEE: New York, NY, USA, 2019; pp. 272–276. [Google Scholar] [CrossRef]
- Mussah, A.R.; Amo-Boateng, M.; Shoman, M.; Adu-Gyamfi, Y. Accelerating Statewide Connected Vehicles Big (Sensor Fusion) Data ETL Pipelines on GPUs. In Proceedings of the Transportation Research Board (TRB) 102nd Annual Meeting, Washington, DC, USA, 8–12 January 2023. [Google Scholar]
- He, K.; Zhang, X.; Ren, S.; Sun, J. Deep Residual Learning for Image Recognition ArXiv:1512.03385v1. CVPR 2015, 19, 107–117. [Google Scholar]
- Zhang, J.; Zheng, Y.; Qi, D. Deep Spatio-Temporal Residual Networks for Citywide Crowd Flows Prediction. In Proceedings of the Thirty-first AAAI Conference on Artificial Intelligence, San Francisco, CA, USA, 4–9 February 2017; pp. 1655–1661. [Google Scholar] [CrossRef]
- Arun, A.; Haque, M.; Bhaskar, A.; Washington, S.; Sayed, T. A systematic mapping review of surrogate safety assessment using traffic conflict techniques. Accid. Anal. Prev. 2021, 153, 106016. [Google Scholar] [CrossRef]
- Hu, Y.; Li, Y.; Huang, H.; Lee, J.; Yuan, C.; Zou, G. A high-resolution trajectory data driven method for real-time evaluation of traffic safety. Accid. Anal. Prev. 2021, 165, 106503. [Google Scholar] [CrossRef]
- Yu, R.; Li, S. Exploring the associations between driving volatility and autonomous vehicle hazardous scenarios: Insights from field operational test data. Accid. Anal. Prev. 2021, 166, 106537. [Google Scholar] [CrossRef] [PubMed]
- Pande, A.; Abdel-Aty, M.; Hsia, L. Spatiotemporal Variation of Risk Preceding Crashes on Freeways. Transp. Res. Rec. J. Transp. Res. Board 2005, 1908, 26–36. [Google Scholar] [CrossRef]
- Dutta, N.; Fontaine, M.D. Improving freeway segment crash prediction models by including disaggregate speed data from different sources. Accid. Anal. Prev. 2019, 132, 105253. [Google Scholar] [CrossRef]
- Amoh-Gyimah, R.; Saberi, M.; Sarvi, M. Macroscopic modeling of pedestrian and bicycle crashes: A cross-comparison of estimation methods. Accid. Anal. Prev. 2016, 93, 147–159. [Google Scholar] [CrossRef] [PubMed]
- Quddus, M. Effects of Geodemographic Profiles of Drivers on Their Injury Severity from Traffic Crashes Using Multilevel Mixed-Effects Ordered Logit Model. Transp. Res. Rec. 2015, 2514, 149–157. [Google Scholar] [CrossRef]
- Kang, G.; Fang, S.-E. Applying Survival Analysis Approach to Traffic Incident Duration Prediction. In Proceedings of the ICTIS 2011: Multimodal Approach to Sustained Transportation System Development: Information, Technology, Implementation, Wuhan, China, 30 June–2 July 2011; pp. 1523–1531. [Google Scholar] [CrossRef]
- Sharma, A.; Zheng, Z.; Kim, J.; Bhaskar, A.; Haque, M.M. Assessing traffic disturbance, efficiency, and safety of the mixed traffic flow of connected vehicles and traditional vehicles by considering human factors. Transp. Res. Part C Emerg. Technol. 2021, 124, 102934. [Google Scholar] [CrossRef]
- Ye, L.; Yamamoto, T. Evaluating the impact of connected and autonomous vehicles on traffic safety. Phys. A Stat. Mech. Appl. 2019, 526, 121009. [Google Scholar] [CrossRef]
- Khattak, A.J.; Wali, B. Analysis of volatility in driving regimes extracted from basic safety messages transmitted between connected vehicles. Transp. Res. Part C Emerg. Technol. 2017, 84, 48–73. [Google Scholar] [CrossRef]
- Zhang, K.; Jia, N.; Zheng, L.; Liu, Z. A novel generative adversarial network for estimation of trip travel time distribution with trajectory data. Transp. Res. Part C Emerg. Technol. 2019, 108, 223–244. [Google Scholar] [CrossRef]
- Fu, X.; Nie, Q.; Liu, J.; Khattak, A.; Hainen, A.; Nambisan, S. Constructing spatiotemporal driving volatility profiles for connected and automated vehicles in existing highway networks. J. Intell. Transp. Syst. 2021, 26, 572–585. [Google Scholar] [CrossRef]
- Abdulhafedh, A. Road Crash Prediction Models: Different Statistical Modeling Approaches. J. Transp. Technol. 2017, 7, 190–205. [Google Scholar] [CrossRef]
- Arvin, R.; Khattak, A.J.; Kamrani, M.; Rio-Torres, J. Safety evaluation of connected and automated vehicles in mixed traffic with conventional vehicles at intersections. J. Intell. Transp. Syst. Technol. Plan. Oper. 2020, 25, 170–187. [Google Scholar] [CrossRef]
- Mussah, A.R.; Adu-Gyamfi, Y. Extracting Driving Volatility from Connected Vehicle Data in Exploring Space-Time Bivariate Relationships with Crashes in the City of Saint Louis. Transp. Res. Interdiscip. Perspect. 2019, 2, 100029. [Google Scholar]
- Hauer, E. The Art of Regression Modeling in Road Safety; Springer: New York, NY, USA, 2015. [Google Scholar] [CrossRef]
- Zhao, H.; Yu, H.; Li, D.; Mao, T.; Zhu, H. Vehicle Accident Risk Prediction Based on AdaBoost-SO in VANETs. IEEE Access 2019, 7, 14549–14557. [Google Scholar] [CrossRef]


Publisher’s Note: MDPI stays neutral with regard to jurisdictional claims in published maps and institutional affiliations. |
© 2022 by the authors. Licensee MDPI, Basel, Switzerland. This article is an open access article distributed under the terms and conditions of the Creative Commons Attribution (CC BY) license (https://creativecommons.org/licenses/by/4.0/).