Article

Examining the Factors Influencing E-Tax Declaration Usage among Academics’ Taxpayers in Jordan

1
Department of Accounting, School of Business, The University of Jordan, Amman 11942, Jordan
2
Department of Accounting, Faculty of Administrative & Financial Sciences, University of Petra, Amman 11196, Jordan
3
Department of Marketing, School of Business, The University of Jordan, Amman 11942, Jordan
*
Author to whom correspondence should be addressed.
Informatics 2022, 9(4), 92; https://doi.org/10.3390/informatics9040092
Submission received: 13 September 2022 / Revised: 28 October 2022 / Accepted: 9 November 2022 / Published: 14 November 2022

Abstract

:
Purpose: This research attempts to profoundly understand the factors influencing the usage of e-tax declarations. Design/methodology/approach: In a cross-sectional survey, partial least square-structural equation modeling (PLS-SEM) is used to examine the hypotheses on 182 academic taxpayers working in Public Universities in Jordan. Findings: The findings indicate that knowledge, subjective norms, and attitude play a vital role in taxpayers’ usage of e-tax declarations. Moreover, knowledge confirms the power of the Theory of Planned Behavior (TPB), which helps predict people’s behavior. However, the results reveal that awareness does not moderate the previously mentioned relationship. Research limitations/implications: The sample size is limited, and the participants were academics who work at public universities. Therefore, it is advisable to study larger sample size to confirm the study’s results. Moreover, further research could diversify the sample in terms of occupation, digital divide, and e-literacy, as these factors may significantly impact e-tax declaration usage. A comparison across various groups would be beneficial in gaining a better understanding of the demographics and variables that impact the use of e-tax declarations. The second limitation is the collection of mainly quantitative data; collecting qualitative data to further understand the main factors that could affect the usage of e-services would play a role in supporting the study’s findings. Practical implications: This study provides strategic guidance for Jordanian policymakers in improving citizens’ acceptance of mandatory e-services usage by affecting their knowledge, attitude, and subjective norms. As a result, these practical suggestions positively influence taxpayers’ usage of e-services, which contributes to their usage of optional ones. E-service adoption rates may rise by emphasizing their benefits, such as improving equity, efficiency, life quality, and limiting adverse environmental effects. Originality/value: This study expands the scope of mandatory public e-services research.

1. Introduction

The rapid proliferation of Information and Communication Technology (ICT) has fundamentally revolutionized the way governments operate, particularly as technologies continue to bridge us closer together in light of the ongoing ICT advancements [1]. Dramatic changes have been made in people’s use of digital communication methods as a consequence of the period of self-isolation and contagion. As a result, both public and private sectors need to reinvent themselves to be in line with these changes [2]. Although there has been a significant and discernible improvement, the public sector tends to fall behind in the process of implementing new technologies and business reinvention [3].
There is a reasonable doubt that the low acceptance by citizens of e-services in developing countries is still evident despite the quality of services provided by governments [4]. It is argued that their low acceptance results from governments’ poor efforts in implementing good governance in terms of transparency, accountability, and anti-corruption [5]. As a result, their citizens are used to dealing with poor services and corruption which plays a role in their uncertainty and trust in e-government adoption which has already been conceived [6].
Furthermore, public trust in governmental organizations plays a moderating role in the acceptance of governmental services [7]. Those countries that have higher public trust from their citizens have the advantage of implementing services much more efficiently than those with a lower public trust [7], due to citizens voluntarily abiding by regulations and demands of governments without aggressively resisting them [8]. It is argued that increasing citizens’ knowledge regarding governmental policies and allowing them open access to data as well as informing them of the benefits of using e-services shape their attitude and intention in the adoption of the e-services [5].
Moreover, economic inequality is prevalent in developing countries, meaning that e-governmental services will be accessible only to those privileged in a population which could further contribute to corruption and rising economic inequality [9]. Additionally, developing countries often have poor IT infrastructures which further strains the government’s efforts to implement the use of e-governmental services; the need to build a solid technological infrastructure is necessary to ensure equal access to all citizens, including reliable electricity and Internet access [9].
Jordan is a developing country in the Middle East, that has recently been following the trend of moving towards transforming services using ICTs. There are several projects and initiatives that have been carried out by the Jordanian government aimed to accomplish digital transformation across all governmental sectors such as “digital educational content, open government information and data”. According to the Ministry of Digital Economy and Entrepreneurship, digital transformation has numerous advantages, including reduced time and cost, increased flexibility and efficiency in production and data processing, improved quality, streamlined procedures, and the ability to provide innovative and creative services that are not possible with traditional methods [10].
In 2018, the Income and Tax Department digitalized tax filing which is one of their most essential services. Since the 1920s, the department conducted a conventional filing system for PIT Return (Personal income tax Return) until the Electronic Tax Filing (ETF) was first launched in 2005 to facilitate PIT Return services provided by tax authorities to taxpayers [11]. The application of ETF is intended to enhance competitiveness through cost reduction and timesaving compared with conventional filing systems. It is also intended to enhance compliance with tax law and uncover tax evasion [12].
In 2018, ETF became mandatory for all taxpayers in Jordan, including all citizens with an annual income of more than JOD 10,000 (Income Sales Tax Department, 2018). Total income tax revenue collected during the first seven months from this year or about 413 million dinars which is accounted for 34.3% from total revenue amounted 1.225 billion dinars within the first seven months of this year [13]. The ministry of finance later amended the tax law to require all citizens with an annual income of JOD 9000 to provide ETF. Hence, the Finance Ministry directed the efforts toward producing a user-friendly interface for the ETF system, making it more convenient for taxpayers to provide their Income Tax Declaration through e-tax means. According to several researchers, the main factors impacting the use of e-tax PIT Return are user satisfaction, technology acceptance and knowledge, incentives to use, and social influence [14].
The adoption of the e-tax PIT Return System is expected to increase the trust between taxpayers and tax authorities by enhancing the efficiency of tax performance in Jordan, in addition to better compliance with tax law and hence higher tax collection [15].
Digitalizing services yields efficiency and better flexibility in processing collected data, subsequently improving the overall quality of provided services. It also reduces the time and cost compared with the traditional paper processing [
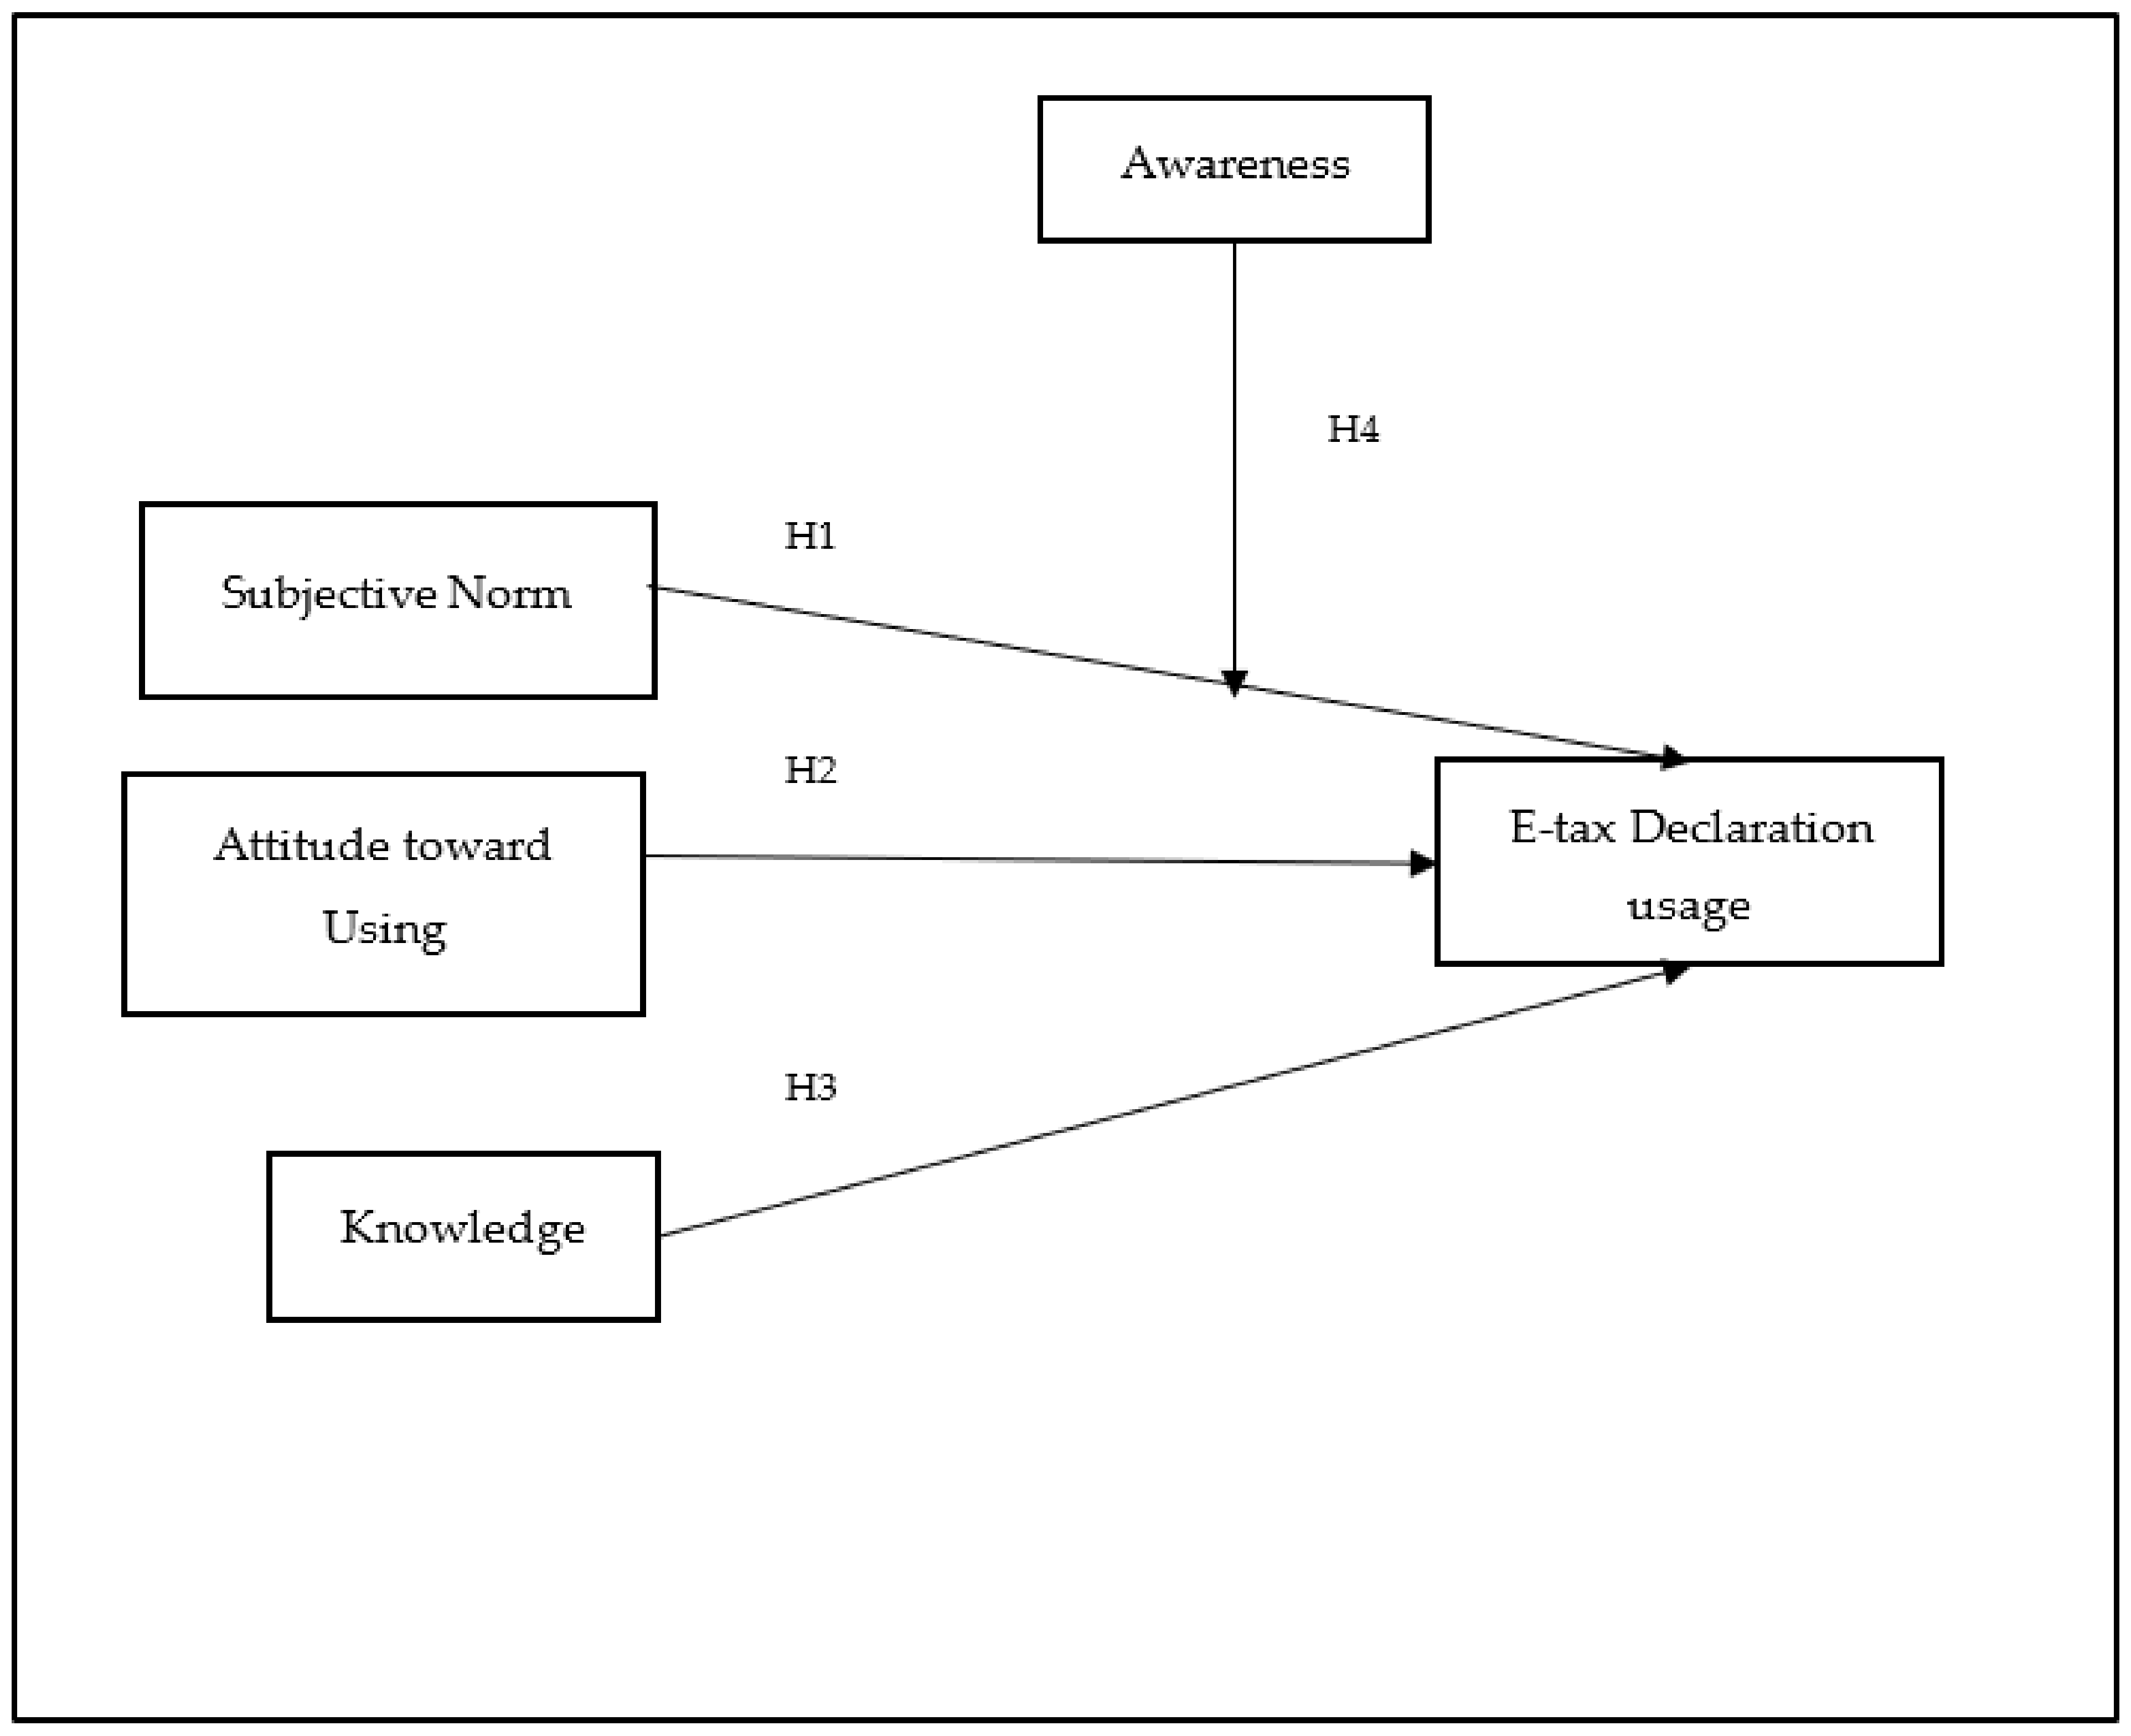
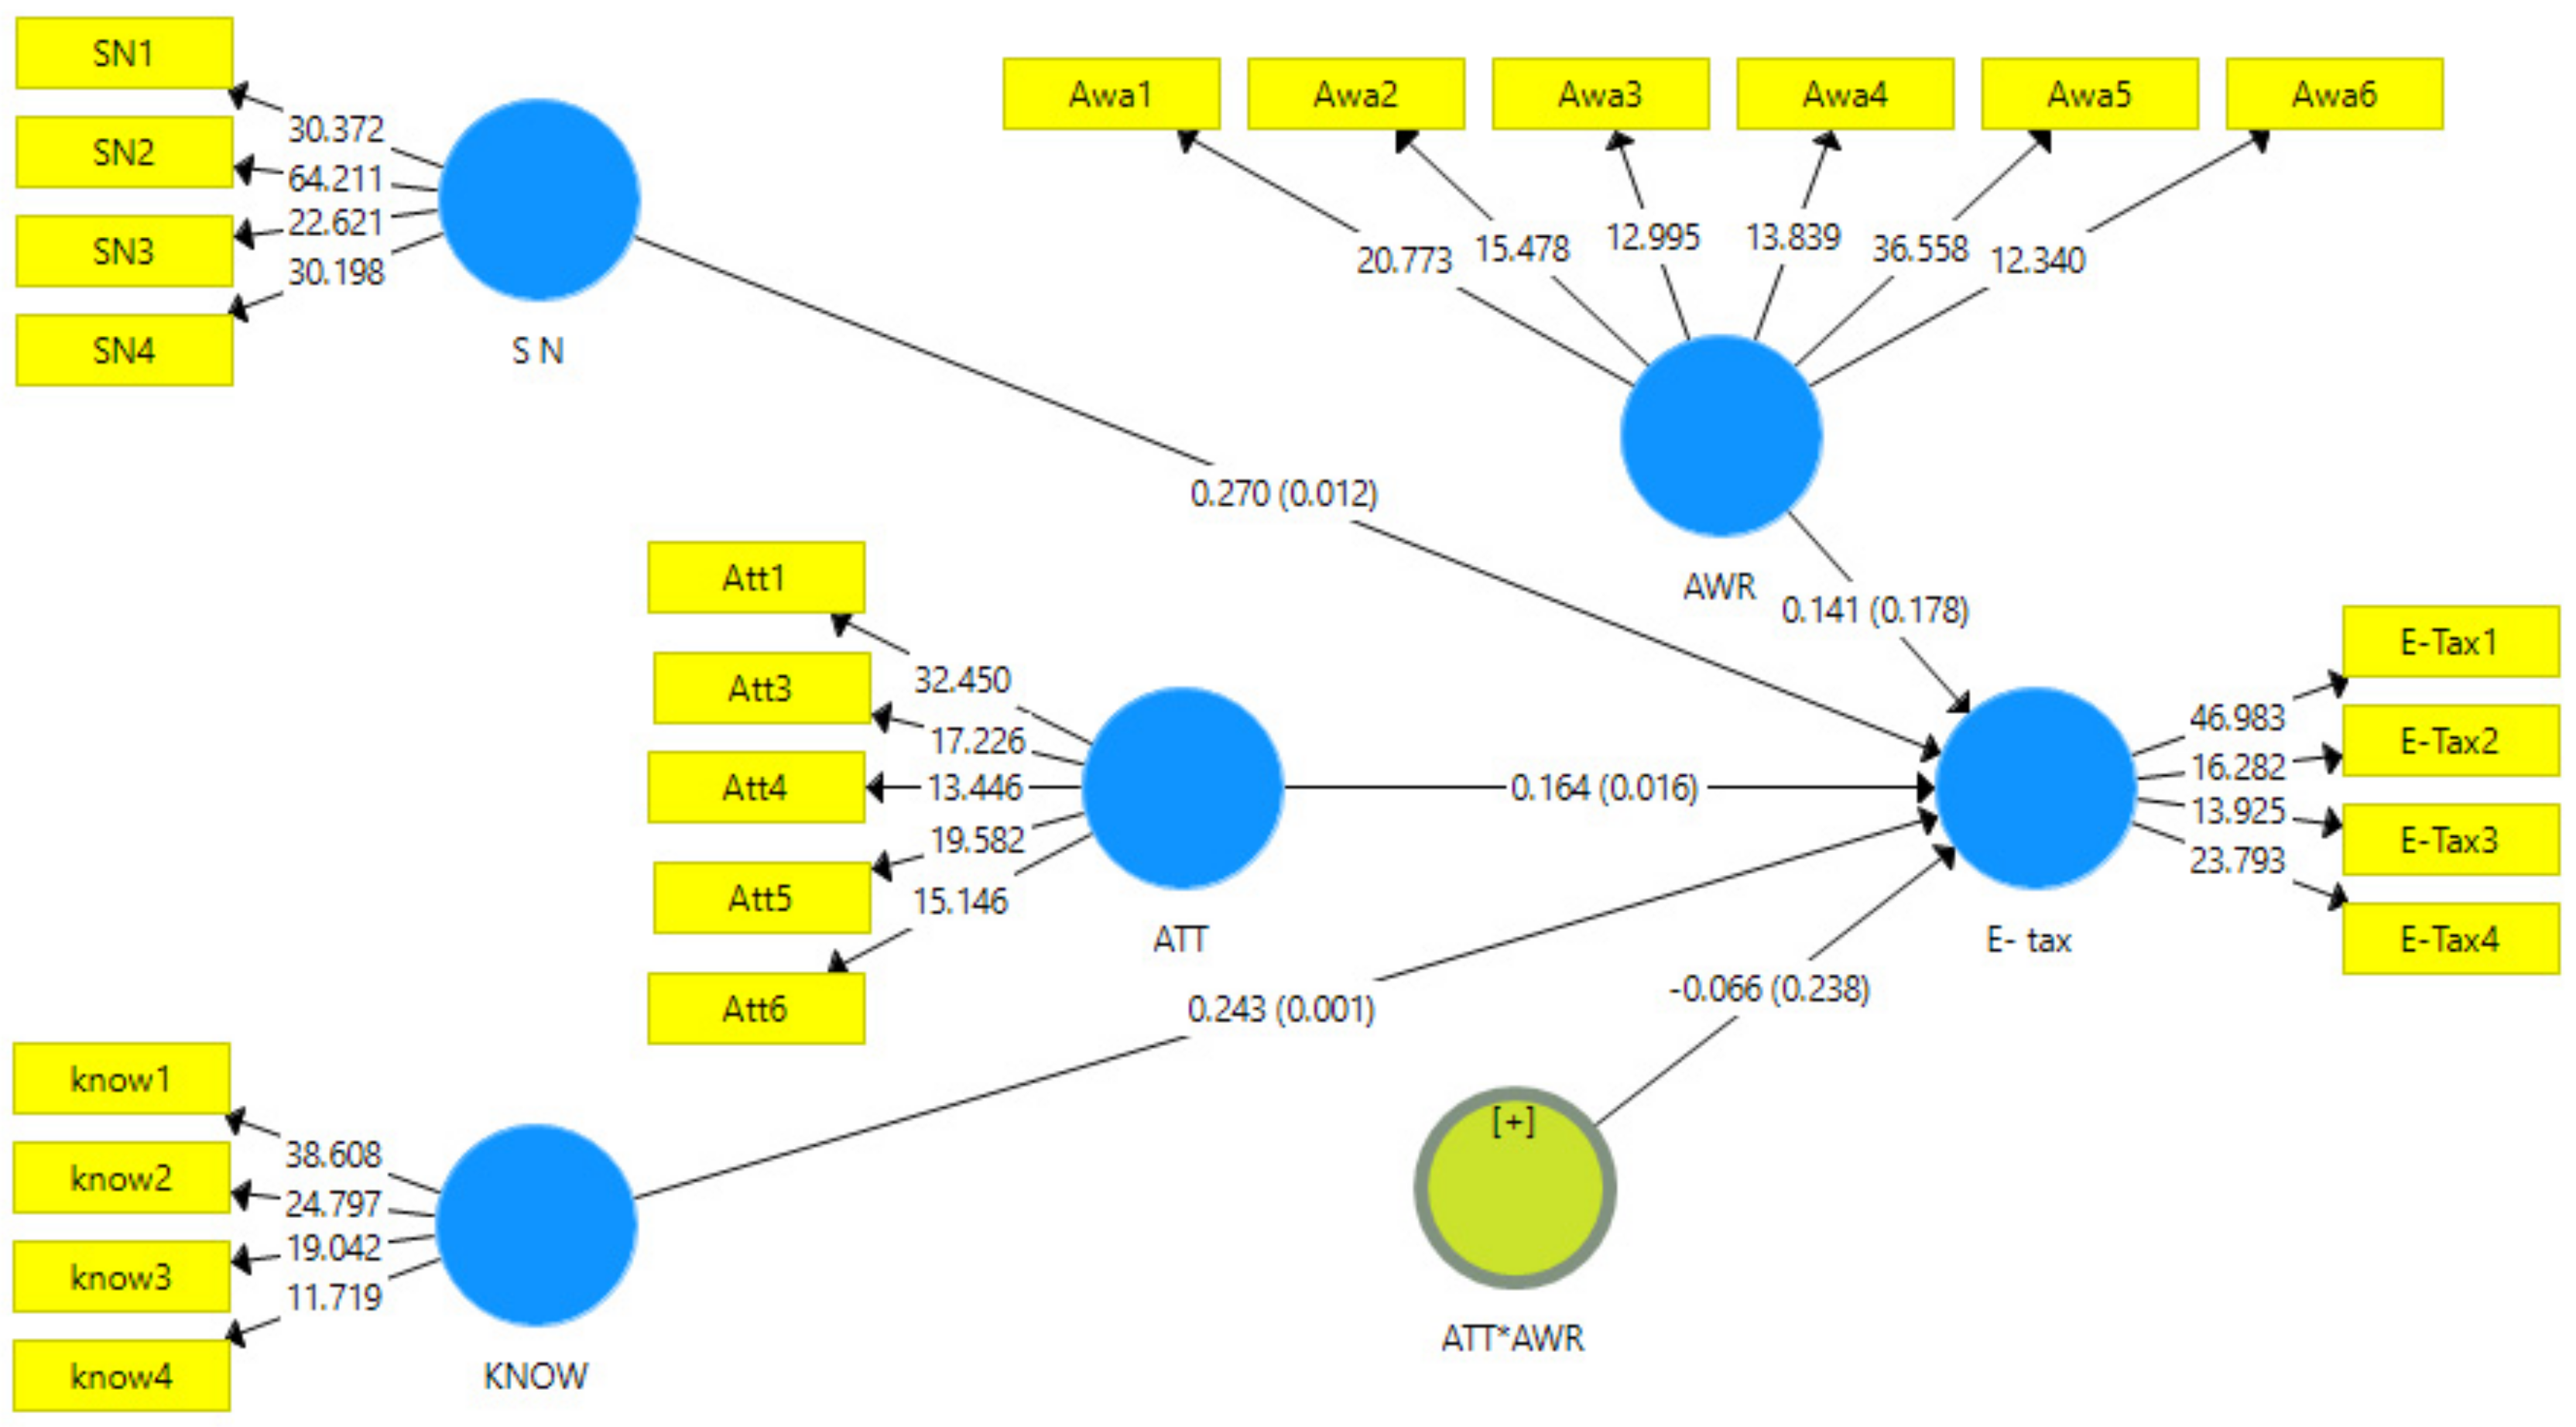
16]. However, the factors impacting the users’ usage of digital services, including e-tax filing, are still largely unexplored. Therefore, this paper aims to shed light on factors that determine the e-tax declaration usage.
This paper proceeds as follows: the next section presents the literature and related theories. The third section discusses the methodology while the fourth section introduces the analyses and results. The fifth section discusses the results while the sixth section shows the contribution of this study. Lastly, and finally, the seventh section presents the limitations and the agenda for future research.

2. Model Development and Hypotheses

2.1. Theory and Hypotheses Development

Among theories regarding Information Technology acceptance and Information Systems, The Theory of Planned Behavior (TPB) developed by [15,16] is designed to explain user behavior. TPB suggests that people’s behavior is a function of three theoretically independent factors known as the direct constructs of the theory, namely, attitude toward the behavior, social norms, and perceived behavioral control [17]. Attitude refers to a person’s overall evaluation of a particular behavior [18]. Subjective norms refer to the belief about whether most people approve or disapprove of specific behavior. Perceived behavioral control refers to an individual’s perception of the potential challenges and hurdles involved in engaging in a specific behavior [18]. Generally, the more favorable the attitude and social norm, the higher should be the individual’s intention to engage in the behavior in question [19].
Over the past decades, TPB has been considered one of the most well-known social-psychological models for analyzing human behavior [18]. Due to its robustness, TPB has been used in several e-service adoption-related domains, including mobile payment [20], the internet of things [21], and digital banking and payment [22]. Therefore, using this theory as the fundamental foundation for this study is appropriate to comprehend how citizens behave when using e-tax declaration services.
According to [18], TPB framework is open to further expansions if new constructs can effectively affect the variance in intention, which can be translated into a change in that given behavior. Several scholars have successfully expanded the theory by adding independent factors that are viewed to be important in a particular context. This study extends the TPB by adding two factors: knowledge and awareness. Previous research on the acceptance of information systems suggests that knowledge is a success factor that may influence the adoption of using e-services [23]. Additionally, awareness has a significant impact on one’s intention to use e-services [24]. Therefore, this study extends the TPB model to include these two factors.
The theoretical model in TPB reflects the prediction of volitional behaviors as it adds a factor called the Perceived Behavioral Control, which can be defined as how a person perceives their ability to perform a particular behavior [25]. Moreover, the availability of resources aids in people’s control over their behavior. For example, if a user owns a PC, then that user’s acceptance of new technology is expected [16].
According to TPB, Perceived Behavioral Control serves two functions. The first factor influences behavioral intention, whereas the second factor influences actual behavior [16,18]. As shown in Figure 1, the major components stated in the TPB, such as subjective norms, attitude toward using, and actual usage, are reflected in the proposed model of the current research. Furthermore, knowledge and awareness were incorporated as external components in the proposed model to provide a more comprehensive understanding of the attitudinal and behavioral aspects that may influence academics’ activities in the context of e-tax declaration usage in Jordan.

2.2. Subjective Norm

The TRA defines subjective norm as the extent to which one’s attention is influenced by the opinions of other societal members when making a significant decision [19]. Subjective norm is comparable to social influence in the model of PC use [18], the Unified Theory of Acceptance and Use of Technology (UTAUT) model [20,21], and image in the innovation dissemination theory [22]. According to several previous studies, subjective norms positively impact the adoption of online systems [14]. In the parameters of this research, because academics might be influenced by the advice of colleagues around them at the university, subjective norms may have a significant impact toward compliance with e-tax declaration systems. This leads to the subsequent hypothesis:
H1: 
There is a positive relationship between subjective norm and e-tax declaration usage.

2.3. Attitude toward Using

In this research, the subjective norm is the antecedent factor determining the attitude which in turn influences a special behavior. According to [19], there is considerable evidence supporting the relationship between attitude and intention to use, which influences actual usage. It is noteworthy to mention that the relationship between attitude and intention to use or actual usage has received much attention. For example, there was a positive connection between attitude regarding department co-branded credit cards and intention to use or continue to use them [24]. In the context of e-tax declaration systems, attitude can have a significant impact on a university professor’s attitude regarding the use of e-tax declarations. The following hypothesis would be supported by this substantial evidence of a link between attitude and actual usage:
H2: 
There is a positive relationship between attitude and e-tax declaration usage.

2.4. Knowledge

Although knowledge was not derived from the initial TPB factors, previous research on information systems suggests that knowledge as a success factor may influence the acceptance of new systems, particularly people’s adoption of using e-services [23,26]. Ref. [5] suggested that greater knowledge of e-services, their benefits, and how transparently they are implemented may help in increasing their acceptance rate. In theory, greater knowledge may improve a user’s ability to judge how much action is required to use new systems [25]. In the context of this research, academics are likely to swiftly adopt e-tax declaration systems, and their continued use is expected due to their realistic expectations being met after using these systems. As a result, it is expected that the likelihood of using e-tax declaration systems will grow as university professors become more aware of the benefits of these systems. The following hypothesis is formulated to investigate the influence of knowledge on the actual e-tax declaration usage:
H3: 
There is a positive relationship between knowledge and e-tax declaration usage.

2.5. Awareness

This research will investigate the effect of awareness in moderating the relationship between subjective norms and e-tax declaration usage. Awareness is defined as the degree to which a consumer is aware of electronic services [27]. Usually, individuals lack sufficient information on services that newly exist. Therefore, increasing awareness of the advantages of new technologies increases the possibility of adopting those technologies. Furthermore, spreading financial awareness and literacy could be highly critical for e-services acceptance [28]. As the government raises public awareness, citizens will become better informed on the benefits and importance of adopting e-services; e-tax declaration usage. These benefits may include quicker, cheaper processes and more precise procedures [7], which may support their beliefs and encourage them to adopt specific behavior patterns; which may be complementary to what their friends and beloved ones believe they should do. Furthermore, according to [26], awareness plays an essential role in the adoption of mobile banking services. Hence, the moderated hypothesis is formulated:
H4: 
Awareness moderates the relationship between subjective norm and e-tax declaration usage.

3. Methodology

3.1. Sample and Data Collection

An online questionnaire was used in the current study to collect data to examine the proposed hypotheses. A purposive sampling method was used to identify and gain access to participants who could provide relevant information and insights into the subject under investigation [29,30]. Within the specific context of this study, the purposive sampling was restricted to academics working in public universities. The reason behind that was to ensure that all participants earnt a salary subject to income tax, mandating the use of an e-tax declaration. Furthermore, because Jordan’s public universities are located in the north, middle, and south of the country, participants from these universities would reflect a complete geographical coverage of Jordan, representing the whole Jordanian population rather than just a specific area.
The online survey was designed via “Google Forms” and distributed through email and other social media platforms between August and October 2021. Further, given the COVID-19 pandemic, an online questionnaire was preferable to collect the data [31,32], owing to its advantages in terms of access to individuals in distant locations, speed of response, and ease of automated data collection [33]. The total number of usable questionnaires that were analyzed was 184. Based on G-Power 3.1 Instrument [34] and sample-to-item ratio, which is 5-to-1, the minimum sample size is 111 and 120; respectively; hence, the sample is considered adequate.

3.2. Measurement Instruments

The first part of the questionnaire consisted of an introduction explaining the purpose of the survey and assuring confidentiality of the data collected. The second part consisted of the factors affecting the intention of e-tax declaration usage (subjective norm, knowledge, attitude toward using, awareness). Finally, the last part includes questions related to the participants’ demographic information. The constructs were adapted from previously validated instruments [35]. The attitude toward using e-tax declaration was measured using six items adapted from [24]. Second, subjective norms were assessed using four items, and the source scale was adapted from [36]. Third, six items were used to assess awareness, and four items to assess knowledge were adapted from [35]. This study employs a seven-point Likert-type scale to evaluate levels of agreement with a given statement to eliminate the dilemma of choosing between two undesirable options and guarantee the respondents’ objective validity [37]. The measurement items are given in Table 1.

4. Data Analysis and Results

This section discusses four main sub-sections related to data analysis and results which are: demographic characteristics, data screening, measurement model assessment, hypotheses testing, and finally, the predictive relevance of the model and the suggested relationships.

4.1. Demographic Characteristics

In the gender category, the study sample comprised 128 men (71%) and 52 women (29%). The majority of the respondents (60%) were less than 45 years old. The participants came from different schools and backgrounds such as Information Technology (16%), Engineering (15%), Business (14%), and Sciences (10%). In terms of marital status, the descriptive analysis indicated that (69%) of the respondents were married, (22%) were single, and (8%) other. Table 2 provides a detailed description of the demographic characteristics of respondents.

4.2. Data Screening

Although Partial Least Square (PLS) does not demand normally distributed data [38], extremely non-normally distributed data has been proven to be problematic. As a result, it is critical to validate that the collected data does not deviate significantly from a normal distribution curve. Two common tests were used to check the data normality: skewness and kurtosis statistics. The results revealed that skewness values varied from (−0.405 and 0.232) and kurtosis values varied from (−0.767 and 0.545), all of which were within the threshold value [39].
Furthermore, for the purposes of this study, data was collected from a single source at a certain point in time, which in turn may lead to common method variance or bias [40]. Two statistical tests were used to evaluate the common method variance issue: (a) [41] single factor test and (b) full collinearity (VIF-factor level) test [42,43]. By applying Principal Component Analysis (Extraction Method), an un-rotated principal component (single factor) analysis, indicated that 34.4% of the total variance was less than 50%, as advised by [44]. In the full collinearity test, the variance inflation factor (VIF) values of maximum constructs were less than 5 [45], indicating that common method variance does not exist in this study [46], as shown in Table 3. In conclusion, the results of [41] single factor and full collinearity (VIF-factor level) tests show that there is no common method variance in this study.
The correlation matrix and VIF, carried out to check the latent variable’s collinearity, were investigated in this study. High collinearity across predictors causes a collinearity threat [38]. However, the highest correlation coefficient in this study was valued at 0.583 between subjective norm and awareness, which is less than the 0.70 thresholds [46]. This indicates that there is no problem with collinearity. Furthermore, as proposed by [42,47], a full collinearity test is a comprehensive procedure for the simultaneous assessment of both vertical and lateral collinearity. In this regard, if all VIFs resulting from a full collinearity test are equal to or lower than 3.3, the model can be considered free of common method bias [43]. This study also looked at VIF factor levels and found minimal collinearity because the respective (VIF) was between 1.434 and 1.797, which is below the common cut-off value of 3.3. As shown in Table 4, the findings of the correlation matrix and VIF suggest that there is no problem with multicollinearity.

4.3. Measurement Model Assessment

Reliability and validity were evaluated to assess the measurement model quality (outer model). Internal consistency reliability, such as Cronbach’s Alpha (α) [48] and Composite Dependability (CR) [49], was used to assess reliability in this study. The results in Table 5 shows that Cronbach’s alpha and CR values for all constructs (e.g., ATT, AWR, KNOW, SN and E-tax) were higher than 0.70 as recommended by [46]. Two methods were used to evaluate the validity: convergent validity and discriminant validity. To assess convergent validity, factor outer loadings and average variance extracted (AVE) were used. The results of the first run of the PLS algorithm revealed that out of twenty-four indicators, only one indicator failed to achieve the minimum required loading value, namely, ATT3 with a loading value of 0.248; therefore, it was deleted from the measurement model. The other indicators have loading values higher than 0.70; hence, they remained part of the measurement model. Table 5 shows the reliability coefficients and convergent validity for the various constructs.
Discriminant validity was assessed using [50] criterion and cross-loadings. The results in Table 6 shows that AVE’s square root for each variable was higher than the variable shared with other variables [46]. Moreover, a cross-loading factor of items with the relevant variable was higher than the other variables; [51] used Heterotrait–Monotrait Ratio (HTMT) of Correlations as another method for discriminant validity, and the study constructs show HTMT values to be less than 0.90 [52]. As a result, the measurement model met all the reliability and validity tests, indicating that it is suitable for structural model analysis and hypothesis testing.

4.4. Structural Model Analysis: Hypotheses Testing

The results for testing the direct relationships are shown in Table 7 and Figure 2. The results show that subjective norm (H1) (β = 0.269, t = 2.420, p = 0.012), attitude (H2) (β = 0.160, t = 2.406, p = 0.016), and knowledge (H3) (β = 0.242, t = 3.742, p = 0.001) all had a significant direct positive effect on e-tax declaration usage. Hence, Hypotheses 1, 2, and 3 were accepted.
The study examines the moderating effect of awareness in the relationship between attitude and e-tax declaration usage by using the product-indicator method using PLS-SEM [53]. The exogenous construct (attitude) and moderator construct (awareness) items were multiplied by two groups of items [54]. These multiplied items revealed that the latent interaction construct (shown in Figure 2 as ATT*AWR) influences the endogenous construct (e-tax declaration usage). Table 6 shows that awareness does not affect the relationships between attitude and the usage of e-tax declarations (β = −0.063, t = 1.1812, and p = 0.238). As a result, hypothesis 4 was rejected.

4.5. Predictive Relevance of the Model and the Suggested Relationships; R2, Effect Size (ƒ2), and Predictive Relevance (Q2)

According to [55], R2 values of 0.75, 0.50, and 0.25 are considered substantial, moderate, and weak, respectively. Based on the R2 values in Table 8, the study model explained 45.2% of e-tax declaration usage variance, indicating moderate explanation power, 22.4 % of attitude variance, and 24.8% of subjective norm variance, both of which indicate weak explanation power.
The role of each predictor in this study’s model is evaluated using effect size analysis. According to [55], ƒ2 values of 0.35, 0.15, and 0.02 are considered significant, moderate, and minor effects, respectively, whereas ƒ2 values of less than 0.02 imply no effect on an independent variable. As shown in Table 7, the results show that knowledge has a medium effect on subjective norms but a minor effect on e-tax declaration usage. The subjective norm has a moderate effect on both attitude and e-tax declaration usage. In addition, attitude and awareness have a moderate impact on the use of e-tax declarations.
Moreover, Q2 is an additional tool for evaluating the predictive accuracy of the structural model (Geisser, 1974; Stone, 1974). Ref. [55] stated that the smaller the difference between the predicted and original values, the higher the Q2 criterion and, as a result, the prediction accuracy and relevance of the model. The study utilized a blindfolding process to assess predictive accuracy and, as illustrated in Table 8, the study model accurately predicted subjective norm (Q2 = 0.190), attitude (Q2 = 0.136), and e-tax declaration usage (Q2 = 0.301). Hence, the prediction accuracy of this model met the rule of thumb of Q2 > 0 [56].

5. Discussion

This study aims to assess the factors affecting e-tax declaration usage among academic taxpayers in Jordan. In particular, how subjective norms, attitudes and knowledge impact e-tax declaration usage. Moreover, the study investigates the moderating role of awareness in the relationship between attitude and e-tax declaration usage.
The theoretical model of the study was developed based on TPB’s assumptions [25]. Four hypotheses were developed and tested as follows; subjective norm was hypothesized to have a positive and direct effect on e-tax declaration using; attitude and knowledge were hypothesized to have a positive and direct effect on e-tax declaration usage; moreover, awareness was introduced as a moderator between subjective norms and e-tax declaration usage.
The results of the structural model analysis confirmed the TBP’s assumptions by providing evidence of the Jordanian perspective on knowledge and awareness, the two external constructs to TPB. Despite the fact that knowledge is found to have a positive effect on e-tax declaration usage, the results of the study do not provide evidence on the moderating effect of awareness in the relationship between attitude and e-tax declaration usage. This result could be justified by looking at the descriptive statistics of awareness which indicated a high mean value (see Table 4). These values reflect a high level of awareness by the majority of respondents (academics in public universities). Thus, the statistical techniques may not be able to capture the moderating effect awareness in this case. The results, however, supported the direct positive effect of subjective norms, knowledge and attitude on e-tax deceleration usage.
The limited volume of research in this area increases the importance of this study; moreover, using structural equation modeling allows the factors examined in this paper to be used as both independent and dependent variables in the model [57]. For example, we could assess the influence of usage attitude on e-tax declaration usage and, simultaneously, measure the influence of other variables such as subjective norms and attitudes toward using e-services. This would lead to suggesting that the variables in the research model interact with each other in ways that directly influence e-tax declaration usage among academic taxpayers. Hence, the findings of this paper provide strategic guidance for Jordanian policymakers in improving citizens’ acceptance of mandatory e-services usage by enhancing their knowledge, attitude, and subjective norms.

6. Conclusions

This study broadens the scope of mandatory public e-services research as it aimed to explore the effect of knowledge and subjective norms on e-tax deceleration usage. The findings show that knowledge, subjective norms and attitudes play a positive key role in using the e-tax declaration. Yet, the awareness does not moderate the relationship between subjective norms and e-tax.
This study has numerous practical implications. The findings show that decision-makers in government must acknowledge the critical impact of subjective norms on e-tax declaration usage in terms of how people’s perceived benefits of utilizing these services influence other people’s decisions to use them. Therefore, the responsibility falls on policymakers in launching broad educational campaigns about the benefits of e-services and their convenience, in an attempt to influence perception to motivate people to share their perceptions with their families and peers. Thus, policymakers should encourage people to share their experiences and comments on various social media platforms regarding the potential benefits of e-services in general and e-tax declarations usage in particular.
This study also revealed that knowledge has a significant impact on e-tax declaration usage; as a result, policymakers should deliver marketing messages that clarify the goals of using e-services such as improving equity, efficiency and life’s quality as well as increasing their knowledge in those terms so that citizens can grasp the concept behind using such services and shape their attitude and intention.
Moreover, the study revealed that attitude plays a vital role in influencing e-tax declaration usage both directly and indirectly, therefore, it is critical to change people’s attitudes toward mandatory e-services. Policymakers’ promotional efforts should focus on the numerous advantages of moving services from a traditional manual to an online system, which saves time by eliminating the need for people to pay a visit to the Income-tax department and wait in line. Furthermore, it processes all calculations instantly, resulting in greater transparency and clarity in financial transactions. As a result, people’s overall evaluation of e-tax declarations usage may change. This may impact people’s intentions to begin using optional online services, which, in turn, aids in the development of a sustainable society and environmental protection. Furthermore, citizens’ willingness in using these services is an essential aspect that plays a significant role in citizens’ perceptions of their relationship with the government. Therefore, the citizens must not feel obligated in engaging in e-services.

7. Limitation and Future Research

Despite the significant contributions this study provides to theory and practice, there are some limitations present in this study. Firstly, it is recognized that the sample size was limited to academics in Jordanian public universities, and therefore, it is advisable to expand participants from other taxpayers to confirm the results. Moreover, the selected participants were all working in public universities. Diversifying the sample in terms of occupation, digital divide, and e-literacy would be recommended for future research, this is because these factors may have a major impact on the usage of e-tax declarations. Second, the variables in the study were solely measured using quantitative data. As a result, future research might integrate qualitative and quantitative data to confirm this study’s findings and uncover the main drivers behind the adoption of e-services. Finally, the approach adopted in this study was gaining a general holistic view of the factors affecting the attitude toward e-tax declarations usage. Therefore, this study was limited to a one-year cross-sectional analysis; as a result, the frequent changes in tax law are not adequately incorporated. Future research could explore the effect of the changes in tax law on the main factors affecting e-services adoption by employing a longitudinal research design. This could help us discover what might happen if the tax laws change and confirm whether the conclusions of this study are correct. Moreover, future studies may test the current research model using data from other countries.

Author Contributions

Conceptualization, H.A.-M. and A.R.A.N.; methodology, H.A.-M.; software, A.R.A.N.; validation, F.S., H.Z. and G.A.R.; formal analysis, H.A.-M.; investigation, F.S.; resources, A.R.A.N.; data curation, H.Z. and A.R.A.N.; writing—original draft preparation, H.A.-M.; writing—review and editing, F.S. and H.Z.; visualization, G.A.R.; supervision, H.A.-M. and F.S.; project administration, H.A.-M. All authors have read and agreed to the published version of the manuscript.

Funding

This research received no external funding.

Institutional Review Board Statement

Not applicable.

Informed Consent Statement

Informed consent was obtained from all subjects involved in the study.

Data Availability Statement

Not applicable.

Conflicts of Interest

The authors declare no conflict of interest.

References

  1. Valencia, K.; Rusu, C.; Quiñones, D.; Jamet, E. The Impact of Technology on People with Autism Spectrum Disorder: A Systematic Literature Review. Sensors 2019, 19, 4485. [Google Scholar] [CrossRef] [PubMed] [Green Version]
  2. Alzahrani, L.; Al-Karaghouli, W.; Weerakkody, V. Analysing the critical factors influencing trust in e-government adoption from citizens’ perspective: A systematic review and a conceptual framework. Int. Bus. Rev. 2017, 26, 164–175. [Google Scholar] [CrossRef]
  3. Ndou, V. E–Government for developing countries: Opportunities and challenges. Electron. J. Inf. Syst. Dev. Ctries. 2004, 18, 1–24. [Google Scholar] [CrossRef]
  4. Soneka, P.N.; Phiri, J. A Model for Improving E-Tax Systems Adoption in Rural Zambia Based on the TAM Model. Open J. Bus. Manag. 2019, 7, 908–918. [Google Scholar] [CrossRef] [Green Version]
  5. Susanto, T.D.; Aljoza, M. Individual Acceptance of e-Government Services in a Developing Country: Dimensions of Perceived Usefulness and Perceived Ease of Use and the Importance of Trust and Social Influence. Procedia Comput. Sci. 2015, 72, 622–629. [Google Scholar] [CrossRef] [Green Version]
  6. Abusamhadana, G.A.; Bakon, K.A.; Elias, N.F. E-Government in Ghana: The benefits and challenges. Abusamhadana, GAO, Bakon KA, & Elias NF (2021)" E-Government in Ghana: The Benefits and Challenges". Asia-Pac. J. Inf. Technol. Multimed. 2021, 10, 124–140. [Google Scholar]
  7. Jameel, A.; Asif, M.; Hussain, A.; Hwang, J.; Sahito, N.; Bukhari, M.H. Assessing the Moderating Effect of Corruption on the E-Government and Trust Relationship: An Evidence of an Emerging Economy. Sustainability 2019, 11, 6540. [Google Scholar] [CrossRef] [Green Version]
  8. Jameel, A.; Asif, M.; Hussain, A. Good Governance and Public Trust: Assessing the Mediating Effect of E-Government in Pakistan. Lex Localis-J. Local Self-Gov. 2019, 17, 299–320. [Google Scholar] [CrossRef]
  9. Dada, D. The Failure of E-Government in Developing Countries: A Literature Review. Electron. J. Inf. Syst. Dev. Ctries. 2006, 26, 1–10. [Google Scholar] [CrossRef]
  10. Adaileh, M.; Alshawawreh, A. Measuring digital transformation impact in Jordan: A proposed framework. J. Innov. Digit. Mark. 2021, 2, 15–28. [Google Scholar]
  11. Akel, S.A.A.; Ibrahim, M. The Factors Effecing E-Filing Adoption Among Jordanian Firms: The Moderating Role Oftrust. Palarch’s J. Archaeol. Egypt/Egyptol. 2020, 17, 14–31. [Google Scholar]
  12. Hammouri, Q.; Abu-Shanab, E. Exploring the factors influencing employees’ satisfaction toward e-tax systems. Int. J. Public Sect. Perform. Manag. 2017, 3, 169–190. [Google Scholar] [CrossRef]
  13. Department, I.S.T. 13% Increase in Tax Revenue. Available online: https://istd.gov.jo/En/NewsDetails/13_increase_in_tax_revenue (accessed on 25 October 2022).
  14. Al-Okaily, M.; Al Natour, A.R.; Shishan, F.; Al-Dmour, A.; Alghazzawi, R.; Alsharairi, M. Sustainable FinTech Innovation Orientation: A Moderated Model. Sustainability 2021, 13, 13591. [Google Scholar] [CrossRef]
  15. Maswadeh, S.N.; Hanandeh, T.S. The Effect of Computerized Tax Services in Improving Tax Performance Moderated by Governance. J. Asian Finance, Econ. Bus. 2020, 7, 1167–1174. [Google Scholar] [CrossRef]
  16. Entrepreneurship, T.M.o.D.E.a. Jordan Digital Transformation Strategy. 2020. Available online: https://www.modee.gov.jo (accessed on 1 November 2022).
  17. Fishbein, M.; Ajzen, I. Predicting and Changing Behavior: The Reasoned Action Approach; Psychology Press: London, England, 2011. [Google Scholar]
  18. Ajzen, I. The theory of planned behavior. Organ. Behav. Hum. Decis. Process 1991, 50, 179–211. [Google Scholar] [CrossRef]
  19. De Leeuw, A.; Valois, P.; Ajzen, I.; Schmidt, P. Using the theory of planned behavior to identify key beliefs underlying pro-environmental behavior in high-school students: Implications for educational interventions. J. Environ. Psychol. 2015, 42, 128–138. [Google Scholar] [CrossRef]
  20. Sun, S.; Law, R.; Schuckert, M. Mediating effects of attitude, subjective norms and perceived behavioural control for mobile payment-based hotel reservations. Int. J. Hosp. Manag. 2019, 84, 102331. [Google Scholar] [CrossRef]
  21. Mital, M.; Chang, V.; Choudhary, P.; Papa, A.; Pani, A.K. Adoption of Internet of Things in India: A test of competing models using a structured equation modeling approach. Technol. Forecast. Soc. Chang. 2018, 136, 339–346. [Google Scholar] [CrossRef]
  22. Alkhowaiter, W.A. Digital payment and banking adoption research in Gulf countries: A systematic literature review. Int. J. Inf. Manag. 2020, 53, 102102. [Google Scholar] [CrossRef]
  23. Chen, C. Perceived risk, usage frequency of mobile banking services. Manag. Serv. Qual. Int. J. 2013, 23, 410. [Google Scholar] [CrossRef]
  24. Venkatesh, V.; Morris, M.G.; Davis, G.B.; Davis, F.D. User acceptance of information technology: Toward a unified view. MIS Q. 2003, 27, 425–478. [Google Scholar] [CrossRef] [Green Version]
  25. Ajzen, I. From Intentions to Actions: A Theory of Planned Behavior. In Action Control; Kuhl, J., Beckmann, J., Eds.; Springer: Berlin/Heidelberg, Germany, 1985; pp. 11–39. [Google Scholar]
  26. Mohammadi, H. A study of mobile banking loyalty in Iran. Comput. Hum. Behav. 2015, 44, 35–47. [Google Scholar] [CrossRef]
  27. Lee, I.; Choi, B.; Kim, J.; Hong, S.-J. Culture-Technology Fit: Effects of Cultural Characteristics on the Post-Adoption Beliefs of Mobile Internet Users. Int. J. Electron. Commer. 2007, 11, 11–51. [Google Scholar] [CrossRef]
  28. Literacy, S.F.a.B. Central Bank of Jordan. Available online: http://www.cbj.gov.jo/Pages/viewpage.aspx?pageID=202 (accessed on 27 October 2022).
  29. Seale, C.; Gobo, G.; Gubrium, J.F.; Silverman, D. Qualitative Research Practice; Sage: London, UK, 2007. [Google Scholar]
  30. Palinkas, L.A.; Horwitz, S.M.; Green, C.A.; Wisdom, J.P.; Duan, N.; Hoagwood, K. Purposeful Sampling for Qualitative Data Collection and Analysis in Mixed Method Implementation Research. Adm. Policy Ment. Health Ment. Health Serv. Res. 2015, 42, 533–544. [Google Scholar] [CrossRef] [PubMed] [Green Version]
  31. Sharma, G. Pros and cons of different sampling techniques. Int. J. Appl. Res. 2017, 3, 749–752. [Google Scholar]
  32. Taherdoost, H. Sampling methods in research methodology; how to choose a sampling technique for research. Int. J. Acad. Res. Manag. 2016, 5, 8–27. [Google Scholar] [CrossRef]
  33. Ball, H.L. Conducting online surveys. J. Hum. Lact. 2019, 35, 413–417. [Google Scholar] [CrossRef] [Green Version]
  34. Memon, M.A.; Ting, H.; Cheah, J.-H.; Thurasamy, R.; Chuah, F.; Cham, T.H. SAMPLE SIZE FOR SURVEY RESEARCH: REVIEW AND RECOMMENDATIONS. J. Appl. Struct. Equ. Modeling 2020, 4, 1–20. Available online: https://jasemjournal.com/wp-content/uploads/2020/08/Memon-et-al_JASEM_-Editorial_V4_Iss2_June2020.pdf (accessed on 1 November 2022). [CrossRef]
  35. Oladapo, I.A.; Hamoudah, M.M.; Alam, M.; Olaopa, O.R.; Muda, R. Customers’ perceptions of FinTech adaptability in the Islamic banking sector: Comparative study on Malaysia and Saudi Arabia. J. Model. Manag. 2021. [Google Scholar] [CrossRef]
  36. Khatimah, H.; Halim, F. The effect of attitude and its decomposed, perceived behavioral control and its decomposed and awareness on intention to use e-money mobile in Indonesia. J. Sci. Res. Dev. 2016, 3, 39–50. [Google Scholar]
  37. Finstad, K. Response interpolation and scale sensitivity: Evidence against 5-point scales. J. Usability Stud. 2010, 5, 104–110. [Google Scholar]
  38. Cheah, J.; Amran, A.; Yahya, S. External oriented resources and social enterprises’ performance: The dominant mediating role of formal business planning. J. Clean. Prod. 2019, 236, 117693. [Google Scholar] [CrossRef]
  39. Abdollahi, A.; Abu Talib, M. Emotional intelligence moderates perfectionism and test anxiety among Iranian students. Sch. Psychol. Int. 2015, 36, 498–512. [Google Scholar] [CrossRef]
  40. Podsakoff, P.M.; MacKenzie, S.B.; Podsakoff, N.P. Sources of method bias in social science research and recommendations on how to control it. Annu. Rev. Psychol 2012, 63, 539–569. [Google Scholar] [CrossRef] [Green Version]
  41. Harman, H.H. Modern Factor Analysis; University of Chicago Press: Chicago, CA, USA, 1976. [Google Scholar]
  42. Kock, N.; Lynn, G. Lateral collinearity and misleading results in variance-based SEM: An illustration and recommendations. J. Assoc. Inf. Syst. 2012, 13, 40. [Google Scholar] [CrossRef] [Green Version]
  43. Kock, N. Common Method Bias: A Full Collinearity Assessment Method for PLS-SEM. In Partial Least squares Path Modeling; Springer: Berlin/Heidelberg, Germany, 2017; pp. 245–257. [Google Scholar]
  44. Kumar, V.; Tiwari, J. Order reducing of linear system using clustering method factor division algorithm. Int. J. Appl. Inf. Syst. 2012, 3, 1–4. [Google Scholar]
  45. Falahat, M.; Lee, Y.-Y.; Soto-Acosta, P.; Ramayah, T. Entrepreneurial, market, learning and networking orientations as determinants of business capability and international performance: The contingent role of government support. Int. Entrep. Manag. J. 2021, 17, 1759–1780. [Google Scholar] [CrossRef]
  46. Hair Jr, J.F.; Sarstedt, M.; Ringle, C.M.; Gudergan, S.P. Advanced Issues in Partial Least Squares Structural Equation Modeling; saGe: Los Angeles, CA, USA, 2017. [Google Scholar]
  47. Al Natour, A.R.; Meqbel, R.; Kayed, S.; Zaidan, H. The Role of Sustainability Reporting in Reducing Information Asymmetry: The Case of Family-and Non-Family-Controlled Firms. Sustainability 2022, 14, 6644. [Google Scholar] [CrossRef]
  48. Cronbach, L.J.; Meehl, P.E. Construct validity in psychological tests. Psychol. Bull. 1955, 52, 281–302. [Google Scholar] [CrossRef] [Green Version]
  49. Jöreskog, K.G. Simultaneous factor analysis in several populations. Psychometrika 1971, 36, 409–426. [Google Scholar] [CrossRef]
  50. Fornell, C.; Larcker, D.F. Structural Equation Models with Unobservable Variables and Measurement Error: Algebra and Statistics; Sage CA: Los Angeles, CA, USA, 1981. [Google Scholar]
  51. Henseler, J.; Ringle, C.M.; Sarstedt, M. A new criterion for assessing discriminant validity in variance-based structural equation modeling. J. Acad. Mark. Sci. 2015, 43, 115–135. [Google Scholar] [CrossRef] [Green Version]
  52. Gold, A.H.; Malhotra, A.; Segars, A.H. Knowledge Management: An Organizational Capabilities Perspective. J. Manag. Inf. Syst. 2001, 18, 185–214. [Google Scholar] [CrossRef]
  53. Chin, W.W. PLS-Graph User’s Guide; CT Bauer College of Business, University of Houston: Houston, TX, USA, 2001; Volume 15, pp. 1–16. [Google Scholar]
  54. Henseler, J.; Fassott, G. Testing Moderating Effects in PLS Path Models: An Illustration of Available Procedures. In Handbook of Partial Least Squares; Vinzi, V., Wynne, W., Chin, W., Henseler, J., Eds.; Springer: Berlin/Heidelberg, Germany, 2010; pp. 713–735. ISBN 978-3-540-32825-4. [Google Scholar]
  55. Sarstedt, M.; Ringle, C.M.; Hair, J.F. Treating unobserved heterogeneity in PLS-SEM: A multi-method approach. In Partial Least Squares Path Modeling; Springer: Berlin/Heidelberg, Germany, 2017; pp. 197–217. [Google Scholar]
  56. Hair, J.F., Jr.; Sarstedt, M.; Hopkins, L.; Kuppelwieser, V.G. Partial least squares structural equation modeling (PLS-SEM): An emerging tool in business research. Eur. Bus. Rev. 2014, 26, 21–106. [Google Scholar]
  57. Teo, T. Factors influencing teachers’ intention to use technology: Model development and test. Comput. Educ. 2011, 57, 2432–2440. [Google Scholar] [CrossRef]
Figure 1. Research Model.
Informatics 09 00092 g001
Figure 2. Structural model.
Informatics 09 00092 g002
Table 1. The Measurement Items.
Construct CodeMeasurement Items
Attitude Toward UsingATT 1I believe using an e-tax declaration for filling my income tax declaration is a good idea
ATT 2The e-tax declaration platform makes related operations faster
ATT 3I will feel confident when I use e-tax declaration for my transactions with the Income Tax Department.
ATT 4e-tax declaration will encourage me to transact online
ATT 5e-tax declaration makes transactions with the Income Tax Department more efficient
ATT 6e-tax declaration is user-friendly
AwarenessAWR 1I am familiar with the benefit of e-tax declaration.
AWR 2 I am aware of the importance of e-tax declaration in filling my income text declaration.
AWR 3 I am not concerned about using an e-tax declaration.
AWR 4I have been exposed to the types of e-tax declarations.
AWR 5 I am not interested to use an e-tax declaration at all. R
AWR 6I do not know much about e-tax declaration. R
KnowledgeKNOW 1I know how to use e-tax declaration.
KNOW 2I know it is better to use an e-tax declaration in filling my income text declaration.
KNOW 3I am usually interested to know more about e-tax declaration.
KNOW 4Using e-tax declaration will provide an opportunity to control my income text declaration
Subjective NormSN 1My family believes that using e-tax declaration will provide better services
SN 2My colleagues consider that using e-tax declaration is convenient.
SN 3People around me use e-tax declaration for filling their income text declaration
SN 4My friends think that filling their income text declaration using an E-tax declaration is better than the manual traditional system.
E-tax Declaration UsageE-tax 1I intend to use an e-tax declaration when filling my income text declaration.
E-tax 2I will feel comfortable when I use e-tax declaration in the future
E-tax 3I strongly recommend the use of e-tax declaration
E-tax 4I am interested in using e-tax declaration
Table 2. Demographic characteristics of the respondents.
Demographic CriteriaFrequencyPercentage
Gender
Male 12871%
Female5329%
Age
Less than 355229%
35–445731%
45–543218%
55–642815%
65 and above127%
School/Faculty
Art169%
Science 1910%
Business 2514%
IT 2916%
Engineering 2815%
Pharmacy 169%
Medicine 148%
Other 3419%
Marital status
Single3922%
Married12469%
Other 189%
Table 3. Common Method Variance/Bias via full Collinearity Analysis.
ATTAWRE-TaxKNOWSN
Attitude Toward Using (ATT) 1.4290.1640.1040.148
Awareness (AWR)1.775 0.1450.2620.311
E-tax Declaration Usage (E-tax)1.7391.773 0.2700.270
Knowledge (KNOW)1.6301.5610.249 0.128
Subjective Norm (SN)1.8211.7000.2870.146
Table 4. Correlation Matrix and Collinearity statistics (VIF).
FactorsMeanVIFCorrelation Matrix
E-TaxATTAWRE-TaxKNOWSN
Attitude Toward Using (ATT)4.0751.4341
Awareness (AWR)4.2791.7970.4741
E-tax Declaration Usage (E-tax)4.535-0.4700.5221
Knowledge (KNOW)4.3971.5500.4210.5320.5361
Subjective Norm (SN)4.6131.7270.4730.5830.5710.4981
Table 5. Reliability and Convergent Validity.
Construct/ItemOuter LoadingαCRAVE
Attitude Toward Using 0.8600.8990.640
ATT 10.847
ATT 2Deleted
ATT 30.778
ATT 40.780
ATT 50.817
ATT 60.775
Awareness 0.8720.9040.611
AWR 10.803
AWR 2 0.756
AWR 3 0.765
AWR 40.749
AWR 5 0.861
AWR 60.751
Knowledge 0.8590.9040.704
KNOW 10.890
KNOW 20.860
KNOW 30.841
KNOW 40.759
Subjective Norm 0.9010.9310.771
SN 10.872
SN 20.905
SN 30.876
SN 40.859
E-tax Declaration Usage 0.8610.9060.707
E-tax 10.880
E-tax 20.818
E-tax 30.794
E-tax 40.868
Table 6. Discriminant Validity (Fornell–Larcker’s criterion and HTMT).
a. Fornell–Larcker’s Criterion
ATTAWRE-TaxKNOWSN
Attitude Toward Using (ATT)0.800
Awareness (AWR)0.4740.782
E-tax Declaration usage (E-tax)0.4700.5220.841
Knowledge (KNOW)0.4210.5320.5360.839
Subjective Norm (SN)0.4730.5830.5710.4980.878
b. HTMT Ratio
Attitude Toward Using (ATT)-
Awareness (AWR)0.537
E-tax Declaration Usage (E-tax)0.5380.595
Knowledge (KNOW)0.4890.6120.617
Subjective Norm (SN)0.5280.6520.6460.564-
Table 7. Direct and indirect path coefficient and hypotheses testing.
HPathBetaT-Valuep-ValueDecision
H1Sub Norm ⟶ E-tax0.2692.4200.012Accepted
H2ATT ⟶ E-tax 0.1602.4060.016Accepted
H3Know ⟶ E-tax 0.2423.7420.001Accepted
H4ATT*AWR ⟶ E-tax−0.0631.0740.238Rejected
Table 8. R2, Effect size (ƒ2), and Predictive relevance (Q2).
R2Effect Size (ƒ2)Q2
SNATTE-Tax
Attitude Toward Using (ATT)0.224 0.0320.136
Awareness (AWR) 0.021
E-tax Declaration Using (E-tax)0.452 0.301
Knowledge (KNOW) 0.330 0.069
Subjective Norm (SN)0.248 0.2890.0740.190
Publisher’s Note: MDPI stays neutral with regard to jurisdictional claims in published maps and institutional affiliations.

