The Impact of Socioeconomic Status on Pediatric Facial Trauma

Abstract
Introduction
Pediatric Facial Trauma Database
Socioeconomic Status and Pediatric Facial Trauma
Materials and Methods
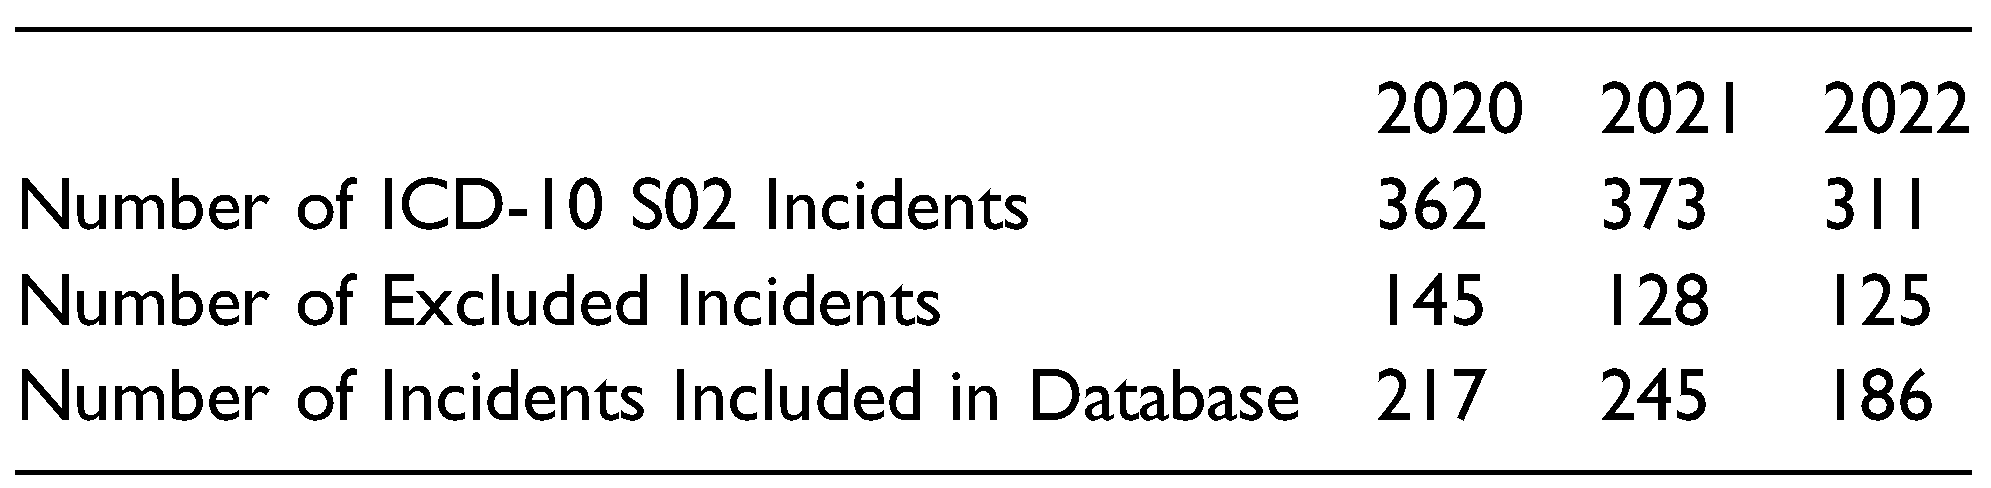
Database Creation
Data Analysis
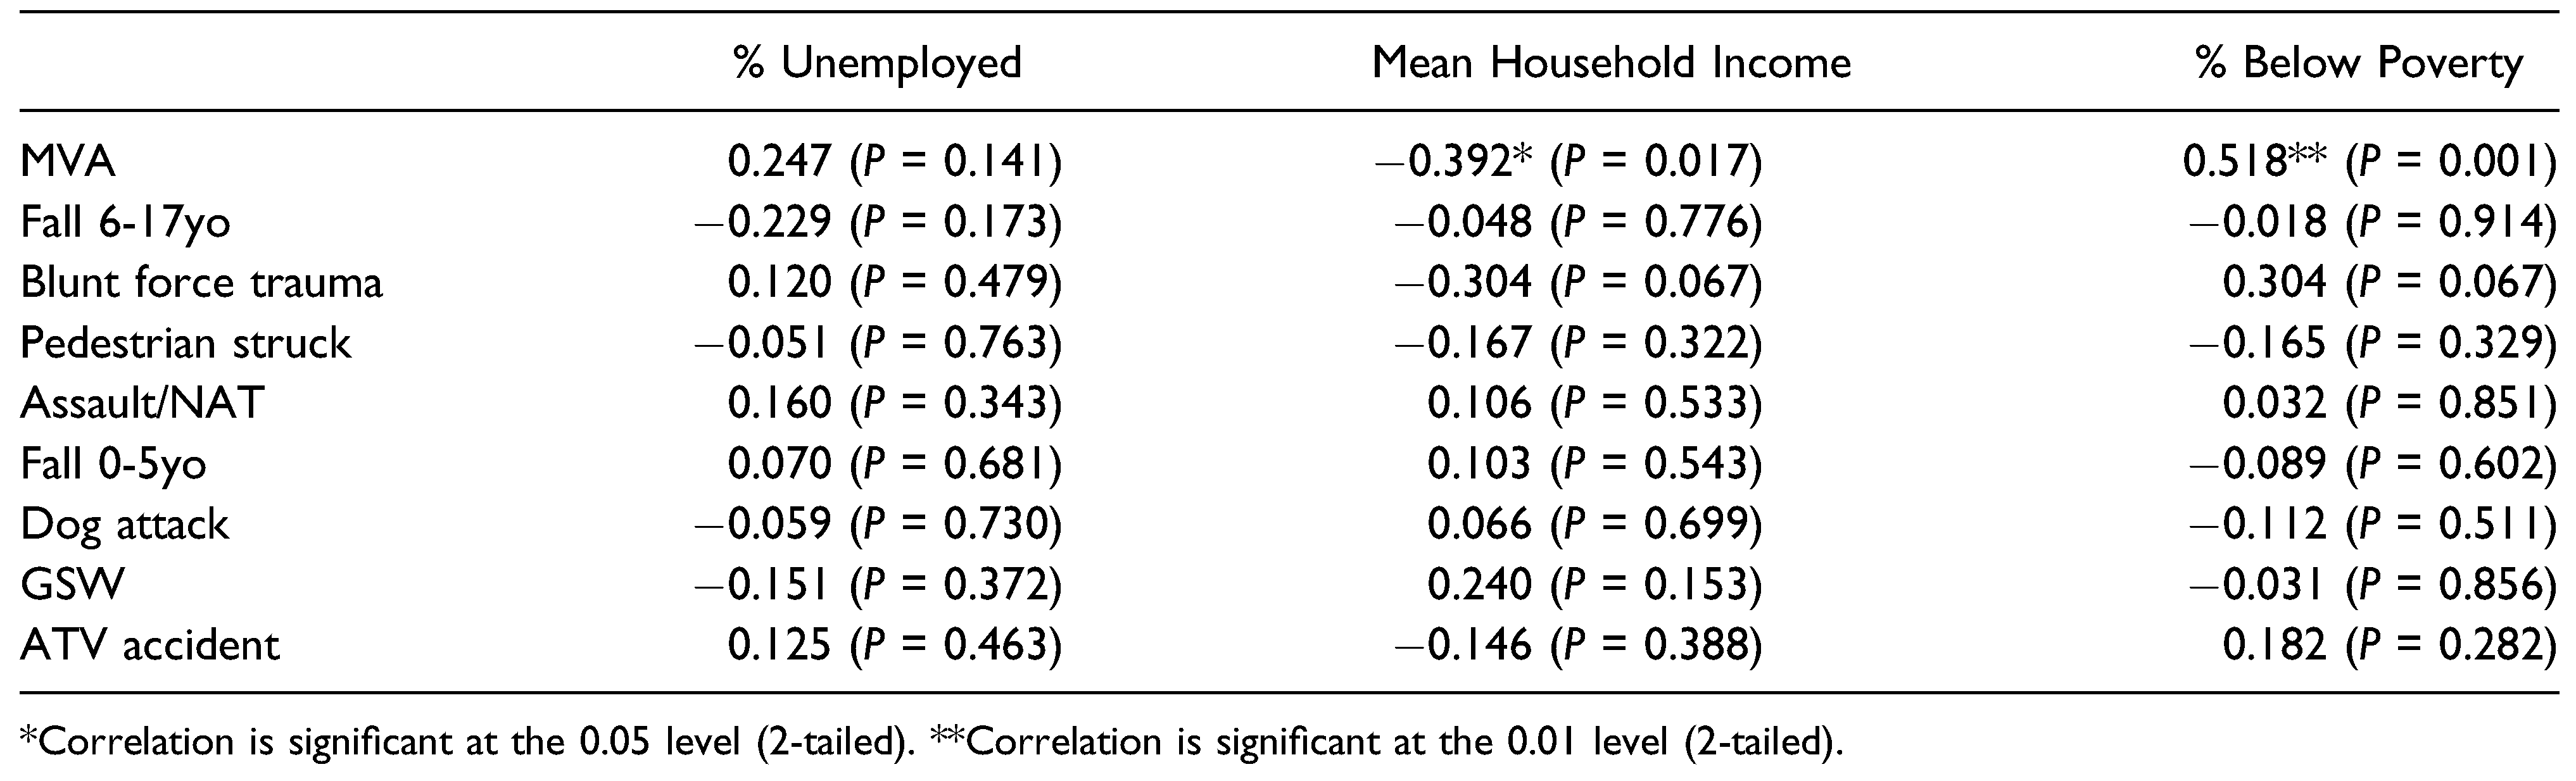
Results
Discussion
Supplementary Materials
Funding
Conflicts of Interest
References
- Andrew, T.W.; Morbia, R.; Lorenz, H.P. Pediatric Facial Trauma. Clin. Plast. Surg. 2018, 46, 239–247. [Google Scholar] [CrossRef]
- Flynn-O'Brien, K.T.; Fallat, M.E.; Rice, T.B.; Gall, C.M.; Nance, M.L.; Upperman, J.S.; Gourlay, D.M.; Crow, J.P.; Rivara, F.P. Pediatric Trauma Assessment and Management Database: Leveraging Existing Data Systems to Predict Mortality and Functional Status after Pediatric Injury. J. Am. Coll. Surg. 2017, 224, 933–944e5. [Google Scholar] [CrossRef] [PubMed]
- Tew, K.; You, J.; Pircher, S. Validation of patient demographic data, Northern Territory hospitals, 2008. Health Gains Planning, DHF. 2008. [Google Scholar]
- Ryan, M.L.; Thorson, C.M.; Otero, C.A.; et al. Pediatric facial trauma: a review of guidelines for assessment, evaluation, and management in the emergency department. J Craniofac Surg. 2011, 22, 1183–1189. [Google Scholar] [PubMed]
- Alcalá-Galiano, A.; Arribas-García, I.J.; Martín-Pérez, M.A.; Romance, A.; Montalvo-Moreno, J.J.; Juncos, J.M. Pediatric facial fractures: children are not just small adults. Radiographics 2008, 28, 441–461. [Google Scholar] [PubMed]
- Imahara, S.D.; Hopper, R.A.; Wang, J.; Rivara, F.P.; Klein, M.B. Patterns and Outcomes of Pediatric Facial Fractures in the United States: A Survey of the National Trauma Data Bank. J. Am. Coll. Surg. 2008, 207, 710–716. [Google Scholar] [CrossRef] [PubMed]
- Xue, A.S.; Maricevich, R.S.; Braun, T.L. Differences in the Management of Pediatric Facial Trauma. Semin. Plast. Surg. 2017, 31, 118–122. [Google Scholar] [CrossRef] [PubMed]
- Svider, P.F.; Bobian, M.; Hojjat, H.; et al. A chilling reminder: pediatric facial trauma from recreational winter activities. Int J Pediatr Otorhinolaryngol. 2016, 87, 78–82. [Google Scholar] [CrossRef] [PubMed]
- World Health Organization. (nd) Social Determinants of Health. World Health Organization. Available online: https://www.who.int/health-topics/social-determinants-of-health#tab=tab_1.
- Centers for Disease Control and Prevention. NCHHSTP Social Determinants of Health. Centers for Disease Control and Prevention; 2019. Available online: https://www.cdc.gov/nchhstp/socialdeterminants/faq.html#:~:text=An_individual%27s_socioeconomic_position_can,the_communities_they_interact_wit.
- Shin, E.K.; Mahajan, R.; Akbilgic, O.; Shaban-Nejad, A. Sociomarkers and biomarkers: predictive modeling in identifying pediatric asthma patients at risk of hospital revisits. NPJ Digit. Med. 2018, 1, 50. [Google Scholar] [CrossRef] [PubMed]
- McCann, A. Cities with most & least economic class diversity. WalletHub. 2021. Retrieved January 8, 2023. Available online: https://wallethub.com/edu/ cit-ies-with-the-most-least-economic-class-diversity/10321.
- Harris, P.A.; Taylor, R.; Thielke, R.; Payne, J.; Gonzalez, N.; Conde, J.G. Research electronic data capture (REDCap)—A metadata-driven methodology and workflow process for providing translational research informatics support. J. Biomed. Inform. 2009, 42, 377–381. [Google Scholar] [CrossRef] [PubMed]
- Harris, P.A.; Taylor, R.; Minor, B.L.; Elliott, V.; Fernandez, M.; O'Neal, L.; McLeod, L.; Delacqua, G.; Delacqua, F.; Kirby, J.; Duda, S.N.; REDCap Consortium. The REDCap consortium: Building an international community of software platform partners. J. Biomed. Inform. 2019, 95, 103208. [Google Scholar] [CrossRef]
- U.S. Census Bureau. DP03: selected economic characteristics. 2022. Available online: https://data.census.gov/table?t=Employment.
- IBM Corp. IBM SPSS Statistics for Macintosh, Version 28.0; IBM Corp: Armonk, NY, USA, 2021. [Google Scholar]
- Rudersdorf, A. NC County Maps. Government & Heritage Library, State Library of North Carolina; 2010.
- Chen, P.; Voisin, D.R.; Jacobson, K.C. Community violence exposure and adolescent delinquency: examining a spectrum of promotive factors. Youth Soc. 2016, 48, 33–57. [Google Scholar] [CrossRef] [PubMed]
- American Psychological Association. (nd). Violence & Socioeconomic Status. American Psychological Association. Retrieved January 10, 2023. Available online: https://www.apa.org/pi/ses/resources/publications/violence#:%7E:text=Interpersonal_Violence,suffering_from_detrimental_future_outcomes.
- Hletko, P.J.; Hletko, J.D.; Shelness, A.M.; Robin, S.S. Demographic Predictors of Infant Car Seat Use. Am J Dis Child 1983, 137, 1061–1063. [Google Scholar] [CrossRef]
- Webman, R.; Dultz, L.A.; Simon, R.J.; Todd, S.R.; Slaughter, D.B.; Jacko, S.R.; Bholat, O.; Wall, S.M.; Wilson, C.; Levine, D.A.; et al. Helmet use is associated with safer bicycling behaviors and reduced hospital resource use following injury. J. Trauma Acute Care Surg. 2013, 75, 877–881. [Google Scholar] [CrossRef]
- Li, X.; Feigelman, S.; Stanton, B. Perceived parental monitoring and health risk behaviors among urban low-income African-American children and adolescents. J. Adolesc. Health 2000, 27, 43–48. [Google Scholar] [CrossRef] [PubMed]
- Li, Z.; Li, Z.-B. Characteristic Changes of Pediatric Maxillofacial Fractures in China During the Past 20 Years. J. Oral Maxillofac. Surg. 2008, 66, 2239–2242. [Google Scholar] [CrossRef] [PubMed]
- Gassner, R.; Tuli, T.; Hächl, O.; Moreira, R.; Ulmer, H. Craniomaxillofacial trauma in children: a review of 3,385 cases with 6,060 injuries in 10 years. J. Oral Maxillofac. Surg. 2004, 62, 399–407. [Google Scholar] [CrossRef] [PubMed]
- Boffano, P.; Roccia, F.; Zavattero, E.; Dediol, E.; Uglešić, V.; Kovačič, Ž.; Vesnaver, A.; Konstantinović, V.S.; Petrović, M.; Stephens, J.; et al. European Maxillofacial Trauma (EURMAT) project: A multicentre and prospective study. J. Cranio-Maxillofacial Surg. 2015, 43, 62–70. [Google Scholar] [CrossRef]


© 2024 by the author. The Author(s) 2024.
Share and Cite
Wright, A.; Hinson, M.; Davidson, A.; Curtis, C.; Runyan, C. The Impact of Socioeconomic Status on Pediatric Facial Trauma. Craniomaxillofac. Trauma Reconstr. 2024, 17, 54. https://doi.org/10.1177/19433875241280214
Wright A, Hinson M, Davidson A, Curtis C, Runyan C. The Impact of Socioeconomic Status on Pediatric Facial Trauma. Craniomaxillofacial Trauma & Reconstruction. 2024; 17(4):54. https://doi.org/10.1177/19433875241280214
Chicago/Turabian StyleWright, Avery, Madison Hinson, Amelia Davidson, Caitrin Curtis, and Christopher Runyan. 2024. "The Impact of Socioeconomic Status on Pediatric Facial Trauma" Craniomaxillofacial Trauma & Reconstruction 17, no. 4: 54. https://doi.org/10.1177/19433875241280214
APA StyleWright, A., Hinson, M., Davidson, A., Curtis, C., & Runyan, C. (2024). The Impact of Socioeconomic Status on Pediatric Facial Trauma. Craniomaxillofacial Trauma & Reconstruction, 17(4), 54. https://doi.org/10.1177/19433875241280214