Abstract
Study Design: Single-institution retrospective financial analysis. Objective: Trauma care is consistently linked to inadequate reimbursement, posing a significant financial burden for large trauma centers. Data show that declining Medicare reimbursement rates have indirectly led to declining payment for all procedures covered by insurance. The goals of this study are to investigate the opportunity cost associated with contemporary surgical management of CMF trauma at our institution and to evaluate longitudinal financial trends. Methods: Patients with operative facial fractures between 2015 and 2022 at Duke University Medical Center were included and compared to patients undergoing general otolaryngology, plastic surgery and oral surgery operations in the same period. Procedural codes, payor type, charges billed, collections, relative value units (RVUs) and other financial data were obtained and analyzed among the 2 patient populations. Comparative analysis was performed to assess the financial trends in data reported previously from 2007–2015. Results: The collection rate at Duke University Medical Center for operatively managed CMF fractures remains significantly lower than non-CMF counterparts. Interestingly, the collection rate gap between CMF and non-CMF surgeries has narrowed when comparing to the data from 2007–2013. This is largely due to a decrease in collection rates for non-CMF procedures from 29.61% (2007–2013) to 26.57% (2015–2022) [p = 0.0001] and an increase in collection rates for CMF procedures from 17.25% (2007–2013) to 18.05% (2015–2022) [p = 0.0001]. Conclusions: Despite a slight improvement of the gap in reimbursement rates for CMF and non-CMF surgeries over the last several years, trauma care continues to have a negative financial impact on health care institutions.
Introduction
Trauma is a leading cause of mortality and morbidity among people under 45 years of age.[1] Care of the injured patient from acute resuscitation through long-term recovery and rehabilitation requires a multidisciplinary team of physicians, nurses, and allied health care professionals. Trauma can affect people of all ages, but disproportionately affects young, working-age patients, which compounds direct socioeconomic burden and significant cost of lifetime productivity losses.[2] Choi et al report that approximately 25% of all injuries reported in the National Trauma Data Bank involve the face, with an estimated annual cost due to emergency department visits alone approaching $1 billion per year.[3,4] The most current United States review of trauma admissions by Wasicek, et al shows the percentage of adult patients undergoing open repair of CMF injuries in their index hospitalization to be 34.3%.[5] A similar study of the pediatric trauma population correspondingly saw approximately 25.8% of trauma admissions undergoing either open or closed management of facial fractures.[6] As the incidence of facial trauma is likely to continue to increase in the years to come,[7] it becomes imperative to thoroughly understand the economic trends in facial trauma and impact on health care institutions.
A variety of procedural-based subspecialties have already evaluated Medicare reimbursement trends over the last several decades, including surgical procedures for craniofacial trauma, reconstructive plastic surgery and otolaryngology.[7,8,9,10,11] These studies showed that Medicare has had a significant decrease in reimbursements over the years when adjusted for inflation. It is well established in the literature that the provision of trauma care is associated with low reimbursement, constituting a financial burden on major trauma centers and providers.[12,13,14,15,16]
A recent survey of economists revealed that ‘opportunity cost’ is considered 1 of the most important concepts in economics.[17] Opportunity cost is generally defined as the value of the best alternative use of the resources committed to a current or planned use. Opportunity cost is not just limited to money but also accounts for waste of human resources, lost time (away from a physician’s standard practice), and other benefits.[10] Numerous studies have investigated multiple aspects of operative facial fracture management. Only 1 article evaluated the opportunity cost of surgical management of craniomaxillofacial (CMF) trauma as it relates to the financial burden of operative facial fracture management.[10] In this study, Moses et al conducted a retrospective financial and productivity analysis between 2007 and 2013 from a Level I trauma center (Duke University Medical Center) that revealed a significant difference between physician professional collection rate for surgical management of CMF trauma and non-CMF surgical patient populations.
The goals of this study are to investigate the opportunity cost of surgical management of CMF trauma at Duke University Medical Center between 2015–2022 and to evaluate the trend over the years by performing a comparative analysis study of the different financial aspects to the data reported by Moses et al.
Patient and Methods
Collection of Patient Data
This study received ethical approval from the Duke University Health System IRB (approval # Pro00113607) on June 01, 2023. This is an IRB-approved retrospective study, all patient information was de-identified and patient consent was not required. Patient data will not be shared with third parties.
For each patient who underwent operative management of facial fractures between 2015 and 2022 at Duke University Medical Center, the following data were collected: date of initial encounter, date of initial procedure, ICD-10 diagnosis code, current procedural terminology code, physician billing, physician payments, number of relative value units (RVUs), and payor type. The physician (professional) charges included were limited to the operative surgeon only. For the payor type, these include commercial insurance, Medicaid, Medicare, and no insurance/self-pay.
Professional charges and collections as well as RVUs for patients undergoing operative management of facial fractures were compared across the general Otolaryngology-Head and Neck Surgery, Facial Plastic Surgery, Oral & Maxillofacial Surgery, and general Plastic Surgery patient population for each of the 5 surgical attendings in the facial trauma call pool at Duke University Medical Center during the study years of 2015 to 2022. These charges and collections were compared against the non-facial trauma operative charges and collections for the same attendings during the same time period.
Cases where the number of charges billed was $0 or the collection rate was greater than 100% were excluded. ICD-10 diagnosis code was first implemented on October 1st 2015 and in order to maintain consistency of diagnosis, patients with ICD-9 diagnosis code who underwent repair of facial fractures in 2015 were excluded.
Statistical Analysis
Data were aggregated by year and overall years, with the number of procedures per year and insurance type presented as frequency counts and percentages with Chi-Squared tests used for comparison between CMF and non-CMF procedures. Collection rate for a given year was defined as the total charges collected that year divided by the total charges billed that year. The collection rate for all years was defined as the total charges collected over the cumulative study years divided by the total charges billed during the cumulative study years. Cochran-Armitage trend tests were used to evaluate whether there were differences in trends of the outcomes between CMF and non-CMF procedures. Since none of the outcomes were distributed normally, Kruskal Wallis tests were used to compare the medians of each outcome for CMF and non-CMF procedures. Finally, Chi-Squared tests were used to compare collection rates from years 2015-2022 to those reported in 2007-2013 for both CMF and non-CMF procedures. Full data analysis was completed using SAS 9.4 (SAS Institute Inc., Cary, NC).
Results
Cohort Characteristics
Our data shows a total of 2459 operatively managed CMF fractures and 9253 operatively managed non-CMF surgeries between 2015-2022. (Table 1)

Table 1.
Characteristics for CMF and Non-CMF Procedures.
The distribution of insurance was different for CMF and non-CMF procedures with Medicaid and Self-Pay making up higher percentages of CMF procedures compared to non-CMF procedures (27.9% and 23.8%, respectively, for CMF procedures compared to 14.6% and 7.7% for non-CMF). For CMF procedures, 21.9% had commercial insurance, 27.9% had Medicaid, 26.5% had Medicare, and 23.8% were self-pay. The 3 most common facial fracture subsites in our CMF cohort were mandible fractures (37.7%) followed by nasal bone fractures (25.09%) then ZMC fractures (18.67%). (Figure 1)
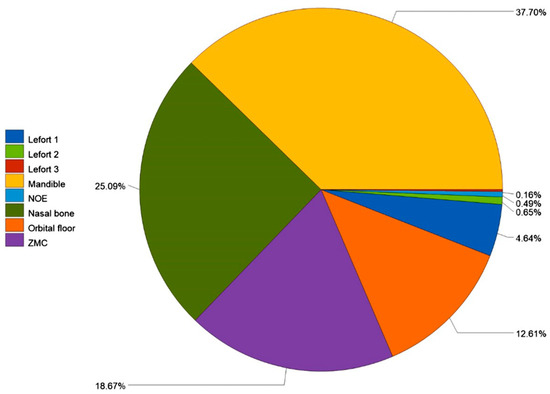
Figure 1.
Facial fractures by subsite.
Financial Analysis
The total sum of charges billed for CMF procedures was $6,639,014 with an average of $2699.88 per procedure. The charges collected in total were $1,198,366.34 with an average of $487.34 per procedure. The collection rate over all years of data was 18.05%, and the total RVUs was 16,929.32. For non-CMF procedures, the total sum of charges billed was $21,352,879, averaging $2307.67 per procedure. The total sum of charges collected was $5,674,031.35, with an average of $613.21 collected per procedure. The total collection rate for non-CMF procedures was 26.57%, and the total RVUs was 68,258.57. (Table 2)
Table 2.
Aggregated Outcome Summaries for CMF and Non-CMF Procedures.
There was no evidence that the trends in collection rate by year differed between CMF and non-CMF procedures (P = 0.9636). However, there was evidence that the trends in RVU, charges billed, and charges collected were different between CMF and non-CMF procedures (P < 0.0001 for all). (Table 3)
Table 3.
Tests for Differences in Outcome Trends for CMF and Non-CMF Procedures*.
The distribution of collection rate was found to differ by procedure type (P < 0.0001). The median collection rate for non-CMF procedures (21.14%) was higher than that of CMF procedures (10.75%). RVUs were distributed similarly for CMF and non-CMF procedures (P = 0.4079). Both charges billed and charges collected were found to have different distributions for CMF and non-CMF procedures (P < 0.0001 for both). The median charges billed for CMF procedures ($2130) was higher than that of non-CMF procedures ($1644). However, the median charges collected for CMF procedures was lower than that of non-CMF procedures ($169.32 and $320.65, respectively). (Table 4)
Table 4.
Comparison of Outcomes Between CMF and Non-CMF Procedures.
Compared to the Data from 2007-2013
Collection rate for each procedure type for data in study conducted by Moses et al (years 2007-2013) were compared to data from 2015-2022. For CMF procedures, there was evidence of a difference in collection rates from 2007-2013 to 2015-2022 (P < 0.0001). The collection rate was higher in 2015-2022 compared to 2007-2013, and the collection rate difference between the rate reported here and that in Moses et al was 0.80% with a 95% confidence interval of (0.76%, 0.85%). (Table 5)
Table 5.
Charges Collected and Charges Billed for CMF Procedures.
For non-CMF procedures, there was also evidence of a difference in collection rates from those reported in the Moses et al paper to those reported here (P < 0.0001). The collection rate was lower in 2015-2022 compared to 2007–2013, and the collection rate difference between the rate reported here and that in Moses et al was —3.03% with a 95% confidence interval of (—3.06%, —3.01%). (Table 6) (Figure 2)
Table 6.
Charges Collected and Charges Billed for Non-CMF Procedures.
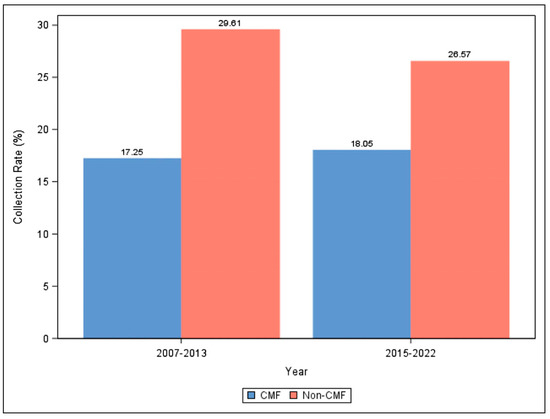
Figure 2.
Collection Rates for CMF and Non-CMF Procedures Reported in Moses et al (2007-2013) and 2015-2022.
Discussion
The lack of clarity in medical finances can have direct effects on quality of patient care, patient and physician satisfaction, cost transparency, and success of health care facilities. Therefore, this study provides awareness of the longitudinal changes in reimbursement rates allowing medical practices, physicians, and other invested industry financial parties to adapt to the fluctuating changes of health care market landscape. The collection rate at Duke University Medical Center for operatively managed CMF fractures remains significantly lower than its non-CMF counterpart. Nonetheless, the collection rate gap between CMF and non-CMF surgeries has narrowed when compared to the data from 2007-2013. This is largely due to notable decrease in collection rates for non-CMF procedures from 29.61% (2007-2013) to 26.57% (2015-2022) and a slight increase in collection rates for CMF procedures from 17.25% (2007-2013) to 18.05% (2015-2022).
The reimbursement rate has shown a close association with patient health care coverage in prior research. A similar variability in coverage types has been observed within our institution.[14] Medicare coverage accounts for about half (51.4%) of the non-CMF cohort compared to 26.5% of the CMF cohort. The Centers for Medicare and Medicaid Services (CMS) determine the conversion factor of RVUs for common procedures, which has a widespread and quantitatively substantial influence over reimbursement rates set by private insurers.[18] Declining Medicare rates can indirectly lead to declining payment for all procedures covered by insurance. In fact, Clemens et al demonstrated that a $1 change in Medicare’s payments for 1 service drives a change of just over $1 in private payments.[19]
Aside from standard price-theoretic considerations that could explain the decrease in non-CMF reimbursement rates over the years, institutional details can have significant influence on physician pricing. First, the reimbursement model linked to the service location has resulted in a notable uptick in services being provided in higher-cost environments, particularly within hospital-based outpatient departments (HOPDs). Over the past 15 years, both the Medicare Payment Advisory Commission (MedPAC) and the Health Care Cost Institute (HCCI) have observed significant shifts from physician offices to HOPDs.[20] This shift is notable for certain low-complexity services, such as many of the non-CMF procedures provided by otolaryngologists, plastic surgeons and oral-maxillofacial surgeons. Hospitals acquire independent physician offices, treating them as off-campus HOPDs for billing purposes. The number of physician practices acquired by hospitals surged from 35,700 to over 80,000 between 2012 and 2018, with 44% of U.S. physicians being employed by hospitals or health systems by the end of that period.[21] Recent research indicates a further escalation, potentially accelerated by the economic impact of COVID-19.[22] This consolidation bolsters the pricing leverage of large hospital systems, giving them the ability to negotiate higher prices with commercial insurers. Consequently, private insurers may favor their customers receiving care at small hospitals rather than large hospital systems.
The relationship between reimbursement rates and opportunity cost for health care providers is evident, whether stemming from individual choice, stipend provision, or contractual obligations in participating in CMF trauma care.[10] Our data strongly indicate a notable financial opportunity cost associated with treating this patient population which contains a large proportion of uninsured/ self-pay patients (23.8%). Moreover, there was no evidence that the trends in collection rate by year differed between CMF and non-CMF procedures which suggests that the legislative actions taken over the years including the Affordable Care Act did not address this issue. Interestingly and despite the discrepancy in reimbursement rates, this study shows that the median RVU between the 2 cohorts did not statistically differ, implying that providing CMF care results in a lower reimbursement rate even when providing similar value-based work.
When compared to a surgeon’s own subspecialty nontrauma-related surgical practice, engagement in facial trauma care appears economically unfavorable, making it a less desirable option for the specialty surgeon. This opportunity cost goes beyond monetary considerations, encompassing additional on-call hours, including nights and weekends that could otherwise be spent with family or engaged in non-healthcare activities.
There are limitations to our study that must be acknowledged. Our study focuses on a single center’s surgeon reimbursement, and hence the results are not generalizable nationwide. Even within our state, private payor reimbursement rates are subject to variability, because these rates are negotiated on an institutional basis. Larger hospital systems typically leverage stronger negotiating powers and can therefore negotiate higher reimbursements from payors. Furthermore, conservatively managed CMF injuries and follow-up care were not assessed in our study, which may also represent a significant source of lost productivity.
Conclusions
This longitudinal study reaffirms that the provision of trauma care represents a financial burden to major trauma centers due to low reimbursement rates. Understanding and addressing these variations is essential for health care administrators, policymakers, and providers to ensure equitable access to health care services and sustainable financial operations for health care institutions. As the health care industry moves away from a fee-for-service system to 1 of value-based care, surgeons providing CMF care need to be at the forefront of this transition to ensure that they are delivering quality care and receiving appropriate reimbursement.
Funding
The author(s) disclosed receipt of the following financial support for the research, authorship, and/or publication of this article: We wish to acknowledge support from the Biostatistics, Epidemiology and Research Design (BERD) Methods Core funded through Grant Award Number UL1TR002553 from the National Center for Advancing Translational Sciences (NCATS), a component of the National Institutes of Health (NIH). The content is solely the responsibility of the authors and does not necessarily represent the official views of the NIH.
Acknowledgments
We also wish to acknowledge Dr Megan R. Barrett for reviewing the article.
Conflicts of Interest
The author(s) declared no potential conflicts of interest with respect to the research, authorship, and/or publication of this article.
References
- Gautschy S (ed.) (2021) Trauma Facts, The American Association for the Surgery of Trauma. Available at: https:// www.aast.org/ (Accessed: 2024).
- Davis KL, Joshi AV, Tortella BJ, Candrilli SD. The direct economic burden of blunt and penetrating trauma in a managed care population. J Trauma. 2007, 62, 622. [Google Scholar]
- Choi J, Lorenz HP, Spain DA. Review of facial trauma management. J Trauma Acute Care Surg. 2020, 88, e124–e130. [Google Scholar] [CrossRef] [PubMed]
- Allareddy V, Allareddy V, Nalliah RP. Epidemiology of facial fracture injuries. J Oral Maxillofac Surg. 2011, 69, 2613. [Google Scholar] [CrossRef] [PubMed]
- Wasicek PJ, Gebran SG, Ngaage LM; et al. Contemporary characterization of injury patterns, initial management, and disparities in treatment of facial fractures using the national trauma Data Bank. J Craniofac Surg. 2019, 30, 2052–2056. [Google Scholar] [CrossRef]
- Gebran SG, Wasicek PJ, Elegbede A; et al. Characterization of age-related injury patterns and surgical treatment of pediatric facial fractures: Analysis of the national trauma Data Bank. J Craniofac Surg. 2019, 30, 2189–2193. [Google Scholar] [CrossRef] [PubMed]
- Torabi SJ, An MB, Birkenbeuel JL; et al. Incidence and reimbursement trends for facial fracture repair in the elderly: A medicare analysis. Laryngoscope. 2023, 134, 659–665. [Google Scholar]
- Torabi SJ, Patel RA, Kasle DA; et al. Rhinology Medicare reimbursements have not been keeping up with inflation. Int Forum Allergy Rhinol. 2022, 12, 714–725. [Google Scholar] [CrossRef]
- Kandi LA, Jarvis TL, Shrout M; et al. Trends in medicare reimbursement for the top 20 surgical procedures in craniofacial trauma. J Craniofac Surg. 2023, 34, 247–249. [Google Scholar] [CrossRef] [PubMed]
- Moses H, Powers D, Keeler J; et al. Opportunity cost of surgical management of craniomaxillofacial trauma. Craniomaxillofacial Trauma Reconstr. 2016, 9, 76–81. [Google Scholar] [CrossRef] [PubMed]
- Radparvar J, Dorante MI, Youssef G, Ganeshbabu N, Pandya SN, Guo L. Reimbursement trends in reduction mammoplasty: A single-center analysis of insurance reimbursements from 2012 to 2021. Ann Plast Surg 2023, 90 5S Suppl 2, S225–s229. [CrossRef] [PubMed]
- Lanzarotti S, Cook CS, Porter JM, Judkins DG, Williams MD. The cost of trauma. Am Surg. 2003, 69, 766. [Google Scholar] [CrossRef]
- Lee LN, Bhattacharyya N. Contemporary trends in procedural volume for adult facial trauma, 1996-2006. Otolaryngol Head Neck Surg. 2012, 146, 226. [Google Scholar] [CrossRef] [PubMed]
- Dillon JK, Christensen B, McDonald T, Huang S, Gauger P, Gomez P. The financial burden of mandibular trauma. J Oral Maxillofac Surg. 2012, 70, 2124. [Google Scholar] [CrossRef] [PubMed]
- David LR, Bisseck M, Defranzo A, Marks M, Molnar J, Argenta LC. Cost-based analysis of the treatment of mandibular fractures in a tertiary care center. J Trauma. 2003, 55, 514. [Google Scholar] [CrossRef] [PubMed]
- Koenig WJ, Lewis VL Jr. The physician cost of treating maxillofacial trauma. Plast Reconstr Surg. 1993, 91, 778. [Google Scholar] [CrossRef] [PubMed]
- Modig, N. What do economic scholars consider powerful economic knowledge of importance for people in their private and public lives? Implications for teaching and learning economics in social studies. Stud High Educ. 2021, 46, 2200–2215. [Google Scholar] [CrossRef]
- Seidenwurm DJ, Burleson JH. The medicare conversion factor. AJNR Am J Neuroradiol. 2014, 35, 242. [Google Scholar] [CrossRef] [PubMed]
- Clemens J, Gottlieb JD. In the shadow of a giant: medicare’s influence on private physician payments. J Polit Econ 2017, 125, 1–39. [CrossRef] [PubMed]
- Daniels M (2023) Moving to Site Neutrality in Commercial Insurance Payments, Committee for a responsible federal budget. Available at: https://www.crfb.org/papers/moving-site-neutrality-commercial-insurance (Accessed: 2024).
- Corcoran D (ed.) (2019) National and Regional Changes in Phyician Employment 2012-2018, Physicians Advocacy Institute Available at https://www.physiciansadvocacyinstitute.org (Accessed: 2024).
- Health A (2022) COVID-19’s Impact On Acquisitions of Physician Practices and Physician Employment 2019-2021, Physician Advocacy Institute. Available at: https://www. physiciansadvocacyinstitute.org/Portals/0/assets/docs/PAI-Research/PAI_Avalere_Physician_Employment_Trends_ Study_2019-21_Final.pdf. (Accessed: 2024).
© 2024 by the authors. Published by MDPI on behalf of the AO Foundation. Licensee MDPI, Basel, Switzerland. This article is an open access article distributed under the terms and conditions of the Creative Commons Attribution (CC BY) license (https://creativecommons.org/licenses/by/4.0/).