Next Article in Journal
Facial Trauma Patterns Among Young Athletes
Previous Article in Journal
Interfacility Transfers for Isolated Craniomaxillofacial Trauma: Perspectives of the Facial Trauma Surgeon
 
 
Craniomaxillofacial Trauma & Reconstruction is published by MDPI from Volume 18 Issue 1 (2025). Previous articles were published by another publisher in Open Access under a CC-BY (or CC-BY-NC-ND) licence, and they are hosted by MDPI on mdpi.com as a courtesy and upon agreement with Sage.
Article

Computer-Aided Fracture Size Measurement in Orbital Fractures—An Alternative to Manual Evaluation

by
Mikko Saloniemi
*,
Valtteri Lehtinen
and
Johanna Snäll
Department of Oral and Maxillofacial Diseases, University of Helsinki and Helsinki University Hospital, PO Box 220, FIN-00029 HUS, Helsinki, Finland
*
Author to whom correspondence should be addressed.
Craniomaxillofac. Trauma Reconstr. 2021, 14(3), 209-217; https://doi.org/10.1177/1943387520962691
Submission received: 1 December 2019 / Revised: 31 December 2019 / Accepted: 1 February 2020 / Published: 7 October 2020

Abstract

:
Objective: We aimed to present a novel semiautomated tool for orbital fracture size measurement and to compare the variability of the proposed method with traditional manual measurements. Methods: Maximal anteroposterior (AP) and mediolateral (ML) dimensions of orbital fractures from computed tomography images were measured for 15 patients with unilateral orbital fractures by 2 surgeons manually and with a semiautomatic software. Variability was assessed with Bland-Altman limits of agreement plots and intra-class correlation coefficients (ICCs). Results: The intra-observer ICCs in manual and automatic measurements were high, >0.9. The inter-observer ICCs in manual measurements were 0.926 (AP) and 0.631 (ML) and in automatic measurements 0.989 (AP) and 0.989 (ML). The ICCs for manual and semiautomated variability were 0.899 (AP) and 0.669 (ML). The differences were thus particularly pronounced in the ML dimensions. In addition, with the semiautomated technique, a total fracture area could be measured and compared with the total area of the bony orbit and a 3-dimensional reformatted image could be generated. Conclusions: Intra- and inter-observer variability proved to be very low for measuring fracture maximal AP length and ML width, making both the manual and the semiautomatic methods feasible clinically. The semiautomatic fracture size analysis allows better observer-independent repeatability for fracture size measurements and provides the possibility for total fracture area measurements at any orbital bony site, even in challenging nonplanar topography.

Introduction

A universal controversy remains considering the indications of orbital reconstruction after fracture[1]; most systematic reviews mainly focus on materials and timing of reconstructive surgery rather than on the actual indications for surgical intervention. Usually, it can be agreed upon that observation without surgical intervention is sufficient when a non-displaced or minimally displaced fracture with intact ocular motility and function is in question. The parameters making a fracture size critical, and, thus, requiring orbital reconstruction if reduction without fixation cannot be accomplished have yet to be established. Heterogeneity in clinical trial settings and in description of fracture parameters, such as accurate size, topography, and location, give no solid evidence-based foundation for defect-driven conclusions or guidelines,[1] and, thus, the relevance of bony fracture parameters has been challenged.[2] It is hard to assess the fracture rapidly, with good precision, in a simple yet descriptive manner and first and foremost with good repeatability in the complicated settings of 3-dimensional (3D) and individually shaped bony orbits.
In the past and even recently, a fracture surface area of more than 2 cm2 or greater than 50% or another similar magnitude of the orbital floor or medial wall has been suggested to indicate the need for surgery.[3,4,5] While fracture size should be considered only as one factor alongside clinical findings and/or other radiological findings,[6,7] it has been reported to be a more important predictor for postoperative malposition of the globe than preoperative enophthalmos.[8] However, it is not a simple feat to measure fracture area, as the orbital floor and walls do not always have good landmarks to set their exact limits. Even among experienced radiologists, there might be only moderate agreement in measuring simple parameters such as maximal length or width of orbital fractures.[9] For the surgeon on duty, few clinically used programs can give an exact characterization of the fracture without time-consuming steps. Especially in uneven fracture shapes, measurement is open to interpretation. There are other problems with area-specific guidelines too, as the fracture area alone does not take into consideration the displacement of the fractured bones. Recently, there have been investigations and experimental software to measure the volumetric changes in fractures, and specific herniated mass volume limits have been suggested as indicators for surgery.[9,10,11] However, these systems do not provide specific, easy tools for clinicians to assess fracture area measurements or to combine area, location, and volumetric information without the need for human recognition of fracture borders, thus providing a source of error.
The aims of this study were to present a novel and userfriendly semiautomatic method for orbital fracture size measurement and to compare the variability of the proposed method with traditional manual measurements. We hypothesized that the computer-assisted technique would be more reliable than manual measurements and would have less user-based variability. Further, we present a semiautomatic measurement technique for the total fractured orbital area and total orbital surface area, which can be used in daily work as a routine clinical tool.

Materials and Methods

Study Design

A retrospective radiological repetitive measure analysis of the orbital fracture dimensions was implemented based on computed tomography (CT) images of 15 patients with an isolated unilateral orbital floor fracture. Patient images were gathered from a previously published clinical study of customized orbital fracture implants.[12] Patients with any other facial fracture or an orbital fracture extending to the rim(s) of an orbit were excluded.
CT images were obtained using a high-resolution 16-slice CT scanner (Siemens or GE Medical Systems) and bone algorithm with 0° gantry angle. Data were reformatted into axial, coronal, and sagittal series with 1.0 mm slice thickness.
Manual and semiautomatic fracture size measurements were performed by authors J.S. and M.S. with 10 and 6 years’ experience in maxillofacial surgery, respectively, who were blinded to each other’s results.

Study Variables

The primary outcomes were intra-observer variability measures for maximal fracture anteroposterior (AP) and mediolateral (ML) dimensions in manual and semiautomatic methods. Secondary outcomes were inter-observer variability measures between manual and semiautomatic methods in the 2 abovementioned dimensions. In addition, total fracture area measurement and percentage of the fracture of the total bony orbit with the semiautomated method were presented.

Manual Measurements

Width and length of the dislocated orbital fractures were measured from the primary CT images twice by both observers at a 2-week interval. Both manual measurements were performed before performing semiautomatic measurements. Manual measurements were done using the coronal and sagittal series of CT images for measuring maximal fracture width and length, respectively. Measurements were conducted by finding the slice with maximal fracture width/length and measuring the dimension with a measurement tool of the Picture Archiving and Communications System (Impax 6.6.1, Agfa HealthCare NV).

Semiautomatic Fracture Dimension Measurement and Workflow

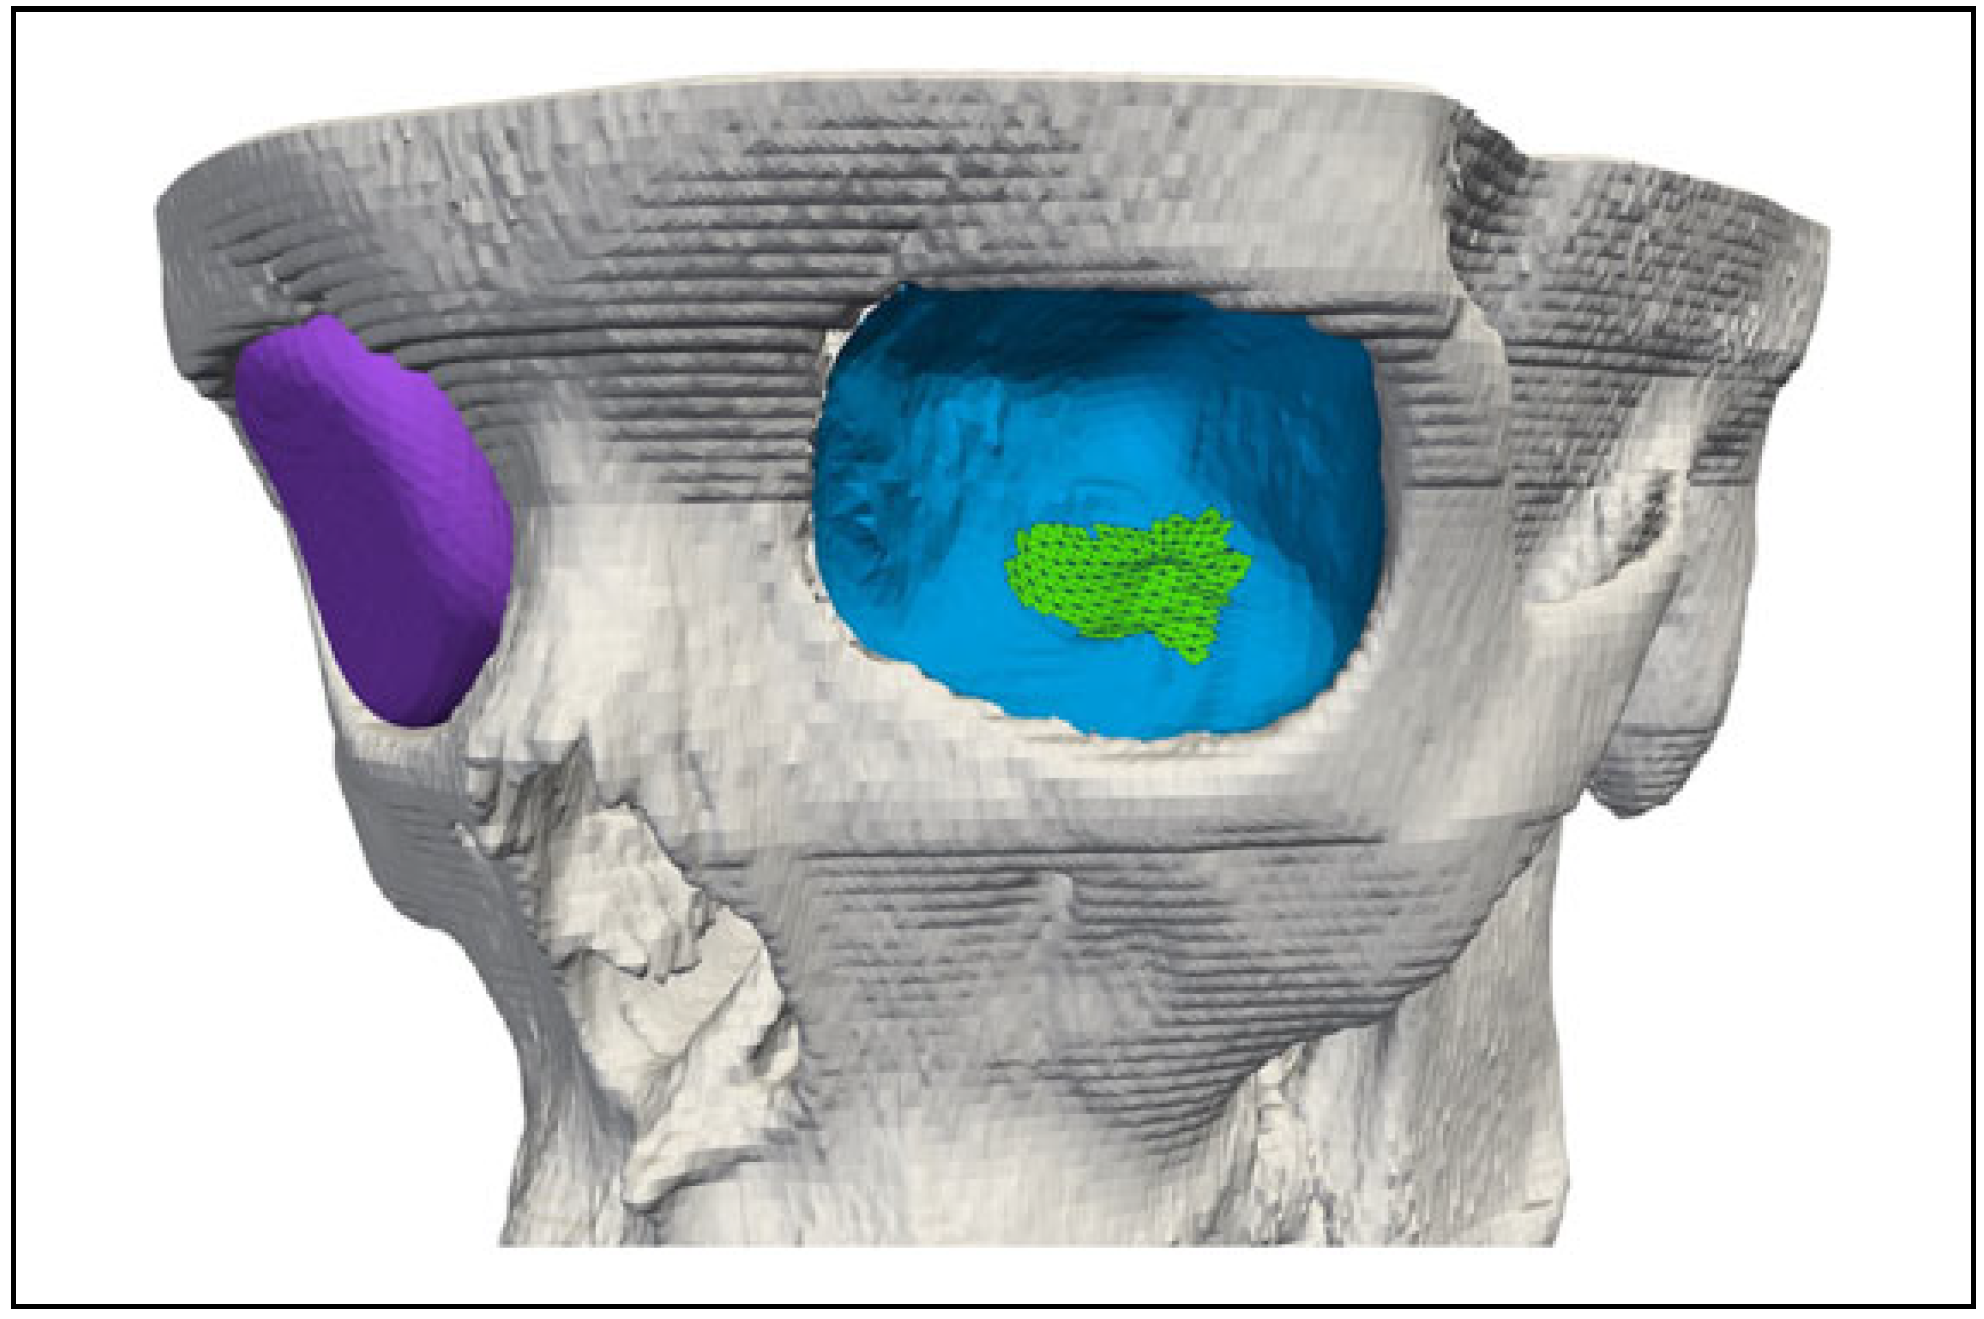
Semiautomatic fracture width and length measurement of the dislocated orbital fractures was performed with CMF Orbital Software version 1.32 (Disior Ltd) twice by both observers at a 2-month interval. In the software, the user selects a seed point inside the orbit and confirms the laterality (right vs left) of the fracture for comparison analysis and defines the Hounsfield unit (HU) value range to be used as stop parameters for segmentation. In this study, seed point was set at the intersection of eyeball and optic nerve at the axial level where the diameter of orbit was at its largest (see Figure 1A for visualization of seed point) and the value range for automatic expansion of segmentation was set between −300 and 200 HU. Both observers did the seed point and laterality selection twice at a 2-month interval but were blinded to the final results of the analysis until all the measurements were done. After seed and fracture laterality selection, a virtual triangle mesh is iteratively expanded from both user-selected seed points until it comes into contact with bony boundaries of either intact orbit walls or fractures based on previously set stop values. Anterior expansion of volume mesh is stopped when it reaches the bony rim of the orbit, defined automatically by iteratively shrinking a mesh outside the surface model of the skull. After both orbit volume meshes have completely expanded, mesh from the intact side is compared with the fractured side and the volume change caused by the fracture is defined as the difference between the meshes. The fracture surface is defined as the group of triangles at the edge between the expanded (or reduced) volume and the simulated original orbit surface. Fracture surface meshes were exported in .stl format and maximal sagittal/horizontal dimensions of the fracture surface were measured in MATLAB 2018b (MathWorks, Inc.) by finding the longest intersects between the sagittal/ coronal plane and the fracture surface mesh. Examples of segmented orbital volume, fracture surface, and semiautomatically measured maximal AP/ML dimensions can be seen in Figure 2 and Figure 3.

Statistical Analysis

Intra-observer variability for both methods was assessed by Bland-Altman limits of agreement plots[13,14] and by calculating intra-class correlation coefficients (ICC 3,1; 2-way mixed model, single measurement, absolute agreement) for the combined 4 sets of fracture dimension measures for each observer and method. Inter-observer reliability was assessed with Bland-Altman plots and by using ICC (2,1; 2-way random model, single measurement, absolute agreement). For calculating inter-observer variability measures, the mean of each observer’s 2 measurements was used as their result. All statistical analyses were done using SPSS version 25 (IBM Corporation). Agreement between computer-assisted and manual measures was assessed by using ICC (2,1; 2-way random model, single measurement, absolute agreement) calculated for both observers and both methods, using the mean of each observer’s 2 measurements as their result and also with Bland-Altman limits of agreement plot, where the difference between the means of 2 observers and 2 trials per observer was plotted and limits of agreement were calculated as before.

Results

Intra-Observer Variability

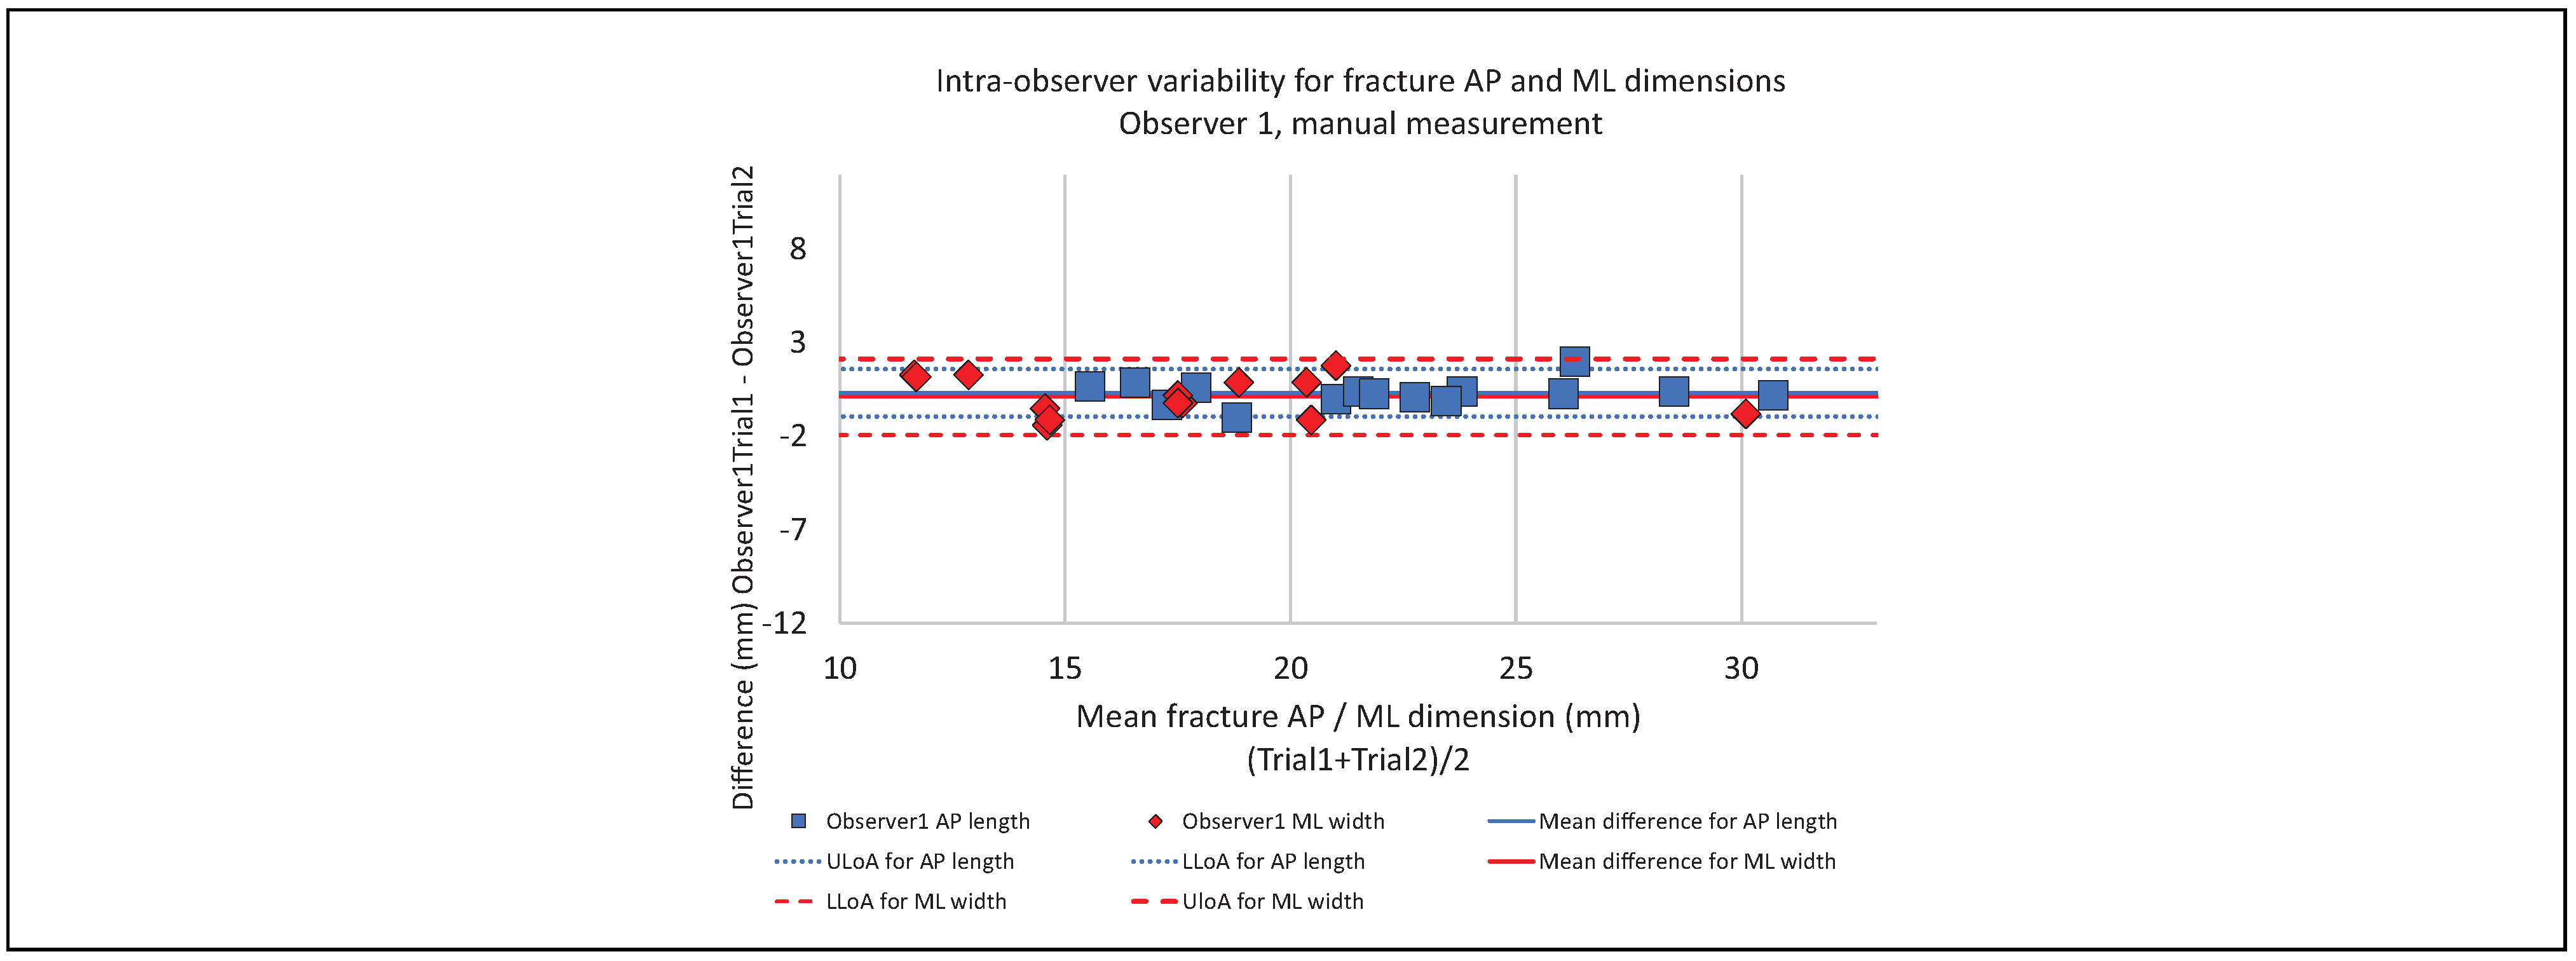
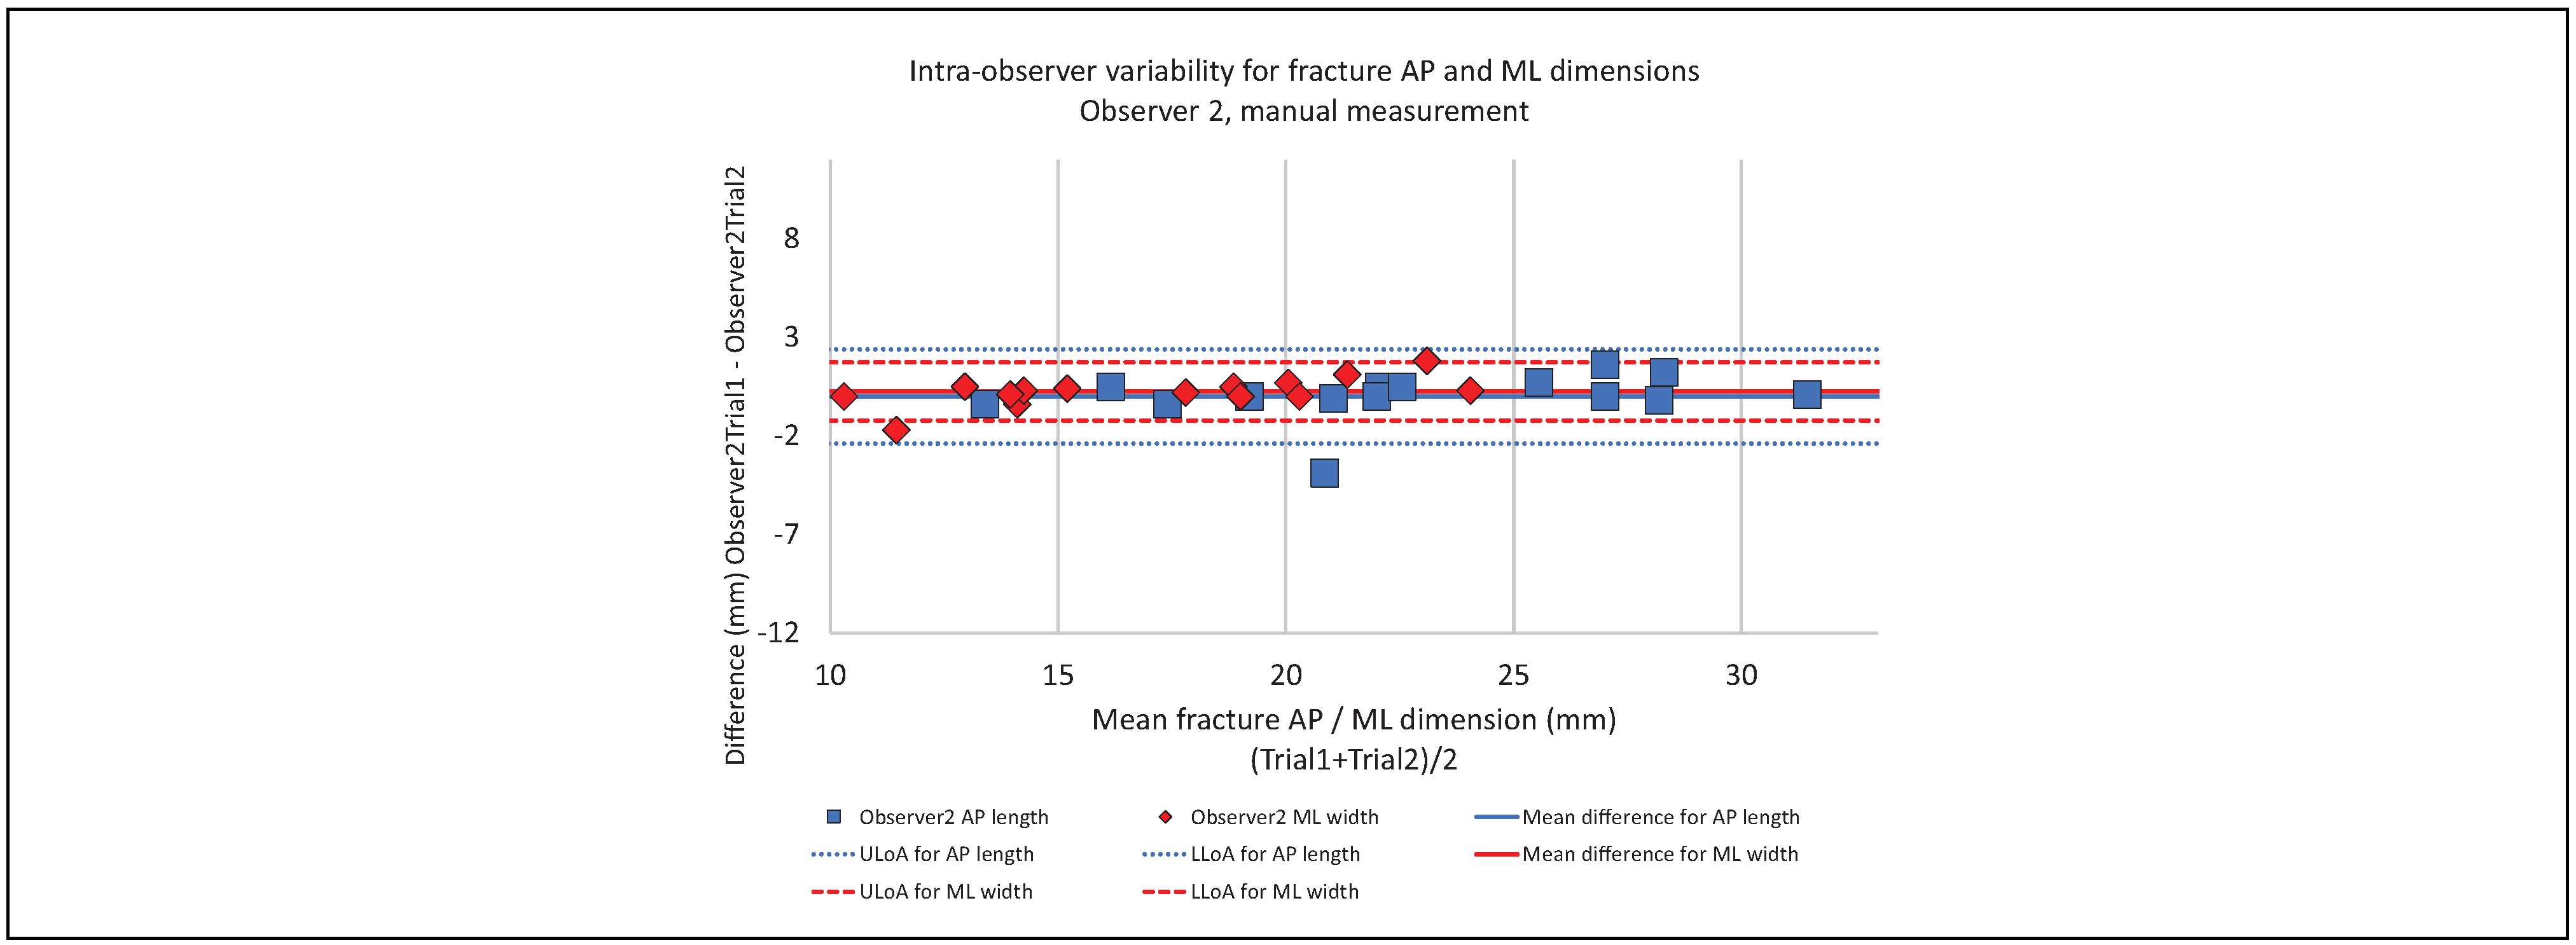
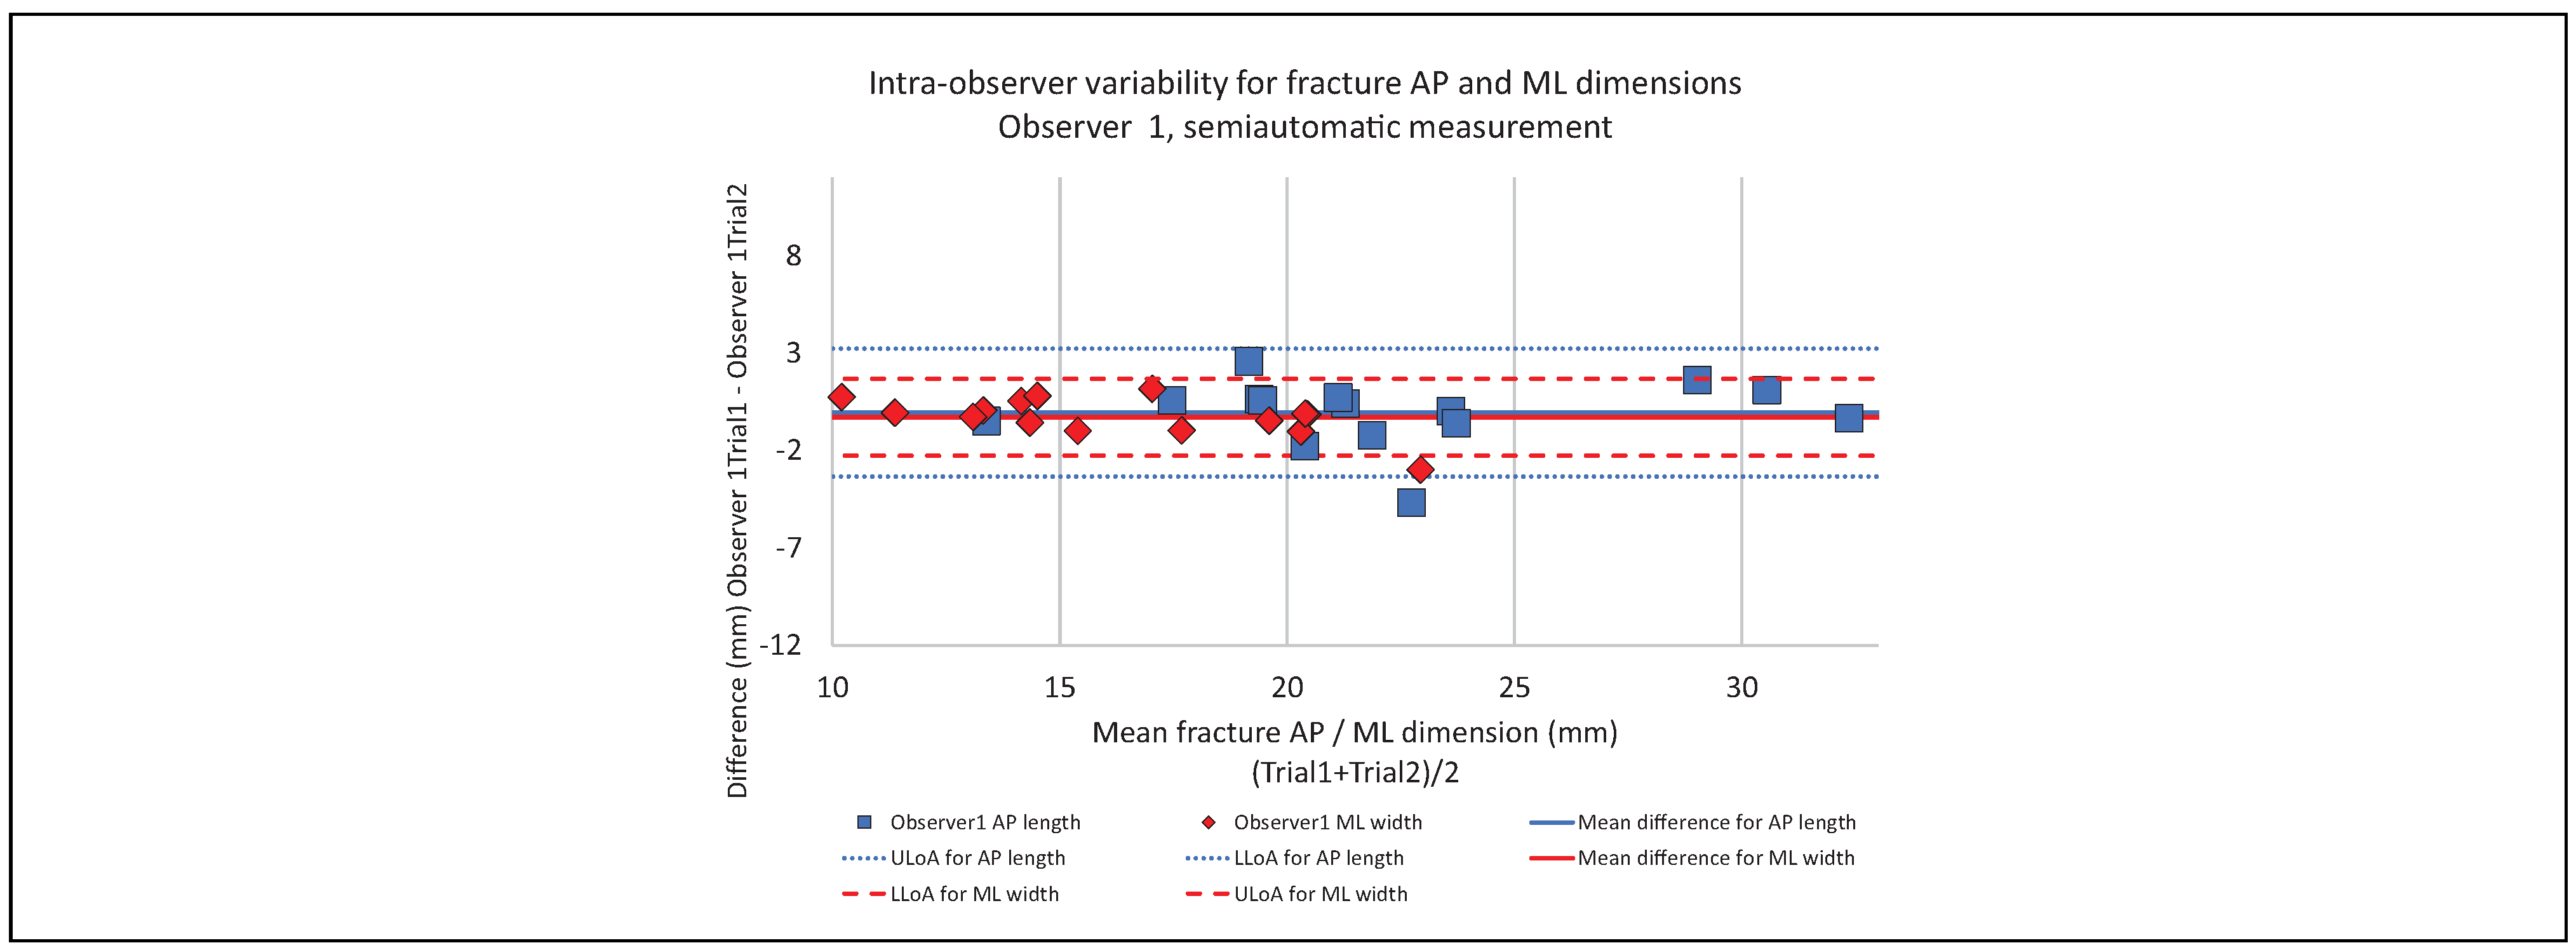
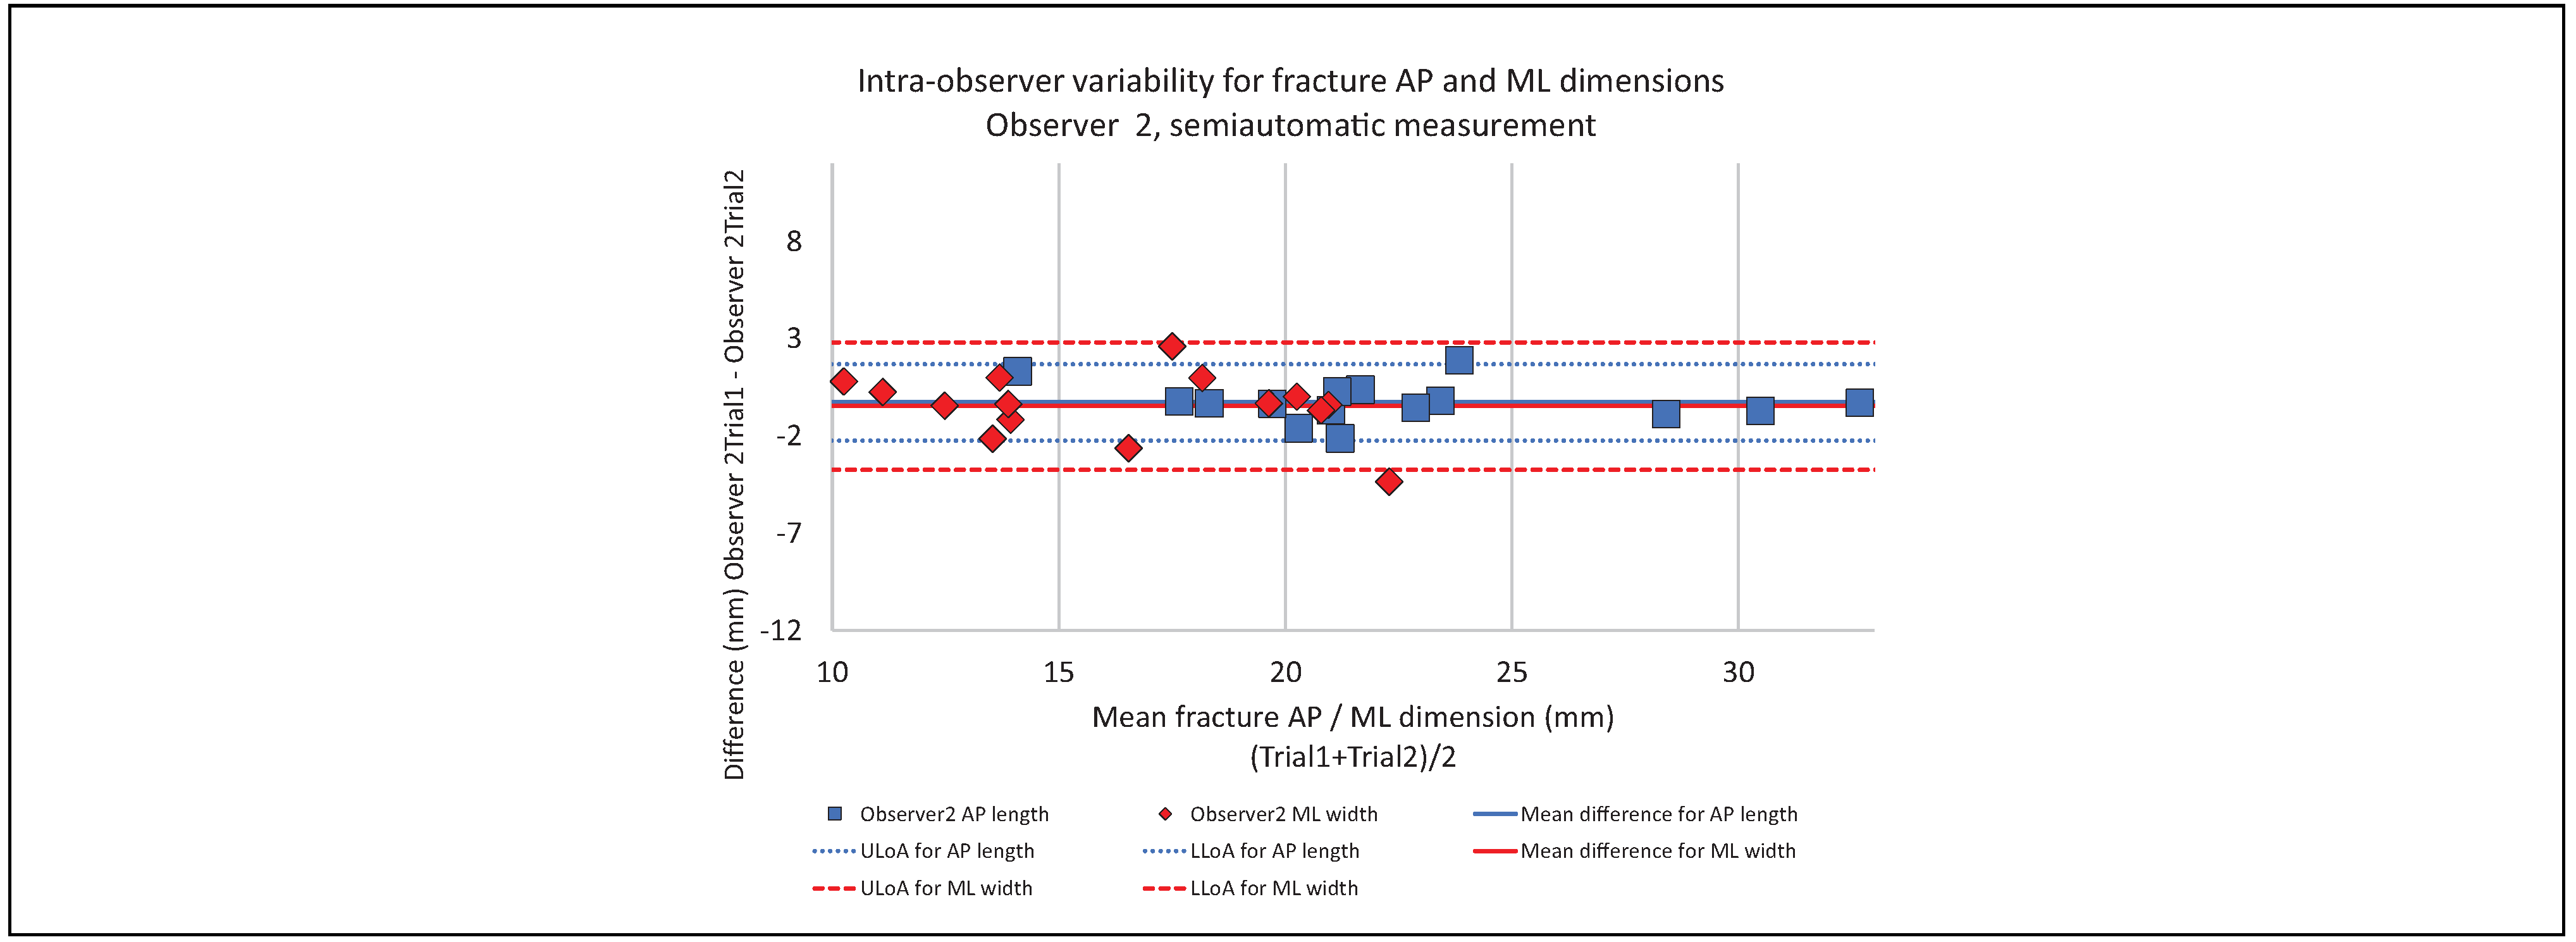
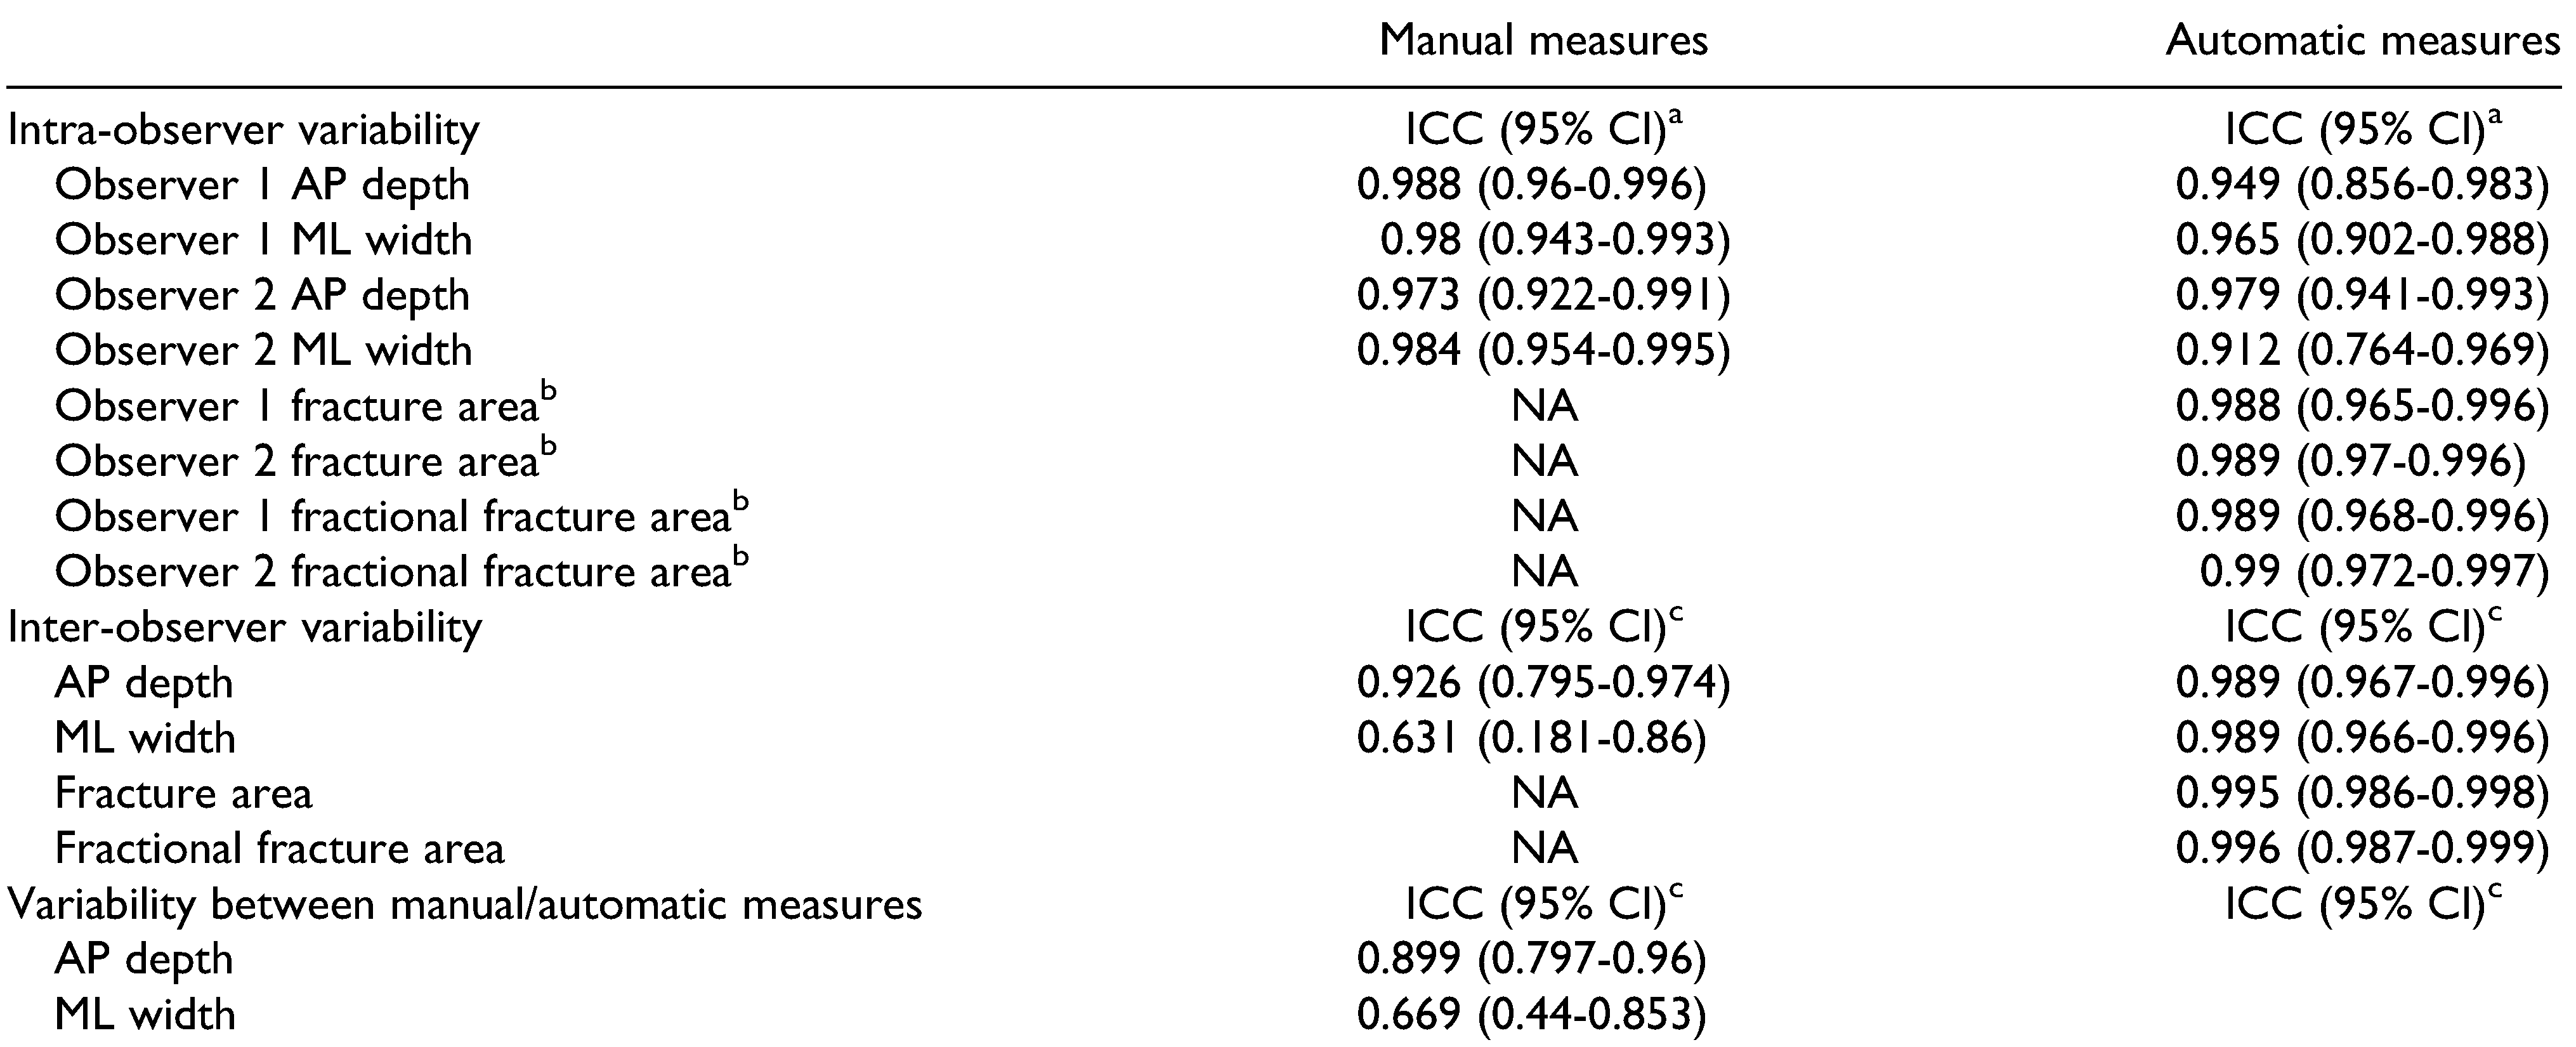
The intra-observer variability for manual fracture dimension measures is plotted in Figure 4 and Figure 5. The 95% limits of agreement for observer 1 were 0.33 ± 0.65 mm (mean difference ±1.96 SD) for AP dimensions and 0.12 ± 1.04 mm for ML dimensions. For observer 2, the limits of agreement were 0.07 ± 1.22 mm and 0.25 ± 0.75 mm, respectively. The intra-observer variability for automatic fracture dimension measures is plotted in Figure 6 and Figure 7. The 95% limits of agreement for observer 1 were −0.05 ± 1.67 mm (mean difference ±1.96 SD) for AP dimensions and −0.28 ± 1.01 mm for ML dimensions. For observer 2, the limits of agreement were −0.27 ± 1.00 mm and −0.46 ± 1.36 mm, respectively. The ICCs for both intra- and inter-observer reliability are listed in Table 1. The ICC for intra-observer manual measurements varied between 0.973 and 0.988 and for automatic measurements between 0.912 and 0.979.

Inter-Observer Variability

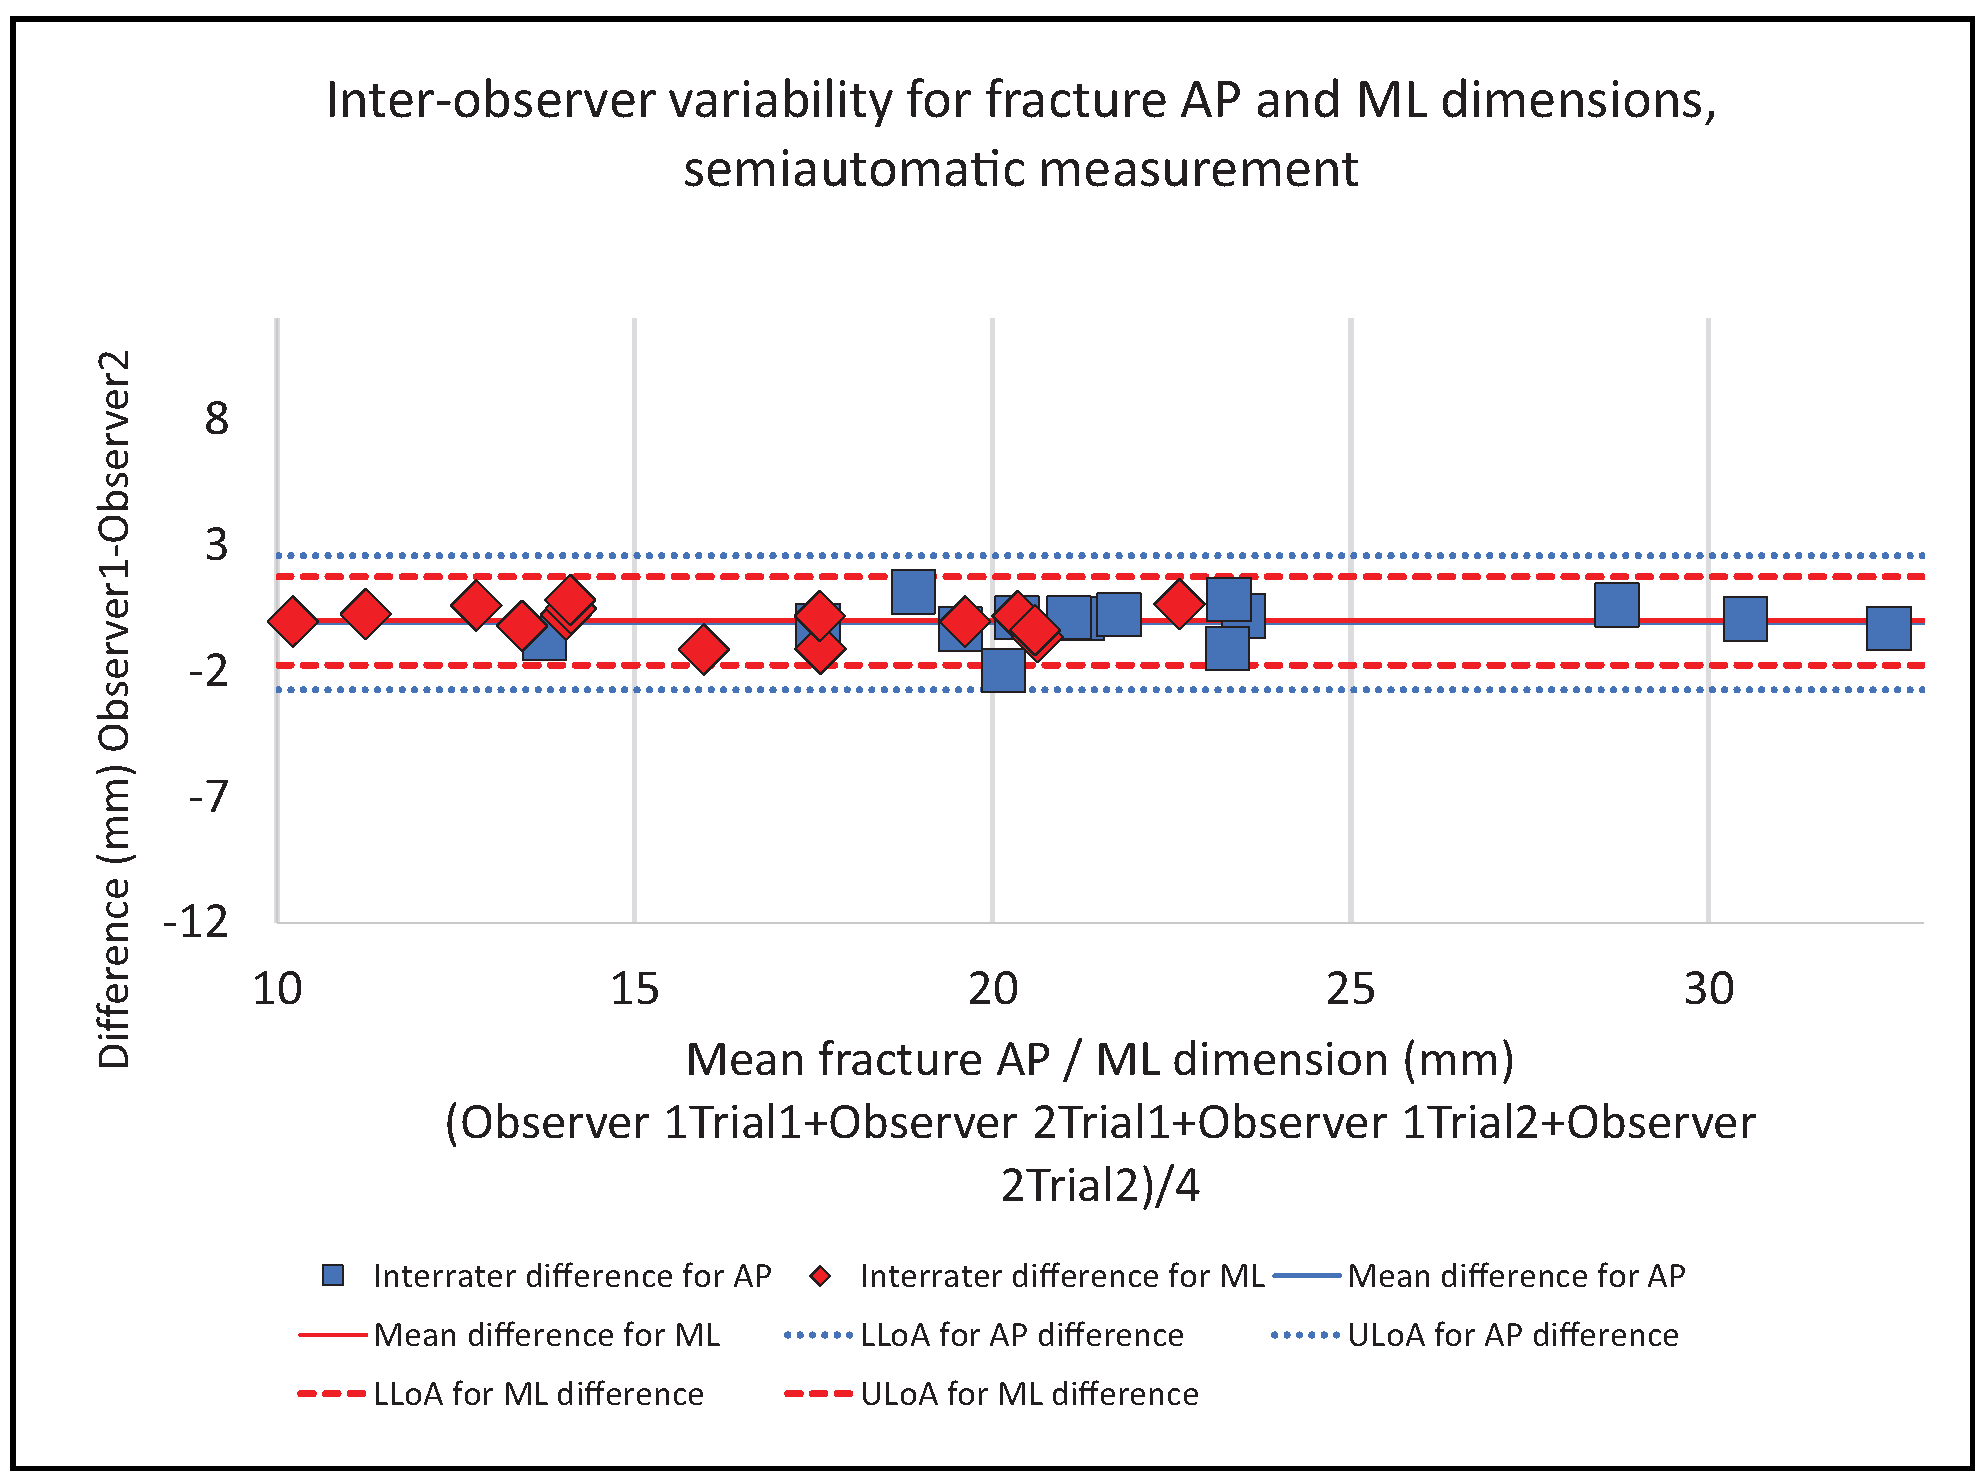
The inter-observer variability for manual and semiautomatic measures is plotted in Figure 8 and Figure 9 respectively. The 95% limits of agreement for inter-observer variability in manual measures were −0.68 ± 1.78 mm (mean difference ±1.96 SD) for AP dimensions and −0.25 ± 4.11 mm for ML dimensions. The limits of agreement for interobserver variability in automatic measures were −0.08 ± 0.77 mm for AP dimensions and −0.01 ± 0.60 mm for ML dimensions. The ICCs for inter-observer reliability are listed in Table 1. The ICC for inter-observer reliability for manual measures was 0.926 for fracture AP length and 0.631 for ML width and the corresponding ICCs for automatic measures were 0.989 and 0.989.

Agreement Between Manual and Automatic Measurements

The difference plot between mean manual and automatic measures for both AP and ML dimensions is presented in Figure 10. The 95% limits of agreement were −0.06 ± 2.36 mm (mean difference ±1.96 SD) for AP dimensions and −0.66 ± 3.18 mm for ML dimensions. The agreement between automatic and manual measures was also assessed by calculating ICCs, which were 0.899 for AP measurements and 0.669 for ML measurements.
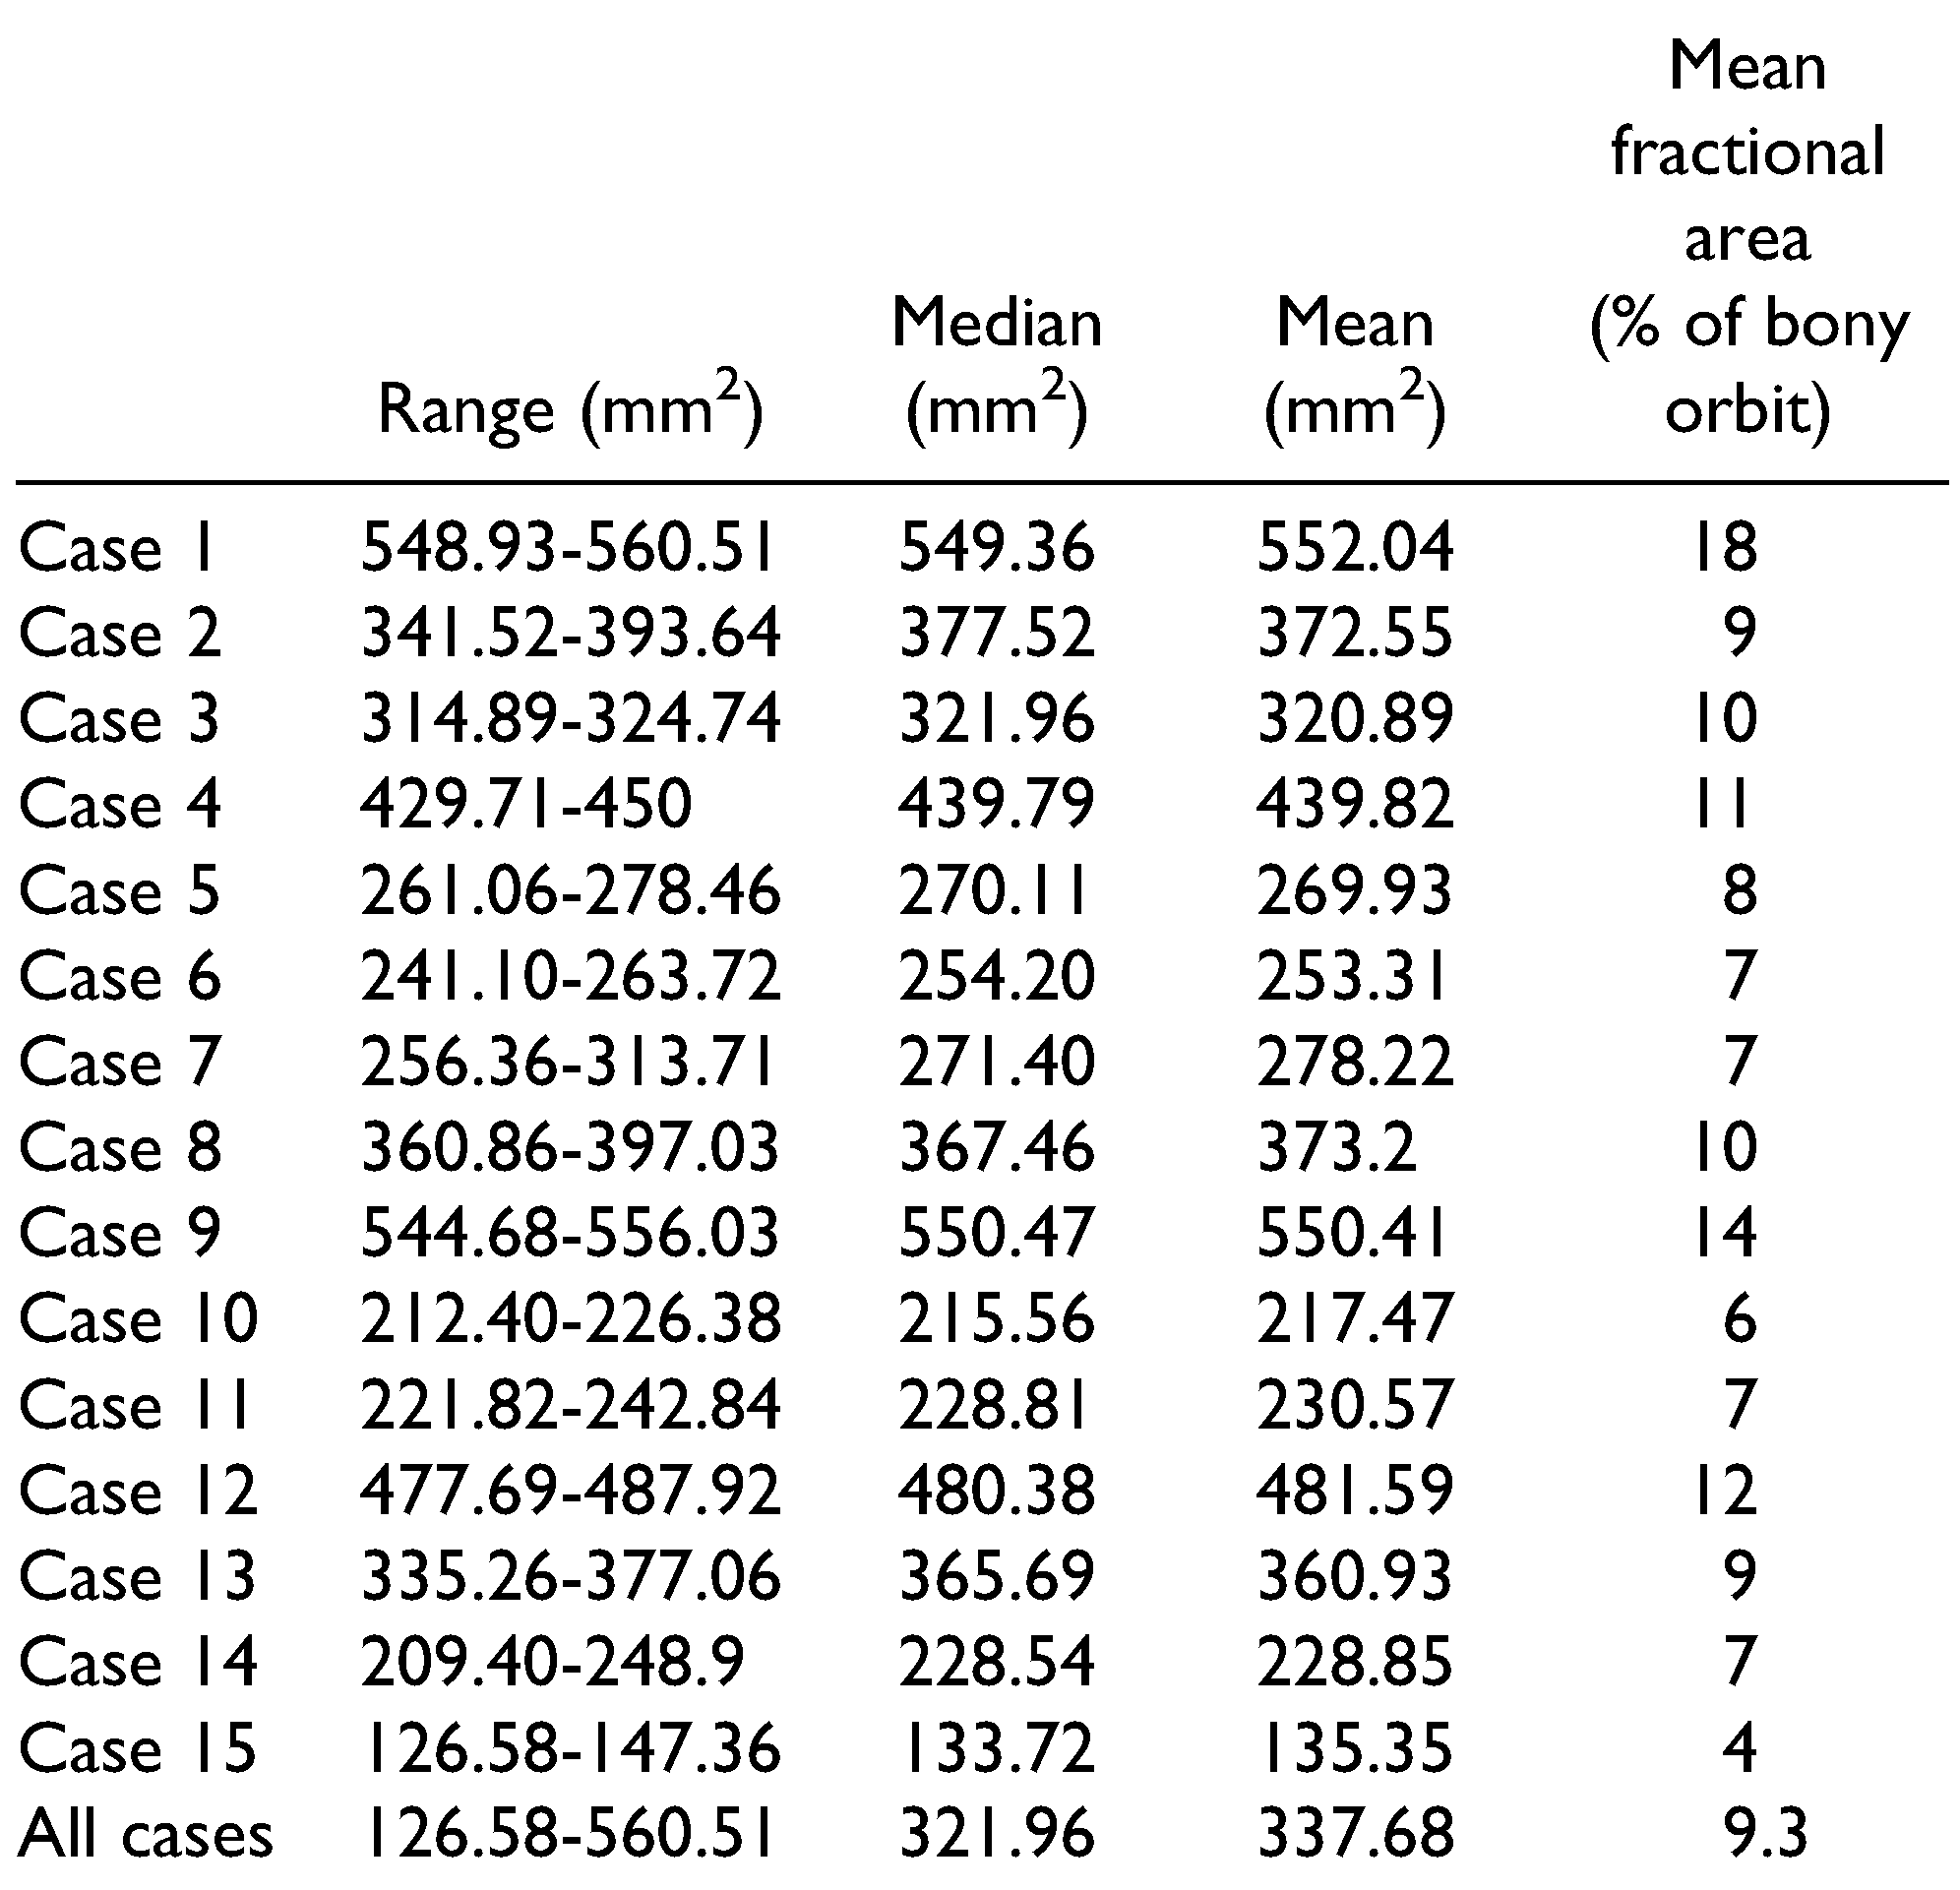
Fracture area measurements for all cases are presented in Table 2. Fracture area measurement varied between 126.58 and 560.51 mm2, and median size was 321.96 mm2. Mean fracture area fraction of the bony orbit surface area was 9.3%.

Discussion

The aims of this study were to present a novel user-friendly semiautomatic method for orbital fracture size measurement and to compare the measurement variability of the proposed method with traditional manual methods. We hypothesized that the computer-assisted technique would be more reliable than manual measurements, have less user-based variability, and thus in the future provide a fast and reliable clinical tool for daily praxis.
Manual evaluation of orbital fracture size from CT images can be challenging, leading to wide inter-observer variability. Experience of the observer has little influence on the accuracy of the observations,[15] and even merited neuroradiologists have recorded ICC values as poor as 0.22 in width estimations of small fractures.[16] Most commonly, size estimations are measured linearly from coronal and sagittal or even axial CT views.[17,18] To estimate the actual area without strenuous calculations, the sum of simplified geometric shapes’ area fitted to the fracture has been attempted.[19] More accurate estimation of fracture defect size might be achieved by calculating the sum of fractured trapezoid areas from coronal CT slides using slide thickness as the trapezoid height and fracture coronal width in every corresponding CT slide as the bases.[6,19] The main limitation of most such algorithms is to consider the orbital floor as a planar structure, as explained elsewhere,[2,20] and failing to take into account the wavy topography of the orbital floor most pronouncedly implicated in large fractures. In addition, area of fractures extending to the medial wall cannot be measured with these methods.
To overcome problems of manual estimations, various software have been proposed. Compared with previous studies done using computational analysis for calculating fracture area, [1,15,20,21] our results show a similar variability. However, most of the aforementioned analysis methods require on the user pointing to several margin points along the fracture margins and are thus somewhat laborious.
The current proposed semiautomatic method has several advantages. It is easy to learn and requires little user input: only 1 click to determine the side (left vs right) of the fracture and single seed points inside both orbits. Analysis for 1 case takes approximately 1-3 minutes. Thus, it is feasible to use in clinical settings as well. Both intra- and inter-observer reliability are very high, even though in this study the difference compared with manual measurement was relatively small. It provides the possibility to analyze orbital fracture area precisely and enables measurements that are not possible manually. It takes the 3D topography into account by simulating the preinjury orbital floor based on the anatomy of the intact side. The user will also receive the area measurements and topography reconstructions of the simulated preinjury orbital floor, which could be used in preoperative planning and possibly in patient-specific implant design.
One drawback for the proposed technique is the situation where both orbits are fractured because the intact orbit shape cannot be used to simulate the preinjury shape and the change caused by fracture. In bilateral fractures, measurements can be solved by fitting a correctly proportioned, statistically derived shape inside the broken orbit and finding the deformed areas by comparing the shape with the model segmented from the patient’s image.[22] The current semiautomated method might also miss some nondislocated fractures, where the bony orbit has been bent but not completely dislocated, due to a too small shape difference. It might also be difficult to find a shape deformation caused by fracture when the fracture line overlaps an anatomic discontinuity such as the inferior orbital fissure or the maxillary canal of the infraorbital nerve. An experienced clinician knows that a fracture line is continuous, but the algorithm might miss the fracture because the exact location of those anatomic structures might be slightly asymmetric, and, therefore, comparison with the intact side might underestimate the size of such fractures. This might partly explain the larger variability found in assessing ML width of the fractures. However, also when assessing inter-observer variability, the ICC and limits of agreement showed more discrepancy in manual fracture width measurements. The size of the fracture did not seem to notably affect the ICC results.
Radiological findings alone and even less radiological bony findings alone will never be a sufficient sole criterion to decide whether or not to operate on a patient with orbital fracture[2]; however, there should be an easy method to reliably and without inter-observer variability access these parameters too in order to evaluate orbital fractures appropriately and to create good clinical guidelines for future examinations.
When considering limitations of this study, the lack of a true area measurement reference, such as that achieved in mechanical measurements in cadavers, needs to be noted, as does the limited number of cases and the use of only 2 surgeons to perform measurements. The nonclinical evaluation setting for surgeons might have reduced some error in manual evaluation through more meticulous workflow than would have been possible in emergency room routine. It is possible that the observers might have partially remembered fractions of the first manual measurements during the second measurement round, for example, landmarks they used for measuring fracture sites in CT images. Comparisons between different softwareassisted techniques in user-friendliness, speed, and accuracy are warranted.

Conclusions

The semiautomated method presented serves as an excellent tool for orbital fracture characterization, providing values of fracture width and length, area, and percentage of total orbital surface—even in challenging nonplanar topography.

Authors’ Note

Recommended Reviewers: Schaller B, Department of Cranio-Maxillofacial Surgery, Inselspital, Bern University Hospital, Freiburgstrasse, 3010 Bern, Switzerland; Essig H, Department of Cranio-Maxillofacial Surgery, University Hospital Zürich, Frauenklinikstrasse 24, 8091 Zürich, Switzerland. Opposed Reviewers: None.

Funding

The author(s) received no financial support for the research, authorship, and/or publication of this article.

Institutional Review Board Statement

The study was approved by the Internal Review Board of the Head and Neck Center, Helsinki University Hospital, Helsinki, Finland (HUS/356/2017).

Conflicts of Interest

The author(s) declared the following potential conflicts of interest with respect to the research, authorship, and/or publication of this article: One of the authors (V.L.) was employed part-time by Disior Ltd. However, Disior Ltd played no role in data analysis or preparation of the manuscript. J.S. was funded by the Paulo Foundation and J.S and V.L by the Helsinki University Hospital Fund.

References

  1. Dubois, L.; Steenen, S.A.; Gooris, P.J.; Mourits, M.P.; Becking, A.G. Controversies in orbital reconstruction—I. Defect-driven orbital reconstruction: a systematic review. Int J Oral Maxillofac Surg. 2015, 44, 308–315. [Google Scholar] [PubMed]
  2. Schouman, T.; Scolozzi, P. Simple CT-based calculations of orbital floor fracture defect size are not sufficiently accurate for clinical use. J Oral Maxillofac Surg. 2015, 73, 577. [Google Scholar] [CrossRef] [PubMed]
  3. Garcia, B.G.; Ferrer, A.D. Indicaciones quirúrgicas de las fracturas orbitarias atendiendo al taman˜o del defecto de fractura determinado por tomografía computarizada: una revisión sistemática. Rev Esp Cir Oral Maxilofac. 2016, 38, 42–48. [Google Scholar] [CrossRef]
  4. Choi, J.; Park, S.W.; Kim, J.; Park, J.; Kim, J.S. Predicting late enophthalmos: differences between medial and inferior orbital wall fractures. J Plast Reconstr Aesthet Surg. 2016, 69, 238–244. [Google Scholar] [CrossRef] [PubMed]
  5. Choi, S.H.; Kang, D.H. Prediction of late enophthalmos using preoperative orbital volume and fracture area measurements in blowout fracture. J Craniofac Surg. 2017, 28, 1717–1720. [Google Scholar] [CrossRef] [PubMed]
  6. Kunz, C.; Sigron, G.R.; Jaquiéry, C. Functional outcome after nonsurgical management of orbital fractures—the bias of decisionmaking according to size of defect: critical review of 48 patients. Br J Oral Maxillofac Surg. 2013, 51, 486–492. [Google Scholar] [CrossRef] [PubMed]
  7. Schouman, T.; Courvoisier, D.S.; Imholz, B.; Van Issum, C.; Terzic, A.; Scolozzi, P. Can systematic computed tomographic scan assessment predict treatment decision in pure orbital floor blowout fractures? J Oral Maxillofac Surg. 2012, 70, 1627–1632. [Google Scholar] [CrossRef] [PubMed]
  8. Raskin, E.M.; Millman, A.L.; Lubkin, V.; Della Rocca, R.C.; Lisman, R.D.; Maher, E.A. Prediction of late enophthalmos by volumetric analysis of orbital fractures. Ophthalmic Plast Reconstr Surg. 1998, 14, 19–26. [Google Scholar] [CrossRef] [PubMed]
  9. Zhang, Z.; Zhang, Y.; He, Y.; An, J.; Zwahlen, R.A. Correlation between volume of herniated orbital contents and the amount of enophthalmos in orbital floor and wall fractures. J Oral Maxillofac Surg. 2012, 70, 68–73. [Google Scholar] [CrossRef] [PubMed]
  10. Jansen, J.; Schreurs, R.; Dubois, L.; Maal, T.J.; Gooris, P.J.; Becking, A.G. Orbital volume analysis: validation of a semi-automatic software segmentation method. Int J Comput Assist Radiol Surg. 2016, 11, 11–18. [Google Scholar] [CrossRef] [PubMed]
  11. Ahn, H.B.; Ryu, W.Y.; Yoo, K.W.; et al. Prediction of enophthalmos by computer-based volume measurement of orbital fractures in a Korean population. Ophthalmic Plast Reconstr Surg. 2008, 24, 36–39. [Google Scholar] [CrossRef] [PubMed]
  12. Kärkkäinen, M.; Wilkman, T.; Mesimäki, K.; Snäll, J. Primary reconstruction of orbital fractures using patient-specific titanium milled implants: the Helsinki protocol. Br J Oral Maxillofac Surg. 2018, 56, 791–796. [Google Scholar] [CrossRef] [PubMed]
  13. Bland, J.M.; Altman, D.G. Statistical methods for assessing agreement between two methods of clinical measurement. Lancet. 1986, 327, 307–310. [Google Scholar] [CrossRef]
  14. Bland, J.M.; Altman, D.G. Measuring agreement in method comparison studies. Stat Methods Med Res. 1999, 8, 135–160. [Google Scholar] [CrossRef] [PubMed]
  15. Dubois, L.; Jansen, J.; Schreurs, R.; et al. How reliable is the visual appraisal of a surgeon for diagnosing orbital fractures? J Craniomaxillofac Surg. 2016, 44, 1015–1024. [Google Scholar] [CrossRef] [PubMed]
  16. Vicinanzo, M.G.; McGwin GJr Allamneni, C.; Long, J.A. Interreader variability of computed tomography for orbital floor fracture. JAMA Ophthalmol. 2015, 133, 1393–1397. [Google Scholar] [CrossRef] [PubMed]
  17. Bruneau, S.; De Haller, R.; Courvoisier, D.S.; Scolozzi, P. Can a specific computed tomography-based assessment predict the ophthalmological outcome in pure orbital floor blowout fractures? J Craniofac Surg. 2016, 27, 2092–2097. [Google Scholar] [CrossRef] [PubMed]
  18. Lee, W.T.; Kim, H.K.; Chung, S.M. Relationship between smallsize medial orbital wall fracture and late enophthalmos. J Craniofac Surg. 2009, 20, 75–80. [Google Scholar] [CrossRef] [PubMed]
  19. Goggin, J.; Jupiter, D.C.; Czerwinski, M. Simple computed tomography-based calculations of orbital floor fracture defect size are not sufficiently accurate for clinical use. J Oral Maxillofac Surg. 2015, 73, 112–116. [Google Scholar] [CrossRef] [PubMed]
  20. Schouman, T.; Courvoisier, D.S.; Imholz, B.; Van Issum, C.; Scolozzi, P. Computational area measurement of orbital floor fractures: reliability, accuracy and rapidity. Eur J Radiol. 2012, 81, 2251–2254. [Google Scholar] [CrossRef] [PubMed]
  21. Ang, C.H.; Low, J.R.; Shen, J.Y.; et al. A protocol to reduce interobserver variability in the computed tomography measurement of orbital floor fractures. Craniomaxillofac Trauma Reconstr. 2015, 8, 289–298. [Google Scholar] [CrossRef] [PubMed]
  22. Doerfler, H.M.; Huempfner-Hierl, H.; Kruber, D.; Schulze, P.; Hierl, T. Template-based orbital wall fracture treatment using statistical shape analysis. J Oral Maxillofac Surg. 2017, 75, 1475. [Google Scholar] [CrossRef]
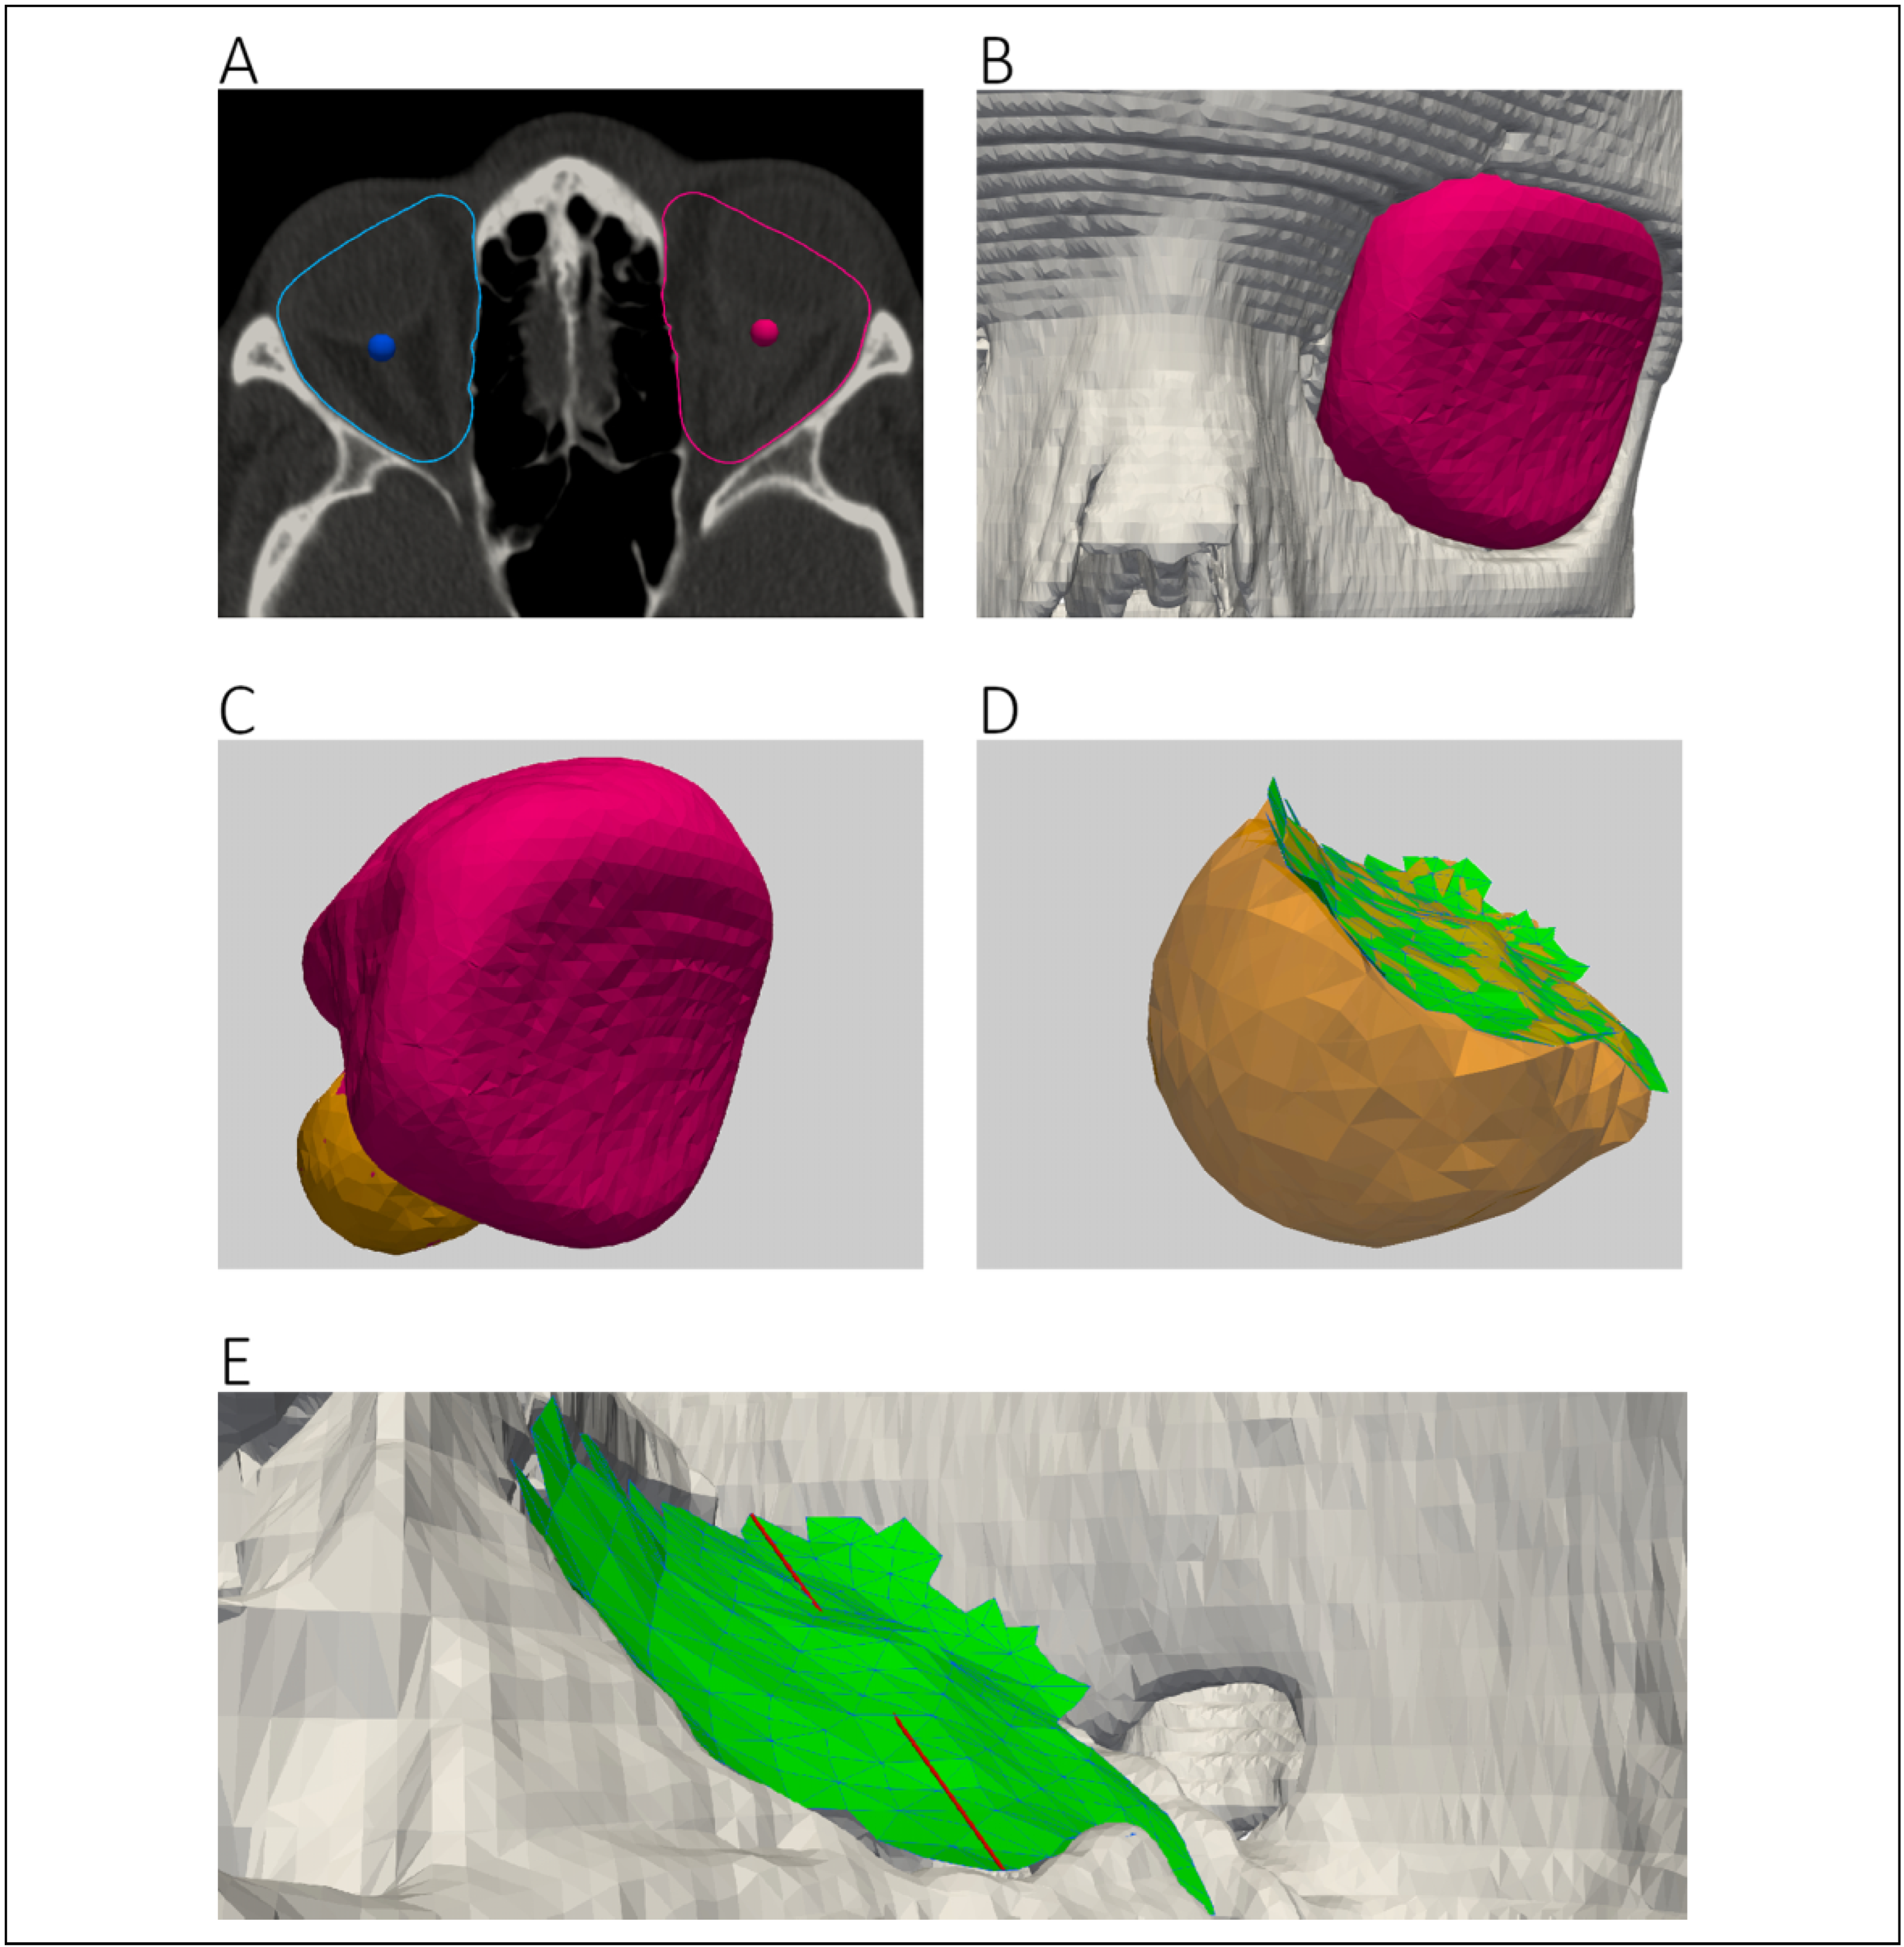
Figure 1. Workflow for semiautomatic measurements. A, Operator selects seed points inside left (red) and right (blue) orbits and defines laterality of fracture and lower and upper limits of HU values for segmentation. Result of automatized segmentation is visualized with blue outline. B, Anterior limit of segmentation is defined as a concave surface coming into contact with bony rims of orbit. C and D, Fractured volume (orange) is defined as the difference in shape between fractured and intact orbits. E, Fracture surface (green) is defined as the surface elements of fractured volume in contact with simulated preinjury orbital wall. Maximum fracture width/length is automatically obtained by sampling intersect between sagittal (length) or coronal (width) plane and fracture surface in 0.1 mm intervals and finding the largest value. Maximum fracture length is visualized with red line. HU indicates Hounsfield unit.
Cmtr 14 00032 g001
Figure 2. Segmented orbital volume (purple) of nonaffected side as well as automatically segmented fracture surface (green) and bony walls of orbit (light blue).
Cmtr 14 00032 g002
Figure 3. Semiautomatically measured maximal length (yellow) and width (red) of the segmented fracture surface (teal) measured along the same planes as used in sagittal and coronal series used for manual measurement of fracture length and width, respectively.
Cmtr 14 00032 g003
Figure 4. Bland-Altman limits of agreement plot for intraobserver variability in manually measured AP/ML fracture dimensions for observer 1. Mean fracture AP/ML dimension for each case (horizontal axis) was calculated as a mean of 2 measurements for observer 1. Difference (vertical axis) between measurements for each case was calculated as a difference between the 2 measurements. AP indicates anteroposterior, ML; mediolateral, LLoA; Lower Limit of Agreement, ULoa; Upper Limit of Agreement.
Cmtr 14 00032 g004
Figure 5. Bland-Altman limits of agreement plot for intraobserver variability in manually measured AP/ML fracture dimensions for observer 2. Mean fracture AP/ML dimension for each case (horizontal axis) was calculated as a mean of 2 measurements for observer 2. Difference (vertical axis) between measurements for each case was calculated as a difference between the 2 measurements. AP indicates anteroposterior, ML; mediolateral, LLoA; Lower Limit of Agreement, ULoa; Upper Limit of Agreement.
Cmtr 14 00032 g005
Figure 6. Bland-Altman limits of agreement plots for intraobserver variability in semiautomatically measured AP/ML fracture dimensions for observer 1. Mean fracture AP/ML dimension for each case (horizontal axis) was calculated as a mean of 2 measurements for observer 1. Difference (vertical axis) between measurements for each case was calculated as a difference between the 2 measurements for observer 1. AP indicates anteroposterior, ML; mediolateral, LLoA; Lower Limit of Agreement, ULoa; Upper Limit of Agreement.
Cmtr 14 00032 g006
Figure 7. Bland-Altman limits of agreement plots for intraobserver variability in semiautomatically measured AP/ML fracture dimensions for observer 2. Mean fracture AP/ML dimension for each case (horizontal axis) was calculated as a mean of 2 measurements for observer 2. Difference (vertical axis) between measurements for each case was calculated as a difference between the 2 measurements for observer 2. AP indicates anteroposterior, ML; mediolateral, LLoA; Lower Limit of Agreement, ULoa; Upper Limit of Agreement.
Cmtr 14 00032 g007
Figure 8. Bland-Altman limits of agreement plot for interobserver variability in manually measured AP/ML fracture dimensions. Mean fracture AP/ML dimension for each case (horizontal axis) was calculated as a mean of 2 measurements for both 2 observers (mean of total 4 measurements/case). Difference (vertical axis) was calculated as a difference between means of each 2 observers measurements. AP indicates anteroposterior, ML; mediolateral, LLoA; Lower Limit of Agreement, ULoa; Upper Limit of Agreement.
Cmtr 14 00032 g008
Figure 9. Bland-Altman limits of agreement plot for interobserver variability in semiautomatically measured AP/ML fracture dimensions. Mean fracture AP/ML dimension for each case (horizontal axis) was calculated as a mean of 2 measurements for both 2 observers (mean of total 4 measurements/case). Difference (vertical axis) was calculated as a difference between means of each 2 observers’ measurements. AP indicates anteroposterior; LLoA, lower limit of agreement; ML, mediolateral; ULoA, upper limit of agreement.
Cmtr 14 00032 g009
Figure 10. Bland-Altman limits of agreement plot for variability between manual and semiautomatic measurements for fracture AP/ML dimensions. Mean fracture AP/ML dimension for each case (horizontal axis) was calculated as a mean of 2 manual and 2 semiautomatic measurements for both 2 observers (mean of total 8 measurements/case). Difference (vertical axis) was calculated as a difference between means for manual and semiautomatic measurements. AP indicates anteroposterior; LLoA, lower limit of agreement; ML, mediolateral; ULoA, upper limit of agreement.
Cmtr 14 00032 g010
Table 1. ICCs for Manual and Automatic Fracture Dimension Measurements.
Cmtr 14 00032 i001
Abbreviations: AP, anteroposterior; CI, confidence interval; ICC, intra-class correlation coefficient; ML, mediolateral; NA, not applicable. aICC (3,1) (2-way mixed, single measurement, absolute agreement). bArea measurements are based only on automatic measures. cICC (2,1) (2-way random, single measurement, absolute agreement).
Table 2. Fracture Area Measurements.
Cmtr 14 00032 i002