
Can New-Type Urbanization Construction Narrow the Urban–Rural Income Gap? Evidence from China


Abstract
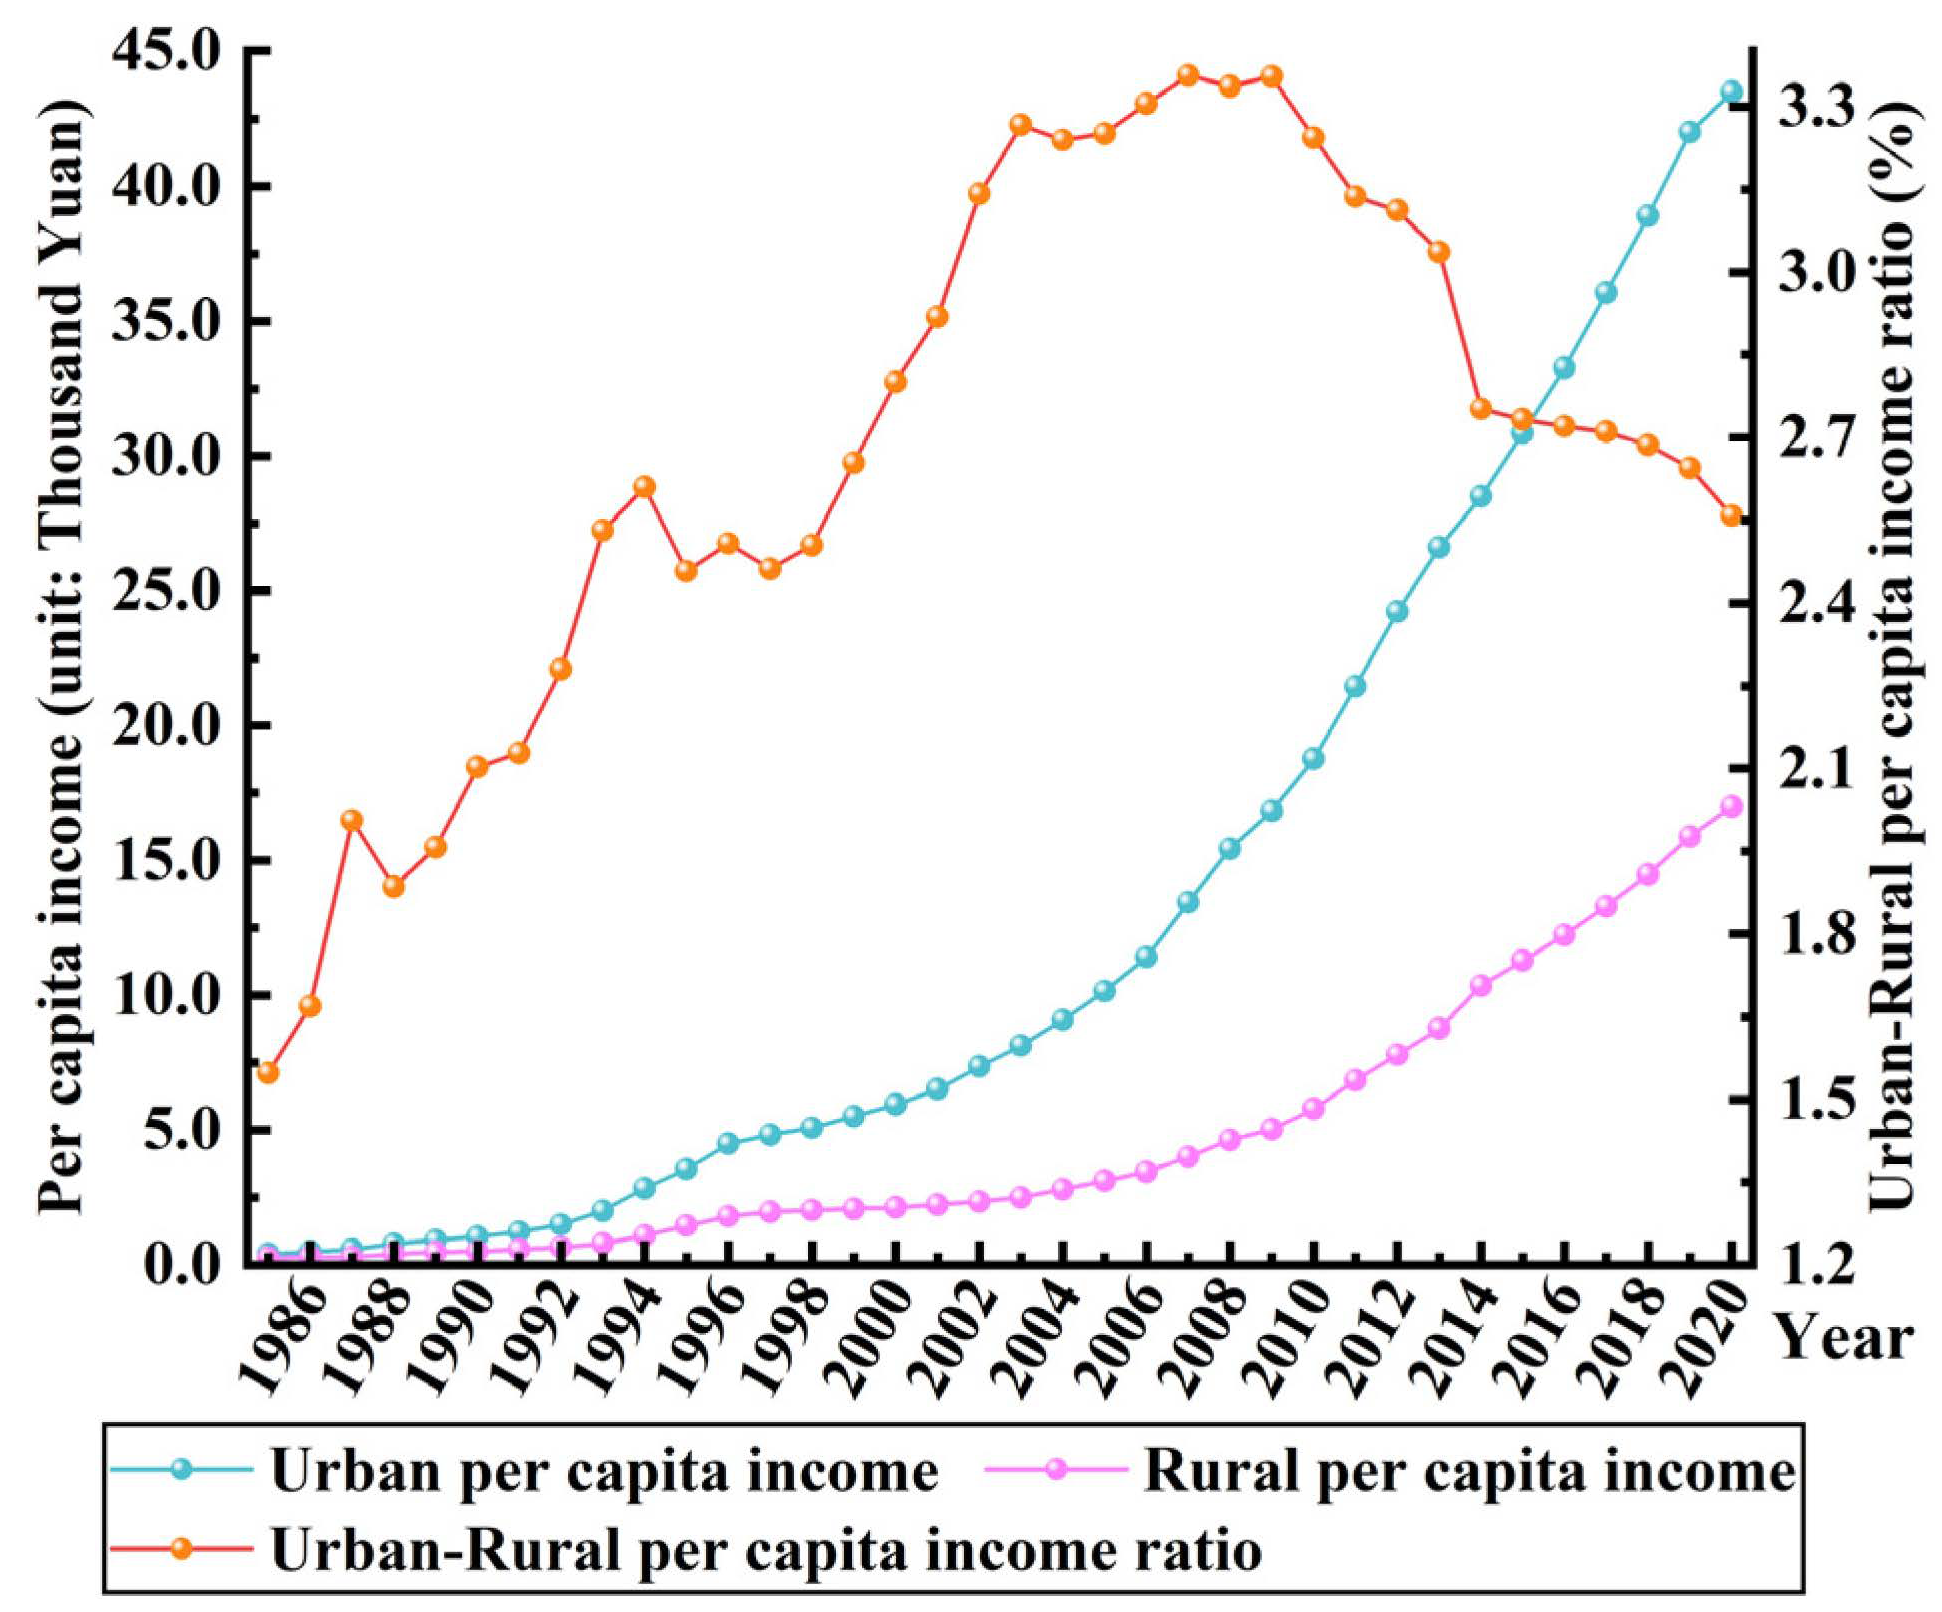
1. Introduction
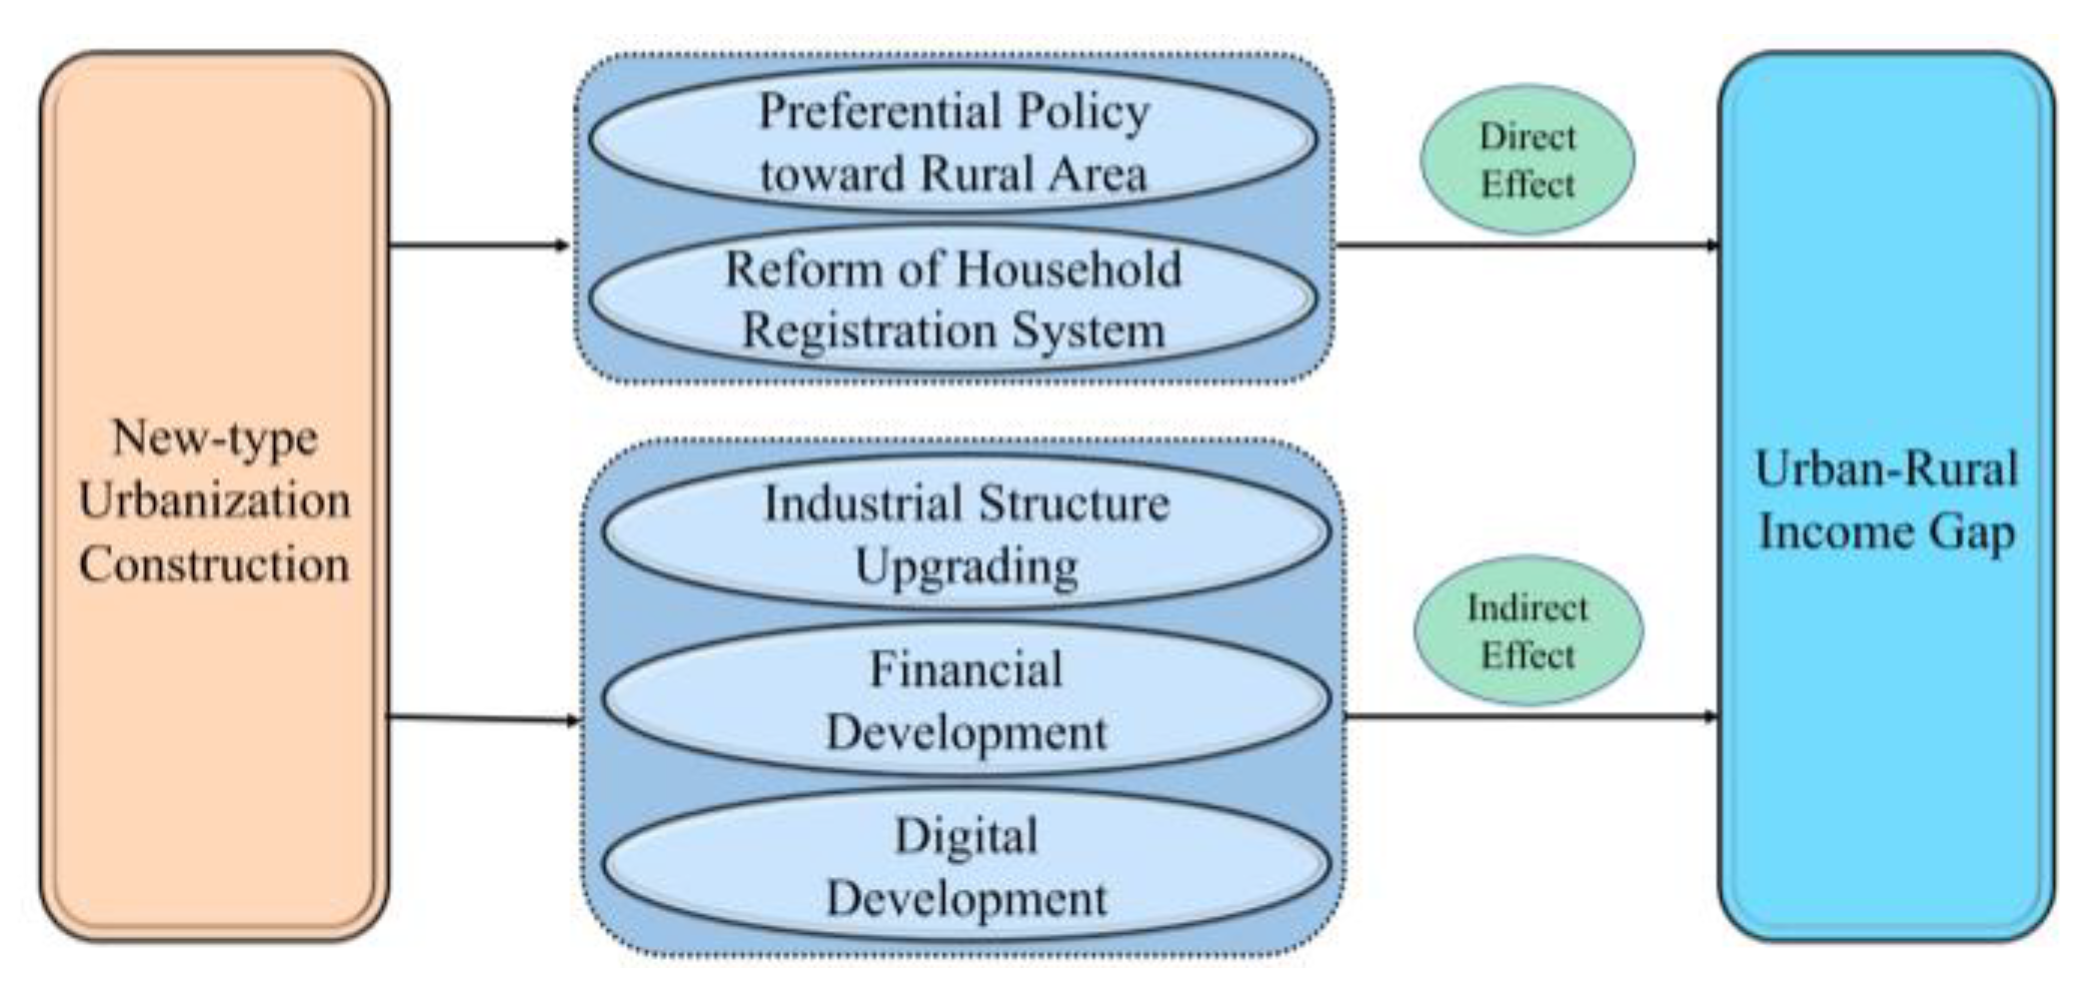
2. Theoretical Mechanism
2.1. Effect of the NTUC on URIG
2.2. Moderating Effect
2.2.1. Industrial Structure Upgrading
2.2.2. Financial and Digital Development
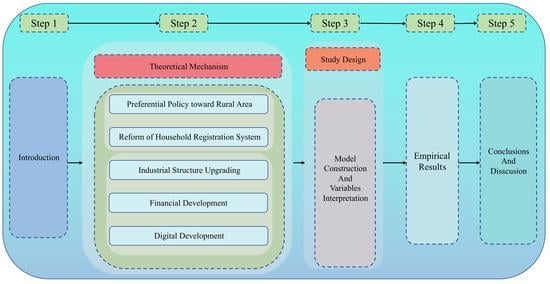
3. Study Design
3.1. Model Specification
3.2. Description of Variables
3.2.1. Explanatory Variables
3.2.2. Core Explanatory Variables (Treated × Time)
3.2.3. Control Variables
3.2.4. Mediating Variables
4. Analysis of the Impact of NTUC on the URIG
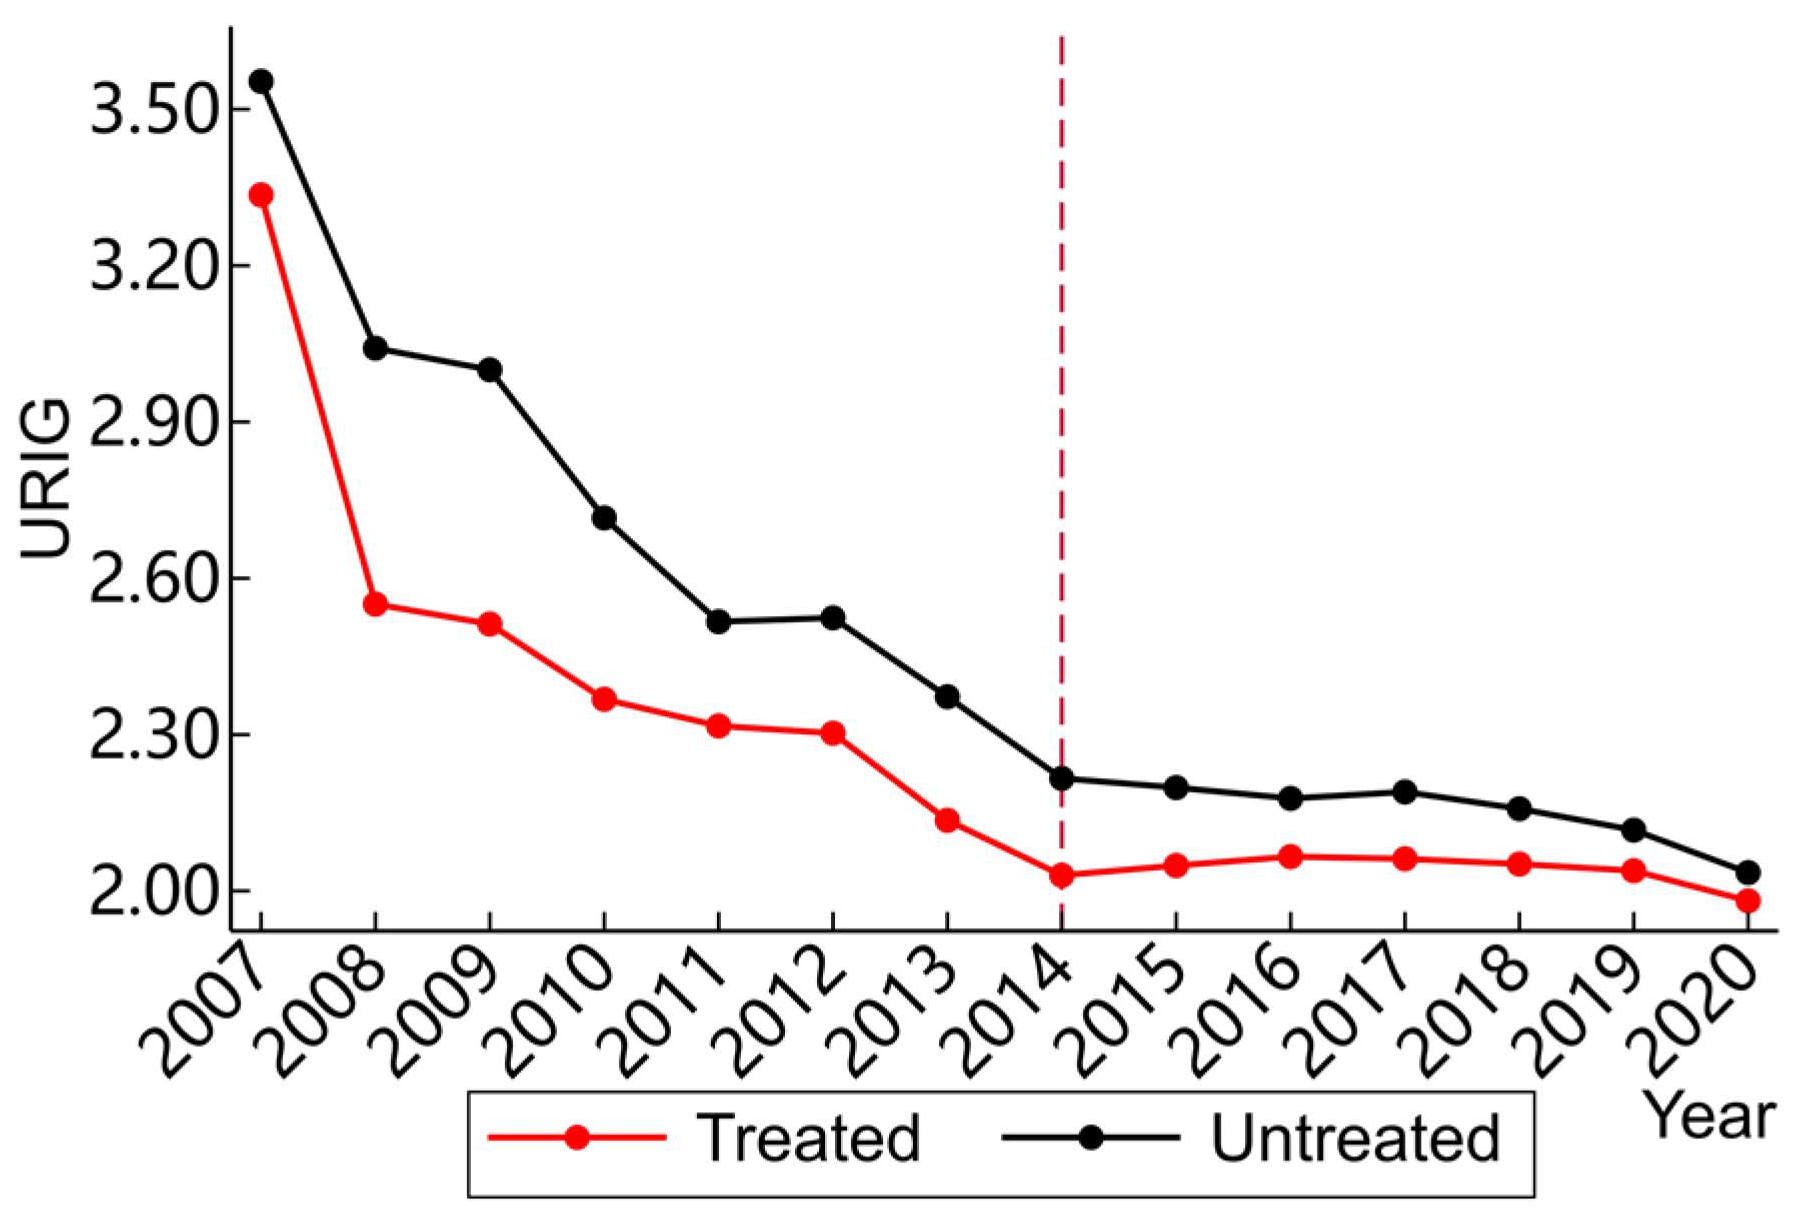
4.1. Time Trend Graph of URIG
4.2. Baseline Regression Results
4.2.1. Effect of the NTUC on the URIG
4.2.2. Robustness Tests
- (1)
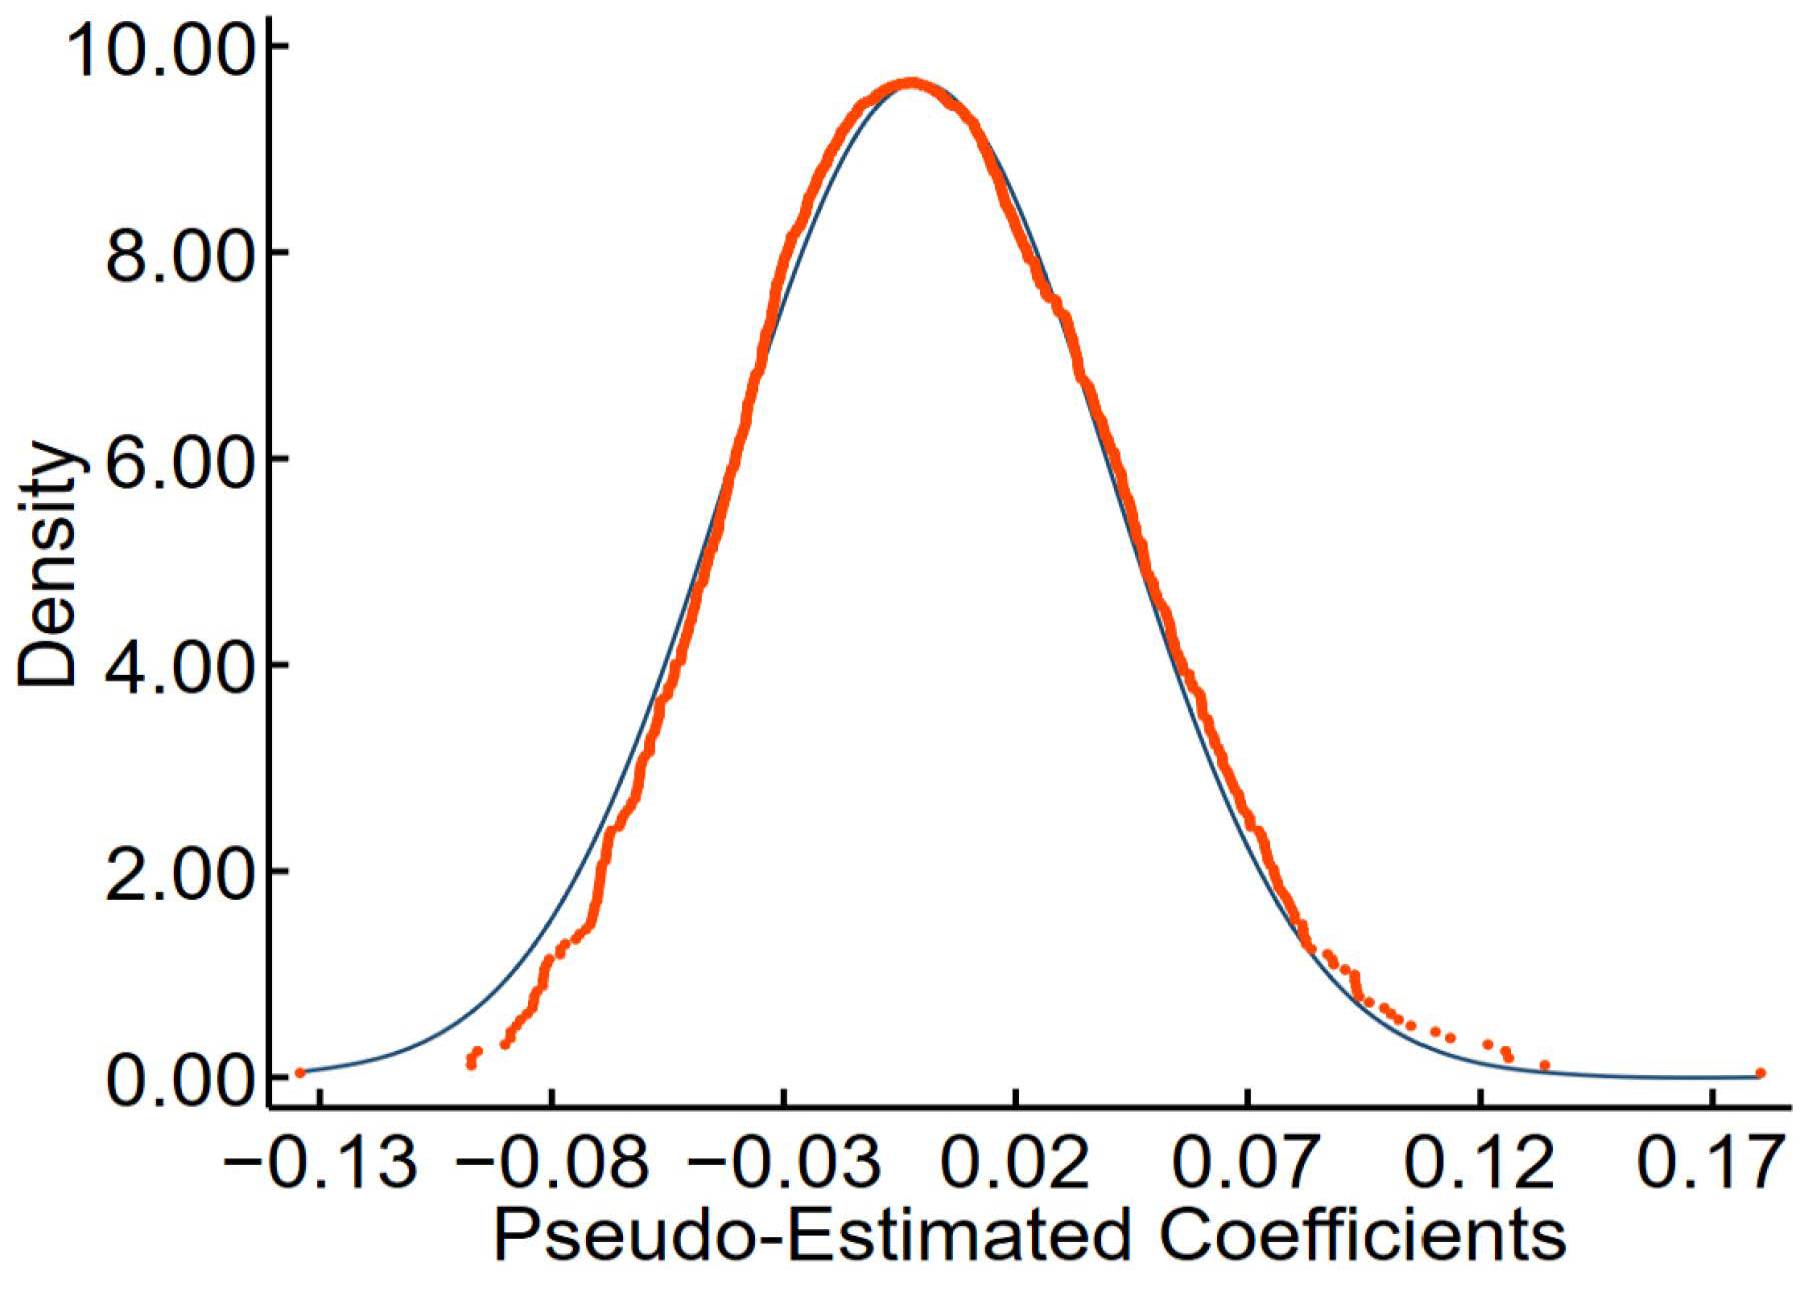
- Placebo Test
- (2)
- Sample Tailing Treatment
- (3)
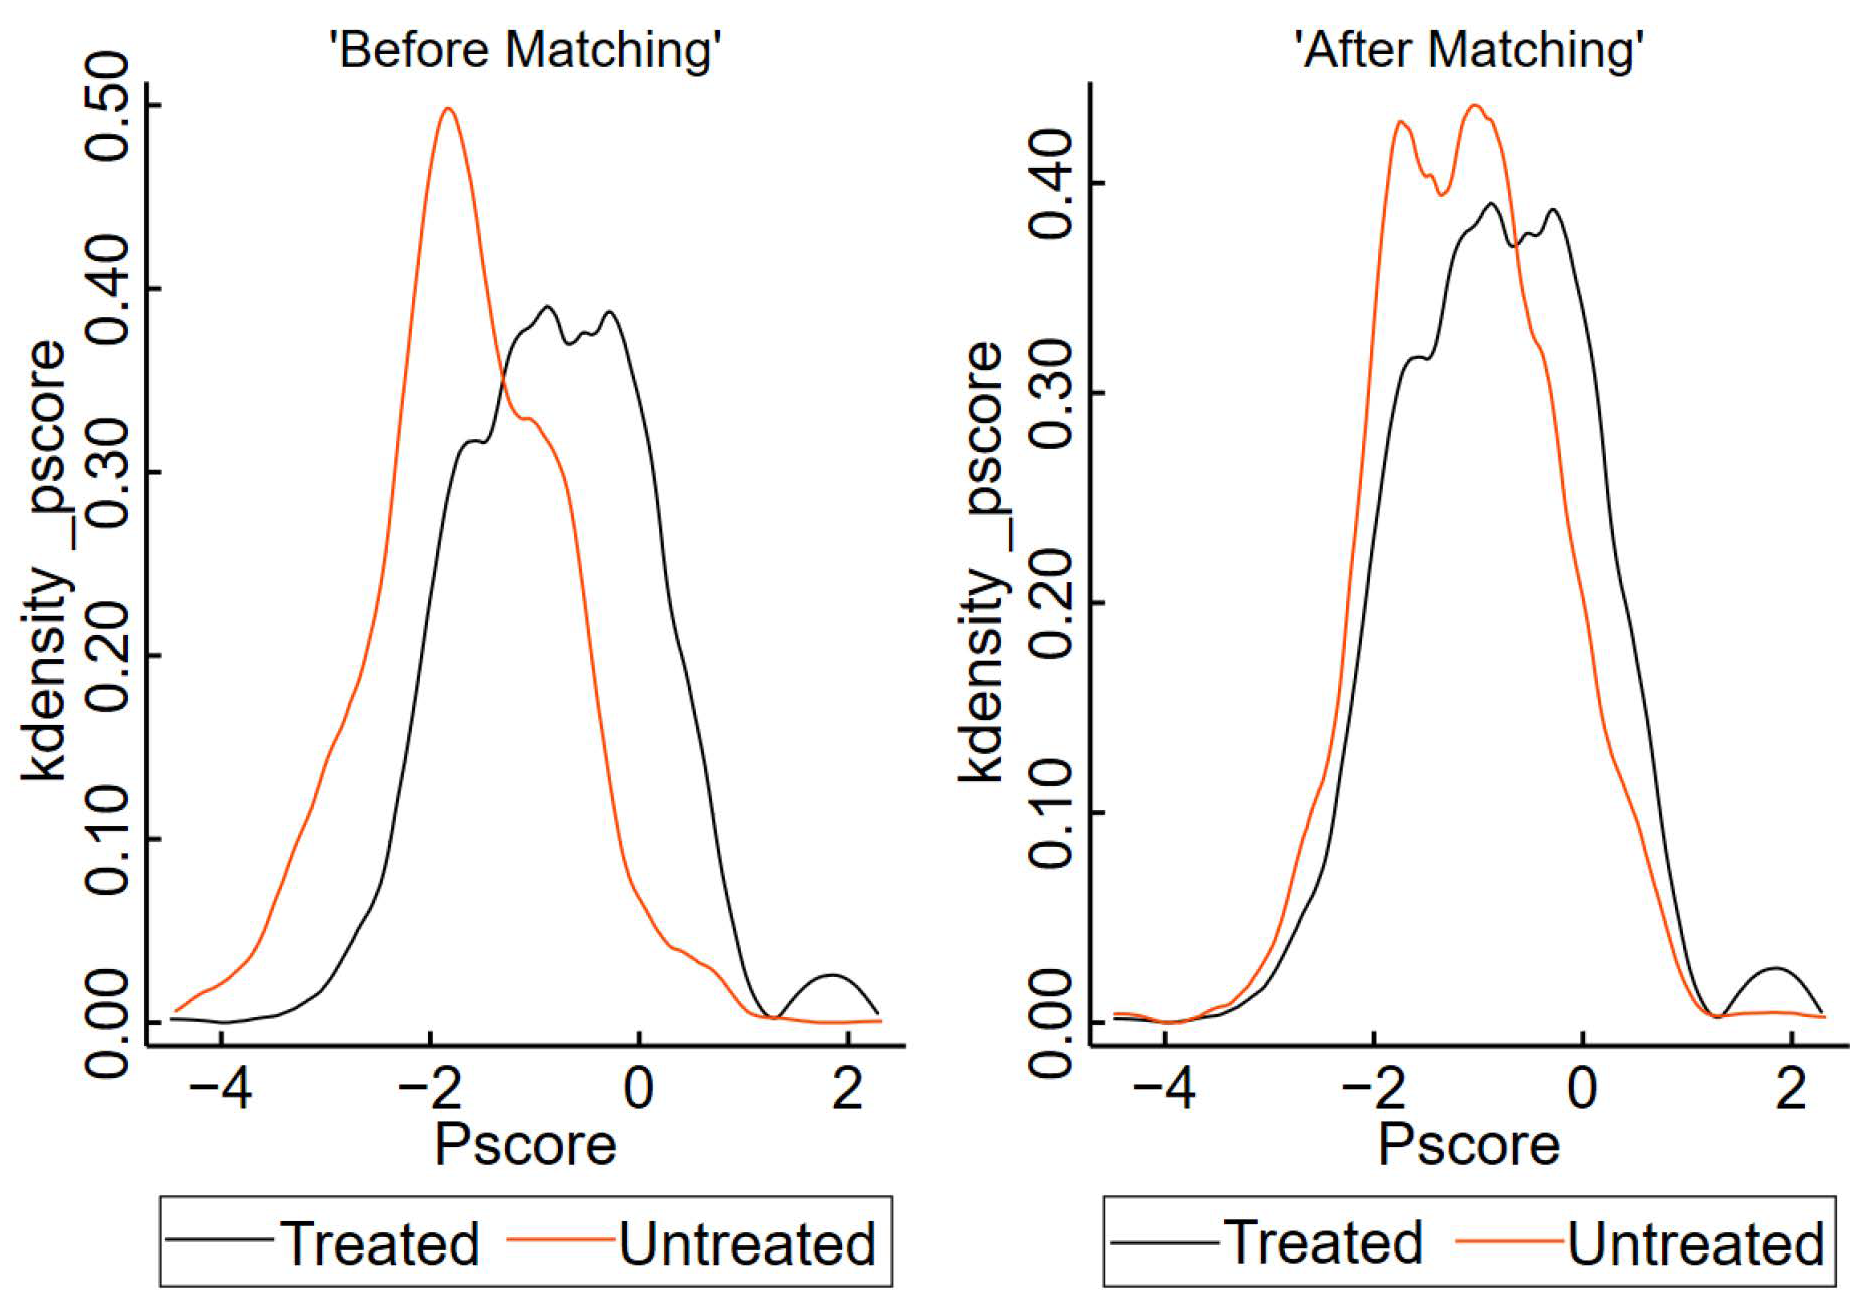
- Robustness Test of PSM-DID Method.
- (4)
- Delete the Observation Value in the Year (2014) of Policy Implementation
- (5)
- Robustness Test of the Removal Some Pilot Areas
- (6)
- Time-Varying Difference-in-Difference Test
4.3. Heterogeneity Analysis
4.3.1. Dynamic Effect of NTUC on the URIG
4.3.2. Regional Heterogeneity Analysis
4.4. Mediating Effect Test
4.4.1. Estimated Results of Hypothesis 2
4.4.2. Results Estimated of Hypothesis 2
4.4.3. Results Estimated of Hypothesis 3
5. Conclusions and Discussions
5.1. Conclusions
5.2. Discussions
5.3. Deficiencies and Prospects
Author Contributions
Funding
Institutional Review Board Statement
Informed Consent Statement
Data Availability Statement
Acknowledgments
Conflicts of Interest
References
- Ma, X.; Wang, F.; Chen, J.; Zhang, Y. The income gap between urban and rural residents in China: Since 1978. Comput. Econ. 2018, 52, 1153–1174. [Google Scholar] [CrossRef]
- Hong, M.; Zhang, W. Industrial structure upgrading, urbanization and urban-rural income disparity: Evidence from China. Appl. Econ. Lett. 2021, 28, 1321–1326. [Google Scholar] [CrossRef]
- Lu, H.; Zhao, P.; Hu, H.; Zeng, L.; Wu, K.S.; Lv, D. Transport infrastructure and urban-rural income disparity: A municipal-level analysis in China. J. Transp. Geogr. 2022, 99, 103292. [Google Scholar] [CrossRef]
- Sicular, T.; Ximing, Y.; Gustafsson, B.; Shi, L. The urban–rural income gap and inequality in China. Rev. Income Wealth 2007, 53, 93–126. [Google Scholar] [CrossRef]
- Han, L.; Zhang, Q. Impact of Higher Education Expansion on the Urban-Rural Income Gap in China: An Empirical Analysis based on Provincial Panel Data. Sci. Soc. Res. 2022, 4, 101–111. [Google Scholar] [CrossRef]
- Liu, Y.; Long, C. Urban and Rural Income Gap: Does Urban Spatial Form Matter in China? SAGE Open 2021, 11, 21582440211002215. [Google Scholar] [CrossRef]
- The CPC Central Committee; The State Council. National New Urbanization Plan (2014–2020). The Central People’s Government of the People’s Republic of China, 16 March 2014. Available online: http://www.gov.cn/gongbao/content/2014/content_2644805.htm?oCZ (accessed on 15 August 2022).
- Chen, M.; Liu, W.; Lu, D.; Chen, H.; Ye, C. Progress of China’s new-type urbanization construction since 2014: A preliminary assessment. Cities 2018, 78, 180–193. [Google Scholar] [CrossRef]
- Li, J.; Li, F.; Li, J. Does new-type urbanization help reduce haze pollution damage? Evidence from China’s county-level panel data. Environ. Sci. Pollut. Res. 2022, 29, 47123–47136. [Google Scholar] [CrossRef]
- Yu, B. Ecological effects of new-type urbanization in China. Renew. Sust. Energ. Rev. 2021, 135, 110239. [Google Scholar] [CrossRef]
- Liu, C.L. On Lu Zuo-fu’s “rural modernization” construction model. Chongqing Soc. Sci. 2004, 1, 110–115. (In Chinese) [Google Scholar]
- Chen, M.; Zhou, Y.; Huang, X.; Chao, Y. The integration of new-type urbanization and rural revitalization strategies in China: Origin, reality and future trends. Land 2021, 10, 207. [Google Scholar] [CrossRef]
- Preston, D.A. Rural-urban and inter-settlement interaction: Theory and analytical structure. Area 1975, 7, 171–174. Available online: http://www.jstor.org/stable/20001000 (accessed on 23 August 2022).
- Bayulken, B.; Huisingh, D. A literature review of historical trends and emerging theoretical approaches for developing sustainable cities (part 1). J. Clean. Prod. 2015, 109, 11–24. [Google Scholar] [CrossRef]
- Chen, M.; Liu, W.; Lu, D. Challenges and the way forward in China’s new-type urbanization. Land Use Policy 2016, 55, 334–339. [Google Scholar] [CrossRef]
- Liu, Y.S. Research on the urban-rural integration and rural revitalization in the new era in China. Acta Geogr. Sin. 2018, 73, 637–650. [Google Scholar] [CrossRef]
- Zhao, Z. Migration, labor market flexibility, and wage determination in China: A review. Dev. Econ. 2005, 43, 285–312. [Google Scholar] [CrossRef]
- Meng, X. Labor market outcomes and reforms in China. J. Econ. Perspect. 2012, 26, 75–102. [Google Scholar] [CrossRef]
- Kocabas, A. The transition to low carbon urbanization in Turkey: Emerging policies and initial action. Habitat Int. 2013, 37, 80–87. [Google Scholar] [CrossRef]
- Yu, Y.; Zhang, N. Low-carbon city pilot and carbon emission efficiency: Quasi-experimental evidence from China. Energy Econ. 2021, 96, 105125. [Google Scholar] [CrossRef]
- Hoang, A.T.; Nguyen, X.P. Integrating renewable sources into energy system for smart city as a sagacious strategy towards clean and sustainable process. J. Clean. Prod. 2021, 305, 127161. [Google Scholar] [CrossRef]
- Chu, Z.; Cheng, M.; Yu, N.N. A smart city is a less polluted city. Technol. Forecast. Soc. Chang. 2021, 172, 121037. [Google Scholar] [CrossRef]
- Jabareen, Y. Planning the resilient city: Concepts and strategies for coping with climate change and environmental risk. Cities 2013, 31, 220–229. [Google Scholar] [CrossRef]
- Xie, Y.; Zhou, X. Income inequality in today’s China. Proc. Natl. Acad. Sci. USA 2014, 111, 6928–6933. [Google Scholar] [CrossRef] [PubMed]
- Kanbur, R.; Wang, Y.; Zhang, X. The great Chinese inequality turnaround. J. Comp. Econ. 2021, 49, 467–482. [Google Scholar] [CrossRef]
- Nilsson, I.; Delmelle, E.C. On the link between rail transit and spatial income segregation. Appl. Geogr. 2020, 125, 102364. [Google Scholar] [CrossRef]
- Le, N.; Chung, D. Education, Employment, and Income: An Overview of Rural-Urban Gaps in Vietnam. Vietnam. J. Agric. Sci. 2020, 3, 647–661. [Google Scholar] [CrossRef]
- Lagakos, D. Urban-rural gaps in the developing world: Does internal migration offer opportunities? J. Econ. Perspect. 2020, 34, 174–192. [Google Scholar] [CrossRef]
- Băncescu, I. Rural-urban income gap and labour market in Romania[C]//SHS Web of Conferences. EDP Sci. 2021, 95, 01003. [Google Scholar] [CrossRef]
- Li, H. The Effect of Labor Mobility on the Urban-Rural Income Gap—Based on 272 Prefecture-Level City Panel Data in China. Mod. Econ. 2018, 9, 1287–1300. [Google Scholar] [CrossRef]
- Ji, X.; Wang, K.; Xu, H.; Li, M. Has Digital Financial Inclusion Narrowed the Urban-Rural Income Gap: The Role of Entrepreneurship in China. Sustainability 2021, 13, 8292. [Google Scholar] [CrossRef]
- Yuan, Y.; Wang, M.; Zhu, Y.; Huang, X.; Xiong, X. Urbanization’s effects on the urban-rural income gap in China: A meta-regression analysis. Land Use Policy 2020, 99, 104995. [Google Scholar] [CrossRef]
- Su, C.-W.; Liu, T.-Y.; Chang, H.-L.; Jiang, X.-Z. Is urbanization narrowing the urban-rural income gap? A cross-regional study of China. Habitat Int. 2015, 48, 79–86. [Google Scholar] [CrossRef]
- Andorka, R. Rural-urban differences in income level and in living conditions in Hungary. Landsc. Urban Plan. 1993, 27, 217–222. [Google Scholar] [CrossRef]
- Gerrish, E.; Watkins, S.L. The relationship between urban forests and income: A meta-analysis. Landsc. Urban Plan. 2018, 170, 293–308. [Google Scholar] [CrossRef]
- Wang, S.; Tan, S.; Yang, S.; Lin, Q.; Zhang, L. Urban-biased land development policy and the urban-rural income gap: Evidence from Hubei Province, China. Land Use Policy 2019, 87, 104066. [Google Scholar] [CrossRef]
- Meng, H.; Deng, P.; Zhang, J. Nonlinear Impact of Circulation-Industry Intelligentization on the Urban–Rural Income Gap: Evidence from China. Sustainability 2022, 14, 9405. [Google Scholar] [CrossRef]
- Ma, G.; Lv, D.; Luo, Y.; Jiang, T. Environmental Regulation, Urban-Rural Income Gap and Agricultural Green Total Factor Productivity. Sustainability 2022, 14, 8995. [Google Scholar] [CrossRef]
- Zhou, Q.; Shi, W. How does town planning affect urban-rural income inequality: Evidence from China with simultaneous equation analysis. Landsc. Urban Plan 2022, 221, 104380. [Google Scholar] [CrossRef]
- Chen, C. The impact of foreign direct investment on urban-rural income inequality: Evidence from China. China Agr. Econ. Rev. 2016, 8, 480–497. [Google Scholar] [CrossRef]
- Jones, G.A.; Corbridge, S. The continuing debate about urban bias: The thesis, its critics, its influence and its implications for poverty-reduction strategies. Prog. Dev. Stud. 2010, 10, 1–18. [Google Scholar] [CrossRef]
- Afridi, F.; Li, S.X.; Ren, Y. Social identity and inequality: The impact of China’s hukou system. J. Public Econ. 2015, 123, 17–29. [Google Scholar] [CrossRef]
- Cochrane, W.W. Farm Prices: Myth and Reality; Uinversity of Minnesota Press: Minneapolis, MN, USA, 1958. [Google Scholar]
- Lyu, P.; Yu, M.; Hu, Y. Contradictions in and improvements to urban and rural residents’ housing rights in China’s urbanization process. Habitat Int. 2020, 97, 102101. [Google Scholar] [CrossRef]
- Hamilton, B.H. Does entrepreneurship pay? An empirical analysis of the returns to self-employment. J. Polit. Econ. 2000, 108, 604–631. [Google Scholar] [CrossRef]
- Parker, S.C. The distribution of self-employment income in the United Kingdom, 1976–1991. Econ. J. 1997, 107, 455–466. [Google Scholar] [CrossRef]
- Constant, A.; Zimmermann, K.F. The making of entrepreneurs in Germany: Are native men and immigrants alike? Small Bus. Econ. 2006, 26, 279–300. [Google Scholar] [CrossRef]
- Lu, J.; Tao, Z. Determinants of entrepreneurial activities in China. J. Bus. Ventur. 2010, 25, 261–273. [Google Scholar] [CrossRef]
- Paulson, A.L.; Townsend, R. Entrepreneurship and financial constraints in Thailand. J. Corp. Financ. 2004, 10, 229–262. [Google Scholar] [CrossRef]
- Jiao, M.; Xu, H. How do Collective Operating Construction Land (COCL) Transactions affect rural residents’ property income? Evidence from rural Deqing County, China. Land Use Policy 2022, 113, 105897. [Google Scholar] [CrossRef]
- Adamson, D.W.; Clark, D.E.; Partridge, M.D. Do urban agglomeration effects and household amenities have a skill bias? J. Reg. Sci. 2004, 44, 201–224. [Google Scholar] [CrossRef]
- Fingleton, B.; Longhi, S. The Effects of Agglomeration on Wages: Evidence from the Micro-Level. J. Reg. Sci. 2013, 53, 443–463. [Google Scholar] [CrossRef]
- Hebsaker, M.; Neidhöfer, G.; Pfeiffer, F. Intergenerational mobility and self-selection on unobserved skills: New evidence. J. Labour Mark. Res. 2021, 55, 8. [Google Scholar] [CrossRef]
- Zervas, G.; Proserpio, D.; Byers, J.W. The rise of the sharing economy: Estimating the impact of Airbnb on the hotel industry. J. Mark. Res. 2017, 54, 687–705. [Google Scholar] [CrossRef]
- Hall, J.V.; Krueger, A.B. An analysis of the labor market for Uber’s driver-partners in the United States. Ilr Rev. 2018, 71, 705–732. [Google Scholar] [CrossRef]
- Berger, T.; Frey, C.B.; Levin, G.; Danda, S.R. Uber happy? Work and well-being in the ‘gig economy’. Econ. Policy 2019, 34, 429–477. [Google Scholar] [CrossRef]
- Fos, V.; Hamdi, N.; Kalda, A.; Kalda, A.; Nickerson, J. Gig-Labor: Trading Safety Nets for Steering Wheels. Available online: https://ssrn.com/abstract=3414041 (accessed on 3 July 2019).
- Beck, T.; Demirgüç-Kunt, A.; Levine, R. Finance, inequality and the poor. J. Econ. Growth 2007, 12, 27–49. [Google Scholar] [CrossRef]
- Jeanneney, S.G.; Kpodar, K. Financial development and poverty reduction: Can there be a benefit without a cost? J. Dev. Stud. 2011, 47, 143–163. [Google Scholar] [CrossRef]
- Akhter, S.; Daly, K.J. Finance and poverty: Evidence from fixed effect vector decomposition. Emerg. Mark. Rev. 2009, 10, 191–206. [Google Scholar] [CrossRef]
- Imai, K.S.; Arun, T.; Annim, S.K. Microfinance and household poverty reduction: New evidence from India. World Dev. 2010, 38, 1760–1774. [Google Scholar] [CrossRef]
- Ghosh, J. Microfinance and the challenge of financial inclusion for development. Camb. J. Econ. 2013, 37, 1203–1219. [Google Scholar] [CrossRef]
- Yu, N.; Wang, Y. Can Digital Inclusive Finance Narrow the Chinese Urban–Rural Income Gap? The Perspective of the Regional Urban–Rural Income Structure. Sustainability 2021, 13, 6427. [Google Scholar] [CrossRef]
- Ambarkhane, D.; Shekhar Singh, A.; Venkataramani, B. Developing a comprehensive financial inclusion index. Manag. Labour Stud. 2016, 41, 216–235. [Google Scholar] [CrossRef]
- Gao, Y.; Zang, L.; Sun, J. Does Computer Penetration Increase Farmers’ Income? An Empirical Study from China. Telecommun. Policy 2018, 42, 345–360. [Google Scholar] [CrossRef]
- Bukht, R.; Heeks, R. Defining, Conceptualising and Measuring the Digital Economy. Development Informatics Working Paper no. 68. Available online: https://ssrn.com/abstract=3431732 (accessed on 3 August 2017).
- Couture, V.; Faber, B.; Gu, Y.; Liu, L. E-Commerce Integration and Economic Development: Evidence from China; National Bureau of Economic Research: Cambridge, MA, USA, 2018. [Google Scholar]
- Mary George, N.; Parida, V.; Lahti, T.; Wincent, J. A systematic literature review of entrepreneurial opportunity recognition: Insights on influencing factors. Int. Entrep. Manag. J. 2016, 12, 309–350. [Google Scholar] [CrossRef]
- Wu, H.; Hao, Y.; Ren, S.; Yang, X.; Xie, G. Does internet development improve green total factor energy efficiency? Evidence from China. Energ. Policy 2021, 153, 112247. [Google Scholar] [CrossRef]
- Bezdek, R.H.; Wending, R.M.; Diperna, P. Environmental protection, the economy, and jobs: National and regional analyses. J. Environ. Manag. 2008, 86, 63–79. [Google Scholar] [CrossRef] [PubMed]
- Chen, Y.; Luo, P.; Chang, T. Urbanization and the urban–rural income gap in China: A continuous wavelet coherency analysis. Sustainability 2020, 12, 8261. [Google Scholar] [CrossRef]
- Batabyal, A.A.; Beladi, H. Preference matching, income, and population distribution in urban and adjacent rural regions. Pap. Reg. Sci. 2019, 98, 2201–2208. [Google Scholar] [CrossRef]
- Prime, P.B. Utilizing FDI to stay ahead: The case of Singapore. Stud. Comp. Int. Dev. 2012, 47, 139–160. [Google Scholar] [CrossRef]
- Choi, I. Unit root tests for panel data. J. Int. Money Financ. 2001, 20, 249–272. [Google Scholar] [CrossRef]
- Liu, X.h. Foreign investment and urban-rural income gap: An analysis from the perspective of spatial effect. J. Jiangxi Univ. Financ. Econ. 2021, 16, 8. Available online: http://cfejxufe.magtech.com.cn/xb/EN/Y2021/V0/I1/16 (accessed on 23 August 2022).
- La Ferrara, E.; Chong, A.; Duryea, S. Soap operas and fertility: Evidence from Brazil. Am. Econ. J. Appl. Econ. 2012, 4, 1–31. [Google Scholar] [CrossRef]


| Variable Name | Symbols | Unit | Mean | S.D | Fisher-ADF | VIF |
|---|---|---|---|---|---|---|
| Urban–rural income gap | URIG | — | 2.4386 | 0.9748 | 2213.3702 *** | — |
| Interaction items | Treated × Time | — | 0.1122 | 0.3156 | 239.4726 ** | 1.09 |
| Environment regulation | ENR | — | 0.7810 | 0.1839 | 1654.9991 *** | 1.18 |
| Human capital | HUC | people | 10.4634 | 1.6040 | 1058.3783 *** | 1.32 |
| Government intervention | GOI | — | 2.7218 | 1.7174 | 1001.2759 *** | 1.29 |
| Population agglomeration | POA | ten thousand people/square kilometer | 0.0456 | 0.0364 | 823.3438 *** | 1.33 |
| Expanding opening-up | OPE | — | 0.2047 | 0.3802 | 1342.9752 *** | 1.11 |
| Upgrading industrial structure | ISU | — | 0.8783 | 0.0817 | 1283.8845 *** | — |
| Digital development | DGE | — | 0.0900 | 0.0804 | 1367.4502 *** | — |
| Financial development | FDL | — | 2.5878 | 1.9875 | 1084.7465 *** | — |
| Variables | Benchmark Regression | Time-Varying Difference-in-Difference | ||
|---|---|---|---|---|
| Model (1) | Model (2) | Model (3) | Model (4) | |
| Treated × Time | −0.4633 *** (0.0578) | −0.2449 *** (0.0565) | −0.4643 *** | −0.2885 *** (0.0552) |
| ENR | −1.3550 *** (0.0947) | −1.3495 *** (0.2051) | ||
| HUC | −0.1707 *** (0.0187) | −0.1653 *** (0.0201) | ||
| GOI | −0.1139 *** (0.0149) | −0.1129 *** (0.0209) | ||
| POPA | −2.2513 * (1.3284) | −1.9359 * (1.1330) | ||
| OPE | −0.0921 (0.0601) | −0.0922 (0.0629) | ||
| Constant | 2.4906 *** (0.0151) | 5.7422 *** (0.2100) | 2.5042 *** (0.0079) | 5.6769 *** (0.2890) |
| With-R2 | 0.0185 | 0.1250 | 0.0252 | 0.1293 |
| Observations | 3682 | 3682 | 3682 | 3682 |
| Variables | 1% Tailing Treatment | PSM-DID Test | Delete 2014 Observation | Deleted Sample Size | Time-Varying Difference-in-Difference | |
|---|---|---|---|---|---|---|
| Model (1) | Model (2) | Model (3) | Model (4) | Model (5) | Model (6) | |
| Treated × Time | −0.2704 *** (0.0252) | −0.2202 *** (0.0717) | −0.2278 *** (0.0723) | −0.3612 *** (0.1368) | −0.2884 *** (0.0559) | −0.3787 *** (0.0798) |
| ENR | −0.8689 *** (0.0503) | −1.3359 *** (0.2129) | −1.3295 *** (0.2044) | −1.3923 *** (0.2193) | −1.3177 *** (0.2020) | −1.3976 *** (0.2171) |
| HUC | −0.1598 *** (0.0097) | −0.2350 *** (0.0255) | −0.1703 *** (0.0205) | −0.1680 *** (0.0208) | −0.1642 *** (0.0195) | −0.1619 *** (0.0197) |
| GOI | −0.0785 *** (0.0079) | −0.1258 *** (0.0250) | −0.1259 *** (0.0235) | −0.1181 *** (0.0224) | −0.1250 *** (0.0231) | −0.1170 *** (0.0218) |
| POA | −1.7780 ** (0.6890 | −3.3948 ** (1.4277) | −2.3586 ** (1.1907) | −3.3668 * (1.8032) | −1.9670 * (1.1292) | −3.0750 * (1.6966) |
| OPE | −0.0182 (0.0315) | −0.0927 (0.0649) | −0.0944 (0.0633) | −0.0958 (0.0681) | −0.0953 (0.0641) | −0.0927 (0.0673) |
| Constant | 5.0875 *** (0.0314) | 6.4902 *** (0.3414) | 5.7676 *** (0.2905) | 5.7987 *** (0.3051) | 5.6902 *** (0.2828) | 5.7381 *** (0.2966) |
| With-R2 | 0.2409 | 0.1244 | 0.1252 | 0.1240 | 0.1300 | 0.1288 |
| Observations | 3609 | 3636 | 3419 | 3220 | 3419 | 3220 |
| Unmatched Samples | Matching Samples | Total | |
|---|---|---|---|
| Control group | 44 | 2812 | 2856 |
| Experimental group | 2 | 824 | 826 |
| Total | 46 | 3636 | 3682 |
| Variables | Short Term | Long Term |
|---|---|---|
| Model (1) | Model (2) | |
| Treated × Time | −0.1684 *** (0.0423) | −0.1710 *** (0.0543) |
| ENR | −1.4034 *** (0.2046) | −1.3843 *** (0.2059) |
| HUC | −0.1761 *** (0.0222) | −0.1741 *** (0.0217) |
| GOI | −0.1170 *** (0.0214) | −0.1553 *** (0.0213) |
| POA | −3.1990 *** (1.2094) | −2.9551 ** (1.1675) |
| OPE | −0.0864 (0.0587) | −0.0817 (0.0607) |
| Constant | 5.8648 *** (0.3012) | 5.8206 *** (0.2984) |
| With−R2 | 0.1214 | 0.1225 |
| Observations | 3682 | 3682 |
| Variables | Difference-in-Difference | Time-Varying Difference-in-Difference | ||||
|---|---|---|---|---|---|---|
| Eastern China Model (1) | Central China Model (2) | Western China Model (3) | Eastern China Model (4) | Central China Model (5) | Western China Model (6) | |
| Treated × Time | −0.0148 (0.0895) | −0.3806 *** (0.0951) | −0.4904 *** (0.1174) | −0.0824 (0.0807) | −0.3754 *** (0.0994) | −0.4324 *** (0.0862) |
| ENR | −1.2632 *** (0.2160_ | −1.2500 *** (0.1525) | −1.4222 *** (0.1148) | −1.2610 *** (0.2153) | −1.2524 *** (0.3167) | −1.4378 *** (0.2062) |
| HUC | −0.5721 *** (0.0961) | −0.1978 *** (0.0426) | −0.1336 *** (0.0151) | −0.5556 *** (0.0962) | −0.1915 ** (0.0745) | −0.1283 *** (0.0156) |
| GOI | −0.1657 *** (0.0406) | −0.1055 *** (0.0300) | −0.0872 *** (0.0139) | −0.1647 *** (0.0405) | −0.1029 *** (0.0358) | −0.0912 *** (0.0280) |
| POA | −1.5132 (1.6021) | 1.5183 (3.4851) | −8.6739 ** (4.1086) | −1.3553 (1.6016) | 1.4955 (2.3633) | −6.2190 (4.0977) |
| OPE | −0.0686 (0.0765) | −0.6550 *** (0.2374) | −0.0341 (0.0826) | −0.0721 (0.0763) | −0.6202 *** (0.2271) | −0.0345 (0.0437) |
| Constant | 9.9821 *** (1.0019) | 5.7646 *** (0.4629) | 5.7846 *** (0.2201) | 9.8001 *** (1.0021) | 5.6936 *** (0.8385) | 5.6967 *** (0.2871) |
| With-R2 | 0.1060 | 0.1093 | 0.322 | 0.1067 | 0.1124 | 0.3321 |
| Observations | 1344 | 1470 | 868 | 1344 | 1470 | 868 |
| Variables | Difference-in-Difference | Time-Varying Difference-in-Difference | ||
|---|---|---|---|---|
| Model (1) | Model (2) | Model (3) | Model (4) | |
| Explanatory variables | ISU | URIG | ISU | URIG |
| Treated × Time | 0.0234 *** (0.0024) | −0.1554 *** (0.0566) | 0.0263 *** (0.0020) | −0.1912 *** (0.0489) |
| ISU | −3.8297 *** (0.4058) | −3.6613 *** (0.4097) | ||
| ENR | 0.0536 *** (0.0039) | −1.1497*** (0.0960) | 0.0534 *** (0.0039) | −1.5141 *** (0.0956) |
| HUC | 0.0077 *** (0.0008) | −0.1412 *** (0.0187) | 0.0072 *** (0.0008) | −0.1388 *** (0.0187) |
| GOI | −0.0020 *** (0.0006) | −0.1217 *** (0.0147) | −0.0021 *** (0.0006) | −0.1201 *** (0.0147) |
| POA | −0.0005 (0.0553) | −2.2531 * (1.3116) | −0.0251 (0.0547) | −2.0277 (1.3090) |
| OPE | 0.0191 *** (0.0025) | −0.0190 (0.0599) | 0.0190 *** (0.0025) | −0.0225 (0.0598) |
| Constant | 0.7548 *** (0.0087) | 8.6330 *** (0.3699) | 0.7602 *** (0.0087) | 8.4603 *** (0.3742) |
| With-R2 | 0.1404 | 0.1473 | 0.1584 | 0.1493 |
| Observations | 3682 | 3682 | 3682 | 3682 |
| Variables | Difference-in-Difference | Time-Varying Difference-in-Difference | ||
|---|---|---|---|---|
| Model (1) | Model (2) | Model (3) | Model (4) | |
| Explanatory variables | FDL | URIG | FDL | URIG |
| Treated × Time | 0.6897 *** (0.1204) | −0.2196 *** (0.0566) | 0.8509 *** (0.1025) | −0.2599 *** (0.0486) |
| FDL | −0.0366 *** (0.0080) | −0.0336 *** (0.0080) | ||
| ENR | 0.9967 *** (0.2018) | −1.3185 *** (0.0948) | 0.9725 *** (0.1999) | −1.3168 *** (0.0942) |
| HUC | 0.2395 *** (0.0398) | −0.1620 *** (0.0187) | 0.2226 *** (0.0397) | −0.1578 *** (0.0187) |
| GOI | 0.3200 *** (0.0318) | −0.1022 *** (0.0151) | 0.3165 *** (0.0316) | −0.1022 *** (0.0151) |
| POA | 5.4616 * (2.8304) | −2.0512 (1.3253) | 4.4053 (2.8131) | −1.7878 (1.3212) |
| OPE | 1.6067 *** (0.1281) | −0.0332 (0.0613) | 1.6090 *** (0.1273) | −0.0381 (0.0612) |
| Constant | −2.2230 *** (0.4474) | 5.6607 *** (0.2101) | −2.0130 *** (0.4458) | 5.6093 *** (0.2099) |
| With-R2 | 0.1076 | 0.1304 | 0.1168 | 0.1338 |
| Observations | 3682 | 3682 | 3682 | 3682 |
| Variables | Difference-in-Difference | Time-Varying Difference-in-Difference | ||
|---|---|---|---|---|
| Model (1) | Model (2) | Model (3) | Model (4) | |
| Explanatory variables | DGE | URIG | DGE | URIG |
| Treated × Time | 0.0267 *** (0.0029) | −0.1884 *** (0.0569) | 0.0265 *** (0.0025) | −0.2356 *** (0.0488) |
| DGE | −2.1096 *** (0.3295) | −1.9918 *** (0.3303) | ||
| ENR | 0.0271 *** (0.0049) | −1.2978 *** (0.0946) | 0.0276 *** (0.0049) | −1.2944 *** (0.0941) |
| HUC | 0.0042 *** (0.0010) | −0.1620 *** (0.0186) | 0.0038 *** (0.0010) | −0.1578 *** (0.0186) |
| GOI | 0.0009 (0.0008) | −0.1121 *** (0.0148) | 0.0009 (0.0008) | −0.1111 *** (0.0148) |
| POA | 0.1813 *** (0.0686) | −1.7689 (1.3221) | 0.1686 ** (0.0683) | −1.6000 (1.3183) |
| OPE | −0.0119 *** (0.0031) | −0.1173 ** (0.0599) | −0.0122 *** (0.0031) | −0.1165 * (0.0598) |
| Constant | 0.0140 (0.0108) | 5.7718 *** (0.2088) | 0.0177 (0.0108) | 5.7123 *** (0.2088) |
| With-R2 | 0.0602 | 0.1354 | 0.0683 | 0.1385 |
| Observations | 3682 | 3682 | 3682 | 3682 |
Publisher’s Note: MDPI stays neutral with regard to jurisdictional claims in published maps and institutional affiliations. |
© 2022 by the authors. Licensee MDPI, Basel, Switzerland. This article is an open access article distributed under the terms and conditions of the Creative Commons Attribution (CC BY) license (https://creativecommons.org/licenses/by/4.0/).
Share and Cite
Liu, J.; Ma, X.; Jia, W.; Zhang, S. Can New-Type Urbanization Construction Narrow the Urban–Rural Income Gap? Evidence from China. Sustainability 2022, 14, 14725. https://doi.org/10.3390/su142214725
Liu J, Ma X, Jia W, Zhang S. Can New-Type Urbanization Construction Narrow the Urban–Rural Income Gap? Evidence from China. Sustainability. 2022; 14(22):14725. https://doi.org/10.3390/su142214725
Chicago/Turabian StyleLiu, Jiamin, Xiaoyu Ma, Wenli Jia, and Sisi Zhang. 2022. "Can New-Type Urbanization Construction Narrow the Urban–Rural Income Gap? Evidence from China" Sustainability 14, no. 22: 14725. https://doi.org/10.3390/su142214725
APA StyleLiu, J., Ma, X., Jia, W., & Zhang, S. (2022). Can New-Type Urbanization Construction Narrow the Urban–Rural Income Gap? Evidence from China. Sustainability, 14(22), 14725. https://doi.org/10.3390/su142214725