Abstract
Active layer thickness (ALT) is a sensitive indicator of response to climate change. ALT has important influence on various aspects of the regional environment such as hydrological processes and vegetation. In this study, 57 ground-penetrating radar (GPR) sections were surveyed along the Qinghai–Tibet Engineering Corridor (QTEC) during 2018–2021, covering a total length of 58.5 km. The suitability of GPR-derived ALT was evaluated using in situ measurements and reference datasets, for which the bias and root mean square error were approximately −0.16 and 0.43 m, respectively. The GPR results show that the QTEC ALT was in the range of 1.25–6.70 m (mean: 2.49 ± 0.57 m). Observed ALT demonstrated pronounced spatial variability at both regional and fine scales. We developed a statistical estimation model that explicitly considers the soil thermal regime (i.e., ground thawing index, TIg), soil properties, and vegetation. This model was found suitable for simulating ALT over the QTEC, and it could explain 52% (R2 = 0.52) of ALT variability. The statistical model shows that a difference of 10 °C.d in is equivalent to a change of 0.67 m in ALT, and an increase of 0.1 in the normalized difference vegetation index (NDVI) is equivalent to a decrease of 0.23 m in ALT. The fine-scale (<1 km) variation in ALT could account for 77.6% of the regional-scale (approximately 550 km) variation. These results provide a timely ALT benchmark along the QTEC, which can inform the construction and maintenance of engineering facilities along the QTEC.
1. Introduction
The Qinghai–Tibet Plateau (QTP), also known as the Third Pole, is the largest and highest plateau in the world with mean elevation of >4000 m above sea level (a.s.l). Approximately 1.17 (0.95–1.35) × 106 km2 of the QTP is underlain by permafrost [1]. The “warm” permafrost of the QTP, which has mean annual ground temperature typically higher than −2 °C, is extremely sensitive to climate change [2]. With the recent dramatic warming of the QTP climate [3], degradation of regional permafrost has been widely reported, including shrinkage of the total area underlain by permafrost, thickening of the active layer, development of thermokarst features, and surface subsidence [4,5,6,7]. Additionally, regional warming could drive the release of large quantities of soil organic carbon from the thawing permafrost, which might potentially act as positive feedback to climate change [8].
The active layer overlying the permafrost, which thaws in summer and freezes in winter, is one of the main characteristics of a permafrost region [9]. Because most exchanges of energy and mass between permafrost-affected soil and the atmosphere occur within the active layer, this layer has important effects on regional hydrological processes [10], vegetation growth [11], carbon cycling [8], and engineering construction [12]. The active layer thickness (ALT), which is the maximum annual depth of thawing in a permafrost region, is dominated by the characteristics of the regional climate such as the near-surface air temperature, solar radiation, and precipitation and is modulated by (sub-)surface conditions such as snow cover, vegetation cover, and soil properties [13,14]. Consequently, ALT exhibits a high degree of spatiotemporal heterogeneity, particularly across the Qinghai–Tibet Engineering Corridor (QTEC), owing to the complex regional terrain, fragile landscape, and increasing level of human activities.
ALT along the QTEC has been investigated systematically using traditional methods that include mechanical probing, soil pitting, and borehole drilling [15,16]. Such methods are capable of accurate determination of ALT, but they are time-consuming and labor-intensive processes. Moreover, difficulties associated with the logistics of physical access and the extreme environment cause further problems when conducting investigations of ALT. Consequently, ALT monitoring on the QTP is restricted to a limited number of sites that tend to be located near highways and/or railways. Remote sensing techniques, by contrast, can facilitate ALT estimation in remote locations and at broad spatial extents. Interferometric synthetic aperture radar (InSAR) is one such technique that has been used to estimate ALT over many permafrost environments, but it is still in a developmental stage and its uncertainties are poorly constrained due to a lack of in situ subsidence measurements [17,18]. Numerical simulation methods can capture long-term changes in ALT, but they require substantial volumes of atmospheric and (sub)-surface input data that are unavailable for the QTP [19].
Geophysical imaging methods represent suitable alternatives for effective investigation of ALT in mountains using a high number of samples [20]. Ground-penetrating radar (GPR) is a noninvasive geophysical method suitable for studies on permafrost because of the large contrast in electromagnetic properties between liquid water and frozen soil [21,22]. Consequently, GPR has been applied successfully to high-accuracy investigations of ALT in permafrost areas with talik development, thermokarst development, and engineering activities [20,23,24,25,26,27,28,29,30].
In this study, we used GPR to systematically investigate ALT along the QTEC over a sample section with total length of 58.5 km. We analyzed the spatial variation of ALT along the QTEC at large and fine scales, and investigated the influence on ALT of key climatological and geophysical factors. We established and validated a simple statistical model suitable for ALT estimation over the QTEC.
2. Study Area
The study area, located in the hinterland of the QTP, extends from Xidatan to Ando (32.53°–35.62°N, 91.6°–94.06°E) and covers an elevation range of 4500–5200 m a.s.l. The climate of the study area is semiarid and controlled mainly by the westerlies and the Indian monsoon [31]. The climatological mean annual air temperature (1998–2010) ranges from approximately −7.1 to −1.8 °C [32]. Annual precipitation, which is approximately 200–600 mm [33], is concentrated during May–September and shows gradual increase spatially from the northwest to the southeast. Characteristic land cover types include alpine swamp meadows, alpine meadows, alpine grasslands, and alpine deserts with prevalent areas of bare ground [34].
Permafrost underlies most of the study area except for riverine and tectonic geothermal taliks, and the mean permafrost zonation index (PZI) is approximately 0.75 ± 0.21 (Figure 1). Note that a high PZI value indicates conditions more favorable for the existence of permafrost. Ground ice is relatively rich in the gentle slopes of low mountains and hills, high plains, valleys, and basins [35]. With the rapid economic development of the region, many important examples of infrastructure connecting eastern and western areas have been constructed in permafrost regions along the QTEC, including the Qinghai–Tibet Highway built in 1954 [35], an oil pipeline constructed in 1977, the Qinghai–Tibet Railway built in 2007, and high-voltage transmission towers erected in 2011.
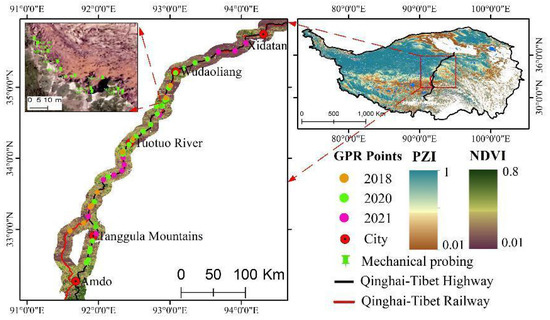
Figure 1.
Study area and locations of measurement sites surveyed during 2018–2021 overlaid on the permafrost zonation index (PZI) map. The permafrost distribution was taken from [1]. A high PZI value means conditions more favorable for the existence of permafrost. NDVI: normalized vegetation difference index.
Long-term monitoring has revealed substantial permafrost degradation along the QTEC, which could damage such infrastructure. During 1981–2010, ALT along the Qinghai–Tibet Highway increased by approximately 0.39 m, and the average temperature increased by approximately 2.3 °C [32]. Thermokarst lakes, which are widely distributed in the region, are increasing in terms of both number and area. For example, during 1991–2020, the number of thermokarst lakes increased by 3808 and the total lake area increased by 77.78 km2 [36].
3. Dataset and Methods
3.1. ALT from GPR Measurements
For this investigation we used the GPR system developed by MALA Geoscience (Sweden). Previous studies in the QTP reported that mean ALT in the region is approximately 2.4 m [37]; therefore, 100 MHz antennas were selected to detect the depth of thaw. We used a so-called rugged terrain antenna system and a pair of unshielded antennas (Figure 2). The rugged terrain antenna is a unique in-line, all-in-one, GPR antenna design that provides improved performance for deeper penetration. Its design allows it to be deployed easily and efficiently even on the most difficult and uneven terrain, thereby substantially reducing investigation time and labor costs. The transmitting and receiving antennas of the rugged terrain antenna are (RTA, see Table A1 in Appendix A for all abbreviations) connected together with a separation distance of 2.2 m. We set the samples of GPR as 1026, the sampling frequency to 1020 MHz, and the pulse width to 10 ns. GPR traces were received every 0.2 s, allowing a detection depth of approximately 30 m. The GPS position of each GPR section was recorded with typical accuracy of 1–3 m. The unshielded antennae were employed for common midpoint (CMP) measurement to obtain the electromagnetic wave velocity within the active layer, which allows for the conversion of GPR traces from time delay to distance (see details in Section 3.1.2). CMP surveys were conducted in parallel with the GPR profiling. During the CMP surveys, we progressively moved the transmitting and receiving antennas at a distance of 0.05 m to obtain the wave velocity; we moved the antennas approximately 50–60 times. GPR data were collected during three field campaigns in mid-October 2018 (9 sections), late August 2020 (27 sections), and early September 2021 (21 sections) for a total of 57 survey sections. The GPR investigation was conducted every 10 km along the central transect of the study area; the location of each GPR section is illustrated in Figure 1.
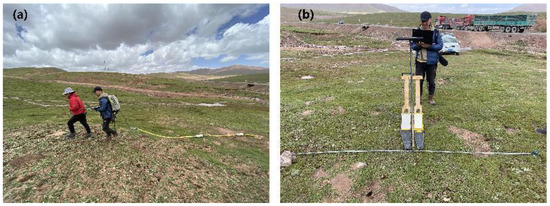
Figure 2.
Ground-penetrating radar investigation modes with two different antennas: (a) 100-MHz shielded rugged terrain antenna, and (b) 100-MHz unshielded antenna.
3.1.1. GPR Data Processing
We estimated the permafrost table and subsurface wave propagation velocity based on observed differences in the bulk electromagnetic properties of the subsurface soil units [21,38] and verified our GPR estimates using mechanical probing measurements and reference data. Pre-processes were required to remove noise raised from air in the raw GPR section and to enhance the desired electromagnetic wave signal due to backscatter from subsurface dielectric interfaces. Neal [22] provided an in-depth discussion on GPR data processing, and we conducted similar procedures, as illustrated in Figure 3. All steps in the flowchart were implemented using Reflexw 7.5 software (http://www.sandmeier-geo.de/reflexw.html (accessed on 12 October 2020)).
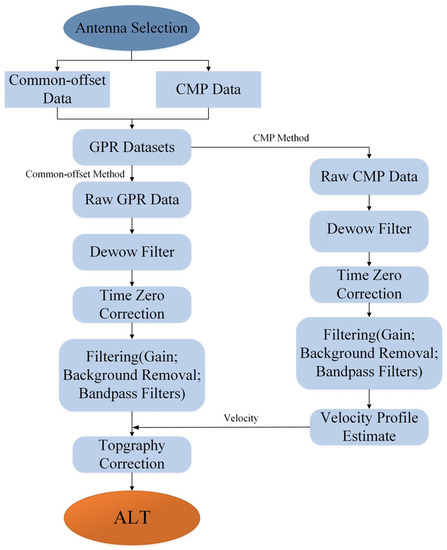
Figure 3.
Flow chart of ground-penetrating radar (GPR) data processing performed to derive the active layer thickness (ALT). CMP: common midpoint.
3.1.2. Velocity and ALT
To estimate the ALT, the average velocity of the radar wave in the active layer is required to convert two-way travel time (TWTT, ns) to depth. The TWTT increases as the distance between the transmitting and receiving antennas increases. Consequently, the reflection horizon of the base of the active layer has a hyperbolic pattern. Figure 4 presents an example of the remarkable difference in wave velocity between the air wave, surface wave, and active layer. The average wave velocity (v, m.ns−1) throughout the active layer was estimated as follows:
where v (m ns−1) is the average wave velocity, x1 (m) and t1 (ns) are the position of the transmitting antenna and the reflection horizon TWTT at that position, respectively, and x2 (m) and t2 (ns) are the position of the receiving antenna and the reflection horizon TWTT at that position, respectively. We calculated the active layer thawing depth as follows:
where t is the TWTT and x is the separation of the transmitter and the receiver (constant at 2.2 m for the RTA). We estimated the ALT for each GPR section based on Equations (1) and (2). Figure 5 presents an example ALT estimation, where the base of the active layer exhibits a pronounced reflection horizon.
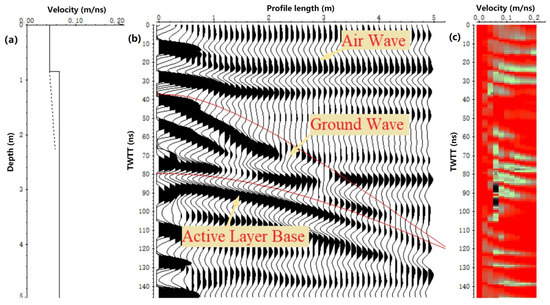
Figure 4.
Picking average wave velocity of the active layer in Reflexw software: (a) the wave velocity broken-line graph of different soil layers, (b) electromagnetic signal graph of the common midpoint (CMP) data, and (c) intensity graph of the electromagnetic signal.
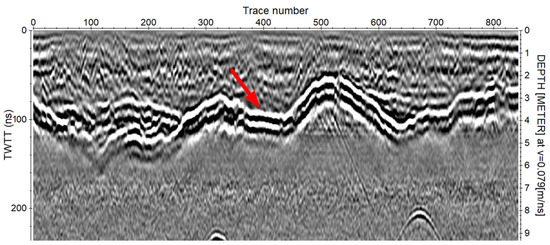
Figure 5.
Processed radargram of ground-penetrating radar section with reflection of the active layer marked by an arrow. TWTT: two-way travel time.
3.2. ALT from In Situ Measurements and Reference Datasets
Mechanical probing is a method whereby a graduated metal pole is inserted into the active layer until the point of refusal is encountered as well as the freeze–thaw interface. When conducted shortly before the autumn refreeze of the active layer, this thaw depth is approximately equal to the ALT. This method is suitable for use in areas with fine soil and shallow ALT (typically, ALT < 2 m), such as the North Slope of Alaska (https://ipa.arcticportal.org/products/gtn-p/calm). The QTP, in contrast, has large soil particles, complex lithology, and a deep active layer, making mechanical probing impracticable in much of the study area. To test the accuracy of the GPR data, we used a 1.36 m mechanical probe and a tape measure to measure the ALT at the edge of thaw slumps, where the thaw depth was sufficiently shallow. The spatial distribution of the mechanical probing measurement sites is shown in the upper-left corner of Figure 1.
To comprehensively evaluate the GPR-derived ALT estimations, we used two existing high-resolution (i.e., 1 km) ALT datasets as reference. The first dataset was produced by Niu et al. [39] based on numerical simulation, i.e., the GIPL2.0 permafrost model. The second dataset from Ran et al. [40] is based on a statistical learning model driven by a large number of in situ observational data. Previous studies reported that the reference datasets have a root mean square error (RMSE) of 86.93 ± 19.61 cm. We selected three evaluation indicators, i.e., bias, mean absolute error (MAE), and RMSE, to evaluate the ALT estimated by GPR [41]:
where n is the sample size, ALTg is the value estimated using GPR, and ALTv is the value of the validation data.
3.3. Potential Controlling Factors of ALT
ALT is affected by many topoclimatic factors via changing near-surface atmospheric conditions and land–atmosphere water–heat exchange. For statistical testing and for prediction of ALT over the QTEC, we selected three topoclimatic factors: land surface temperature (LST), normalized difference vegetation index (NDVI), and soil bulk density (SBD). Among them, LST plays a crucial role in directly affecting the soil thermal regime and hence ALT [42]. We selected SBD to approximately represent the soil properties, such as soil moisture and soil organic content, which determine the heat transfer in the active layer [43]. Vegetation has the function of isolating soil and environmental conditions; hence, it affects the surface energy balance [44].
MODIS land surface temperature with a spatial resolution of 1 km was used for LST, as MODIS LST has been successfully applied in permafrost studies over the QTP [45,46]. The MODIS LST dataset provides reliable representation of the land surface thermal regime; however, the dataset has numerous missing values of daily LST owing mainly to interference from clouds. In this study, we used the daily LST dataset of [47]. It is based on a decomposition model of the LST time series, and successfully merges reanalysis LST and thermal infrared remote sensing data to resolve the problem of missing values. Verification of the measured data at the station shows that the RMSE of the dataset is 1.03–2.28 K under the condition of clear sky and 2.24–3.87 K under non-clear-sky conditions [47]. The LST dataset is available from the National Tibetan Plateau Data Center (http://dx.doi.org/10.11888/Meteoro.tpdc.270953 (accessed on 31 August 2022)).
Based on the approximate Stefan solution, ALT can be estimated as a linear function of the ground thawing index (TIg) [48]:
where TIg (°C.d) is the sum of the accumulated LST (°C), and Nt (d) is the number of days when LST was >0 °C. The NDVI was extracted using Sentinel-2A data downloaded from the European Space Agency (https://scihub.copernicus.eu/ (accessed on 12 September 2022)), with a spatial resolution of 50 m. The original 10 m resolution NDVI product was bi-linearly interpolated to 50 m resolution to avoid heavy requirement in storage volume. SBD data were downloaded from the SoilGrids system (https://soilgrids.org/ (accessed on 30 May 2022)), which provides seven standard depths (i.e., 0, 5, 15, 30, 60, 100, and 200 cm) with 250 m spatial resolution [49]. We needed to extract corresponding control factor information from these data. However, owing to inconsistency in resolution, we finally adopted the corresponding average value of each GPR, which is analyzed in Section 3.3. The NDVI was estimated from the near-infrared spectroscopy (B8 with 833 nm) and red spectroscopy (B4 with 665 nm) of Sentinel-2 during 2016–2021:
where NIR and R represent the near-infrared and red spectral bands, respectively. The annual maximum NDVI was computed for each year during 2016–2021 to approximately represent the vegetation coverage, and then a median value of the annual maximum for each pixel was calculated over the entire period to avoid sensitivity to extreme values. The median of the annual maximum NDVI was used as a predictor variable within the ALT statistical model.
3.4. Statistical Model of ALT
Permafrost is widely distributed over the QPT, but the distribution, extent, and physical characteristics of this permafrost are modulated by a variety of geophysical and topoclimatic variables. Cao et al. [20] established a statistical linear model with three topoclimatic factors that approximately represent the near-surface air temperature, solar radiation, and soil properties of the northeastern QTP. This model reasonably yet simply explains the spatial variation of ALT at the regional scale. For the QTEC, it is fundamentally difficult to accurately estimate subsurface information. Due to the general flat and low slope condition of the QTEC, slope and aspect likely play a minimal role in modulating permafrost distribution. For these reasons, we modeled ALT along the QTEC with a statistical model dependent upon three topoclimatic variables:
where α1, α2, and α3 represent the slope of the statistical model for each controlling factor, and β is the model intercept. These empirical coefficients were fitted based on the measurements. Before using the statistical model expressed as Equation (8), we evaluated the degree of collinearity between the variables and then selected the variance inflation factor (VIF) [50]:
where R2 is the coefficient of determination:
where ypre is the predicted value, y is the measured value, and is the mean value of y.
4. Results
4.1. Evaluation of ALT from GPR
Overall, 57 GPR sections (total length: 58.5 km) were surveyed during 2018–2021. The length of the individual GPR sections was in the range of 0.38–2.03 km, with mean length of 1.03 km. The GPR sections were distributed reasonably uniformly along the QTEC (Figure 1), with an average distance of separation of approximately 10 km. The elevation of the GPR sections was in the range of 4500–5200 m, and the latitudinal extent was 32.53°–35.62°N, thereby representing the spatial variation of ALT over an elevation difference of approximately 680 m and a latitudinal difference of 3.09°.
The probability density distribution of the ALT derived from GPR is shown in Figure 6a. Our measurements revealed strong spatial variation of ALT over the QTEC. The mean ALT of the 57 GPR sections had a range of 1.25–6.70 m, with mean and median values of ALT of 2.49 ± 0.57 and 2.46 m, respectively, during 2018–2021. The value of ALT was mainly concentrated between 1.25 and 4.00 m, accounting for 98% of the total 57 GPR sections. Among them, 66% (20%) of the measurements were distributed in the range of 2–3 m (1.25–2.00 m). These sections were located in mountainous areas with relatively poor drainage and high soil moisture. The ALT of approximately 12% of the sections was in the range of 3–4 m, and values of ALT of >4 m accounted for 2% of the total, which were distributed at the edge of the permafrost area with a mean PZI of 0.57 ± 0.14.
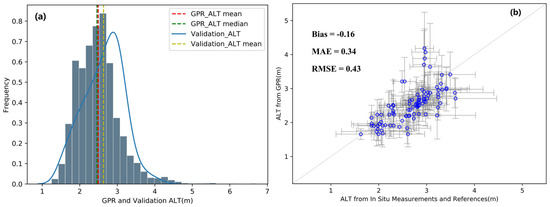
Figure 6.
(a) Histogram depicting the proportion of active layer thickness (ALT) derived from ground-penetrating radar (GPR) and evaluation datasets, and (b) evaluation of ALT measured by GPR. The GPR profiles were aggregated by averaging (blue points), and the gray bar represents the range of Q1 (25%) to Q3 (75%). The validation datasets comprised in situ measurements and reference datasets from [39,40] and are shown as the aggregated mean and range of Q1 to Q3. MAE: mean absolute error, RMSE: root mean square error.
The GPR-derived ALT was evaluated using 11 mechanical probing measurements and 182 reference ALT data. The density distribution curves for the measured and evaluation ALT data are shown in Figure 6a for comparison. Despite slight deviation, the overall pattern of distribution is consistent with close median values of ALT (i.e., 2.46 m vs. 2.67 m). The GPR-derived ALT is presented in Figure 6b for evaluation purposes. The results indicate that the ALT derived from GPR measurements is comparable with that based on in situ observations and evaluation datasets, with overall bias and RMSE of −0.16 and 0.43 m, respectively. The verification results show that our GPR-derived ALT data have high accuracy, which means that they can be used to represent the spatial distribution of ALT along the QTEC.
4.2. Spatial Variability of ALT
The mean ALT of each GPR section together with the standard deviation are shown on a shaded relief digital elevation model in Figure 7. The ALT shows strong spatial variation along the QTEC. Shallower ALTs are mainly distributed in the Kunlun Mountains, Wudaoliang, Fenghuo Mountains, and Tanggula Mountains with higher elevations of 4730–5130 m. For example, the mean elevation of sites with ALT of <2 m is approximately 4910 ± 150 m. Greater ALTs are derived near the Budongquan area, Tuotuo River, and Tongtian River. These areas are characterized by flat terrain, lower elevation, and developed water systems. Consequently, there is a clear relationship between ALT and elevation, i.e., shallower ALT is generally found in areas of higher elevation.
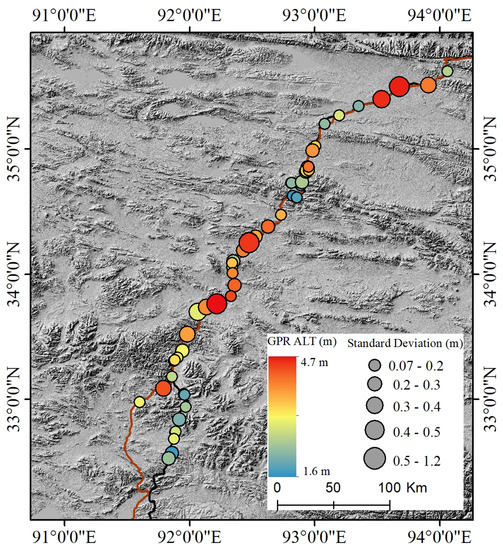
Figure 7.
Spatial distribution of active layer thickness (ALT) of each ground-penetrating radar (GPR) section along the Qinghai–Tibet Engineering Corridor. The aggregated mean ALT of each GPR section is shown with the standard deviation (point size).
At each GPR section, the range of ALT standard deviation is approximately 0.07–1.2 m with a mean of 0.23 ± 0.17 m, indicating strong spatial heterogeneity of ALT at the fine scale (i.e., <1 km). The GPR sections with large standard deviation of ALT are in areas where the geomorphic units and vegetation types change markedly, as well as at the limit of the permafrost. The greatest standard deviation of ALT was found in the Tuotuo River area (34.25°N, 92.47°E), where the GPR investigation was conducted around the talik. The variation of ALT of each GPR section grouped by TIg is shown in Figure 8. It is clear that the fine-scale variation is remarkable even under similar land surface thermal conditions. For example, the ALT variation under a TIg range of 1000–1500 °C.d accounts for approximately 76.6% of the overall change.
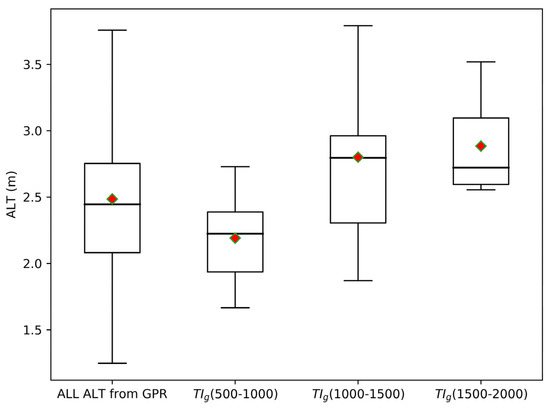
Figure 8.
Active layer thickness (ALT) for all the measurements and groups with different ranges of ground thawing index (TIg).
4.3. Influencing Factors of ALT Variation
4.3.1. Effect of Individual Factors on ALT
The correlations among the controlling factors of , SBD, and NDVI, together with their VIFs, are listed in Table 1. While most of the factors are correlated, and NDVI were found to be not correlated (p > 0.05). This is thought to be the case because the vegetation of the QTP is controlled mainly by precipitation rather than by temperature [51,52]. The factor is positively correlated with SBD (r = 0.40, p < 0.01), and NDVI is negatively correlated with SBD (r = −0.45, p < 0.01). Although correlation exists between these two groups of variables, the correlation is weak. The VIF of each of the three variables is <1.5, indicating lack of obvious collinearity between these factors. For this reason, these three controlling factors can be considered to independently explain the variation of ALT, and thus are used to establish the linear statistical model.

Table 1.
Correlation between the various influencing factors of ALT.
The individual and combined relationships between ALT and the controlling factors of , SBD, and NDVI are shown in Figure 9. Our results indicate that these topoclimatic factors have remarkable influence on ALT with significant relationships (i.e., p < 0.01), and thus they can be used to explain the changes in ALT. It is unsurprising that has a strong positive relationship with ALT because ALT is dominated by the thermal state of the soil (R2 = 0.36). The statistical model shows that a difference of 10 °C.d in is equivalent to a change of 0.67 m in ALT. The SBD affects the ALT through change of the thermal properties of soil (i.e., thermal conductivity), and it can explain approximately 30% (R2 = 0.30, p < 0.01) of the variation in ALT. This is also reflected in Figure 9d, which shows that a greater value of SBD typically leads to a greater value of ALT for the same value of . Vegetation is expected to cool the ground by reducing incoming solar radiation and releasing heat through evaporation. Our results show that NDVI has negative correlation with ALT, which can explain 15% (R2 = 0.15, p < 0.01) of the variation in ALT. The model coefficients indicate that an increase of 0.1 in NDVI is equivalent to a decrease of 0.23 m in ALT, which is equivalent to a decrease of 3.4 °C.d in .
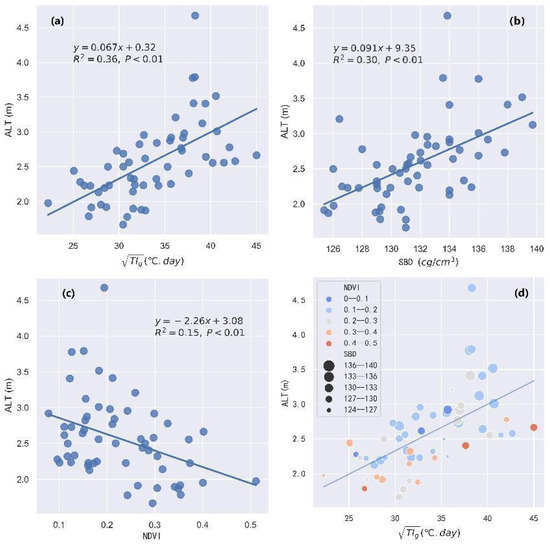
Figure 9.
Relationship between active layer thickness (ALT) and the controlling factors of (a) the ground thawing index (), (b) soil bulk density (SBD), (c) normalized difference vegetation index (NDVI), and (d) the combined topoclimatic influences.
4.3.2. Statistical Model for ALT Estimation
The combined influences of the three selected topoclimatic factors were investigated using the linear statistical model (Figure 10). The intercept and coefficient values of each predictor of the statistical model are listed in Table 2. Our results indicate that the model well represents the spatial variability of ALT with values of R2 = 0.52, RMSE = 0.39 m, and bias of near zero (BIAS = 0.003). The p-values for the coefficients of and SBD are <0.01, and the p-values of the coefficients of NDVI and the intercept are <0.05, indicating that the model is significant. The ALTs predicted by the model and the ALTs measured using GPR are generally distributed near the 1:1 line. The error is mainly attributable to insufficient consideration of factors that influence ALT, e.g., peat content and soil moisture in the active layer. The final statistical model outperformed the model constructed with a single predictor. Thus, the developed statistical model based on GPR measurements can be used to predict the spatial variation in ALT along the QTEC.
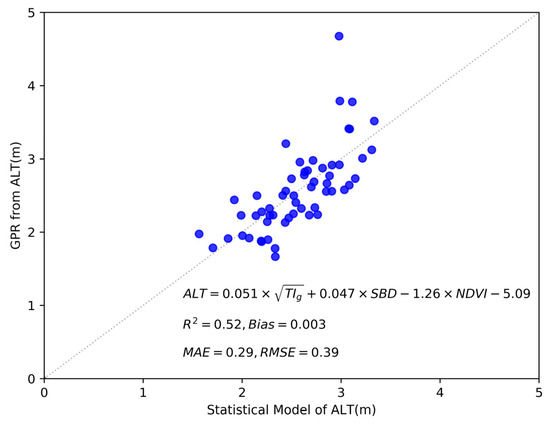
Figure 10.
Active layer thickness (ALT) as a function of ground thawing index (TIg), soil bulk density (SBD), and normalized difference vegetation index (NDVI).
Table 2.
Multifactor statistical model parameters for ALT estimation.
5. Discussion
GPR is a fast, low-cost, and nondestructive technique that has proven suitable for extensive investigation of permafrost at regional and fine scales [53]. Our results revealed strong spatial variation in ALT along the QTEC; however, it is expected that such variation was underestimated because a single CMP-derived velocity was applied to the entire GPR section. Earlier studies reported that the velocity could vary considerably owing to the changes in soil moisture and soil texture [54,55,56,57].
Additional uncertainties arose in relation to the investigation period. The annual maximum melt depth (i.e., ALT) occurs around October, or at the time of onset of freezing. However, 27 of the 57 GPR sections surveyed in this study were performed in late August 2020, when the value was approximately 79–82% of its maximum value (Figure 11). For this reason, the active layer thawing depth derived in 2020 did not reflect the maximum value, which led to underestimation of the ALT in 2020 and an overall negative bias (−0.16 m, Figure 6). Other uncertainties might also have been introduced from the reference datasets for our validation, especially at the fine scale. For example, Ran et al. [40] estimated ALT with an RMSE of 86.93 ± 19.61 cm and resolution of 1 km. This will affect our judgment on the accuracy of ALT estimated by GPR.
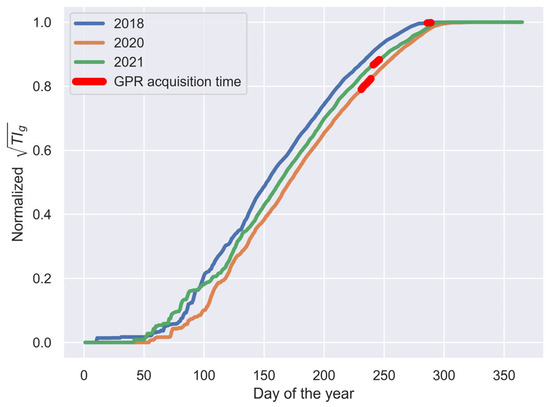
Figure 11.
Normalized ground thawing index (TIg) of ground-penetrating radar (GPR) sections collected in different years.
The reasonable agreements between the GPR-derived ALT and both the in situ measurements and reference datasets indicate the suitability of GPR data for use in investigation of ALT. However, the in situ measurements are limited to 11 samples derived by MP due to measurement difficulties. In addition, the ALTs from MP measurements are restricted to a shallow range of 1.48–2 m. For these reasons, the ALTs from GPR were not fully evaluated and further systematic evaluations are recommended in the future. Additionally, GPR is extremely sensitive to pipes, fiberoptic cables, and metal objects [58,59,60]. In this study, strong signals associated with metal objects related to engineering activities were sometimes superimposed on the permafrost information, making ALT identification impossible.
The processing of GPR data is highly empirical even though commercial software is available. For example, removal of the air wave requires accurate determination of the interface between the air and the soil layer. The processing of such data using different methods will introduce uncertainty regarding the interface, thereby affecting the accuracy of the extracted ALT. Similarly, determination of the active layer base requires rich experience to minimize subjectivity.
6. Conclusions
In this study, we comprehensively investigated the ALT along the QTEC during 2018–2021 using the GPR method. The GPR measurements were evaluated using in situ measurements and reference datasets. We then analyzed the spatial variability in ALT and its controlling topoclimatic factors, i.e., LST, SBD, and the NDVI, at regional and fine scales. The derived conclusions are summarized in the following.
- The value of ALT shows considerable spatial variability along the QTEC, with a range of approximately 1.25–6.70 m and mean of 2.49 ± 0.57 m. Approximately 66% of the estimated ALT values were in the range of 2–3 m, 20% were in the range of 1.25–2.00 m, 12% were in the range of 3–4 m, and the remaining 2% of ALT values were >4 m.
- At the fine scale (i.e., <1 km), ALT shows obvious spatial heterogeneity with standard deviation in the range of 0.07–1.20 m. The variation in ALT was significant in areas where the geomorphic unit and vegetation changed remarkably. The variation in ALT at the fine scale could account for approximately 76.6% of the overall spatial variability at the regional scale, indicating the importance of understanding ALT at the fine scale.
- Observed ALT is mainly controlled by the soil thermal regime, soil properties, and vegetation. The topoclimatic factors of , SBD, and NDVI can be used as suitable predictors for estimating the variation in ALT along the QTEC.
- GPR is a fast yet low-cost method that is suitable for investigation of permafrost in complex terrain. Our results elucidated the spatial distribution of ALT along the QTEC, which could represent a useful benchmark for understanding the change in ALT in a warming climate.
Author Contributions
Conceptualization, T.Z. and S.J.; methodology, T.Z., S.J., J.H. and C.L.; validation, J.H. and C.L.; formal analysis, S.J. and R.M.; investigation, W.S., S.W., K.W. and C.F.; data curation, S.J. and W.S.; writing—original draft preparation, S.J. and T.Z.; writing—review and editing, R.M. and S.J.; visualization, S.J. and C.F.; supervision, T.Z.; project administration, J.H.; funding acquisition, J.H. All authors have read and agreed to the published version of the manuscript.
Funding
This research was funded by the Second Tibetan Plateau Scientific Expedition and Research Program (STEP) (Grant No. 2019QZKK0903) and Tibet Science and Technology Program (XZ202201ZY0011G).
Data Availability Statement
Not applicable.
Acknowledgments
The authors thank Bin Cao for his constructive suggestions and Hongyi Chu for his help in the field investigation.
Conflicts of Interest
The authors declare no conflict of interest.
Appendix A
Table A1.
The table of abbreviations. Abbreviations and units used in this article.
Table A1.
The table of abbreviations. Abbreviations and units used in this article.
| Abbreviation | Full Name | Unit |
|---|---|---|
| ALT | Active layer thickness | m |
| GPR | Ground-penetrating radar | - |
| QTEC | Qinghai–Tibet Engineering Corridor | - |
| QTP | Qinghai–Tibet Plateau | - |
| TIg | Ground thawing index | °C.d |
| PZI | Permafrost zonation index | - |
| RTA | Rugged terrain antenna | - |
| CMP | Common midpoint | - |
| TWTT | Two-way travel time | ns |
| RMSE | Root mean square error | m |
| MAE | Mean absolute error | m |
| LST | Land surface temperature | °C |
| SBD | Soil bulk density | cg/cm3 |
| NDVI | Normalized difference vegetation index | - |
| VIF | Variance inflation factor | - |
| Q1 | Lower quartile of boxplot | - |
| Q3 | Upper quartile of boxplot | - |
References
- Cao, B.; Zhang, T.; Wu, Q.; Sheng, Y.; Zhao, L.; Zou, D. Permafrost zonation index map and statistics over the Qinghai-Tibet Plateau based on field evidence. Permafr. Periglac. Process. 2019, 30, 178–194. [Google Scholar] [CrossRef]
- Cao, B.; Zhang, T.; Peng, X.; Mu, C.; Wang, Q.; Zheng, L.; Wang, K.; Zhong, X. Thermal Characteristics and Recent Changes of Permafrost in the Upper Reaches of the Heihe River Basin, Western China. J. Geophys. Res. Atmos. 2018, 123, 7935–7949. [Google Scholar] [CrossRef]
- Yao, T.; Xue, Y.; Chen, D.; Chen, F.; Thompson, L.; Cui, P.; Koike, T.; Lau, W.K.-M.; Lettenmaier, D.; Mosbrugger, V.; et al. Recent Third Pole’s Rapid Warming Accompanies Cryospheric Melt and Water Cycle Intensification and Interactions between Monsoon and Environment: Multidisciplinary Approach with Observations, Modeling, and Analysis. Bull. Am. Meteorol. Soc. 2019, 100, 423–444. [Google Scholar] [CrossRef]
- Lin, Z.; Luo, J.; Niu, F. Development of a thermokarst lake and its thermal effects on permafrost over nearly 10 yr in the Beiluhe Basin, Qinghai-Tibet Plateau. Geosphere 2016, 12, 632–643. [Google Scholar] [CrossRef]
- Qin, Y.; Wu, T.; Zhao, L.; Wu, X.; Li, R.; Xie, C.; Pang, Q.; Hu, G.; Qiao, Y.; Zhao, G.; et al. Numerical Modeling of the Active Layer Thickness and Permafrost Thermal State Across Qinghai-Tibetan Plateau. J. Geophys. Res. Atmos. 2017, 122, 11,604–11,620. [Google Scholar] [CrossRef]
- Chen, J.; Liu, L.; Zhang, T.; Cao, B.; Lin, H. Using Persistent Scatterer Interferometry to Map and Quantify Permafrost Thaw Subsidence: A Case Study of Eboling Mountain on the Qinghai-Tibet Plateau. J. Geophys. Res. Earth Surf. 2018, 123, 2663–2676. [Google Scholar] [CrossRef]
- Cao, B.; Arduini, G.; Zsoter, E. Brief communication: Improving ERA5-Land soil temperature in permafrost regions using an optimized multi-layer snow scheme. Cryosphere 2022, 16, 2701–2708. [Google Scholar] [CrossRef]
- Koven, C.D.; Lawrence, D.M.; Riley, W.J. Permafrost carbon−climate feedback is sensitive to deep soil carbon decomposability but not deep soil nitrogen dynamics. Proc. Natl. Acad. Sci. USA 2015, 112, 3752–3757. [Google Scholar] [CrossRef]
- Harris, S.A.; French, H.M.; Heginbottom, J.A.; Johnston, G.H.; Ladanyi, B.; Sego, D.C.; van Everdingen, R.O. Glossary of Permafrost and Related Ground-Ice Terms; Technical Memorandum No. 142; National Research Council of Canada, Associate Committee on Geotechnical Research, Permafrost Subcommittee: Ottawa, ON, Canada, 1988; p. 156. [Google Scholar] [CrossRef]
- Ge, S.; McKenzie, J.; Voss, C.; Wu, Q. Exchange of groundwater and surface-water mediated by permafrost response to seasonal and long term air temperature variation. Geophys. Res. Lett. 2011, 38, 1–6. [Google Scholar] [CrossRef]
- Hewitt, R.E.; DeVan, M.R.; Lagutina, I.V.; Genet, H.; McGuire, A.D.; Taylor, D.L.; Mack, M.C. Mycobiont contribution to tundra plant acquisition of permafrost-derived nitrogen. New Phytol. 2020, 226, 126–141. [Google Scholar] [CrossRef]
- Hjort, J.; Karjalainen, O.; Aalto, J.; Westermann, S.; Romanovsky, V.E.; Nelson, F.E.; Etzelmüller, B.; Luoto, M. Degrading permafrost puts Arctic infrastructure at risk by mid-century. Nat. Commun. 2018, 9, 5147. [Google Scholar] [CrossRef]
- Wang, K.; Zhang, T.; Zhong, X. Changes in the timing and duration of the near-surface soil freeze/thaw status from 1956 to 2006 across China. Cryosphere 2015, 9, 1321–1331. [Google Scholar] [CrossRef]
- Peng, X.; Zhang, T.; Frauenfeld, O.W.; Wang, K.; Luo, D.; Cao, B.; Su, H.; Jin, H.; Wu, Q. Spatiotemporal Changes in Active Layer Thickness under Contemporary and Projected Climate in the Northern Hemisphere. J. Clim. 2017, 31, 251–266. [Google Scholar] [CrossRef]
- Zhao, L.; Wu, Q.; Marchenko, S.; Sharkhuu, N. Thermal state of permafrost and active layer in Central Asia during the international polar year. Permafr. Periglac. Process. 2010, 21, 198–207. [Google Scholar] [CrossRef]
- Wu, Q.; Zhang, T.; Liu, Y. Permafrost temperatures and thickness on the Qinghai-Tibet Plateau. Glob. Planet. Chang. 2010, 72, 32–38. [Google Scholar] [CrossRef]
- Jia, Y.; Kim, J.-W.; Shum, C.K.; Lu, Z.; Ding, X.; Zhang, L.; Erkan, K.; Kuo, C.-Y.; Shang, K.; Tseng, K.-H.; et al. Characterization of Active Layer Thickening Rate over the Northern Qinghai-Tibetan Plateau Permafrost Region Using ALOS Interferometric Synthetic Aperture Radar Data, 2007–2009. Remote Sens. 2017, 9, 84. [Google Scholar] [CrossRef]
- Liu, L.; Schaefer, K.; Zhang, T.; Wahr, J. Estimating 1992–2000 average active layer thickness on the Alaskan North Slope from remotely sensed surface subsidence. J. Geophys. Res. Earth Surf. 2012, 117, F01005. [Google Scholar] [CrossRef]
- Zhang, Z.Q.; Wu, Q.B. Predicting changes of active layer thickness on the Qinghai-Tibet Plateau as climate warming. J. Glaciol. Geocryol. 2012, 34, 505. [Google Scholar]
- Cao, B.; Gruber, S.; Zhang, T.; Li, L.; Peng, X.; Wang, K.; Zheng, L.; Shao, W.; Guo, H. Spatial variability of active layer thickness detected by ground-penetrating radar in the Qilian Mountains, Western China. J. Geophys. Res. Earth Surf. 2017, 122, 574–591. [Google Scholar] [CrossRef]
- Moorman, B.J.; Robinson, S.D.; Burgess, M.M. Imaging periglacial conditions with ground-penetrating radar. Permafr. Periglac. Process. 2003, 14, 319–329. [Google Scholar] [CrossRef]
- Neal, A. Ground-penetrating radar and its use in sedimentology: Principles, problems and progress. Earth-Sci. Rev. 2004, 66, 261–330. [Google Scholar] [CrossRef]
- Wollschläger, U.; Gerhards, H.; Yu, Q.; Roth, K. Multi-channel ground-penetrating radar to explore spatial variations in thaw depth and moisture content in the active layer of a permafrost site. Cryosphere 2010, 4, 269–283. [Google Scholar] [CrossRef]
- Kaverin, D.; Khilko, A.; Pastukhov, A. Application of high-frequency ground penetrating radarto investigations of permafrost-affected soils of peat plateaus (European Northeast of Russia). Earth’s Cryosphere 2018, 22, 86–95. [Google Scholar] [CrossRef]
- Chen, A.; Parsekian, A.D.; Schaefer, K.; Jafarov, E.; Panda, S.; Liu, L.; Zhang, T.; Zebker, H. Ground-penetrating radar-derived measurements of active-layer thickness on the landscape scale with sparse calibration at Toolik and Happy Valley, Alaska. Geophysics 2016, 81, H9–H19. [Google Scholar] [CrossRef]
- Jørgensen, A.S.; Andreasen, F. Mapping of permafrost surface using ground-penetrating radar at Kangerlussuaq Airport, western Greenland. Cold Reg. Sci. Technol. 2007, 48, 64–72. [Google Scholar] [CrossRef]
- Shen, Y.; Zuo, R.; Liu, J.; Tian, Y.; Wang, Q. Characterization and evaluation of permafrost thawing using GPR attributes in the Qinghai-Tibet Plateau. Cold Reg. Sci. Technol. 2018, 151, 302–313. [Google Scholar] [CrossRef]
- You, Y.; Yu, Q.; Pan, X.; Wang, X.; Guo, L. Geophysical Imaging of Permafrost and Talik Configuration Beneath a Thermokarst Lake. Permafr. Periglac. Process. 2017, 28, 470–476. [Google Scholar] [CrossRef]
- Luo, J.; Niu, F.-J.; Lin, Z.-J.; Liu, M.-H.; Yin, G.-A. Variations in the northern permafrost boundary over the last four decades in the Xidatan region, Qinghai–Tibet Plateau. J. Mt. Sci. 2018, 15, 765–778. [Google Scholar] [CrossRef]
- Lu, X.; Song, A.; Qian, R.; Liu, L. Characterization of Subsurface Structure in Different Landforms based on GPR Profiles along the Qinghai-Tibet Highway on Permafrost region. In Proceedings of the 2018 17th International Conference on Ground Penetrating Radar (GPR), Rapperswil, Switzerland, 18–21 June 2018; pp. 1–4. [Google Scholar] [CrossRef]
- Yao, T.; Shilong, P.; Shen, M.; Jing, G.; Wei, Y.; Zhang, G.; Lei, Y.; Yang, G.; Zhu, L.; Xu, B. Chained Impacts on Modern En-vironment of Interaction between Westerlies and Indian Monsoon on Tibetan Plateau. Bull. Chin. Acad. Sci. 2017, 32, 976–984. [Google Scholar] [CrossRef]
- Li, R.; Zhao, L.; Ding, Y.; Wu, T.; Xiao, Y.; Du, E.; Liu, G.; Qiao, Y. Temporal and spatial variations of the active layer along the Qinghai-Tibet Highway in a permafrost region. Chin. Sci. Bull. 2012, 57, 4609–4616. [Google Scholar] [CrossRef]
- Zhao, L.; Zou, D.; Hu, G.; Du, E.; Pang, Q.; Xiao, Y.; Li, R.; Sheng, Y.; Wu, X.; Sun, Z.; et al. Changing climate and the permafrost environment on the Qinghai–Tibet (Xizang) plateau. Permafr. Periglac. Process. 2020, 31, 396–405. [Google Scholar] [CrossRef]
- Wang, Z.-W.; Wang, Q.; Zhao, L.; Wu, X.-D.; Yue, G.-Y.; Zou, D.-F.; Nan, Z.-T.; Liu, G.-Y.; Pang, Q.-Q.; Fang, H.-B.; et al. Mapping the vegetation distribution of the permafrost zone on the Qinghai-Tibet Plateau. J. Mt. Sci. 2016, 13, 1035–1046. [Google Scholar] [CrossRef]
- Jin, H.; Wang, S.; Yu, Q.; Wu, Q.; Wei, Z. Regionalization and assessment of environmental geological conditions of frozen soils along the Qinghai-Tibet Engineering Corridor. Hydrogeol. Eng. Geol. 2006, 33, 66–70. [Google Scholar]
- Chen, X.; Mu, C.; Jia, L.; Li, Z.; Fan, C.; Mu, M.; Peng, X.; Wu, X. High-resolution dataset of thermokarst lakes on the Qing-hai-Tibetan Plateau. Earth Syst. Sci. Data Discuss. 2021, 2021, 1–23. [Google Scholar] [CrossRef]
- Wu, Q.; Zhang, T. Changes in active layer thickness over the Qinghai-Tibetan Plateau from 1995 to 2007. J. Geophys. Res. Earth Surf. 2010, 115, D09107. [Google Scholar] [CrossRef]
- Hinkel, K.M.; Doolittle, J.A.; Bockheim, J.G.; Nelson, F.E.; Paetzold, R.; Kimble, J.M.; Travis, R. Detection of subsurface permafrost features with ground-penetrating radar, Barrow, Alaska. Permafr. Periglac. Process. 2001, 12, 179–190. [Google Scholar] [CrossRef]
- Niu, F.; Zheng, H.; Li, A. The study of frost heave mechanism of high-speed railway foundation by field-monitored data and indoor verification experiment. Acta Geotech. 2020, 15, 581–593. [Google Scholar] [CrossRef]
- Ran, Y.; Li, X.; Cheng, G.; Che, J.; Aalto, J.; Karjalainen, O.; Hjort, J.; Luoto, M.; Jin, H.; Obu, J.; et al. New High-Resolution Estimates of the Permafrost Thermal State and Hydrothermal Conditions over the Northern Hemisphere. Earth Syst. Sci. Data Discuss. 2021, 2021, 1–27. [Google Scholar] [CrossRef]
- Mugume, I.; Basalirwa, C.; Waiswa, D.; Reuder, J.; Mesquita, M.D.S.; Tao, S.; Ngailo, T.J. Comparison of Parametric and Nonparametric Methods for Analyzing the Bias of a Numerical Model. Model. Simul. Eng. 2016, 2016, 1–7. [Google Scholar] [CrossRef]
- Cheng, G. Influences of local factors on permafrost occurrence and their implications for Qinghai-Xizang Railway design. Sci. China Ser. D Earth Sci. 2004, 47, 704–709. [Google Scholar] [CrossRef]
- Fisher, J.P.; Estop-Aragonés, C.; Thierry, A.; Charman, D.J.; Wolfe, S.A.; Hartley, I.P.; Murton, J.B.; Williams, M.; Phoenix, G.K. The influence of vegetation and soil characteristics on active-layer thickness of permafrost soils in boreal forest. Glob. Chang. Biol. 2016, 22, 3127–3140. [Google Scholar] [CrossRef]
- Chen, J.; Zhao, Y.; Zhao, L.; Fang, H.; Zhang, G. Construction of an index set for predicting thickness of active layer of per-mafrost in Qinghai-tibet plateau and for mapping. Acta Pedol. Sin. 2015, 52, 499–506. [Google Scholar]
- Shi, Y.; Yang, C.; Che, T. Accuracy verification of the Tibetan Plateau Permafrost Map based on MODIS LST product. J. Glaciol. Geocryol. 2017, 39, 70. [Google Scholar] [CrossRef]
- Li, A.; Xia, C.; Bao, C.; Yin, G. Using MODIS Land Surface Temperatures for Permafrost Thermal Modeling in Beiluhe Basin on the Qinghai-Tibet Plateau. Sensors 2019, 19, 4200. [Google Scholar] [CrossRef]
- Zhang, X.; Zhou, J.; Liang, S.; Wang, D. A practical reanalysis data and thermal infrared remote sensing data merging (RTM) method for reconstruction of a 1-km all-weather land surface temperature. Remote Sens. Environ. 2021, 260, 112437. [Google Scholar] [CrossRef]
- Peng, X.; Zhang, T.; Cao, B.; Wang, Q.; Wang, K.; Shao, W.; Guo, H. Changes in Freezing-Thawing Index and Soil Freeze Depth Over the Heihe River Basin, Western China. Arctic, Antarct. Alp. Res. 2016, 48, 161–176. [Google Scholar] [CrossRef]
- Hengl, T.; De Jesus, J.M.; Heuvelink, G.B.M.; Gonzalez, M.R.; Kilibarda, M.; Blagotić, A.; Shangguan, W.; Wright, M.N.; Geng, X.; Bauer-Marschallinger, B.; et al. SoilGrids250m: Global gridded soil information based on machine learning. PLoS ONE 2017, 12, e0169748. [Google Scholar] [CrossRef]
- Akinwande, M.O.; Dikko, H.G.; Samson, A. Variance Inflation Factor: As a Condition for the Inclusion of Suppressor Variable(s) in Regression Analysis. Open J. Stat. 2015, 5, 754–767. [Google Scholar] [CrossRef]
- Zhang, B.; Zhou, W. Spatial–Temporal Characteristics of Precipitation and Its Relationship with Land Use/Cover Change on the Qinghai-Tibet Plateau, China. Land 2021, 10, 269. [Google Scholar] [CrossRef]
- Li, L.; Zhang, Y.; Wu, J.; Li, S.; Zhang, B.; Zu, J.; Zhang, H.; Ding, M.; Paudel, B. Increasing sensitivity of alpine grasslands to climate variability along an elevational gradient on the Qinghai-Tibet Plateau. Sci. Total Environ. 2019, 678, 21–29. [Google Scholar] [CrossRef]
- Klotzsche, A.; Jonard, F.; Looms, M.; van der Kruk, J.; Huisman, J. Measuring Soil Water Content with Ground Penetrating Radar: A Decade of Progress. Vadose Zone J. 2018, 17, 180052–180059. [Google Scholar] [CrossRef]
- Westermann, S.; Wollschläger, U.; Boike, J. Monitoring of active layer dynamics at a permafrost site on Svalbard using multi-channel ground-penetrating radar. Cryosphere 2010, 4, 475–487. [Google Scholar] [CrossRef]
- Wu, K.; Rodriguez, G.A.; Zajc, M.; Jacquemin, E.; Clément, M.; De Coster, A.; Lambot, S. A new drone-borne GPR for soil moisture mapping. Remote Sens. Environ. 2019, 235, 111456. [Google Scholar] [CrossRef]
- Parsekian, A.D. Inverse Methods to Improve Accuracy of Water Content Estimates from Multi-offset GPR. J. Environ. Eng. Geophys. 2018, 23, 349–361. [Google Scholar] [CrossRef]
- Jafarov, E.E.; Parsekian, A.D.; Schaefer, K.; Liu, L.; Chen, A.C.; Panda, S.K.; Zhang, T. Estimating active layer thickness and volumetric water content from ground penetrating radar measurements in Barrow, Alaska. Geosci. Data J. 2018, 4, 72–79. [Google Scholar] [CrossRef]
- Bonomo, N.; de la Vega, M.; Martinelli, P.; Osella, A. Pipe-flange detection with GPR. J. Geophys. Eng. 2010, 8, 35–45. [Google Scholar] [CrossRef]
- Prego, F.; Solla, M.; Puente, I.; Arias, P. Efficient GPR data acquisition to detect underground pipes. NDT E Int. 2017, 91, 22–31. [Google Scholar] [CrossRef]
- Iftimie, N.; Savin, A.; Steigmann, R.; Dobrescu, G.S. Underground Pipeline Identification into a Non-Destructive Case Study Based on Ground-Penetrating Radar Imaging. Remote Sens. 2021, 13, 3494. [Google Scholar] [CrossRef]
Publisher’s Note: MDPI stays neutral with regard to jurisdictional claims in published maps and institutional affiliations. |
© 2022 by the authors. Licensee MDPI, Basel, Switzerland. This article is an open access article distributed under the terms and conditions of the Creative Commons Attribution (CC BY) license (https://creativecommons.org/licenses/by/4.0/).