Assessing the mobility of lower-limb joints by means of goniometry is a common practice in many clinical disciplines. The measurement methods and protocols that were originally described by Root et al [
1] are generally accepted by podiatric physicians. In recent years, however, the validity and, especially, the reliability of these measurements have been increasingly called into question by the podiatric community itself [
2,
3,
4].
The question of clinical measurement reliability is not new or specific to the measurements made by podiatric physicians on the foot and lower extremity. The reliability of human body measurements has always been a source of discussion. It is no surprise that numerous researchers have attempted to assess the reliability of lower-joint measurements, not only between different examiners (interrater reliability), but also between different trials of the same examiner (intrarater reliability).
A study by Boone et al [
5], a typical and popular reference on goniometric reliability, used multiple therapists to evaluate the reliability of various upper- and lower-extremity measurements. The average interrater and intrarater values for intraclass correlation coefficients (ICCs) for foot inversion, for example, were 0.69 and 0.80, respectively. Unfortunately, only 12 subjects were studied.
Bovens et al [
6], also performing upper- and lowerextremity goniometry, reported reliability figures for subtalar eversion, inversion, and ankle dorsiflexion of 0.56, 0.80, and 0.63, respectively, for interrater comparison; their figures for intrarater reliability for the best of the three raters were all higher than 0.74. Here also, the small number of subjects (eight) limited the usefulness of the results. In both studies, however, intrarater reliability yielded higher scores than reliability between different therapists.
Baldwin and Graebner [
7] used
t-tests to compare the tractograph with the K-square device for the evaluation of interrater reliability of rearfoot and forefoot measurements. Between the two examiners, rearfoot measurement was found to be significantly unreliable while forefoot-to-rearfoot measurement could be reliably measured only with the K-square. Muwanga et al [
8], using analysis of variance (ANOVA) techniques to evaluate ankle joint range of motion, reported no significant differences between different observers or between different trials of the same observer. However, it has been noted that the use of
t-tests and, in its generalized form, the use of ANOVA may lead to unreliable conclusions, as large differences between individual measurements may be masked and remain unnoticed, even though the means of the measurements may be very similar [
9].
Lohman et al [
10] compared only two observers measuring tibial varum of 20 healthy subjects in three different ways and found ICCs of 0.46 to 0.83 for intrarater and 0.41 to 0.58 for interrater reliability. A study by Smith-Oricchio and Harris [
11] compared calcaneal measurements under weightbearing and nonweightbearing conditions and showed the relaxed calcaneal stance measurements to be much more reliable than the prone nonweightbearing measurements for subtalar pronation and supination (ICC, 0.91
versus 0.25 and 0.42). More recently, a study by Aström and Arvidson [
12] evaluated lower-extremity alignment of 121 healthy subjects and found a wide range of interrater ICC scores (from 0.36 to 0.94), with the neutral calcaneal stance measurement scoring the lowest. It is interesting that the intrarater reliability for both observers was generally above 0.9 for the first observer and above 0.8 for the second.
Also worth mentioning are the studies by Menz and Keenan [
13] and by Sell and coworkers [
14], which both evaluated the reliability of neutral and relaxed calcaneal stance using a gravity goniometer. These are among the only articles found that contrast the reliability coefficients with the so-called standard error of measurement (SEM), a direct measure of measurement accuracy. Sell’s group presented high interrater reliability values (about 0.85), which were accompanied by clinically acceptable SEMs (<2°), thus reflecting good measurement accuracy. The other authors displayed only fair interrater reliability coefficients, reaching values above 0.64. But these figures were rendered clinically insignificant by the large SEMs. This study demonstrates the limited value of correlation coefficients if they are not complemented by the related SEMs.
Studies using patients, rather than normal subjects, have shown reliability figures similar to those in the studies mentioned above. Pandya et al [
15] measured selected upper- and lower-extremity joints of children affected by Duchenne muscular dystrophy and found the interrater ICC to fluctuate widely from 0.25 to 0.91, in contrast with the more consistent and higher intrarater ICC, which ranged from 0.81 to 0.94. As other studies have demonstrated, goniometric measurements from the same observer showed higher scores and thus can be considered to be much more reliable than goniometric measurements from different observers.
Diamond and coworkers [
16] reported reliability measurements on diabetic patients for typical rearfoot and forefoot measurements, with ICCs ranging from 0.58 to 0.89 for interrater and from 0.84 to 0.96 for intrarater comparison. One explanation for the relatively high interrater coefficients in this study is that both examiners were experienced physical therapists who had been extensively trained and who continuously adjusted to each other.
Elveru et al [
17] performed an elaborate study on the goniometric reliability of the subtalar joint neutral position and the passive range of motion of the ankle and the subtalar joint in a clinical setting with therapists of limited experience. The 43 patients studied had either general orthopedic or neurologic disorders. Intrarater ICCs as a function of the type of pathology varied from 0.59 to 0.90 while interrater coefficients fluctuated between 0.12 and 0.72. It must be noted, however, that the restriction of the ICC calculation to one specific pathology may cause the reliability coefficient to vary considerably, especially for interrater comparison.
Ashton et al [
18], working with cerebral palsy patients, found that the severity of the pathologic condition influenced reliability coefficients of hip-mobility measurements: children with a moderate condition had different reliability coefficients than mildly affected children. This, together with a study by Bartlett et al [
19] of patients with spastic diplegia and meningomyelocele, suggests that reliability coefficients are influenced not only by the specific deformity being measured but also by the magnitude of the deformity experienced by the patient.
In this regard, Ekstrand et al [
20] have demonstrated that goniometric measurements of the lower extremity (hip, knee, and ankle flexion) are dramatically more reliable when the measurement protocol is strictly standardized. In that study, the improvement of the measurement procedures by the use of better fixation and more accurate identification and marking of anatomical landmarks caused the variation within the same raters and between sessions, as measured by the mean (±SD) coefficient of variation, to drop from 7.5% ± 2.9% to 1.9% ± 0.7%.
Some studies (Payne and Richardson [
21], Bovens et al [
6], and Freeman [
22]) tried to demonstrate that increased experience may improve measurement reliability. Contrary to the results of Payne and Richardson, which showed no improvement during the second examination of the relaxed and neutral calcaneal stance at about 6 months of practice later, both Freeman and Bovens et al showed that more experience resulted in higher accuracy and, hence, greater reliability.
Judging from the many discussions in the podiatric medical community about the reliability of clinical measurements [
2,
3,
4], the debate is ongoing and undiminished. The reliability of goniometric measurements is not a statistical game; it forms the clinical basis for the comparison of structural variances and range-of-motion differences in one individual over time and between one individual and another. If, for example, an examiner is able to make consistent goniometric measurements repeatedly on the same patient (intrarater reliability), then the clinician will be able to reliably monitor the change in goniometric measurements over the life of an individual or to monitor the clinical effects of conservative or surgical therapy on an individual patient. In addition, if different examiners are able to make consistent goniometric measurements on the same patient (interrater reliability), then one clinician will be able to reliably describe the mechanical and structural characteristics of a patient’s foot and lower extremity to another clinician. The importance of interrater and intrarater reliability and its clinical relevance to the goal of improved patient care should not be underestimated.
It was therefore the purpose of this study to estimate the reliability and accuracy of a complete set of joint measurements as described and presented by Root and coworkers [
1] and practiced by most podiatric physicians as part of the clinical assessment of their patients. The study tried to answer three questions: 1) How good were experienced podiatric physicians at agreeing with one another’s clinical measurements (interrater reliability)? 2) How much better were they at agreeing with their own measurements (intrarater reliability)? 3) Which measurements or tests displayed the highest reliability scores? The study also attempted to improve the accuracy and power of the statistical results by relying on a large number of subjects and raters, using a broad selection of measurements, and applying a repeated two-way ANOVA design as proposed by Eliasziw et al [
23] instead of the more popular, but less effective, one-way technique [
24].
Experimental Design and Methods
Subjects and Raters
Thirty healthy subjects, 14 men and 16 women (all between 20 and 40 years old, with a mean age of 24.8 years) were selected for this study. All were free of injury at the time of study and had never had surgical intervention on the lower extremities. The five raters were all professional podiatric physicians with varying levels of experience. Raters 1 and 5 had 7 years of clinical experience; rater 2 had more than 20 years of clinical experience; and the other two raters had less than 2 years of clinical experience.
Each subject was measured twice in succession by the same rater, with the retest immediately following the test. It would have been ideal to have the raters perform the test and retest on different days to avoid the possibility of memorizing the measurements. Owing to the relatively large number of raters, this was not feasible in the authors’ clinical setting. Immediate retest measurements can be considered a limitation of the experimental design in that it may have caused an overestimation of the intrarater reliability.
Clinical Measurements
The goniometric measurements used in the study are listed in
Table 1 and
Table 2. All measurements were performed according to the classic measurement routines as described by Root et al [
1]. The one exception was the subtalar range of motion, where inversion and eversion were estimated by means of the bisection drawn with the calcaneus in neutral position rather than by means of the center line between the bisections drawn with the calcaneus in maximal pronation and supination.
The instruments used for the goniometric measurements were devices commonly used by podiatric practitioners: a protractor to measure subtalar and ankle range of motion; the legged gravity goniometer for malleolar torsion and transverse hip mobility; and a nonlegged gravity goniometer (inclinometer) for relaxed and neutral calcaneal stance and tibial varum.
Statistical Tests
As the study design used ANOVA statistics to evaluate measurement reliability, it was necessary to initially determine the normal measurements for all variables by means of a classic Kolmogorov-Smirnov test. A Pearson correlation was required to evaluate the dependence between the left and right legs. In this way, if it was determined that the Pearson correlations were low or insignificant, the left and right measurements could be pooled, effectively doubling the statistical population from 30 subjects to 60 feet.
To evaluate measurement reliability, ANOVA-based ICC techniques were applied [
23]. Intraclass correlation coefficient statistical techniques are now considered much more appropriate and powerful statistical tools than classic
t-tests or linear correlations for estimating interrater and intrarater reliability [
9]. In addition, ICC statistics offer an SEM value, which is a very useful and practical estimate of measurement accuracy as obtained by the raters. An SEM is statistically equivalent to a standard deviation (SD). The SEM thus provides a quantitative tool for interpreting a single score or for differentiating real clinical measurement changes from irrelevant or insignificant fluctuations [
23].
Most ICCs stem from a one-way ANOVA, producing only an interrater correlation. In the present study, a two-way ANOVA design with repeated measurements (5 raters × 2 trials each), as proposed by Eliasziw et al [
23], was selected to evaluate intrarater and interrater reliability simultaneously. This has the added advantage of increased accuracy, as the two coefficients (ICC and SEM) are derived from subjects and raters simultaneously. Furthermore, in a two-way design, the SEM reflects not only the disagreement between raters but also the imprecision with which the individual raters make their measurements, while in a one-way design the raters’ measurements are
a priori assumed to be error-free.
To estimate the uncertainty of the ICCs, a 95% lower confidence limit was constructed as an alternative to the rather crude testing by null-significance hypothesis. This allowed for the comparison of the ICC’s lower limit with selected criterion values or benchmarks [
25]. Finally, as the results from the reliability study are to be generalized to other raters, a socalled random design was selected to calculate the ICC and its respective confidence limits [
23].
Results
The Kolgomorov-Smirnov test demonstrated all measurement variables to be normally distributed. Correlation testing between left and right legs proved that goniometric measurements from the two sides were significantly correlated. As a result, it was necessary to carry out all subsequent statistical analyses separately for the left and right lower extremities.
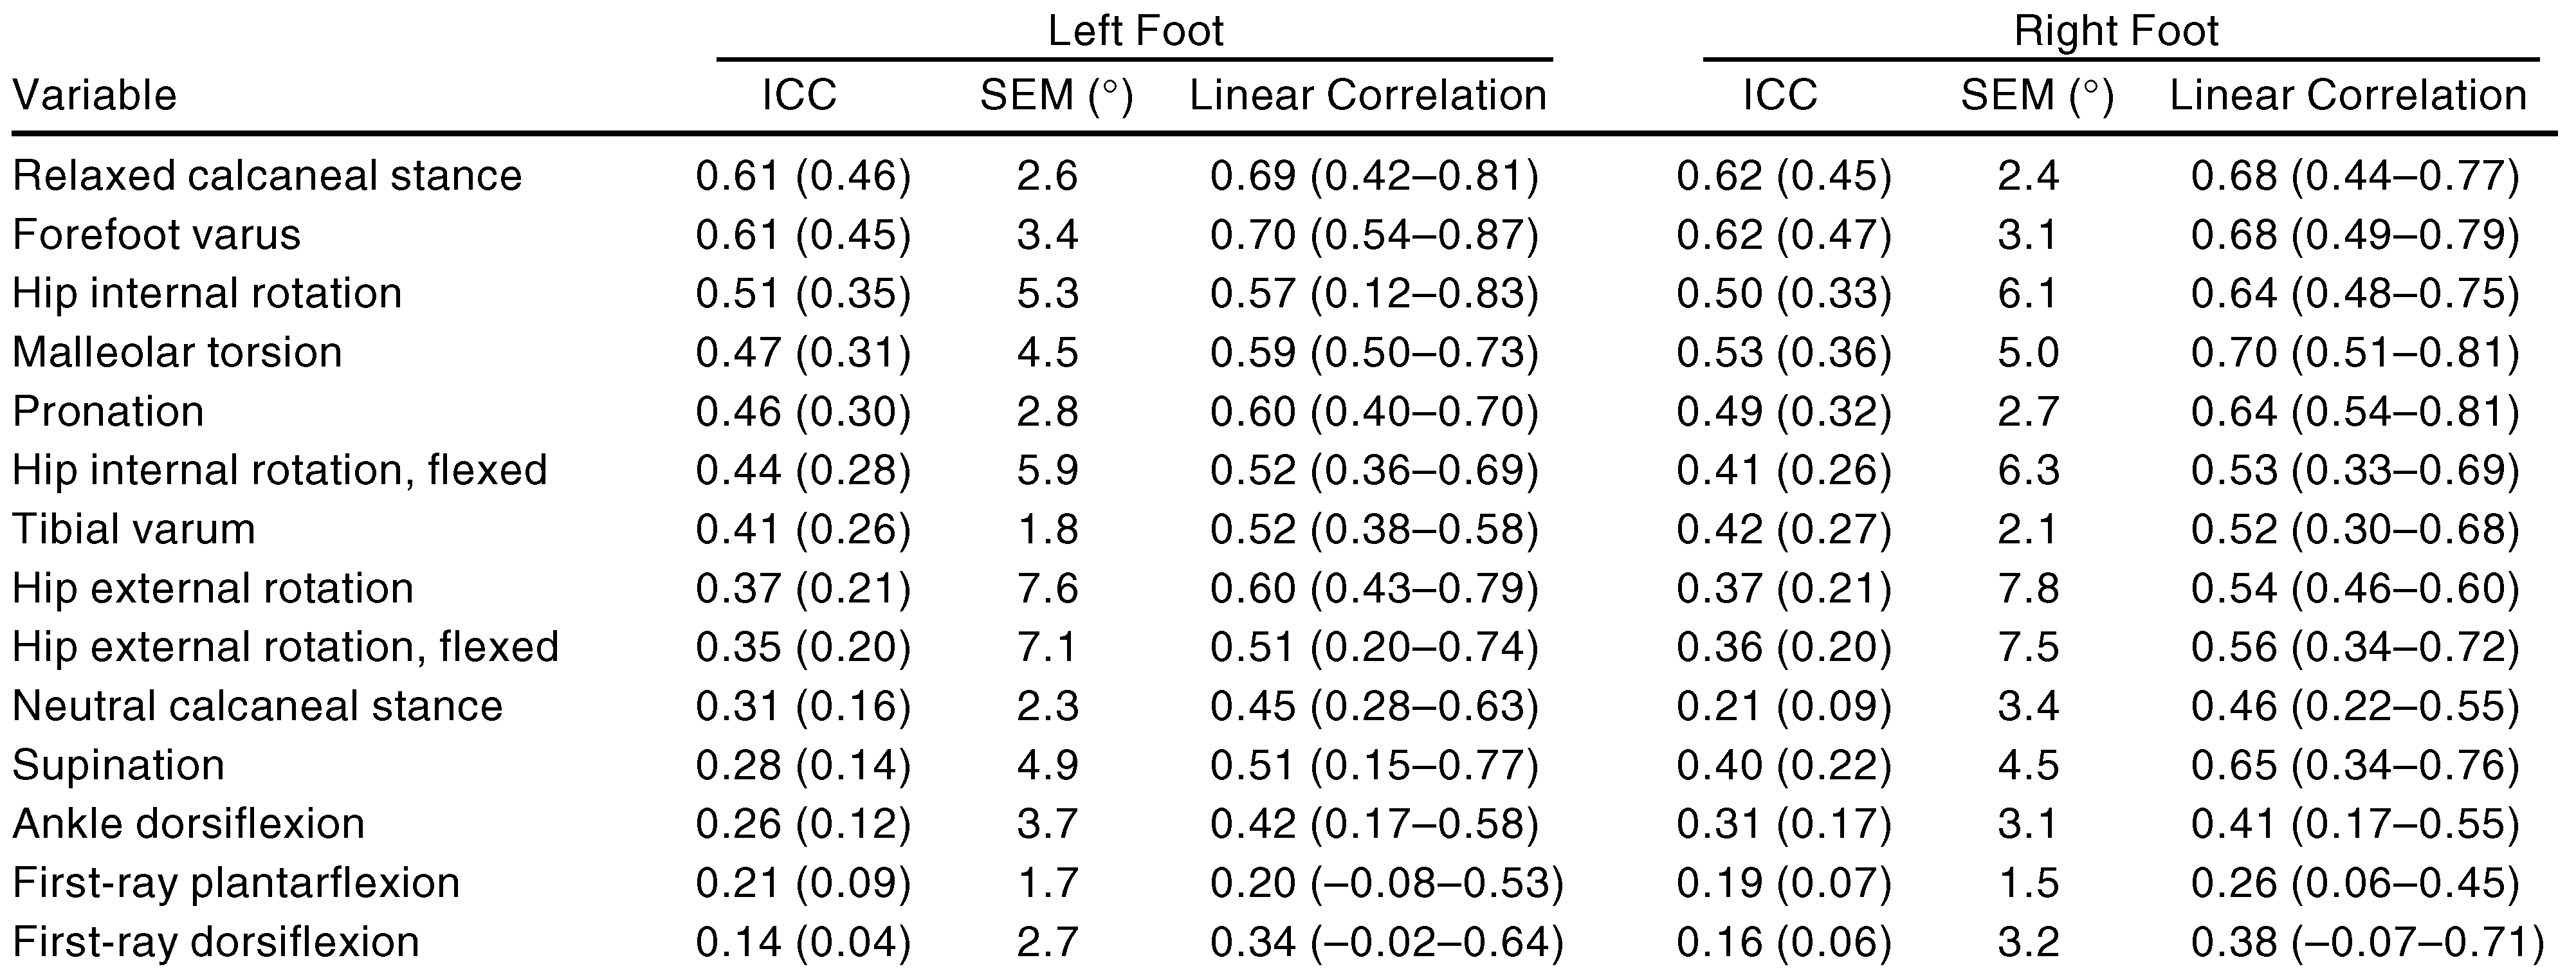
As mentioned above, it was decided to focus predominantly on ICC techniques for the evaluation of measurement reliability. The interrater ICC scores are presented in
Table 1 for all variables in descending order, together with the 95% lower confidence limits and their SEMs. For comparison, the respective mean Pearson correlation factors (averaged over all rater pairs) are shown together with their lowestto-highest value (corresponding to the lower-toupper limits of the 95% confidence interval).
The F ratios for the interrater variance of the measurements all reached beyond the 0.99 confidence limit, indicating the presence of a strong rater bias and the expectation of significant discrepancies between raters.
Table 2 presents the
t-test values for all variables and combinations of raters, proving this bias to be more or less evenly distributed among all raters. Intrarater reliability and accuracy (ICC and SEM) for each examiner are presented in
Table 3 for each left-leg variable.
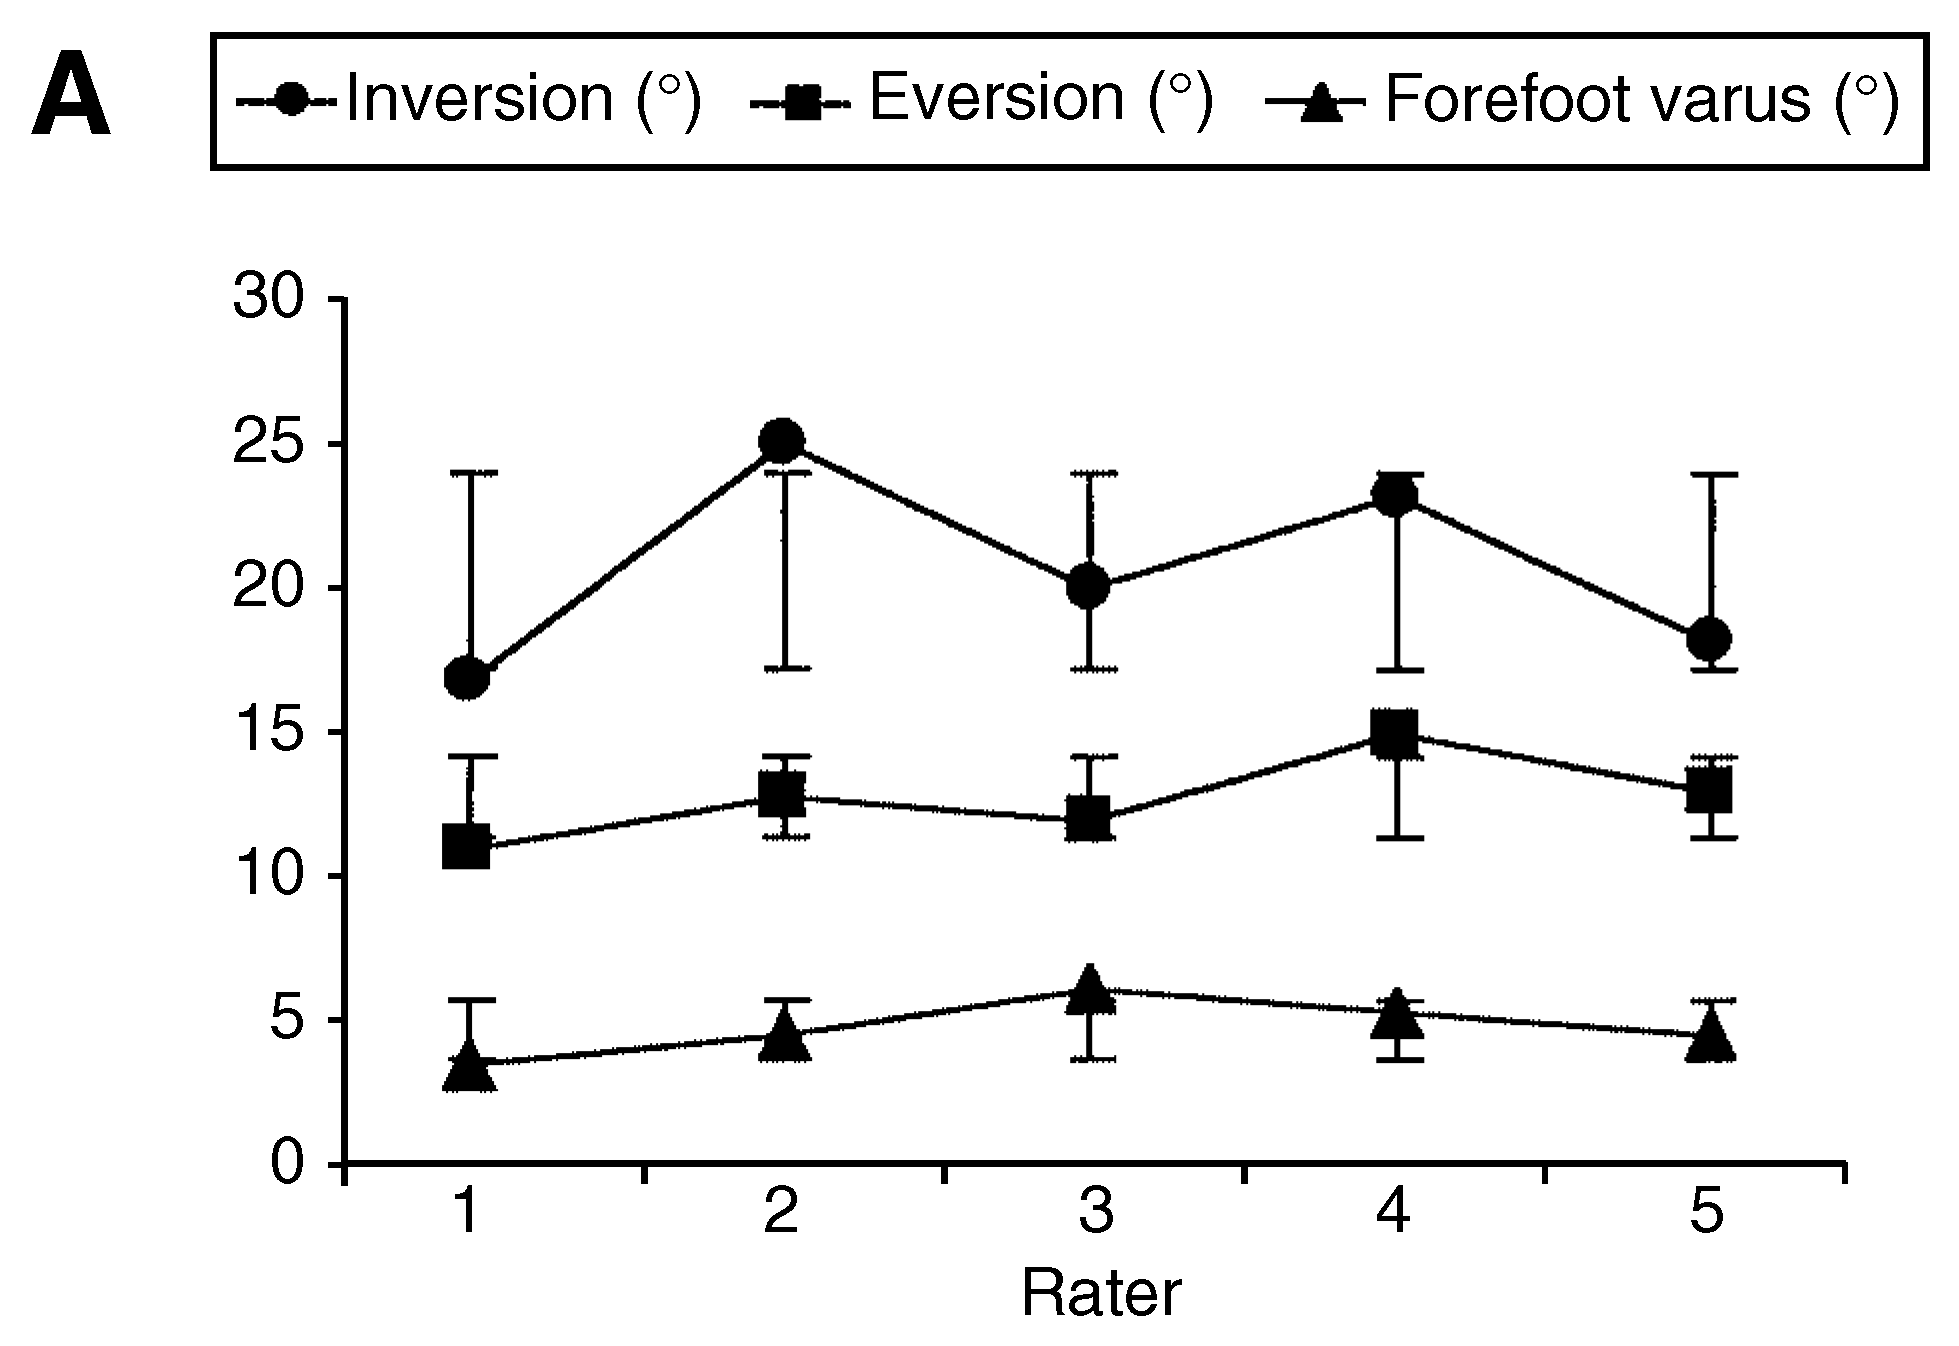
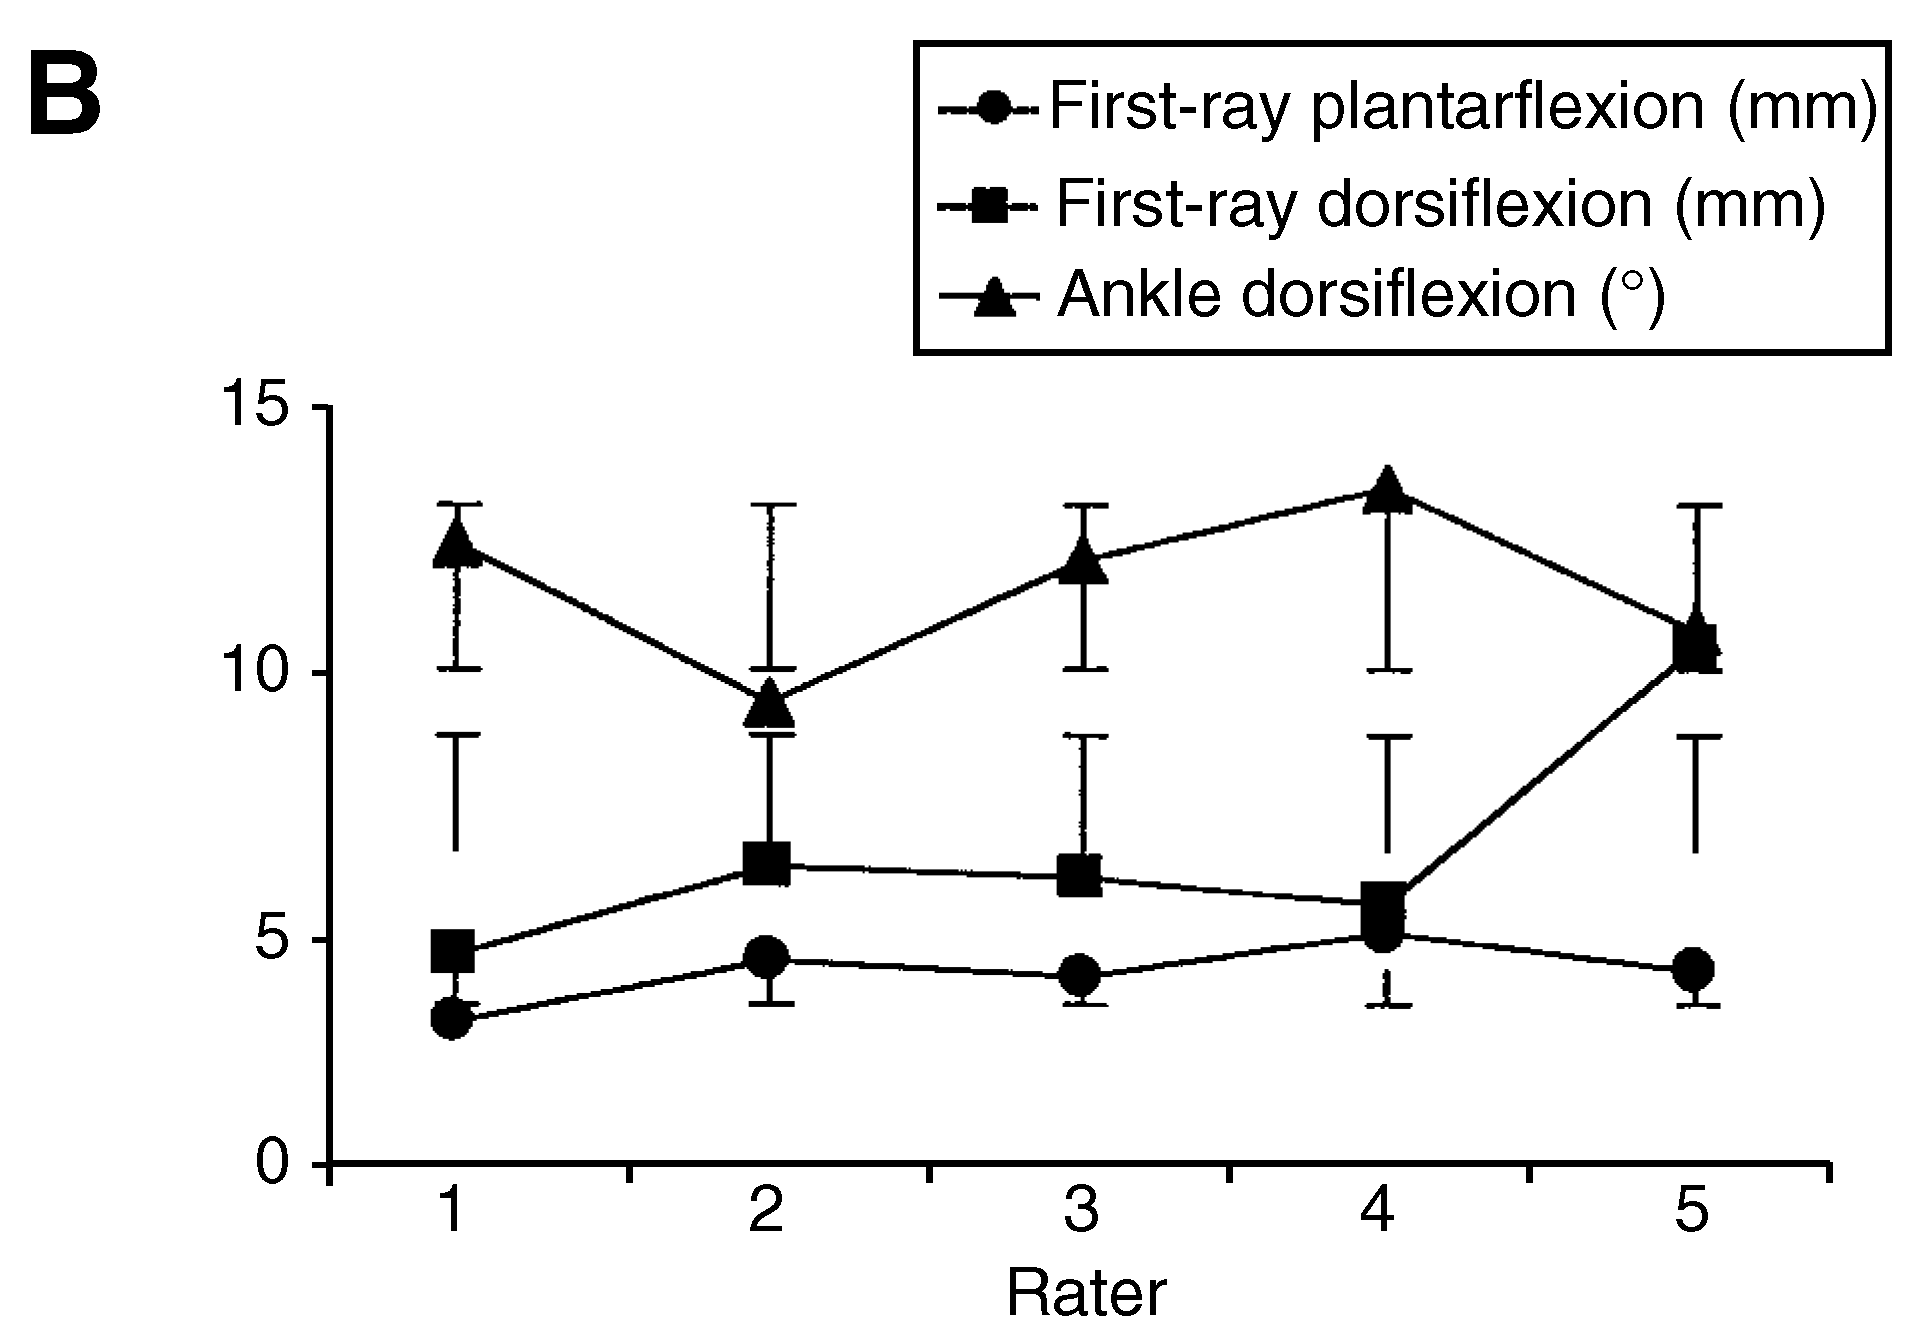
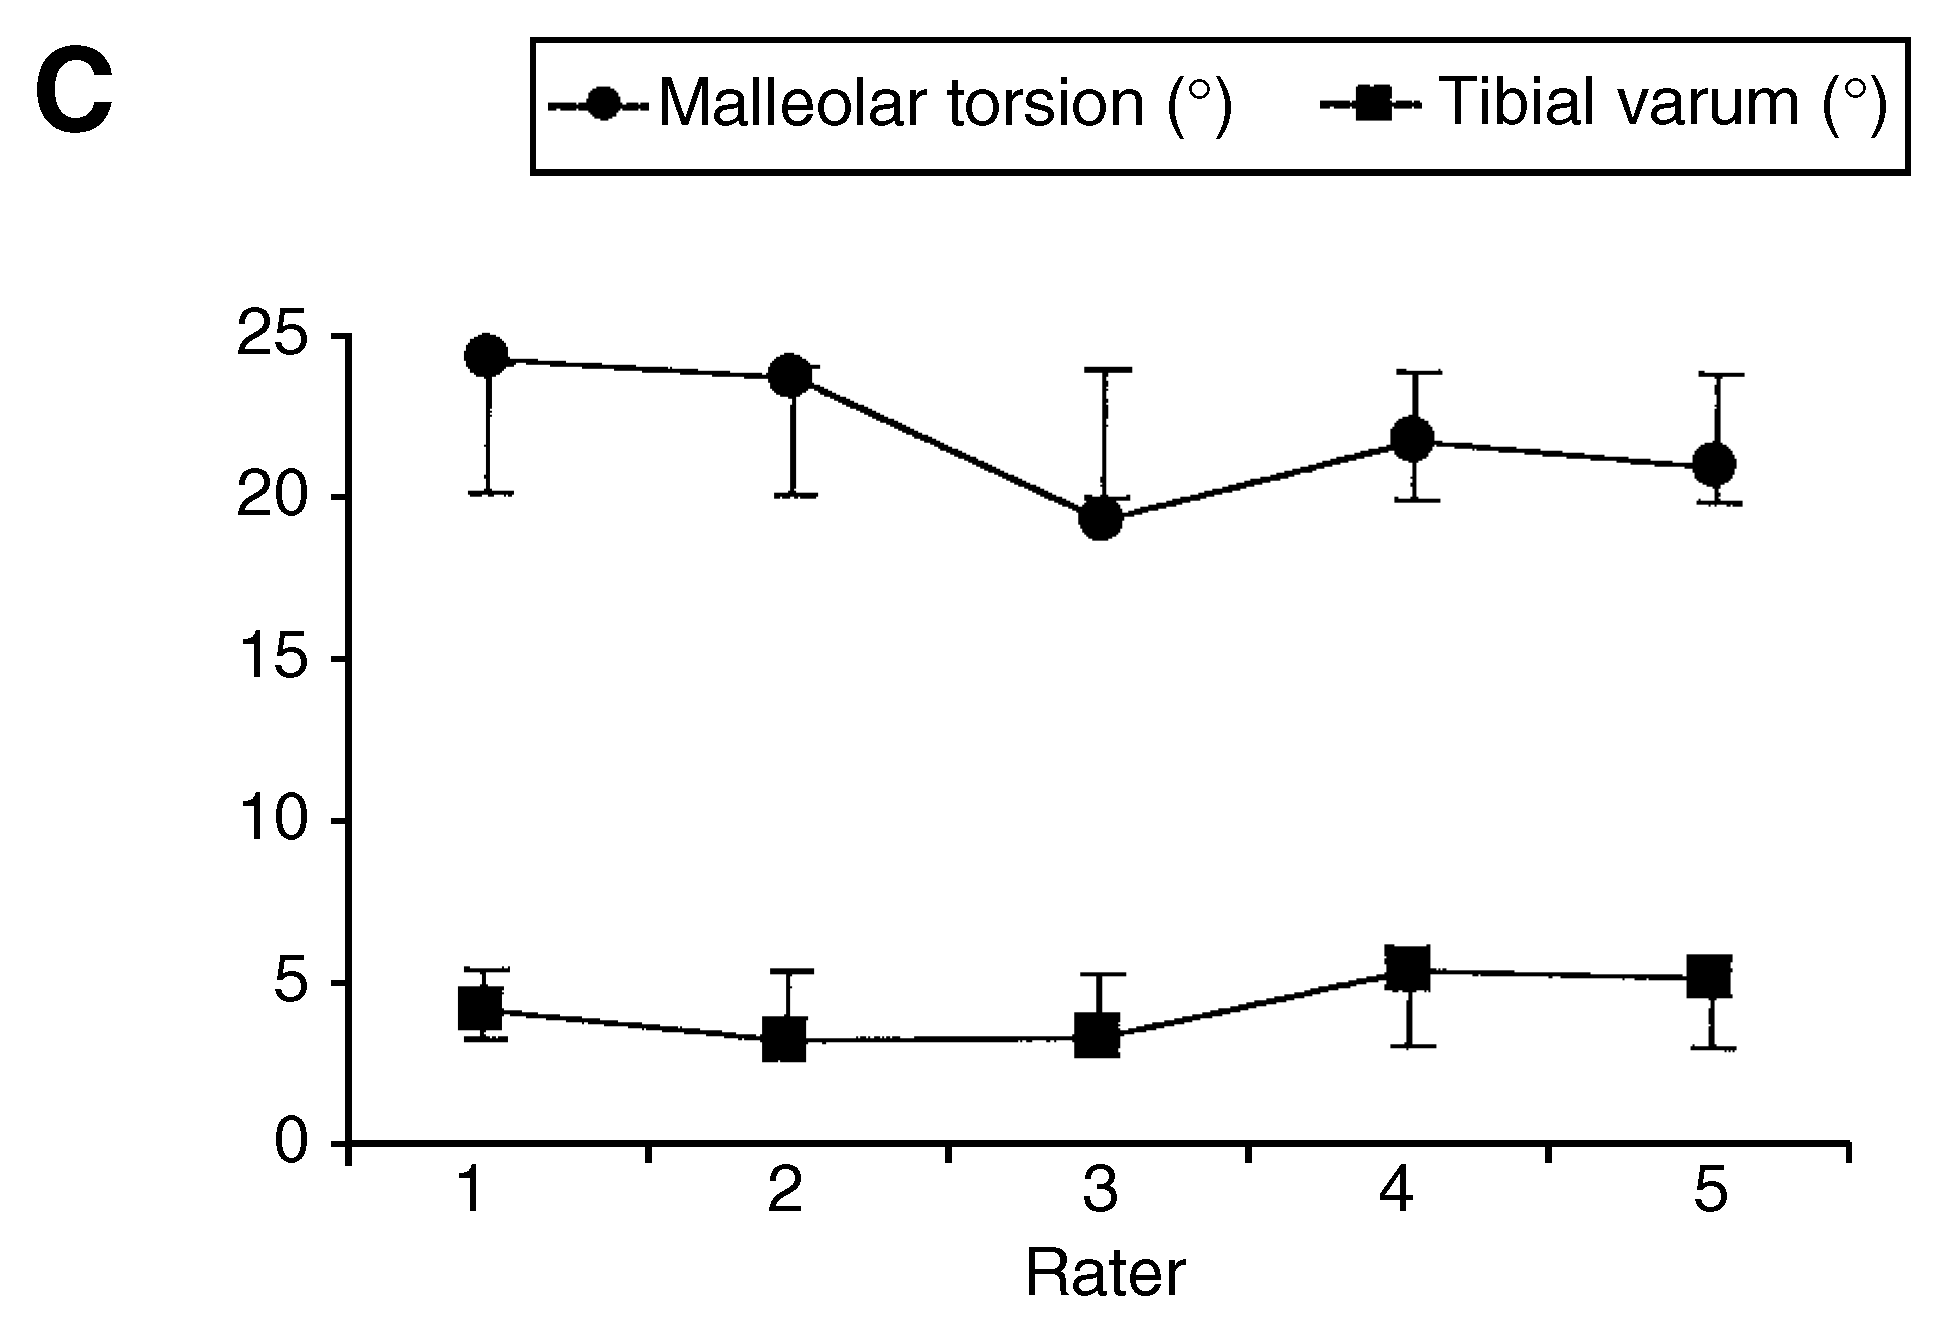
To give a visual impression of the variance of the measurements from one rater to another,
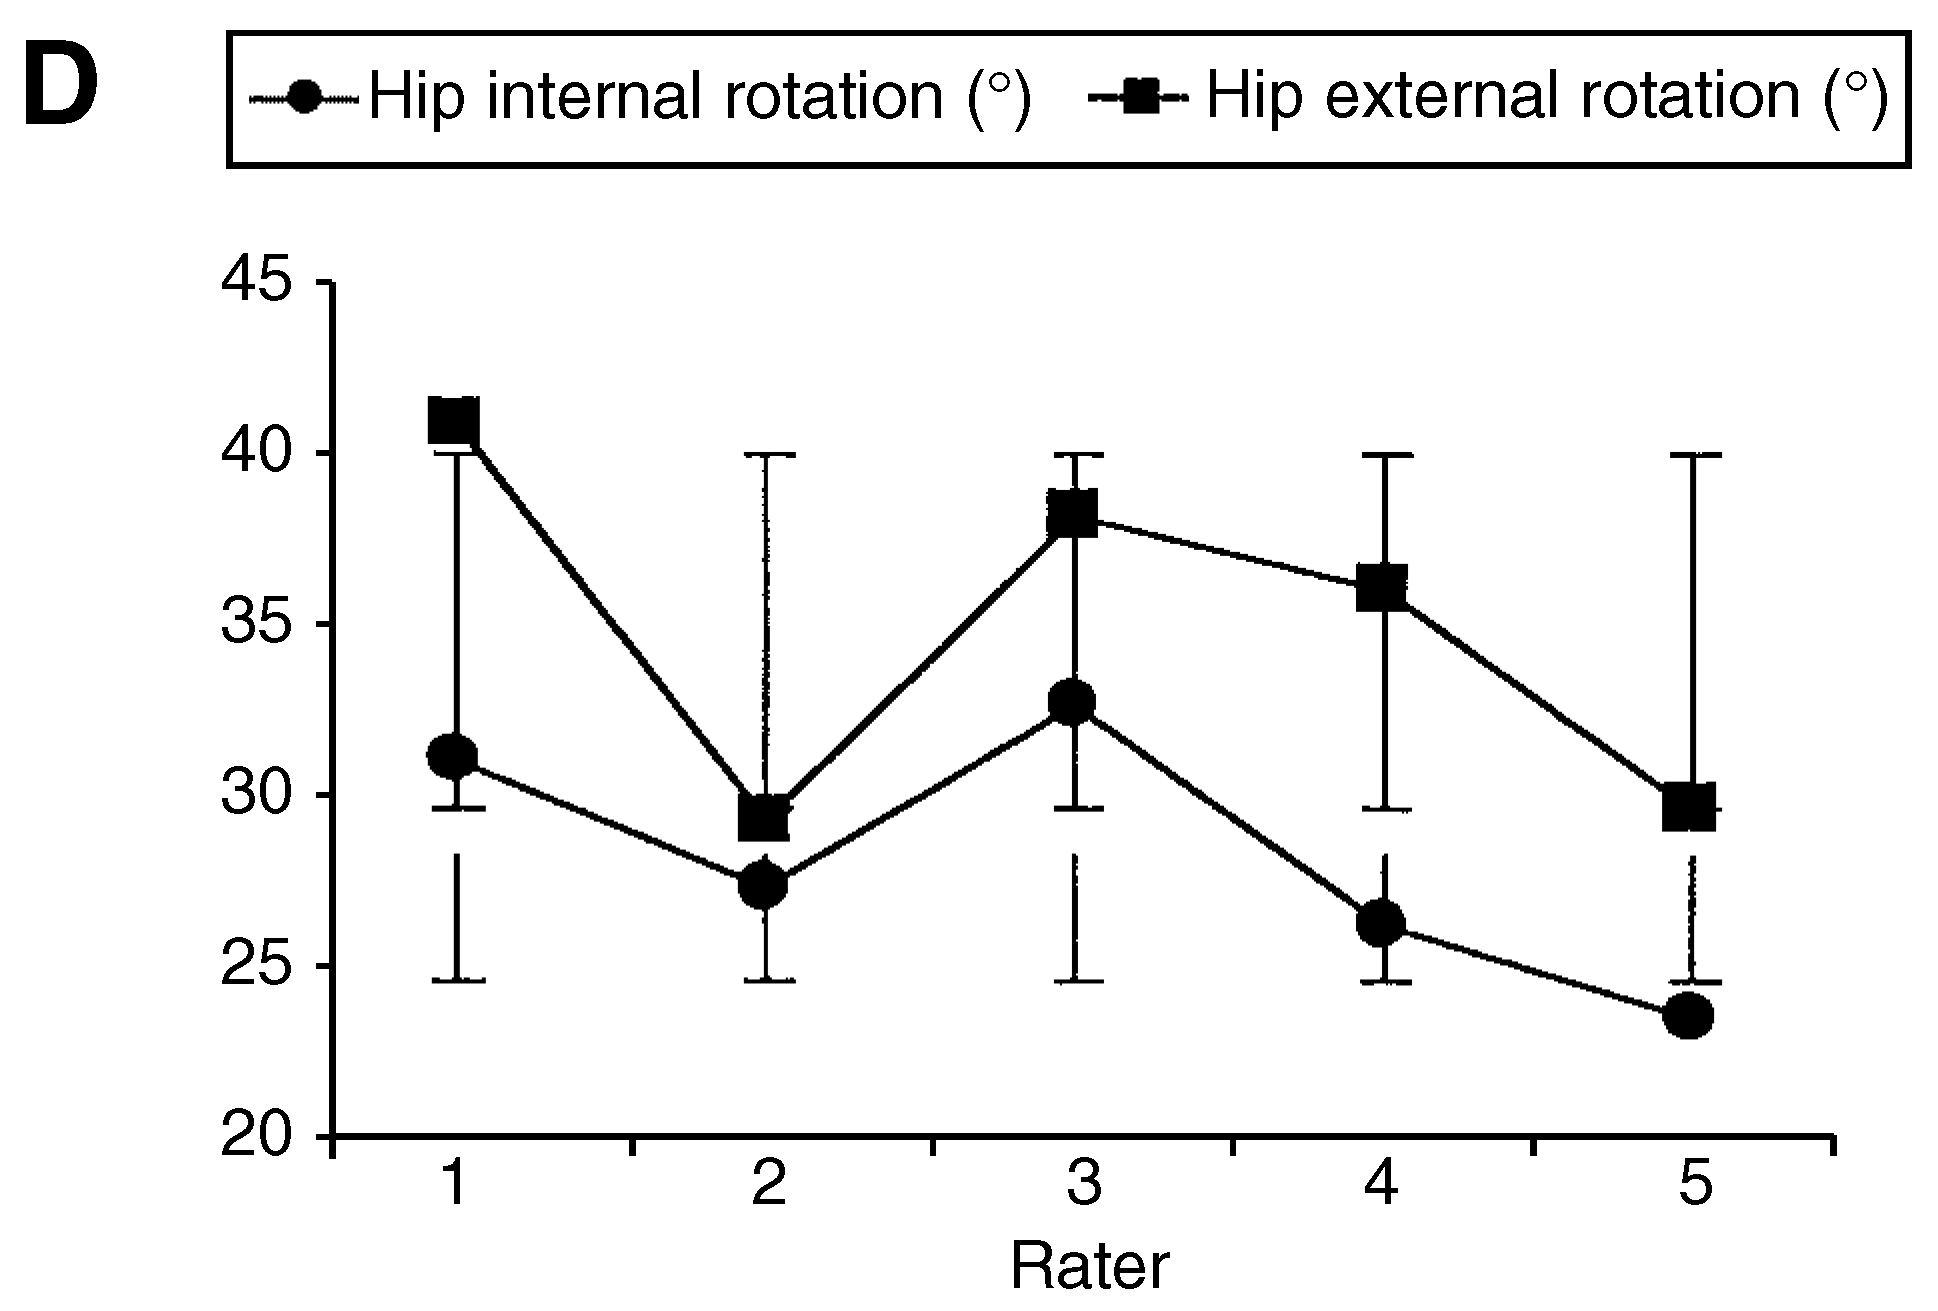
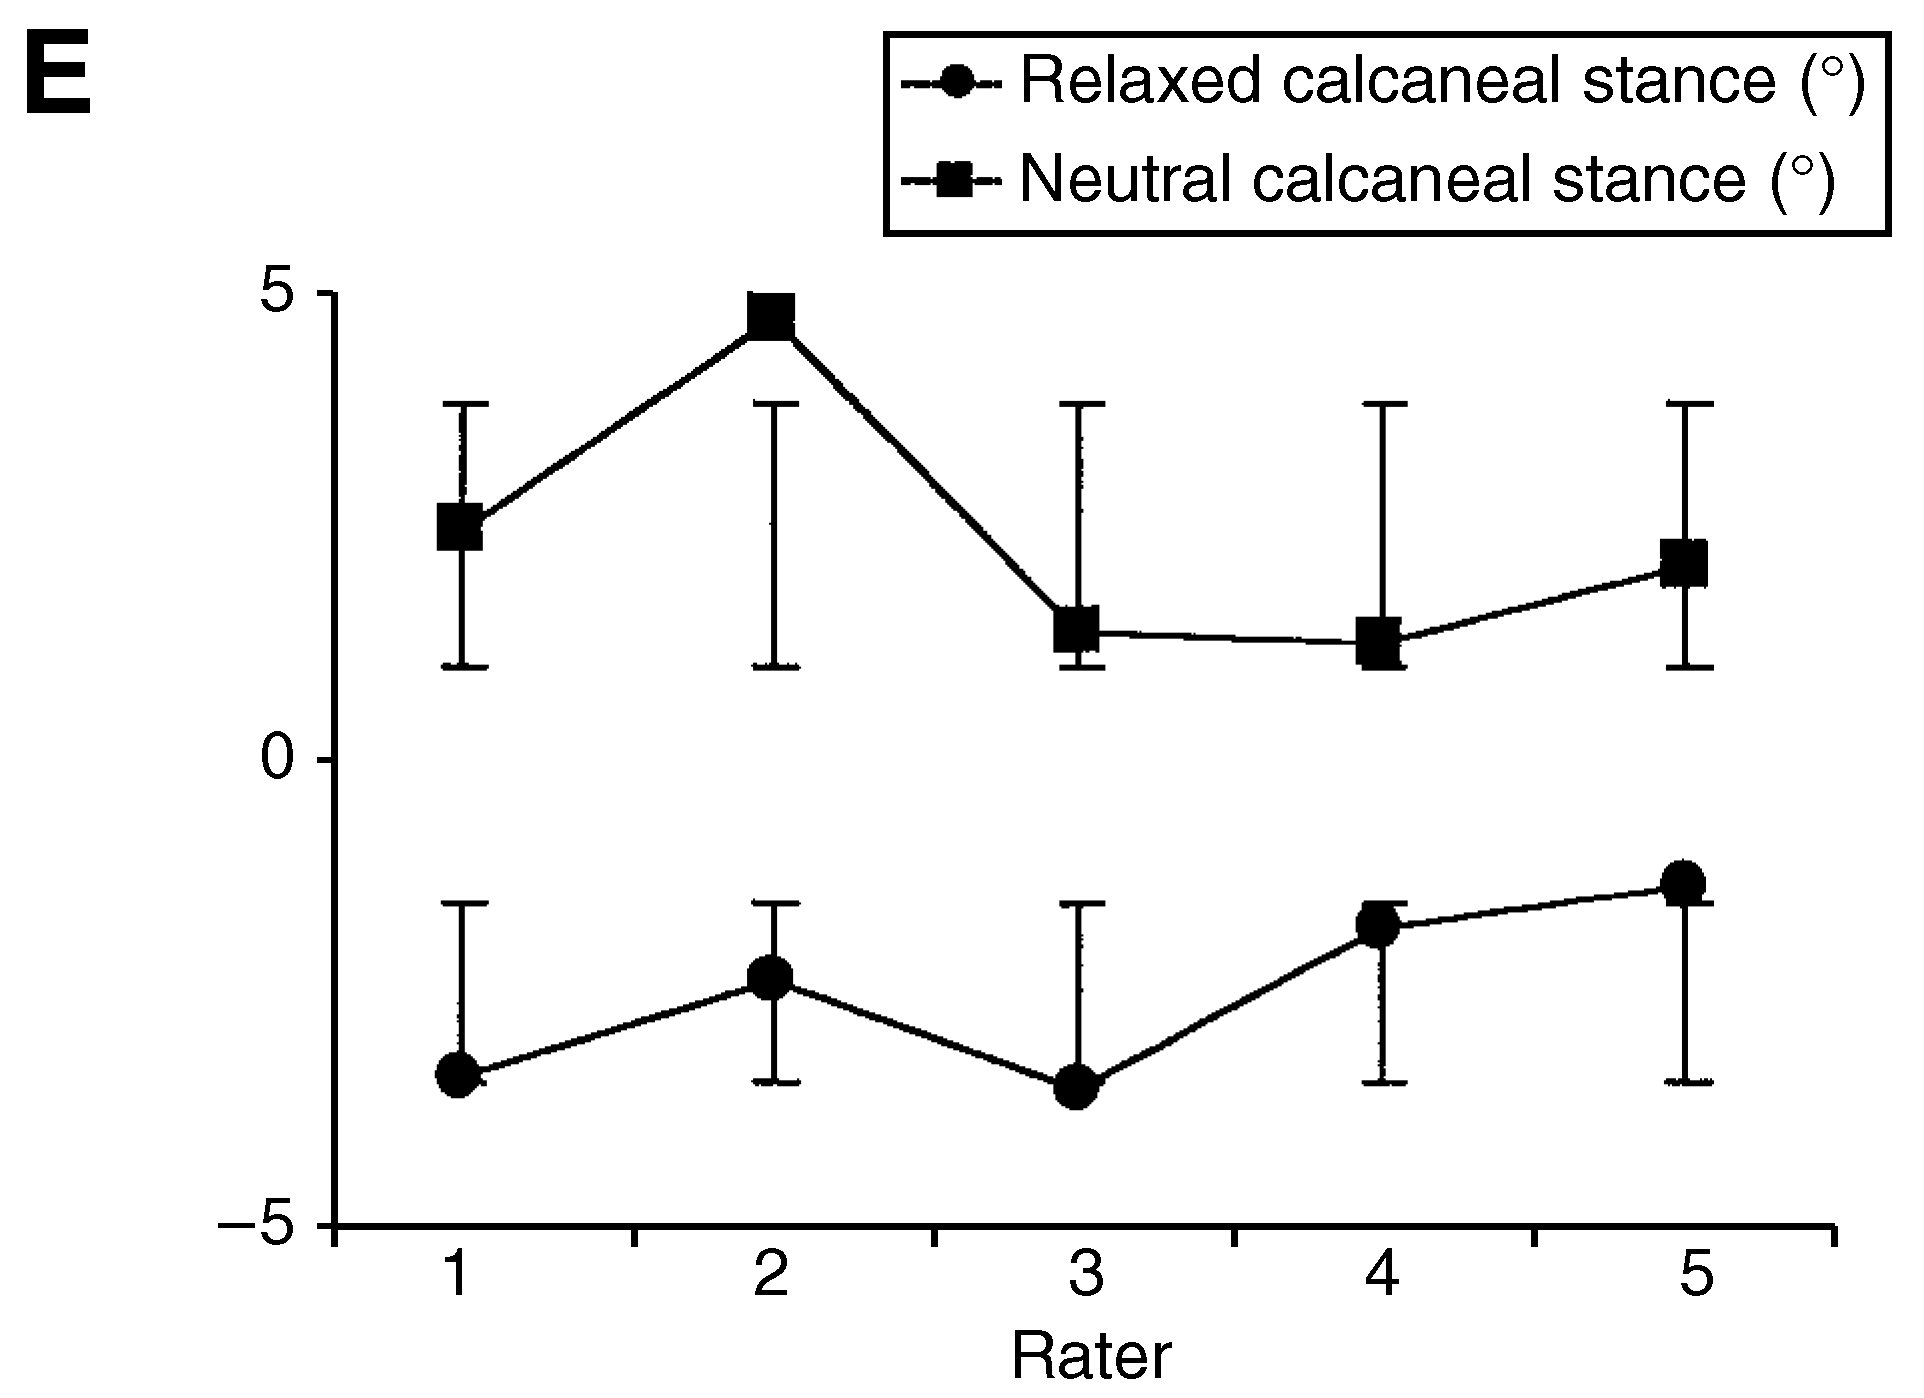
Figure 1 presents the mean and SD of the measurement variables for all five raters.
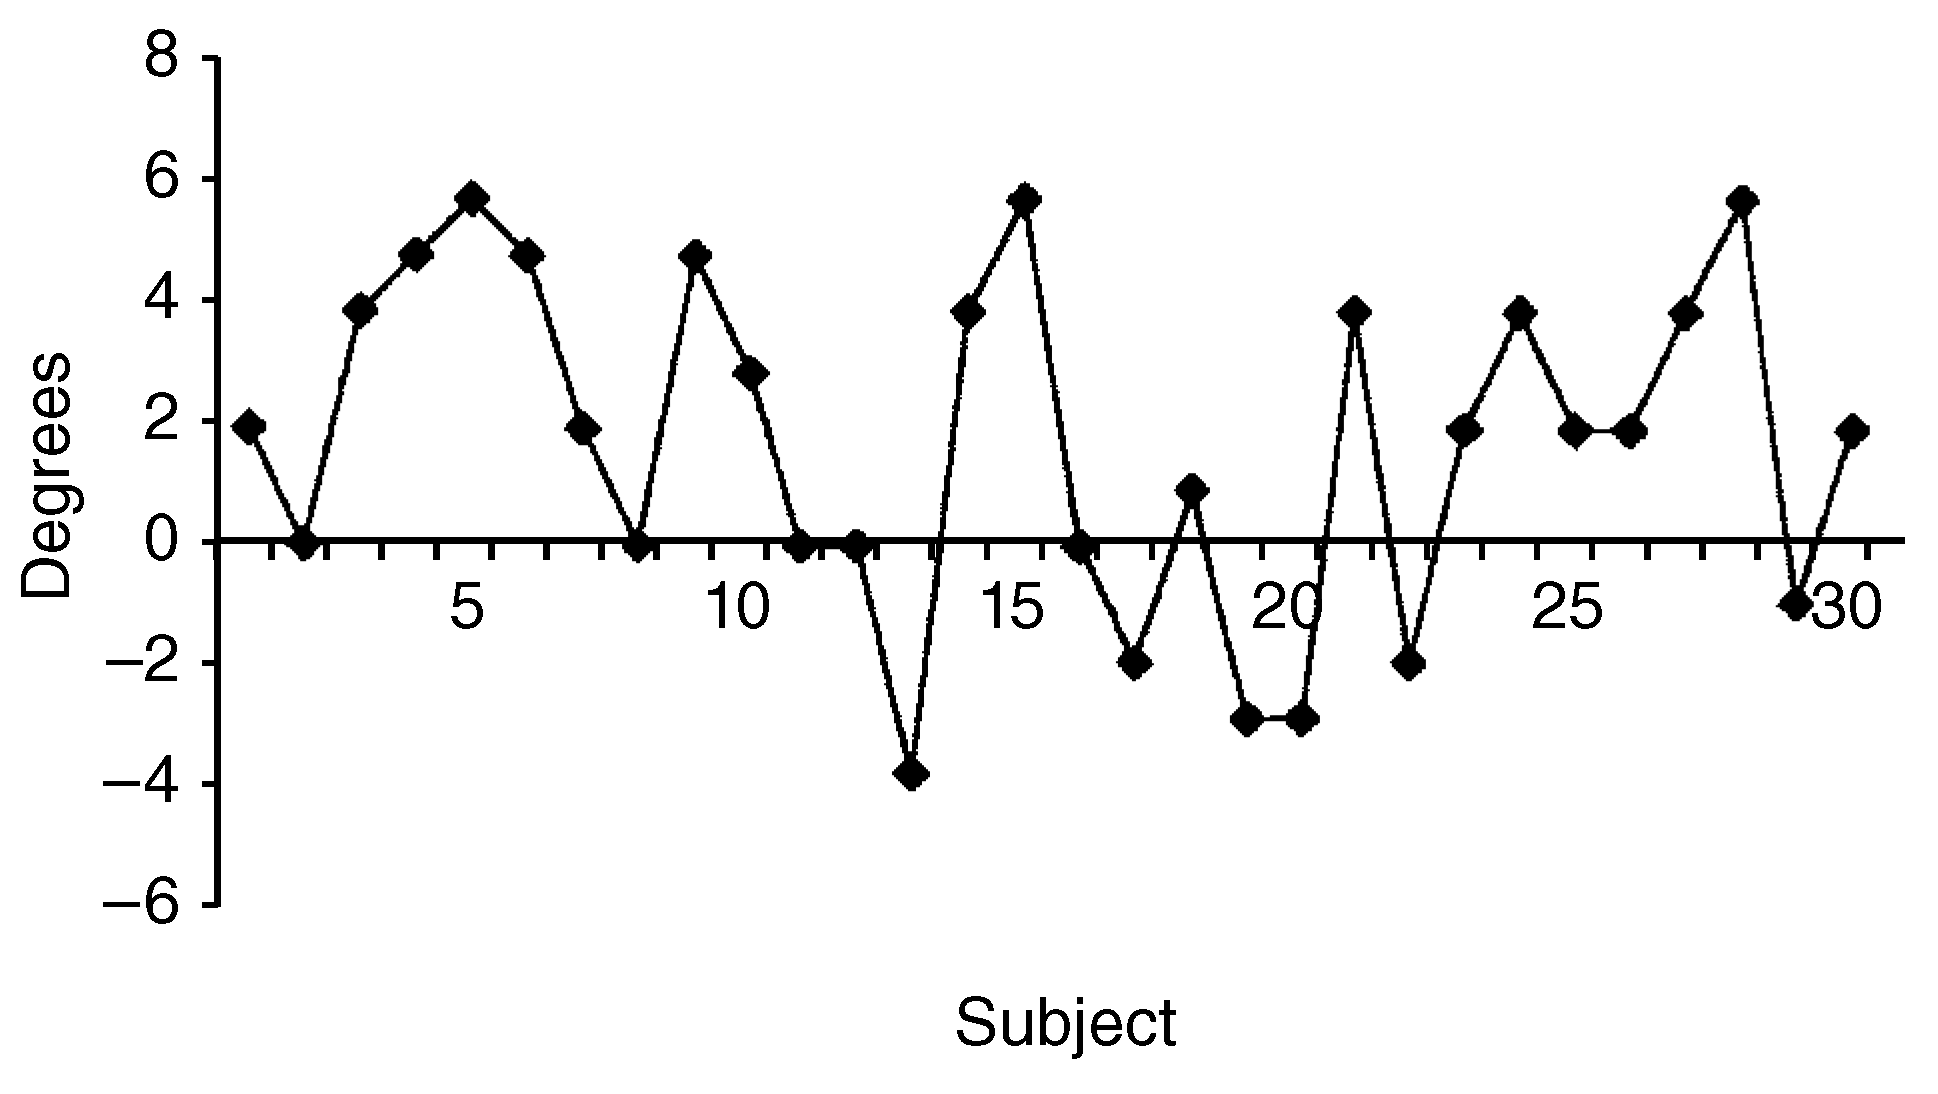
Figure 2 shows the same for the most reliable variable, relaxed calcaneal stance, but presents the measurement difference only of the two most experienced raters (2 and 5).
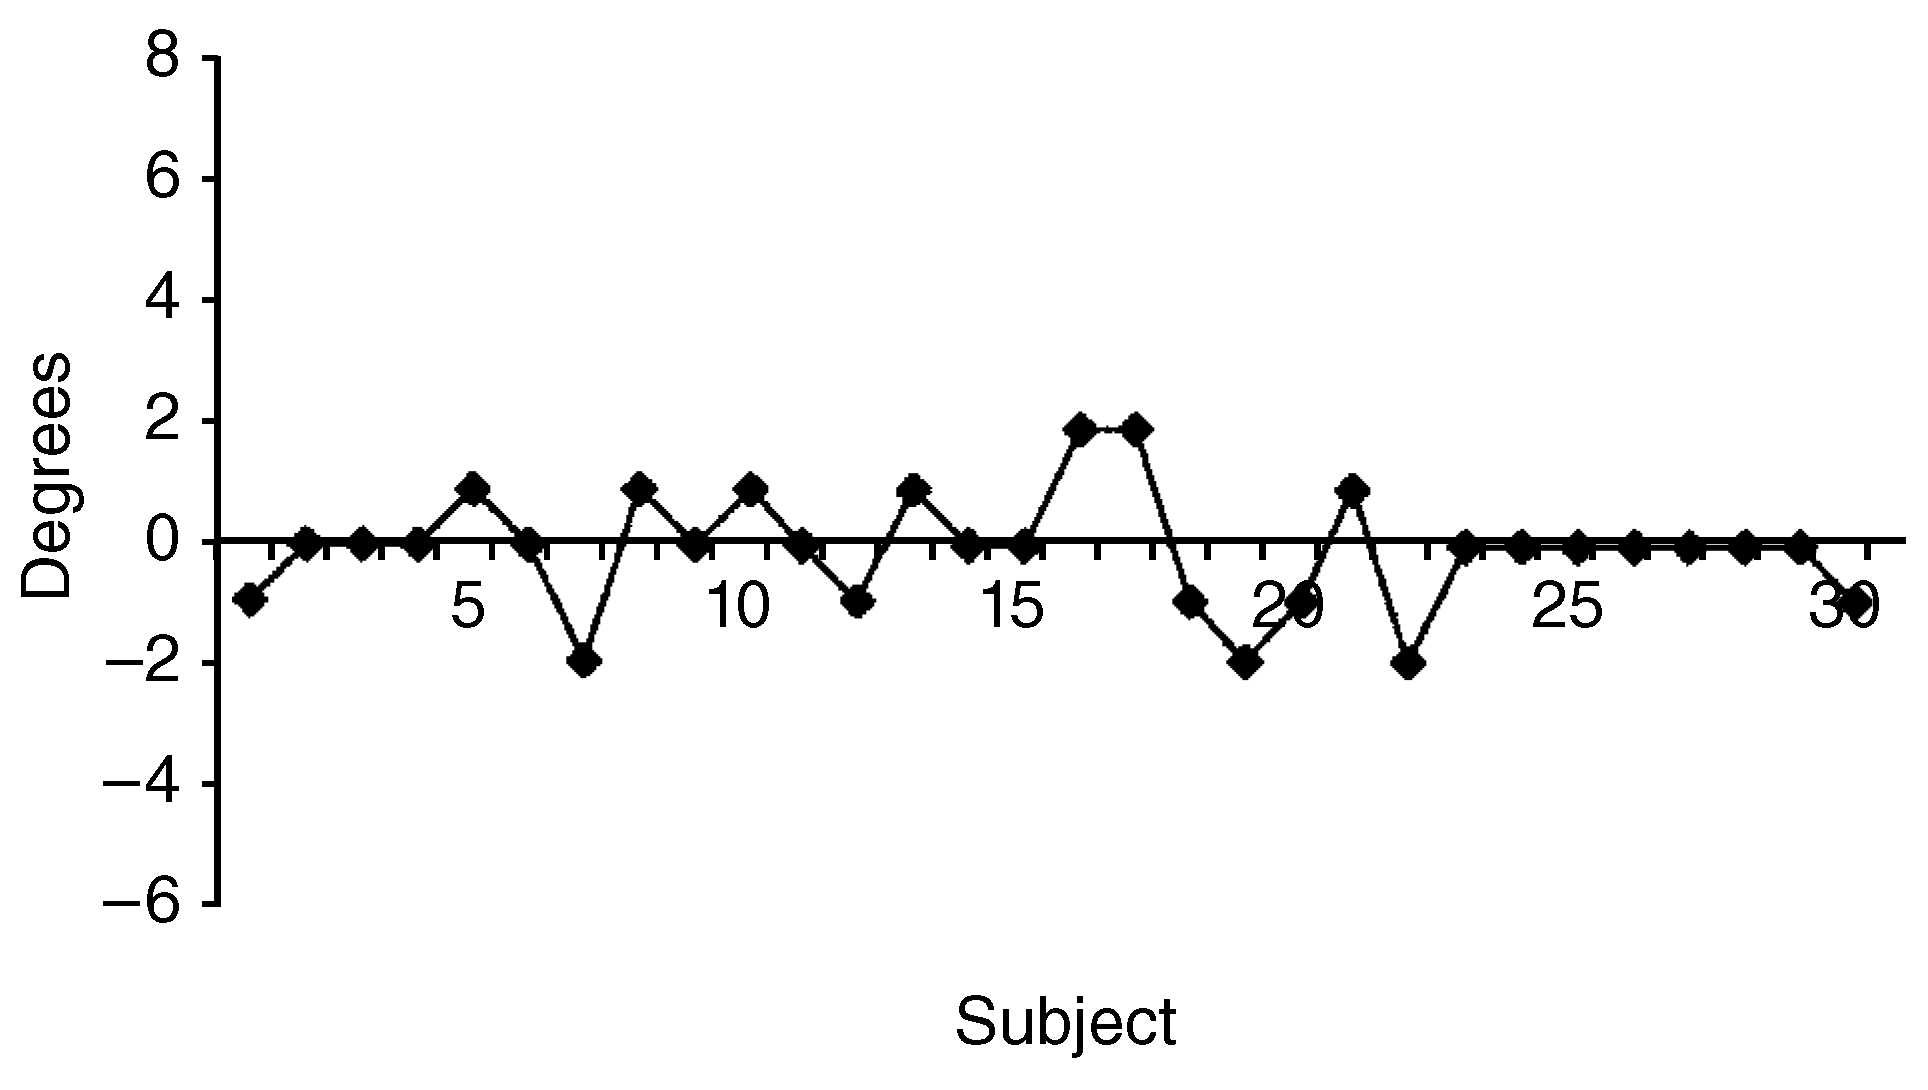
Figure 3 illustrates the measurement accuracy of rater 2 for the same variable.
Figure 1A.
Mean subtalar inversion, eversion, and
forefoot varus for all five raters. The center position of
the full error flag represents the grand mean, and the
width represents the SD of the rater means.
Figure 1A.
Mean subtalar inversion, eversion, and
forefoot varus for all five raters. The center position of
the full error flag represents the grand mean, and the
width represents the SD of the rater means.
Figure 1B.
Mean first-ray plantarflexion and dorsiflexion
and ankle dorsiflexion for all five raters. The
center position of the full error flag represents the
grand mean, and the width represents the SD of the
rater means.
Figure 1B.
Mean first-ray plantarflexion and dorsiflexion
and ankle dorsiflexion for all five raters. The
center position of the full error flag represents the
grand mean, and the width represents the SD of the
rater means.
Figure 1C.
Mean malleolar torsion and tibial varum
for all five raters. The center position of the full error
flag represents the grand mean, and the width represents
the SD of the rater means.
Figure 1C.
Mean malleolar torsion and tibial varum
for all five raters. The center position of the full error
flag represents the grand mean, and the width represents
the SD of the rater means.
Figure 1D.
Mean hip internal and external rotation for
all five raters. The center position of the full error flag
represents the grand mean, and the width represents
the SD of the rater means.
Figure 1D.
Mean hip internal and external rotation for
all five raters. The center position of the full error flag
represents the grand mean, and the width represents
the SD of the rater means.
Figure 1E.
Mean relaxed and neutral calcaneal stance
for all five raters. The center position of the full error
flag represents the grand mean, and the width represents
the SD of the rater means.
Figure 1E.
Mean relaxed and neutral calcaneal stance
for all five raters. The center position of the full error
flag represents the grand mean, and the width represents
the SD of the rater means.
Figure 2.
Differences in relaxed calcaneal stance between raters 2 and 5 for all subjects.
Figure 2.
Differences in relaxed calcaneal stance between raters 2 and 5 for all subjects.
Figure 3.
Differences in relaxed calcaneal stance between test and retest values as measured by rater 2 for all subjects.
Figure 3.
Differences in relaxed calcaneal stance between test and retest values as measured by rater 2 for all subjects.
Discussion
The means of all of the goniometric measurements for all subjects, as measured by the different raters, gives a generally positive impression (
Figure 1). All raters seemed to agree reasonably well, as the variation of the means from one rater to another stays within the limits of ±2°. The exceptions are the range of inversion, with ±3.4°, and hip mobility, with ±5°. The latter exception was expected, as the hip-mobility measurements were rounded to the nearest 5°.
However, the maximal differences between the means may easily double the SDs just mentioned. Furthermore, comparing means may obscure much larger differences between single measurements coming from one subject. This is illustrated in
Figure 2. Because one rater was a student of the other, a strong agreement between the measurements was expected. Indeed, the difference between the means was very low: 1°. However, measurement discrepancies as large as 6° between the two raters are no exception, although differences in test and retest values within the two raters rarely exceeded 2° (Fig. 3). Therefore, more powerful techniques are required to assess measurement reliability adequately.
As discussed above, the optimal method for analyzing interrater reliability is the calculation of an ICC based on a two-way repeated ANOVA design. A two-way approach is necessary for simultaneous inclusion of the ICC for intrarater reliability. Grouping all ICC results for interrater reliability (
Table 1) offers a rather low correlation profile. The ICC varies from 0.14 to 0.62. These values compare well with what appears in the literature,10, 11, 17 especially with the results of Smith-Oricchio et al,11 who found relaxed calcaneal stance, a weightbearing measurement, to be much more reliable than the nonweightbearing subtalar pronation and supination. On the practical side, however, when the qualitative interpretation scale of ICCs is used, as Landis and Koch [
25] have proposed, these reliability scores range from slight (0–0.20) to barely substantial (0.61–0.80).
If the 95% lower confidence limit is taken into account, then the reliability coefficient does not exceed 0.46. This implies that interrater reliability, at best, can be considered only moderate. This qualification applies for only a few measurements, such as relaxed calcaneal stance and forefoot varus. The bulk of the variables, which have a lower limit ranging from 0.21 to 0.40, qualify as only fair, including the hip-mobility variables, malleolar torsion, range of eversion, tibial varum, and possibly the range of inversion. The rest of the variables—ankle dorsiflexion, neutral calcaneal stance, and first-ray mobility—can be dismissed as unreliable for interrater comparison.
It is very important to understand that there is a strong bias present among the raters, as suggested by the high F ratios for interrater variance for all measured variables, which were all below the .01 level of significance. The significant
t-tests (
P < .05) in
Table 2 show that this bias is not limited to one rater but is evenly distributed over most raters and nearly all variables.
The mean of all Pearson correlation factors between the raters for every variable (
Table 1) closely resembles the ICC; thus the two tests are in basic agreement. In addition, it is reassuring to note that the results from the left and right sides parallel each other closely, which may increase the validity of the results.
It is important to realize that the low ICC for dorsiflexion and plantarflexion of the first ray may not mean that this measurement technique is clinically unreliable. Although the ICC test is popular and widely used in clinical disciplines, it often has limitations when its results are interpreted. Intraclass correlation coefficients have been demonstrated to be less reliable when the measurements in the subject sample show a limited variability [
9,
23]. First-ray mobility is an excellent example of a clinical measurement with limited variability. The ICC of first-ray mobility had the worst scores of all of the measurements and could therefore be initially rejected as being very unreliable. However, since the ICC test is not ideal for comparing variables with a small sample variation, the low ICC results for first-ray mobility are misleading; the SEM for first-ray mobility shows that it may be much more accurate than many other variables.
One benefit of using the ICC technique is that it allows the production of an SEM. The SEM allows one to differentiate real clinical changes from irrelevant fluctuations in the measurements of different raters. In other words, if measurement differences from one rater to another are less than the calculated SEM, these differences must be regarded as insignificant, and the corresponding measurements should be considered equal. Again, owing to the two-way design of the ICC approach used here, it must be realized that the interrater SEM includes the variability both among and within the raters’ measurements.
The interrater values corresponding to all measurement variables are listed in
Table 1. Since all of the measurement variables except those for tibial varum and first-ray plantarflexion exceed 2 measurement units, it becomes obvious that the differences between examiners may be clinically unacceptable. It is surprising that for calcaneal stance, the neutral position is found to be as accurate as the relaxed position, showing measurement error figures comparable to those reported in the literature [
26]. It is also quite surprising that the accuracy for the range of subtalar supination is nearly double the range for subtalar pronation, when one takes into account that both are measured with the same instrument and measurement procedure. For the forefoot varus measurement, the ICC indicates a relatively reliable variable from one rater to another; however, its SEM of nearly 4° probably restricts its clinical usefulness. On the other hand, variables with a low ICC, such as tibial varum and first-ray plantarflexion, display a low SEM and therefore higher measurement accuracy.
Full appreciation of the measurement quality involves both the ICC and the SEM. The ICC assesses reliability from one rater to another and tells how well a measurement will be replicated among raters. However, the ICC score may be difficult to translate into clinically useful terms for all measurement parameters, despite the appreciation criteria proposed by Landis and Koch.25 Additionally, the ICC suffers from the limitation that different scores can be compared only if the corresponding sample variations are comparable. Therefore, comparison of the reliability figures from different measurement variables can be problematic, as shown in the case of first-ray mobility.
The SEM, on the other hand, does not depend on sample variation and is easily interpreted by clinicians, as it expresses the accuracy range for each measurement performed by the rater and establishes a clinically relevant threshold for measurement variation. The SEM should therefore be considered the statistical variable of choice for comparing clinical measurement variables among and within raters.
When the overall results of this study are analyzed by any of the statistical methods used here, the results are quite disappointing, showing only mediocre reliability from one rater to another and unacceptably poor accuracy for nearly all biomechanical measurements investigated. This casts doubt on the validity of these measurements and suggests that more refined or even alternative measurement techniques should be developed.
Analysis of the intrarater reliability in this study shows that the ICC scores are very high for all variables, ranging from 0.72 to 0.99, and have no relation to the interrater score. These results are in agreement with those of similar studies [
5,
10,
11,
12,
15,
16,
17]. The 95% lower confidence limits for these correlation factors, however, fluctuate between much lower values, from 0.59 to 0.9, respectively. This is due to the small number of trials (two), which decreases the power of the intrarater test and thus the accuracy of the various ICCs. In addition, the low values for the SEM for intrarater evaluation (
Table 3) suggest high measurement accuracy (less than 2 measurement units), except for the hip-mobility measurement. One may thus conclude that all raters were quite internally consistent and that biomechanical measurements may be safely compared among subjects as long as the measurements are made by the same clinician and as long as retests are immediate. It must be emphasized, however, that the intratester reliability scores as calculated in the present study may not be representative of the real-world clinical setting, as clinicians rarely measure patients twice consecutively in one session.
A case could be made that the low ICC reliability resulted from the inclusion of less experienced podiatric physicians among the raters. This notion is refuted by the ICCs and, especially, the SEM scores that were calculated separately for each rater for the individual variables (
Table 3). The most favorable scores are distributed evenly over all raters and are not monopolized by the most experienced podiatric physician (rater 2). In addition, the fact that the combination of the data from the most experienced raters (raters 2 and 5) did not demonstrate the highest number of insignificant measurement differences suggests that the less experienced and more experienced podiatric physicians performed the measurements with similar reliability (
Table 2). This contrasts with the results obtained by Freeman [
22] and Bovens et al,6 but confirms the conclusion of Payne and Richardson21 that increased experience does not improve measurement reliability.
Conclusion
Statistical analysis of various measurements using the ICCs indicated that interrater reliability was generally poor except for the measurements of relaxed calcaneal stance and forefoot varus. In contrast, intrarater reliability was generally high for most of the measurements; this might have been due to the fact that the retests immediately followed the tests. The SEM was felt to be the most useful statistical parameter for practical clinical comparison of measurement variability, with the measurements of first-ray plantarflexion and tibial varum being the most accurate, though not the most reliable. No other measurement variables reached the clinically accepted accuracy limit of 2°. In addition, using both the ICC and the SEM, this study demonstrated that more experienced raters did not have significantly better intrarater reliability than less experienced raters.
This study also suggests that if one patient is seen by multiple clinicians, the clinical measurements made by the various clinicians would be unlikely to have any more than a fair correlation with one another. These findings of poor interrater reliability and poor measurement accuracy of the clinical measurements commonly used by podiatric practitioners bring into question the practical usefulness and, ultimately, the validity of these clinical measurements. This study therefore raises the question whether podiatric physicians should continue to perform these clinical measurements on their patients or replace them with other, more reliable, clinical measurements.