An accurate representation of the foot is necessary to create a foot orthosis that successfully controls abnormal lower-extremity movement and provides both stability and comfort. The fabrication of an orthosis begins with capturing the morphology of the foot by obtaining a negative impression. Both accuracy and repeatability of measurements are extremely important when producing a negative impression of the foot to obtain an effective orthosis.
The negative foot impression is obtained while the foot is locked in the subtalar neutral position. In this position, the talus and navicular are congruent; this allows the impression technique to capture forefoot varus or valgus, also known as the forefoot-to-rearfoot relationship. Deformities in foot structure are thought to lead to compensatory motion that, in turn, may lead to overuse musculoskeletal injuries and pain.[
1] It is believed that the foot impression must accurately reflect the forefoot-to-rearfoot relationship. In addition, the contour of the foot, including arch height, rearfoot width, and forefoot width, must be well represented in order to produce a comfortable orthosis that controls the movement of the foot properly.
Historically, the standard method of obtaining a negative impression of the foot has been a nonweightbearing plaster cast taken while the foot is locked in the subtalar neutral position.[
1] A plaster cast can also be obtained from a sitting partial-weightbearing position.[
2] Although both the nonweightbearing and partial-weightbearing plaster-slipper methods are commonly used, they can be messy and require a moderate level of skill to obtain an accurate representation.
In response to these issues, foam trays were developed to obtain a negative partial-weightbearing impression of the foot. This method is often used because it is quicker and requires less skill than the other alternatives. The use of foam trays eliminates the drying process required in plaster casting. Moreover, the trays are prepackaged in a ready-to-mail box, simplifying the mailing process.
More recently, an application of laser technology has been developed to obtain either a partial-weightbearing or a nonweightbearing representation of the foot. This method is quick and has the added advantage of transferring digitized images electronically to the orthotic laboratory, thereby expediting the orthotic manufacturing process. Furthermore, laser scanning of the foot eliminates a step in the manufacturing process because the plaster and foam negatives must be scanned and processed before the positive is produced.
Only one study to date has examined the results of employing different negative impression techniques. McPoil et al[
3] found a significant increase in the forefoot-to-rearfoot relationship in nonweightbearing as compared with partial-weightbearing plaster casts. No significant differences were reported between the prone and supine nonweightbearing methods. No studies to date have compared plaster casts with foam impressions or laser scanning methods, and the validity and reliability of these methods have not been previously studied.
The purposes of this study were to 1) assess differences among the four methods in measures of rearfoot width, forefoot width, forefoot-to-rearfoot relationship, and soft-tissue arch height; 2) compare the reliability of the methods by means of the four measures; and 3) compare the validity of the methods by correlating these measures with the corresponding clinical measures. It was hypothesized that both plaster casts and foam impressions would yield narrower widths owing to the compressive properties of the plaster and foam. It was expected that the angles of forefoot-to-rearfoot relationship would be smaller in the partial-weightbearing methods than in the nonweightbearing methods owing to the tendency of the forefoot to change position during partial weightbearing. Plaster casts were expected to have the highest agreement with the clinical measure of forefoot-to-rearfoot relationship, as this method closely reflects the technique used to measure forefoot-to-rearfoot relationship clinically. The nonweightbearing methods were expected to produce a greater arch height than the partial-weightbearing methods owing to the tendency of the arch to collapse slightly in partial weightbearing. The foam impressions were expected to produce the lowest reliability, secondary to the variability in the loading technique in terms of the magnitude and direction of the force application as the foot is pressed into the foam.
Materials and Methods
Subjects
Prior to data collection, a power assessment (β = .20) was performed, and it was determined that a minimum of 28 feet were needed for this study. Therefore, 30 feet from 15 subjects (12 women, 3 men) between the ages of 20 and 34 (mean [±SD], 23.8 ± 3.6 years) were used. All subjects were free of lower-extremity injuries at the time of the study. The University of Delaware Human Subjects Review Board approved all testing procedures, and informed consent was obtained from all participating subjects.
Protocol
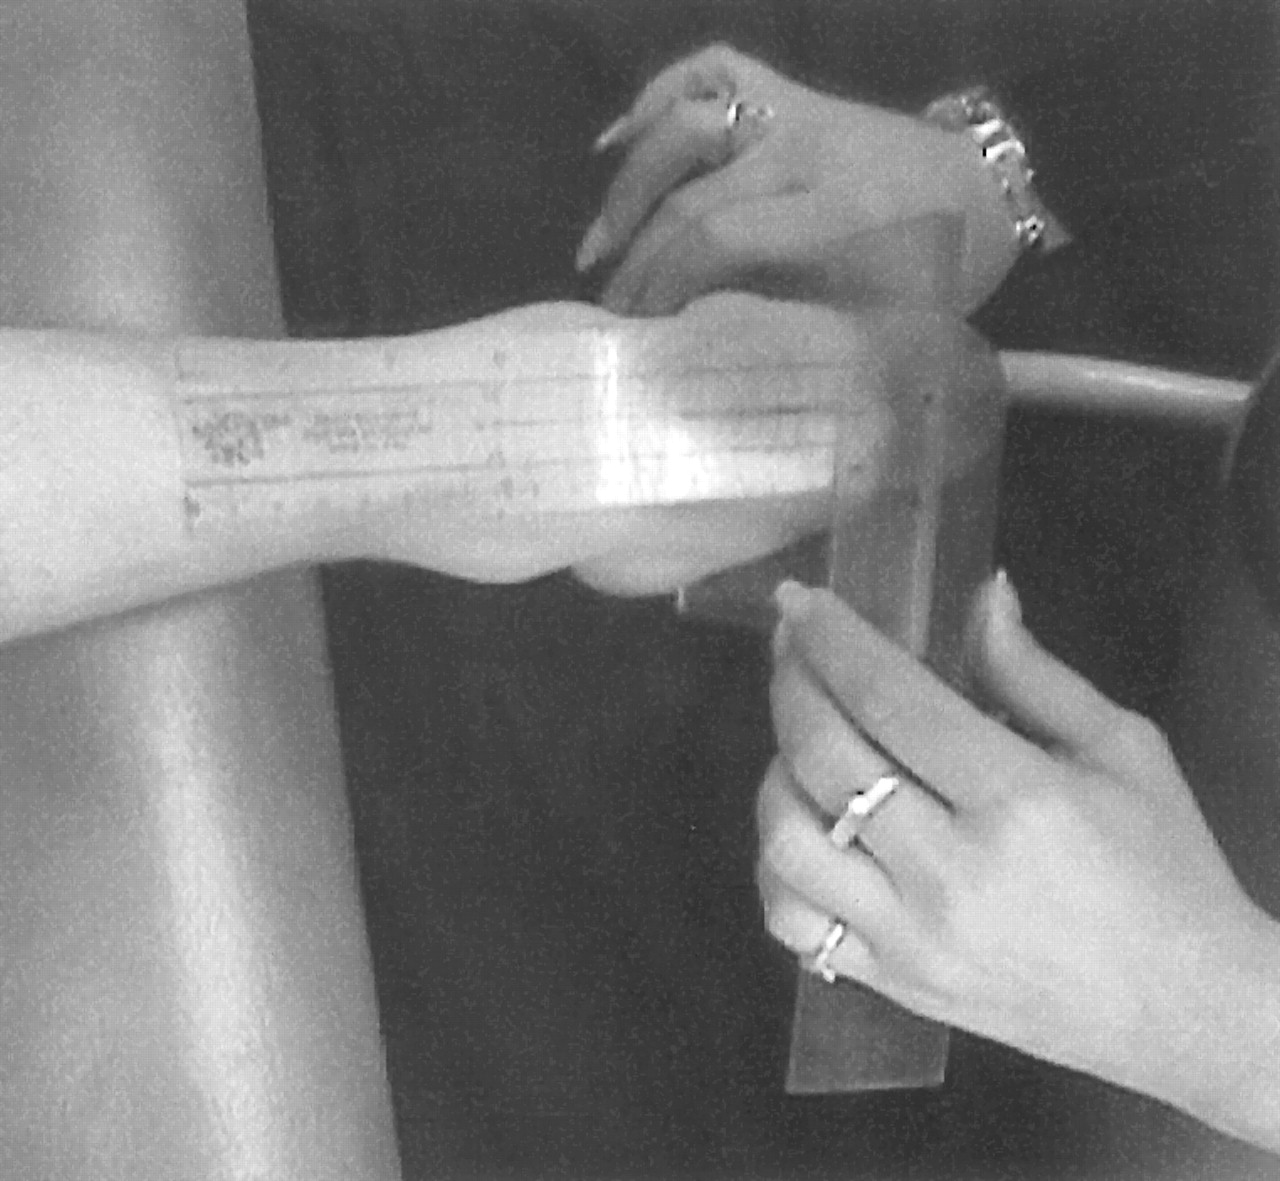
To obtain the clinical measures for the validation part of the study, the following methods were employed. The subjects were seated with the hip, knee, and ankle at 90° and both feet flat on the floor. The widest part of the forefoot and the heel were measured with a metric caliper that was precise to the nearest 0.05 mm. Then, with the subjects prone on an examination table, the calcaneal bisection was marked. While a Plexiglas (Röhm, Darmstadt, Germany) plate was maintained in even contact with the plantar surface of the metatarsal heads and heel, the midtarsal joint was loaded and the foot dorsiflexed to 90° by loading the plantar aspect of the fourth and fifth metatarsal heads and maintaining the subtalar joint in the neutral position. The forefoot-to-rearfoot relationship was measured as the angle between the bisection of the calcaneus and the plane of the metatarsal heads represented by the edge of the Plexiglas plate (
Figure 1). As the same physical therapist took all of the measures, a preliminary intratester reliability assessment was done. Measures of rearfoot width, forefoot width, forefoot-to-rearfoot relationship, and subtalar neutral were each taken three times on each of ten subjects. The intratester reliability was found to be high, with values of 0.98, 0.96, 0.96, and 0.93 for rearfoot width, forefoot width, forefoot-to-rearfoot relationship, and subtalar neutral measurements, respectively.
Figure 1
.
Measurement of the forefoot-to-rearfoot relationship. The therapist used a Plexiglas plate to define the plane of the first and fifth metatarsal heads. The forefoot-to-rearfoot relationship was measured as the angle of the Plexiglas plate to the marked calcaneal bisection.
Figure 1
.
Measurement of the forefoot-to-rearfoot relationship. The therapist used a Plexiglas plate to define the plane of the first and fifth metatarsal heads. The forefoot-to-rearfoot relationship was measured as the angle of the Plexiglas plate to the marked calcaneal bisection.
The foot was then prepared for the negative impressions. The heads of the subjects’ first and fifth metatarsals were marked with adhesive Velcro dots (Velcro USA, Inc, Manchester, New Hampshire), and the calcaneal bisection was marked with a thin strip of adhesive felt. The Velcro dots resulted in clearly outlined first and fifth metatarsal heads on the images produced from the laser scanner while the felt on the calcaneal bisection marked the bisection on the foam impressions.
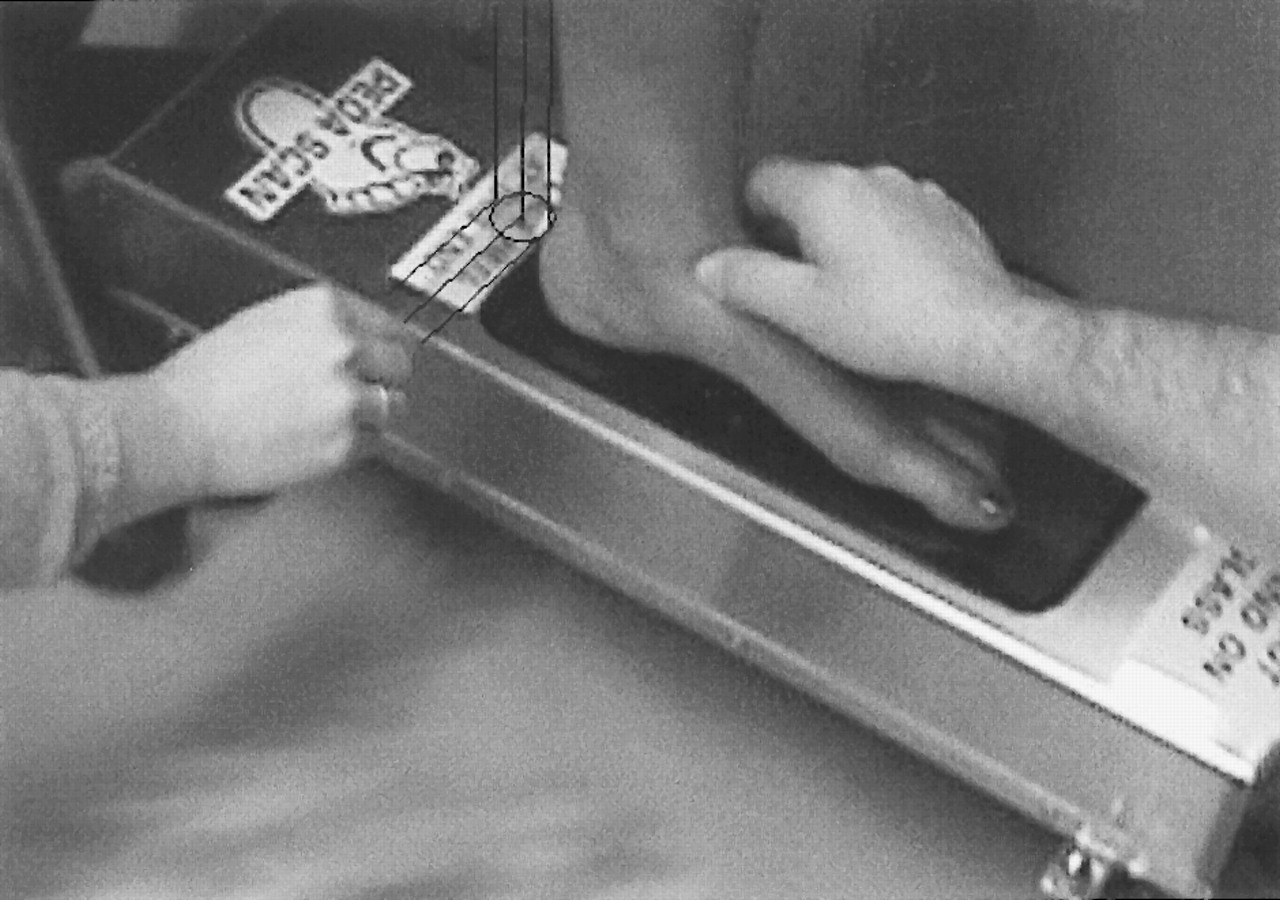
The subject was then positioned for the partial-weightbearing laser scan. The subject was seated on an adjustable stool with the trunk maintained in an erect position so that when the foot was placed on the glass of the scanner (Sharpshape, Cupertino, California), the hip, knee, and ankle were at 90°. While the subtalar joint was maintained in neutral and the lower leg was moved in the frontal plane, the calcaneal bisection was aligned perpendicularly with the plane of the scanner (
Figure 2). This position was held while the laser passed under the foot. The laser scan was then electronically transferred to a computer, and an Automated Orthotic Manufacturing System (AOMS) software program (Sharpshape) produced a three-dimensional (3-D) graphical image of the foot contour. The image was then processed to eliminate any excess noise resulting from background light. The first and fifth metatarsal heads as well as the widest points of the forefoot and rearfoot were marked with a cursor on the computer screen. This procedure was performed three times.
Figure 2
.
Partial-weightbearing laser scan. The subject’s hip, knee, and ankle were at a 90° angle while the therapist maintained the subtalar joint in neutral position and a second individual aligned the calcaneal bisection perpendicularly to the plane of the scanner using a goniometer.
Figure 2
.
Partial-weightbearing laser scan. The subject’s hip, knee, and ankle were at a 90° angle while the therapist maintained the subtalar joint in neutral position and a second individual aligned the calcaneal bisection perpendicularly to the plane of the scanner using a goniometer.
The nonweightbearing laser scan was taken with the subject in a long sitting position at the end of an examination table. The laser scanner was assembled to stand in a vertical position. The therapist maintained the subtalar joint in neutral position and loaded the fourth and fifth metatarsal heads while a second person rotated the stand so that the plane of the scanner was perpendicular to the calcaneal bisection as measured with a goniometer (
Figure 3). The forefoot was loaded just proximal to the head of the fifth metatarsal in order to dorsiflex the foot without interfering with the scanned measure of forefoot-to-rearfoot relationship. This procedure was performed three times. The images were processed with the AOMS program in the same manner as the partial-weightbearing laser scan.
Figure 3
.
Nonweightbearing laser scan. The scanner was in a vertical position and the subject was on an examination table. The therapist maintained the subtalar joint in neutral position and loaded the forefoot proximal to the head of the fifth metatarsal. A second individual aligned the calcaneal bisection perpendicularly to the plane of the scanner using a goniometer.
Figure 3
.
Nonweightbearing laser scan. The scanner was in a vertical position and the subject was on an examination table. The therapist maintained the subtalar joint in neutral position and loaded the forefoot proximal to the head of the fifth metatarsal. A second individual aligned the calcaneal bisection perpendicularly to the plane of the scanner using a goniometer.
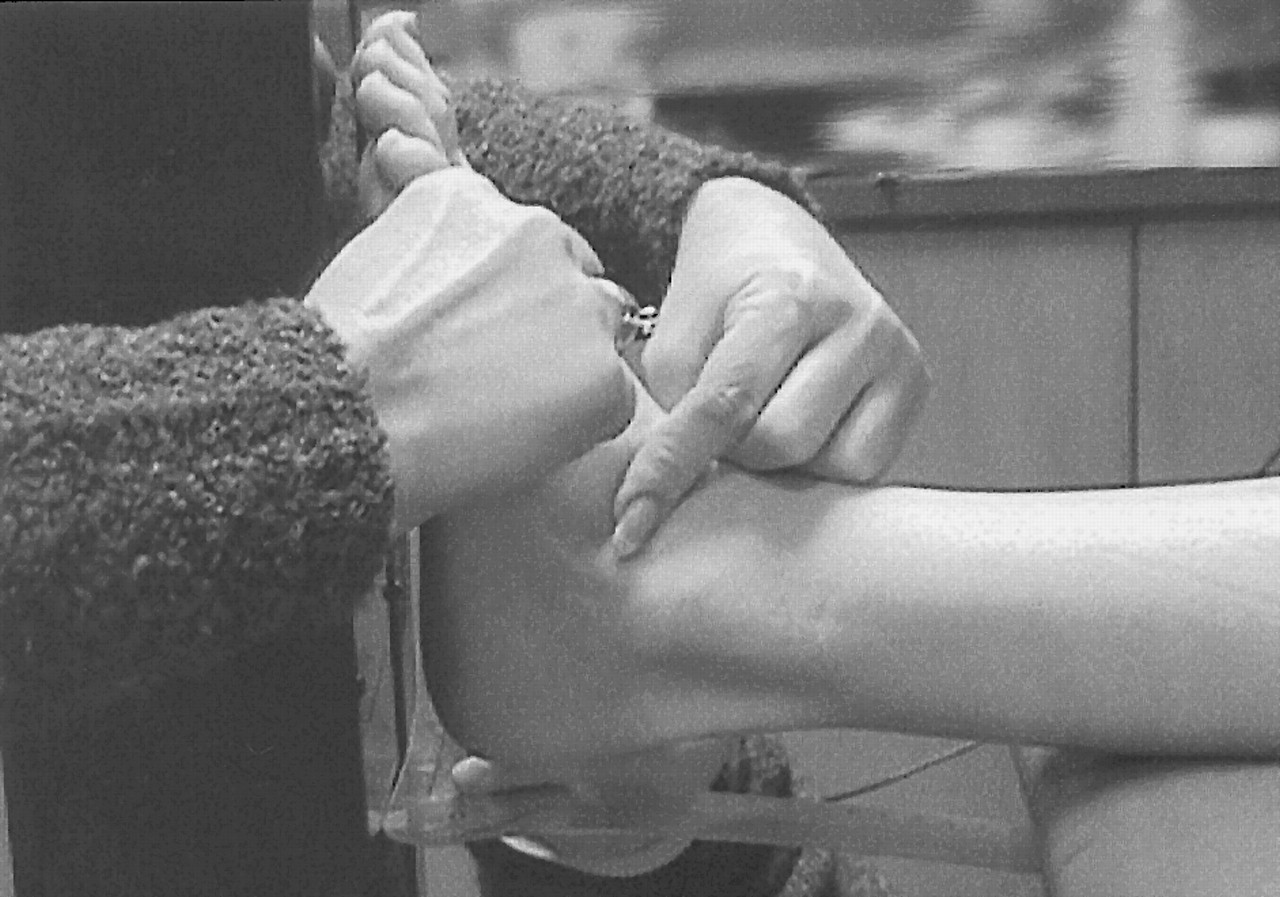
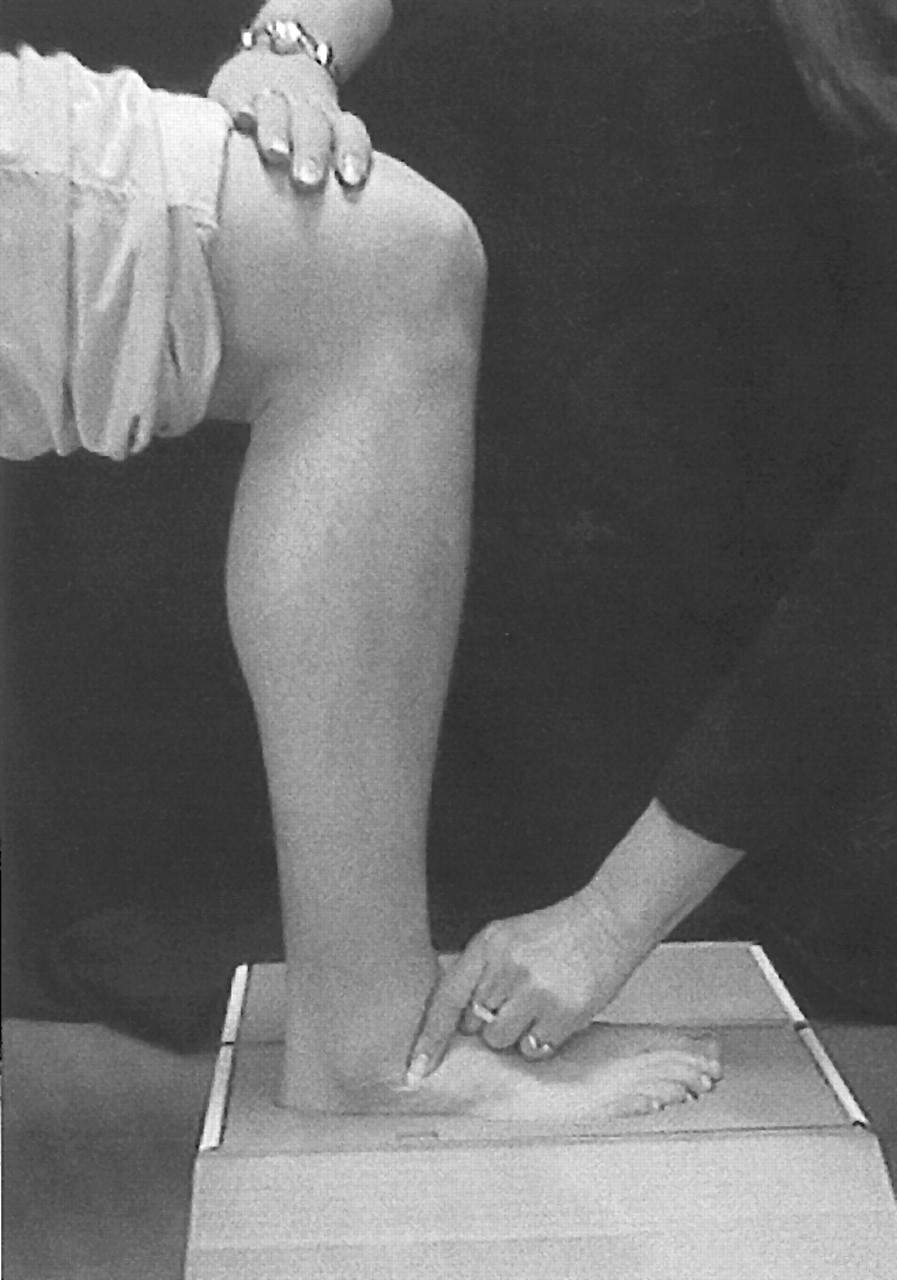
Three partial-weightbearing foam impressions (Smithers Bio-Medical Systems, Kent, Ohio) were then taken of both of the subject’s feet while the subject sat on an adjustable stool. With the hip and knee positioned at a 90° angle, the subject’s foot was placed lightly on the foam box and the neutral position of the subtalar joint was maintained with the therapist’s thumb and forefinger. While the subtalar joint position was maintained, the foot was pushed into the foam material by applying a downward force on the knee and foot (
Figure 4). The marker placed on the calcaneal bisection was impressed into the foam negatives and served as a vertical reference for the calcaneus.
Figure 4
.
Foam impressions. The subject sat with the hip, knee, and ankle at 90°. The therapist maintained the subtalar joint in neutral position while the midfoot was loaded to impress the foot into the foam block.
Figure 4
.
Foam impressions. The subject sat with the hip, knee, and ankle at 90°. The therapist maintained the subtalar joint in neutral position while the midfoot was loaded to impress the foot into the foam block.
Finally, three nonweightbearing plaster-slipper casts were taken of each foot in a subtalar neutral position with the use of 6-inch strips of extra-fast-drying plaster of Paris rolls (Johnson & Johnson, New Brunswick, New Jersey). With the subject in a prone position, the calcaneal bisection was marked with ink. Four layers of plaster of Paris splints were then applied to form a slipper cast of each foot. After the wet splints were applied snugly to the contours of the foot, the subtalar joint was palpated, the midtarsal joint was loaded by applying an upward force on the fourth and fifth metatarsal heads, and the foot was dorsiflexed to neutral. Once the cast was dry, it was removed, and the ink-marked calcaneal bisection was superimposed on the plaster negative. The same physical therapist evaluated all of the subjects and collected all of the negative impressions.
Data Analysis
The AOMS scanner and software program were used to process all of the scanned foot images, plaster casts, and foam impressions. The laser scanning system had a height resolution of 0.025 cm, a width resolution of 0.16 cm, and a length resolution of 0.25 cm.
The images of the subject’s feet from the light scans were transferred by disk into the AOMS system. The foam impression and the plaster cast negatives were then scanned by a second scanning system, also manufactured by Sharpshape. The laser passed over the top of the negative impressions secured onto a flat platform below the scanner. The placement of wedges beneath the negative impressions aligned the calcaneal bisections with the plane of the light scanner at a 90° angle. Black thumbtacks, placed at the center of the depressions made by the first and fifth metatarsal heads on the plaster casts, were picked up by the scanner and delineated the placement of the first and fifth metatarsal head cursors on the 3-D computerized image. The AOMS software turned the scanned negative foot impressions into graphical positive foot images.
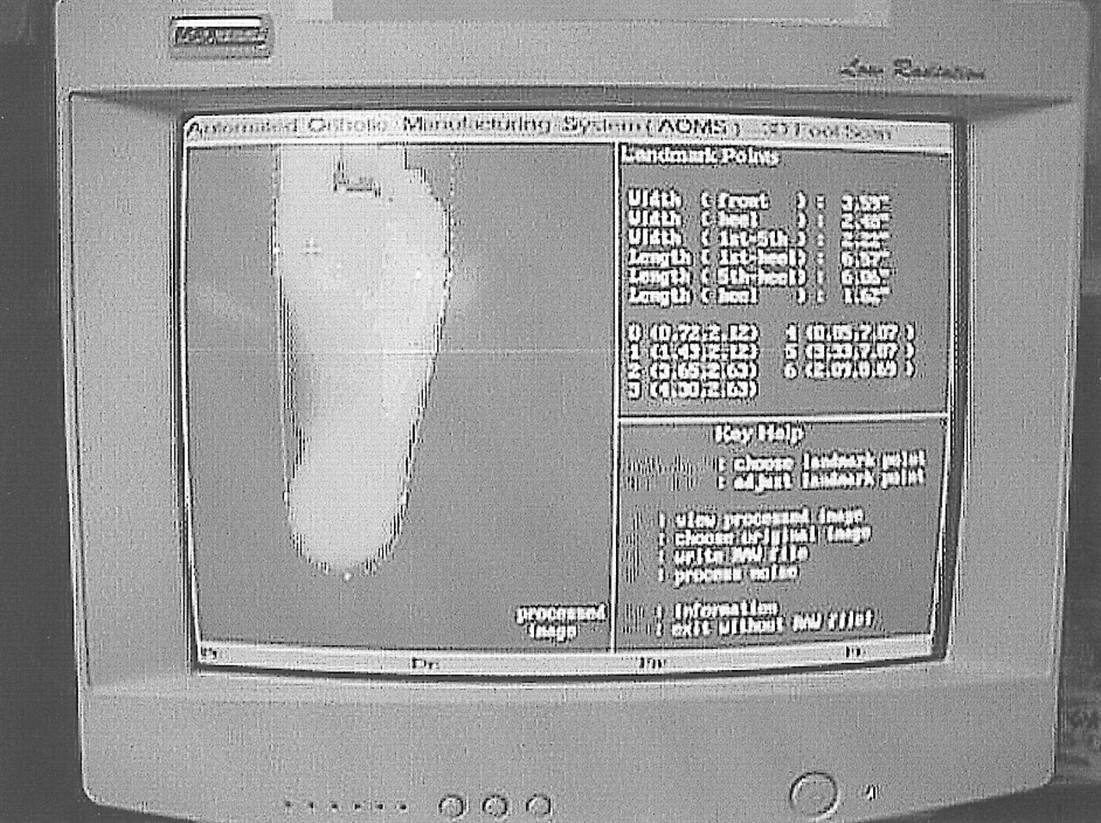
The measurements of rearfoot width, forefoot width, forefoot-to-rearfoot relationship, and arch height were obtained for all methods by means of the AOMS software program (
Figure 5). Rearfoot and forefoot widths were determined by moving cursors to the medial and lateral aspects of the foot image at the widest locations and obtaining a numerical value from the software. The forefoot-to-rearfoot relationship was determined by placing cursors on the foot image at the first and fifth metatarsal heads. This allowed the program to determine the angle of the plane of the forefoot relative to the calcaneal bisection, which was assumed to be perpendicular to the plane of the scanner. Finally, the program determined arch height as the highest soft-tissue margin of the medial arch area.
Figure 5
.
Three-dimensional computer image. Cursors were placed at the first and fifth metatarsal heads to define the plane of the forefoot. Cursors were placed on the widest points of the forefoot and the rearfoot to determine the forefoot and rearfoot widths. The measures of rearfoot width, forefoot width, forefoot-to-rearfoot relationship, and arch height were recorded from the program output.
Figure 5
.
Three-dimensional computer image. Cursors were placed at the first and fifth metatarsal heads to define the plane of the forefoot. Cursors were placed on the widest points of the forefoot and the rearfoot to determine the forefoot and rearfoot widths. The measures of rearfoot width, forefoot width, forefoot-to-rearfoot relationship, and arch height were recorded from the program output.
Statistical Analysis
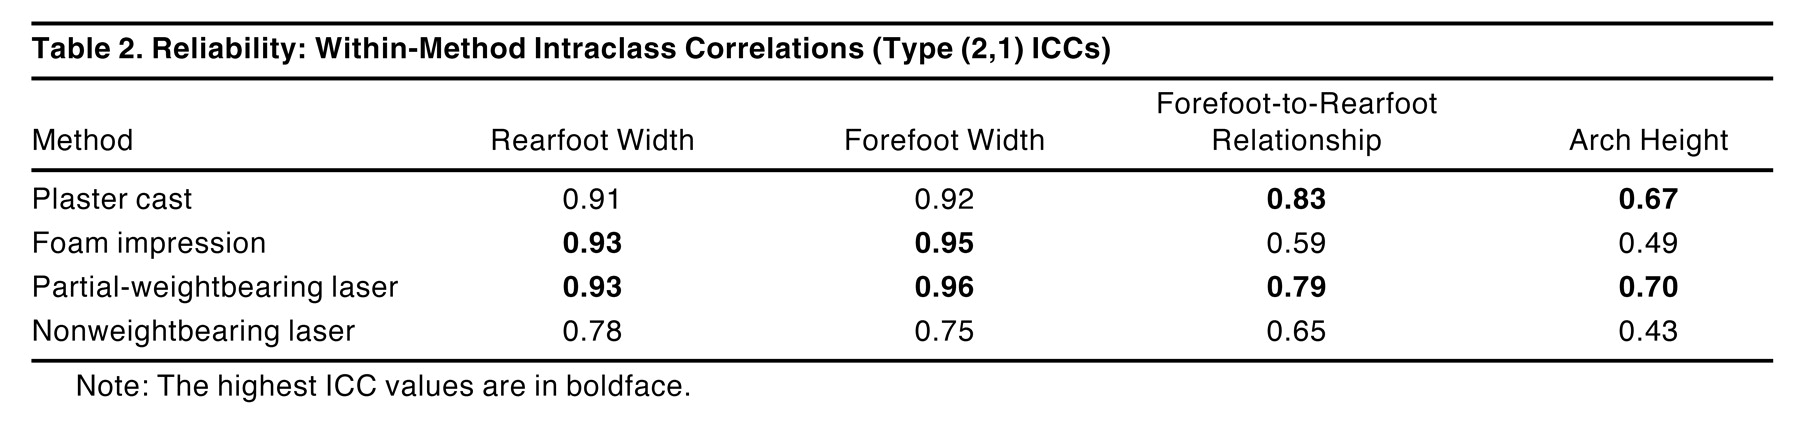
Four repeated-measures analyses of variance (ANOVAs) were performed with the use of the average of the three trials for the measures of rearfoot width, forefoot width, forefoot-to-rearfoot relationship, and arch height to determine differences among methods. To determine the reliability of each of the methods, type (2,1) intraclass correlation coefficients (ICCs)[
4] were determined for the three performances of each measure. Finally, in order to assess how closely these methods compare to the clinical measures of rearfoot width, forefoot width, and the forefoot-to-rearfoot relationship, type (2,k) ICC[
4] values were determined from the first trial of each of the three measures and the respective clinical measure.
Results
Arch Height
Statistically significant differences were found among the methods for arch height. The plaster casts and foam impressions were significantly different from both scanning methods, but not from each other. The partial-weightbearing laser scans produced significantly lower arch height measures than all other methods, while the nonweightbearing laser scan produced significantly higher arch height measures than all of the other methods (
Table 1). The difference in mean arch height between the partial-weightbearing laser scan and nonweightbearing laser scan was 1.81 cm. Arch height had the lowest reliability values of any of the measures, with the nonweightbearing laser scans having the lowest ICC, 0.43 (
Table 2).
Discussion
The average forefoot-to-rearfoot relationship measures and the average soft-tissue arch height measures obtained from the four methods examined were similar to averages reported in previous studies. Somers et al[
5] report a range of –3.0° to 4.0° for the goniometric measure of forefoot position (forefoot-to-rearfoot relationship). Average forefoot-to-rearfoot relationship measures ranging from 3.86° to 9.39° were reported in a study by McPoil et al[
3]; these are higher than those obtained in the present study. Variations among studies in measures of forefoot-to-rearfoot relationship may be attributed to differences in loading of the forefoot during the measurement. Cowan et al[
6] reported an average soft-tissue arch height of 2.6 ± 0.45 cm for a subject population of 246 US Army infantry trainees; this falls in the range of 2.05 cm to 3.86 cm for the average arch height of the four methods in the present study.
Arch Height
Plaster casting, a nonweightbearing method, produced one of the lowest arch height measures. It was hypothesized that the arch height measures would be lower for the partial-weightbearing methods owing to the natural tendency of the arch to drop when loaded.[
7] The unexpected results may be due to the increase in tension of the plantar fascia when the foot is dorsiflexed and the knee extended. The foam impressions produced a significantly greater arch height than the partial-weightbearing laser scan. In both cases, the knee was flexed and the ankle dorsiflexed, resulting in low tension in the gastrocnemius and consequently the plantar fascia. In the case of the foam impressions, however, the fascia may have been pressed upward owing to the additional upward force experienced by the foot while it was loaded into the foam block. The nonweightbearing laser scan yielded arch height measures nearly 2 cm greater than those of all other methods. As with the position for plaster casting, the ankle was dorsiflexed and the knee extended. The nonweightbearing laser method, however, required a long sitting position, which may have resulted in additional strain on the posterior muscle groups as the hamstrings were further lengthened across the hip. It was often difficult, therefore, to fully dorsiflex the foot in the long sitting position. If full dorsiflexion was not attained, the plantar fascia may not have reached full tautness, resulting in a greater arch height measure. A difference of this magnitude could significantly affect the fit and comfort of the orthosis.
Plaster casting gave a more reliable arch height measure than either foam impressions or nonweightbearing laser scanning. The manner in which the plaster is carefully pressed up into the arch may account for the high reliability of this method. The low repeatability of the arch height measure for the foam impressions is probably due to the variations in the amount and direction of force as the foot was pressed into the foam. The lower reliability of the nonweightbearing laser scan may be due to the open space between the foot and the glass of the scanning bed, which may have resulted in increased noise from background light.
Conclusion
The results from this study suggest that different methods of obtaining a representation of the foot result in different measures of foot morphology. This may affect the comfort, fit, and function of the resulting orthosis unless these differences are considered when modifying the positive mold of the foot prior to orthosis fabrication. The partial-weightbearing laser scan method reliably captures all four measures in addition to producing valid rearfoot and forefoot widths and would therefore be likely to produce an appropriate accommodative orthosis. However, when the forefoot-to-rearfoot relationship is also of importance, as in a functional orthosis, plaster casting is recommended as the most reliable and valid method.
Future studies might examine the repeatability of the scanning process itself, as this may have introduced some unexplained variability. In addition, the orthoses resulting from various techniques could be compared in terms of patient comfort and function.