Osteoarthritis (OA) of the knee is a common degenerative and chronic disease as well as a major cause of knee pain and functional disability [
1]. Knee OA is classified into two subgroups based on the affected compartment of the knee: patellofemoral OA (PFOA) and tibiofemoral OA (TFOA) [
2,
3]. The radiographic findings in patients with knee OA showed that 40% have a combined TFOA and PFOA, 24% have isolated PFOA, and 4% have isolated TFOA [
4]. The patellofemoral joint involvement often develops before the tibiofemoral joint and increases the likelihood of TFOA disease progression [
3]. The classification of the subgroup of knee OA can be defined as if the patellofemoral (PF) joint is in a more advanced stage (Stage III or IV) than the tibiofemoral (TF) joint, patients are considered to have PFOA [
4,
5]. The severity of symptoms may vary depending on which compartment is more affected [
6,
7]. Generally, clinical findings and radiologic imaging are taken into consideration when deciding which compartment is more affected [
7]. In addition to anteroposterior imaging, skyline or lateral imaging is obtained to determine the grade of PF joint degeneration. The diagnosis of PFOA was considered in patients with osteophytes detected on skyline imaging and anterior knee pain that increased especially during activities such as squatting [
8].
Patients with knee OA display several foot posture alterations, such as increased pronation of the subtalar joint, foot arch collapse, and pes planus [
9,
10,
11]. The abnormal rotation of the tibia and femur in knee OA patients is thought to be related to biomechanical changes in subtalar joint movement [
10,
11]. The mechanical alignment of the lower extremity is associated with subtalar joint movement as well as foot pressure distribution [
1,
9,
12]. One of the most important determinants of foot posture is the foot progression angle (FPA) [
10,
11]. The FPA is defined as an indicator of the toe-in or the toe-out gait depending on the weight distribution of the foot [
10]. The FPA has found to be associated with the knee adduction moment during gait in patients with knee OA [
13]. Simic et al [
14]. found that the FPA is lower in knee OA patients when compared to healthy subjects. Therefore, determining the FPA would improve the knowledge of the foot posture in patients with knee OA.
Therefore, the purpose of this study is to investigate the differences in plantar loading distribution and functional levels between PFOA and TFOA patients and compare them with those of healthy individuals. It is hypothesized that 1) considering the biomechanical factors and loading responses of the affected knee compartments, the FPA would differ among PFOA, TFOA, and healthy individuals; 2) the plantar pressure distribution of the foot would differ among PFOA and TFOA groups; and 3) the functional level would be lower in PFOA patients compared to TFOA patients.
Materials and Methods
Study Design
The comparative cross-sectional study was approved by the Clinical research ethics board of Hacettepe University, Ankara, Turkey. Written informed consent was obtained from all patients, and all procedures were in accordance with the Declaration of Helsinki. The data were obtained between March 2020 and May 2021. A priori sample size calculation was conducted with G*Power 3.1.9.2 (Franz Faul, University of Kiel, Kiel, Germany). The FPA was determined as our primary outcome, and a sample size of at least 30 individuals was found to have the power of 0.80, an effect size of 0.40, and an alpha value of 0.05.
Individuals
Patients with knee OA were divided into two groups based on the most affected knee joint, as determined by Kellgren Lawrence (KL) scores. Patients with a KL grade of 2 or 3 in the patellofemoral joint were included in the PFOA group (n = 31, mean ± SD age 47.5 ± 10.5 years, mean ± SD body mass index (BMI) = 27.5 ± 3.6 kg/m
2), while those with KL grade of 2 or 3 in the tibiofemoral joint were included in the TFOA group (n = 29, mean ± SD age 55.9 ± 12.2 years, mean ± SD BMI = 28.3 ± 4.1 kg/m
2) [
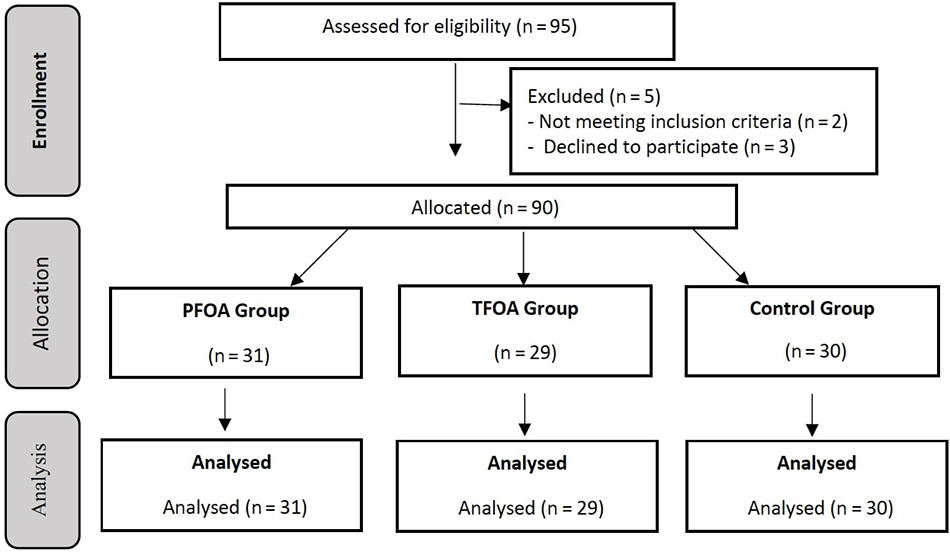
17]. The main enrollment criteria were as follows: if the patellofemoral joint was more advanced than the tibiofemoral joint, the patients were assigned to the PFOA group; if the tibiofemoral joint was more advanced than the patellofemoral joint, the patients were assigned to the TFOA group (
Fig. 1).
Figure 1.
Flow chart of the study.
Figure 1.
Flow chart of the study.
A single consultant physician scored the radiographic views of the knee according to the KL scoring system. Three radiographic images (a semi-flexed, weightbearing anterioposterior view; a side view; and a horizon line view) were obtained for each individual in order to determine the effected compartment and the level of knee OA [
17]. The KL scoring was based on the following criteria: Grade 0: no osteophytes; Grade 1: doubtful osteophytes (<1 mm); Grade 2: minimal osteophytes, possibly with joint space narrowing, cysts, and sclerosis; Grade 3: moderate or definite osteophytes and or moderate joint space narrowing; and Grade 4: large osteophytes and/or severe joint space narrowing [
18]. Tibiofemoral osteoarthritis was defined as the patient had a KL score more than 2 in the TF compartment as well as a KL score less than 2 in the PF compartment in anteroposterior view [
19,
20]. Patellofemoral osteoarthritis was defined as the patient had a KL score more than 2 in the PF compartment and a KL score less than 2 in the TF compartment on the horizon and/or side radiographic views. The scoring was repeated three times anonymously in 30 patients. The intrarater reliability for grading TF joint and PF joint OA was ranged between 0.80 to 0.86.
The inclusion criteria for patients with knee OA were as follows: 1) age of at least 40 years; 2) knee pain in the previous 3 months; and 3) living independently and had no exercise habits [
4]. Additional inclusion criteria for patients with PFOA were based on the clinical diagnosis of PFOA: pain reproduced with stair climbing, kneeling, prolonged sitting, or squatting; lateral or medial patellar facet tenderness on palpation or a positive patellar compression test; and knee stiffness after sitting for more than 30 minutes. The exclusion criteria for knee OA patients were having knee injections 3 months before the assessments; BMI higher than 35 kg/m
2; knee or hip surgery; a history of inflammatory rheumatic disease; conditions that cause secondary OA such as trauma, congenital or developmental diseases, metabolic diseases, and endocrine diseases.
Thirty healthy groups (mean ± SD age 55.2 ± 7.5 years, mean ± BMI 25.5±4.1 kg/m2) who were age- and BMI-matched were included as the control group. The inclusion criteria for the control group were 1) age 40 to 50 years, 2) living independently, 3) had no exercise habits, and 4) had no reported history of knee pain. The control group was excluded if they had a knee or lower-extremity injury or surgery, pain around the knee, or a KL grade of less than 1 in all compartments.
Measurements
Sociodemographic variables and comorbidities were recorded. The current weight in kilograms and height in centimeters were measured. Body mass index was calculated as weight in kilograms divided by the height in meters squared. The use of orthoses was questioned.
Pedobarographic Analysis
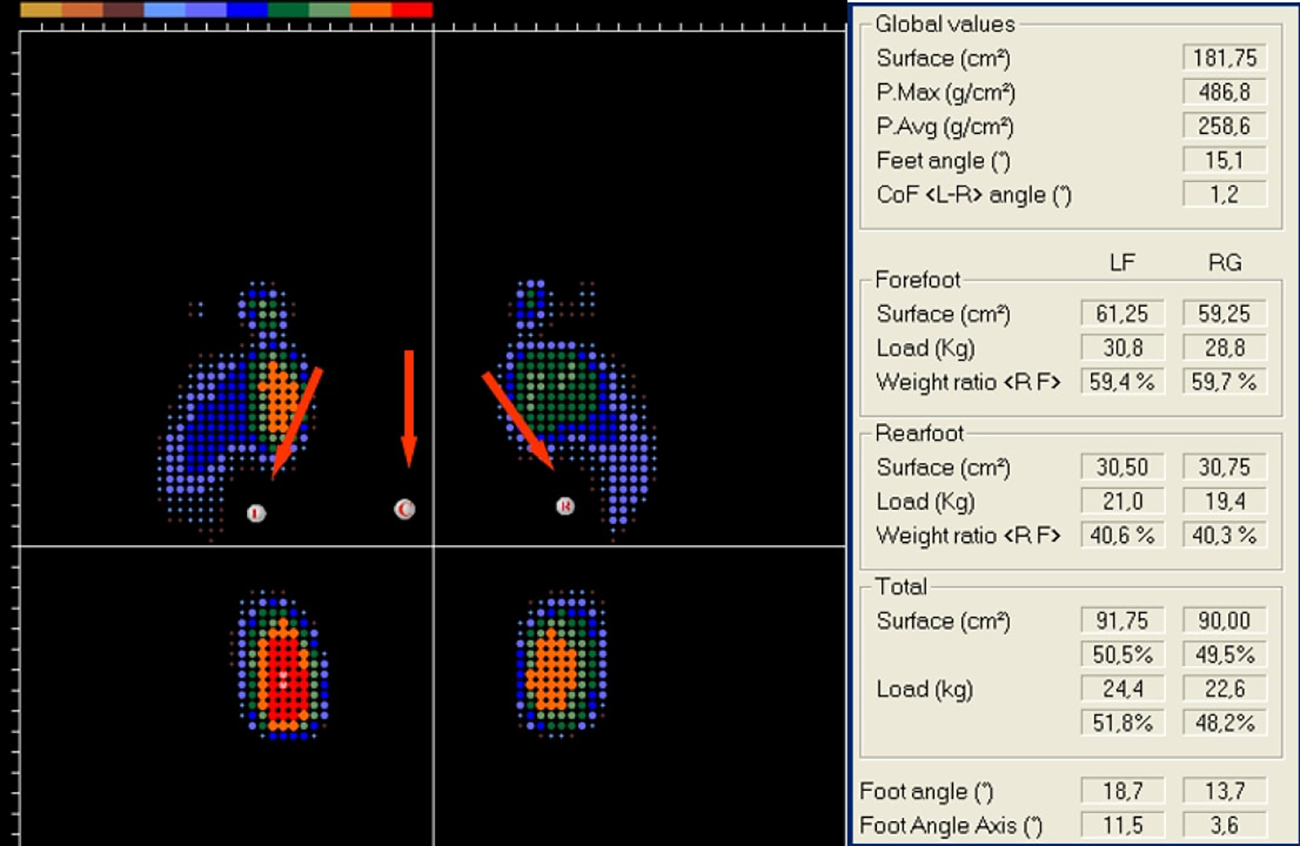
Pedobarographic analysis and plantar pressure distribution were performed by the Digital Biometric Images Scanning System and relevant Milletrix software (Diagnostic Support; Diasu Health Technologies, Rome, Italy). The platform was made up of a walkway measuring 5 m in length and 40 cm in width, with 4,024 sensors sampling data at a frequency of 300 MHz. The force platform measures plantar pressure on the right and left foot during standing, and the platform expresses the average percentage pressure distribution of each foot. Individuals were asked to stand barefoot on the platform for 10 seconds in a position where they looked straight at a reference point and felt comfortable with their arms extended at the sides of their trunk. During the measurements, the patients were asked not to control their posture.
The static evaluation provided information on numerical surface and loading values, both globally (for each foot) and partially (relative to the rearfoot, midfoot, and forefoot). The maximum foot pressure (FP
max), forefoot weight ratio, rearfoot weight ratio, total load on the foot, and FPA of the individuals were recorded (
Fig. 2) [
21]. The pedobarographic outcomes of the related knee in patients with unilateral involvement and the most painful knee in patients with bilateral involvement were compared with matched knees of healthy controls.
Figure 2.
Pedobarographic analysis.
Figure 2.
Pedobarographic analysis.
Pain Severity
The Visual Analogue Scale (VAS) was used to assess the severity of pain during activity. The 10-cm horizontal line ranged from 0 (“no pain”) to 10 (“very severe pain”), and the patient was asked to indicate their pain level by drawing a line. Then this line was measured and recorded in centimeters [
9].
Self-Rated Functional Level
The Western Ontario and McMaster Universities Osteoarthritis Index (WOMAC) was used to assess self-rated physical functional levels. The three WOMAC subscales of pain, physical function, and stiffness were calculated separately, and a total WOMAC score was recorded. The total score ranges from 0 to 100 points, and a low score indicates good health [
22].
Statistical Analysis
The statistical analysis was performed using the SPSS statistics software package (version 23.0, SPSS Inc, Chicago, Illinois). The normality of the distribution of the data was assessed with visual and analytical methods using histograms, Q-Q plots, and Kolmogorov Smirnov tests. The affected side of the patients and the matched side of the controls were used for the analysis. The pedobarographic data were normally distributed except for the total load of the foot. A one-way ANOVA test was used for the comparison of the pedobarographic data among groups. The Levene test was used to assess the homogeneity of the variances. When there was an overall significance, the pairwise post hoc tests were performed using Tukey’s test. A Kruskal Wallis test was used for the total load on the foot. The WOMAC scores and pain levels of knee OA patients were not normally distributed; therefore, the Mann Whitney U test was used to compare the differences between the PFOA and TFOA groups. An overall P value of less than .05 was considered to show a statistically significant result.
Results
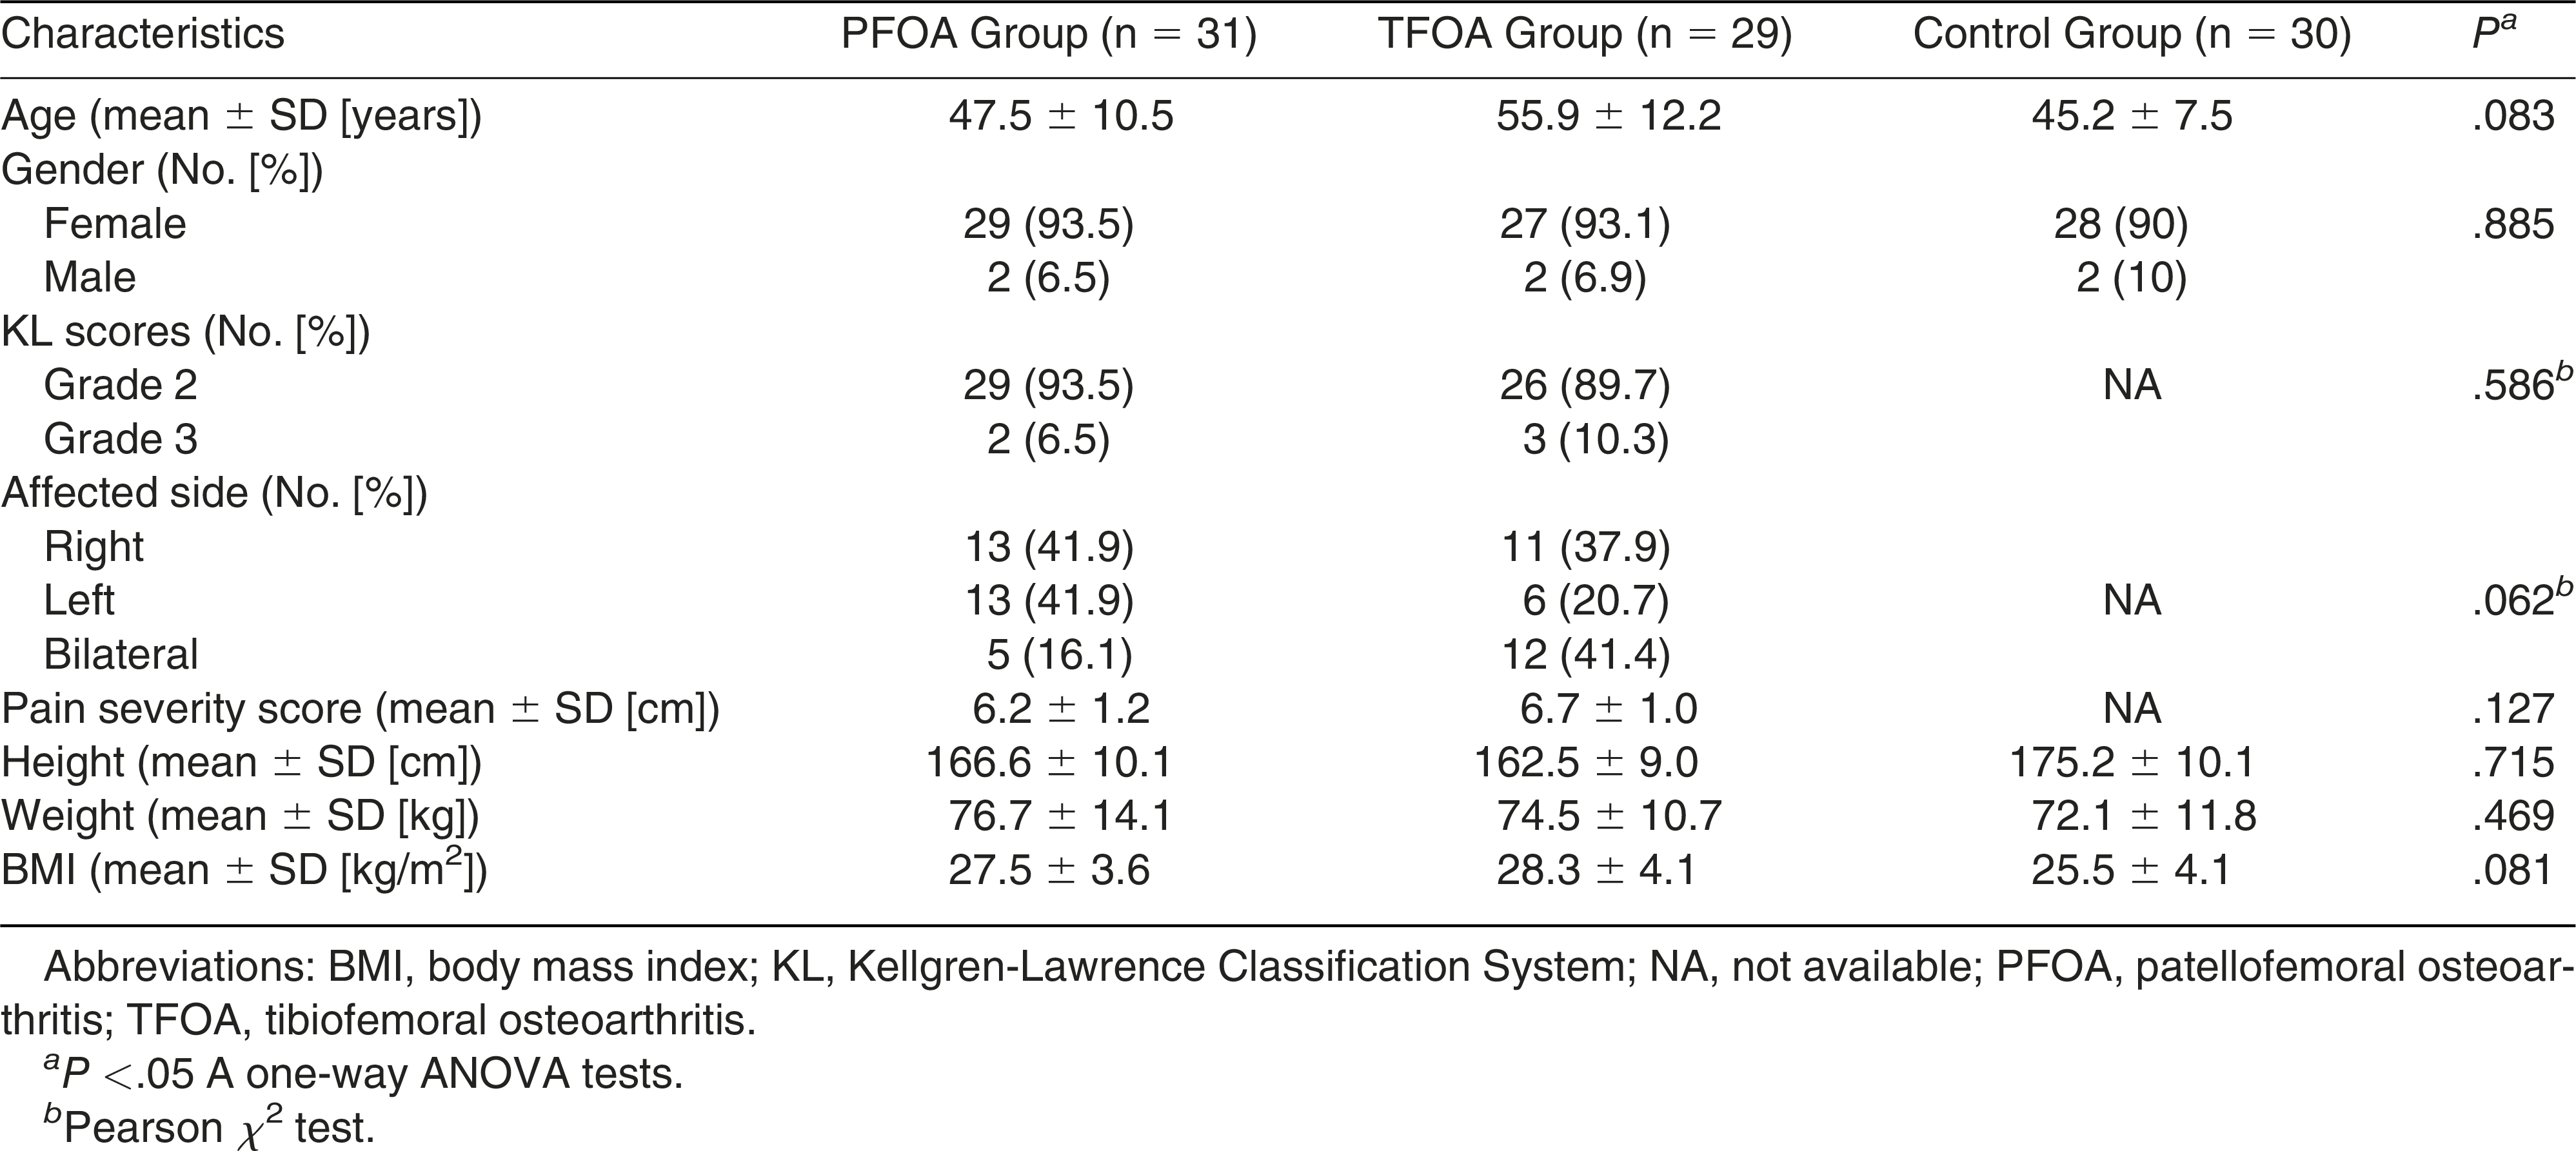
The demographic and clinical characteristics were similar among groups (
P > .05). None of the individuals were using orthosis or insoles or had lower extremity-related comorbidities. The pain severity was comparable between the PFOA and TFOA groups (
P = .127) (
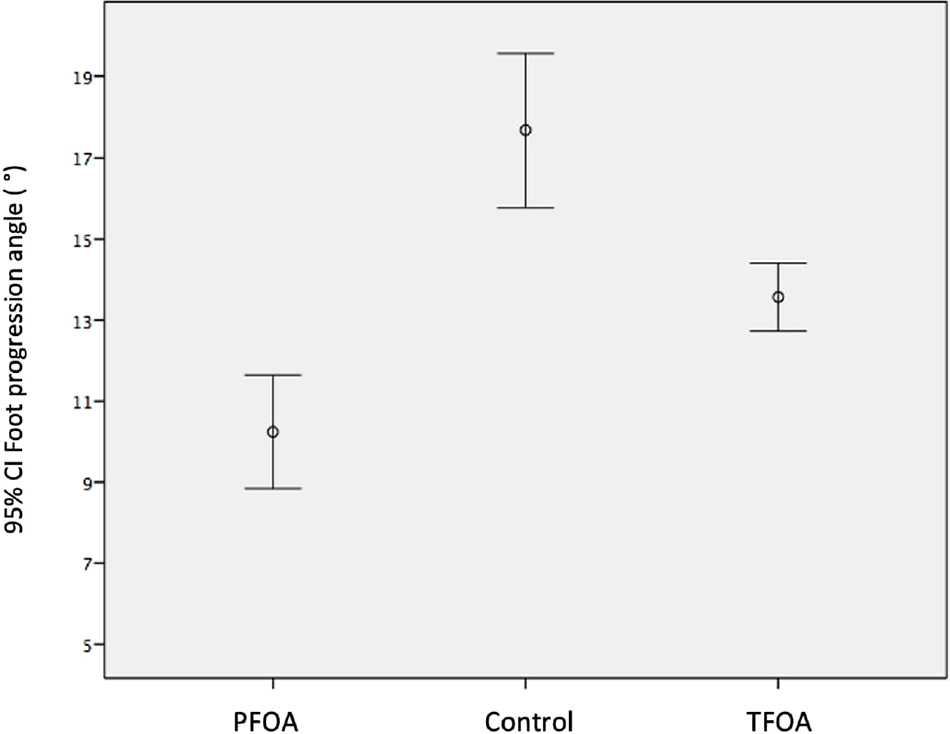
Table 1). The pedobarographic analysis results indicated a significant difference in FPA (F
(2,79) = 22.322,
P < .001) among the groups. The post hoc analysis showed that FPA was lower in the PFOA group compared to the TFOA group (
P < .001). Both the PFOA and TFOA groups had lower FPA compared to the control group (
P = .005) (
Fig. 3). No significant differences were found in FP
max (
P = .457), forefoot weight ratio (
P = .183), or total load on the foot (
P = .226) among three groups.
Table 1.
Demographic and Clinical Characteristics of the Patients and Healthy Individuals
Table 1.
Demographic and Clinical Characteristics of the Patients and Healthy Individuals
Figure 3.
The foot progression angle among the groups.
Figure 3.
The foot progression angle among the groups.
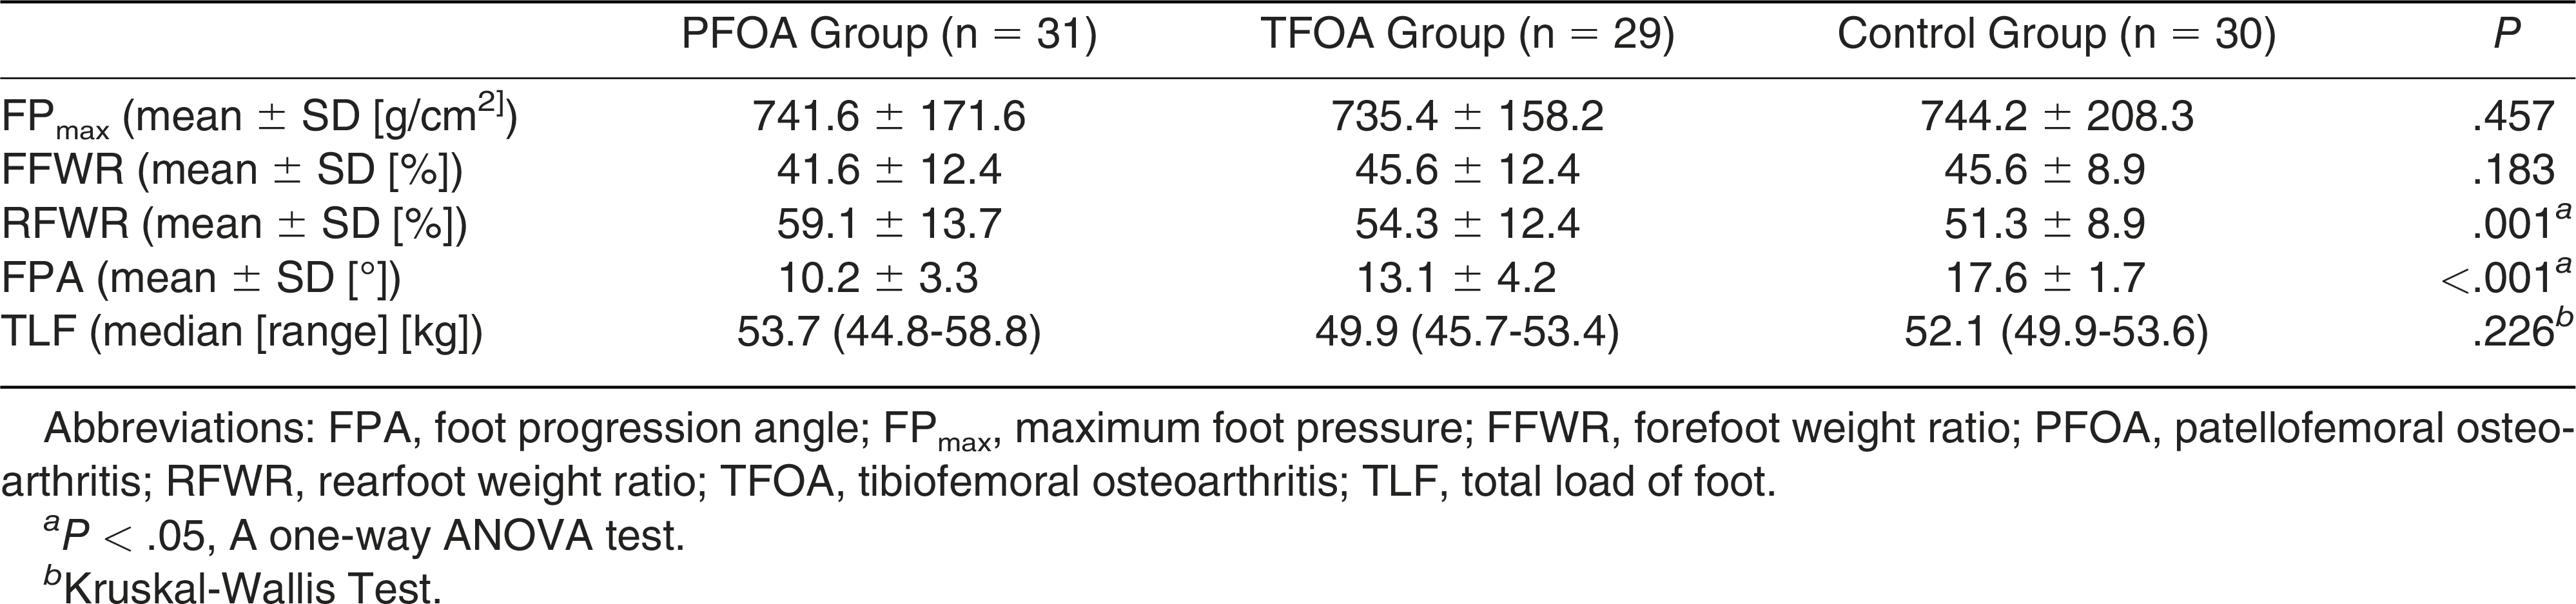
There were significant differences in the rearfoot weight ratio (F
(2,77) = 7.694,
P = .001) among groups. Both the PFOA and TFOA groups had higher rearfoot weight ratio compared to the control group (
P < .05). The post hoc analysis revealed that the rearfoot weight ratio was higher in the PFOA group compared to the TFOA group (
P < .05) (
Table 2).
Table 2.
Comparison of the Plantar Loading Distribution Among the Groups
Table 2.
Comparison of the Plantar Loading Distribution Among the Groups
There were no differences in the WOMAC total score and subscales such as pain, stiffness, and physical function between the PFAO and TFAO groups (
P > .05) (
Table 3).
Discussion
The principal finding of the present study was that the plantar loading distribution, especially FPA and rearfoot loading, differs in subgroups of knee OA. The present study provided evidence that the patients with PFOA had a lower FPA and a higher rearfoot loading than did patients with TFOA and healthy individuals. Also, functional level and pain severity were found to be similar in PFOA and TFOA patients.
Previous studies indicated that foot posture alterations have been observed in individuals with knee OA [
6,
23,
25]. Levinger et al [
11]. found that subtalar pronation was higher in OA patients compared to healthy subjects. The authors indicated that the higher foot pronation was attributable to a higher varus moment in the medial compartment of knee OA, but they did not explain the cause-and-effect relationship between foot pronation and knee OA. Reilly et al [
26]. found higher calcaneal eversion in TFOA patients compared to healthy individuals. The authors emphasized that hindfoot pronation would be a foot posture adaptation in TFOA patients. In another study, Reilly et al [
27]. found higher foot posture index scores in knee OA patients, which indicated increased prone foot posture compared to healthy individuals. Abourazzak et al [
25]. indicated that a higher pronation of the foot was associated with medial knee OA. The common conclusion of the aforementioned studies was that the patients with knee OA would develop a pronated foot posture during functional activities to move the center of pressure laterally, thus decreasing the load on the medial compartment [
6,
23,
24,
25]. Consistent with the previous study, the present study found that knee OA patients had a lower FPA and higher rearfoot loading compared to healthy individuals. Different from the previous studies, the present study found differences in FPA and plantar load distribution between PFOA and TFOA patients. The PFOA group had the lowest FPA and the highest rearfoot loading compared to TFOA patients and healthy individuals. A possible reason for this result is the biomechanical differences between the affected compartments of the knee. Compensation may be greater in PFOA due to the greater amount of degeneration seen. Therefore, more load may have been placed on the hindfoot than in the TFOA group, to compensate for the varus deformity seen in the knee.
The FPA is one of the most important parameters that shows the plantar load distribution and foot orientation in the transverse plane and is related to several indicators of mechanical stress on the lower limb, such as the knee adduction moment and foot pressure distribution [
28,
29]. Cho et al [
23]. indicated that increased FPA led to decreased knee adduction moments in patients with knee OA. Simic et al [
14]. found that a decrease in FPA resulted in a decrease in the knee extensor moment by an average of 16.2% in patients with medial knee OA. The present study results revealed that FPA was lower in both PFOA and TFOA groups when compared to healthy controls. Consistent with the results of the study by Simic et al, [
14]. a decrease in FPA may be a biomechanical adaptation to alter the knee extensor moment in patients with PFOA. Tan et al [
15]. demonstrated a more pronated foot posture, a lower weightbearing ankle dorsiflexion range of motion, and greater midfoot mobility in patients with PFOA. Wyndow et al [
30]. found similar results to those of Tan et al, [
15]. and the authors indicated that these findings were similar to those of individuals with patellofemoral pain (PFP) due to the biomechanical relationship between the foot and lower limb joints. Foot pronation causes a decrease in PF joint contact area or an increase in PF joint reaction forces due to internal tibial and femoral rotation [
31]. The present study showed that the rearfoot weight ratio was higher in the PFOA group. It is possible that an increase in the compressive forces in the PF joint with the loading on the medial knee may increase the load on the hindfoot. It is known that altered hindfoot biomechanics in patients with knee OA will be a compensatory response to varus alignment [
9].
Patients with patellofemoral osteoarthritis have changed the alignment of the lower extremity and increased loading in the PF compartment [
30]. The lower FPA of patients with PFOA suggests that the affected compartment is more severely affected than that of patients with TFOA. Negative values indicated a toe-out foot position, which directs the ground reaction force to the center of the knee, lowering the knee adductor moment [
32]. Farrokhi et al [
33]. focused on sagittal plane biomechanics and reported that individuals with TFOA and severe PFOA had reduced knee flexion excursions and increased peak single-leg stance knee flexion moments relative to those with isolated TFOA during over-ground walking. The smaller FPA may be due to an adaptation that individuals with PFOA have developed to reduce pain. On the other hand, Iijima et al [
20]. investigated the clinical impact of coexisting PFOA and found that PFOA was associated with a higher Japanese Knee Osteoarthritis Measure pain subcategory. However, they also reported that patients experienced knee pain while ascending and descending stairs. Similarly, Farrokhi et al [
33]. stated that there is an association between clinical symptoms in PF disease and a high PF joint reaction force, particularly while using stairs. These patients reported pain more often during stair activity than while standing. Another explanation for this compensation could be that patients with PFOA tend to increase knee extension in the standing position in order to feel less pain. With this knee extension, the knee becomes less unstable, the weight is pulled back onto the heels, and the rear foot is supinated, which reduces FPA. Tan et al [
34]. suggested foot orthoses for managing pain, better biomechanical and functional outcomes in PFOA, and a similar treatment option with PFP. According to a systematic review of the efficacy of foot orthoses, although the effect of lateral wedges on pain and functional outcomes is controversial, they provide favorable knee loading conditions that may influence long-term disease progression [
35]. The present study results may help clinicians determine treatment decisions regarding foot orthoses in patients with PFOA.
Studies on static foot pressure distribution in patients with knee OA were limited [
1,
12]. Kul-Panza et al [
1]. showed that in patients with knee OA, hindfoot pressure during standing was lower than in healthy individuals. According to the authors, patients with knee OA develop a compensatory foot posture to alleviate pain, particularly during the stance phase of walking and standing in static posture. Kamenaga et al [
12]. showed that patients with knee OA had more lateralized forefoot and rearfoot pressure distribution. In the present study, the rearfoot loading was higher in the PFOA group than in the TFOA group and healthy controls, but the forefoot ratio was similar in both groups. We think that the increased rearfoot loading is a compensatory response to avoid PF joint reaction force as a response to PF compartment degeneration in patients with PFOA. Therefore, the ratio of forefoot pressure would shift to the hindfoot in these patients. In addition, the decrease in FPA in these patients would cause the unchanged forefoot loading.
The lower extremity acts as a linked kinetic chain, and the alterations in any part of this chain would have a great impact on the force distribution throughout the extremity [
36]. The foot is the first point to receive ground forces and contact between the ground and the body; it plays a crucial role in transferring ground reaction forces to the knee. Alterations in the foot may affect the proximal joint and create a modifying effect on the moment around the lower extremity and may have caused differences not only in static activity but also in dynamic activity [
37,
38]. Prior research has shown that during the gait cycle, abnormal mechanical loading across the knee is linked to knee OA in the medial compartment. Willson et al [
39]. noted a proposed link between patellofemoral pain and increased foot pronation, with the idea that excessive or prolonged pronation may result in increased internal rotation of the tibia and femur during the gait cycle. This could lead to a decrease in patellofemoral contact area and an increase in lateral patellofemoral joint stress. Farrokhi et al [
33]. found that patients in the PFOA group who had severe degeneration on the PF compartment exhibited a lower knee flexion angle standing position and had higher external knee flexion moments during the single-leg stance phase of gai as compared to healthy controls. Although there are many studies in the literature examining the gait of individuals with OA, no consensus has been reached [
20,
33,
39]. Although our study is a static evaluation, we predict that understanding the relationship between the foot and the knee will enlighten the interpretation of gait in individuals with knee OA.
Studies have shown that patients with combined TFOA and PFOA experience more pain compared to those with isolated TFOA. As PF joint degeneration progresses, pain and WOMAC scores increase, and stair-climbing activities become more challenging [
33,
40]. In the present study, pain and WOMAC scores were similar between the PFOA and TFOA groups. The results of the present study revealed that functional activities and symptoms in the subgroups of knee OA were comparable. These similar results between the TFOA and PFOA could be related to the homogeneity of the groups in the present study such as radiographic grade and demographic, clinical, and cultural characteristics.
Our study had several limitations. Firstly, the foot load distribution was evaluated in a static posture instead of a dynamic plantar pressure distribution during gait. However, because studies on static plantar pressure distribution in knee OA are limited, the present study provides important evidence about PFOA and TFOA patients. Further studies are required to determine the kinetic and kinematic results of the lower extremity in a biomechanical framework. Secondly, the present study was a cross-sectional study; therefore, a long-term follow-up of patients with knee OA may help to determine the differences between the compartments. Thirdly, the lower-extremity adaptations and biomechanical impairments in patients with PFOA and PFP would be similar, so age-related differences should be considered as the populations in which these diseases are seen are different.
In conclusion, plantar loading distribution differs between subgroups of knee osteoarthritis. A decreased FPA and an increased rearfoot loading may indicate either biomechanical adaptation to ground reaction force or a risk factor for PFOA progression. Clinicians should aim to shift patients’ centers of gravity anteriorly and consider using wedges to achieve lateralized and posteriorized plantar pressure distribution. Additionally, they should consider the different rehabilitation strategies for the subgroups of knee OA patients. Prevention and rehabilitation programs for PFOA should focus on reducing mechanical loading on the PF joint. The findings of the present study may assist clinicians in developing treatment strategies that incorporate foot orthoses or gait modifications for patients with PFOA.
Table 3.
Self-Rated Functional Level Differences Between Patients with Patellofemoral and Tibiofemoral Osteoarthritis
Table 3.
Self-Rated Functional Level Differences Between Patients with Patellofemoral and Tibiofemoral Osteoarthritis