Plantar fasciitis is one of the most common causes of heel pain in adults. Patients present with pain in the heel, which characteristically worsens on arising in the morning and after periods of prolonged sitting. The tender points are located on the plantar side of the foot, often near the medial side of the calcaneal tuberosity. Although the exact etiology is unknown, it is probably multifactorial, including chronic inflammation, degeneration, and microtrauma of the plantar fascia; entrapment of the lateral planter nerve; overuse syndrome; heel spurs; heel pad atrophy; and seronegative arthritis-induced inflammation [
1].
The diagnosis of plantar fasciitis is based on patient history and physical examination findings [
2]. The general therapy of choice is conservative, which is effective in approximately 90% of patients. Treatment modalities include heel cups, orthotic devices and/or shoe modifications, surgical release, nonsteroidal anti-inflammatory drugs, extracorporeal shockwave therapy (ESWT), local corticosteroid injection, and physiotherapy with stretching exercises [
3,
4].
Extracorporeal shockwave therapy has been used for approximately 20 years in the treatment of refractory plantar fasciitis [
5]. The effectiveness of ESWT has been established in large randomized clinical trials and several meta-analyses [
6].
Energy levels in ESWT are categorized as high (>0.28 mJ/mm
2), medium (0.08-0.28 mJ/mm
2), and low (<0.08 mJ/mm
2) [
7]. Although previous meta-analyses have investigated the effectiveness of different energy levels used in ESWT, it is not yet clear which energy level is most effective in the clinical recovery and pain relief of plantar fasciitis after ESWT treatment.
Ultrasonography is a noninvasive, inexpensive, and easily accessible imaging tool that is useful in the differential diagnosis of heel pain. In studies of plantar fasciitis treatments, ultrasonography evaluation of the plantar fascia thickness is widely used as the outcome parameter. Plantar fascia thickness of 4 mm or greater is compatible with a diagnosis of plantar fasciitis [
8].
Plantar pressure distribution is considered to provide valuable information in the study of specific foot pathologies [
9]. It has also been shown to be useful in the evaluation of foot function by comparing the loads before and after treatment [
10]. There are various studies in the literature regarding foot loading during walking in patients with plantar fasciitis [
11], but knowledge about the effect of ESWT on plantar pressure distribution is scarce.
There are few studies in the literature that have compared different treatment energy levels of ESWT. Consequently, there are no clear guidelines for which energy level is most effective when implementing ESWT for the treatment of plantar fasciitis. The aim of this single-center, prospective, double-blind, randomized controlled study was to compare the effects of low-, medium-, and high-energy ESWT on pain, functional status, plantar fascia thickness, and plantar pressure distribution in the treatment of plantar fasciitis.
Materials and Methods
This study included 71 feet of 51 participants who presented at the Baskent University Ankara Hospital Physical Medicine and Rehabilitation Outpatient Clinics and the Orthopedics and Traumatology Outpatient Clinics with heel pain and were diagnosed as having plantar fasciitis between July 1, 2021, and September 30, 2021.
The diagnosis of plantar fasciitis was made based on clinical evidence, such as the presence of plantar heel pain with the first step taken in the morning or after a period of rest, and positive physical examination findings (pain on palpation of the site of plantar fascial insertion to the heel bone).
The patients were informed about the study, and written informed consent was obtained at the beginning of the study. The study protocol was approved by the local ethics committee. The study was conducted in accordance with the principles of the Declaration of Helsinki. The trial was registered on the ClinicalTrials.gov register.
The study inclusion criteria were defined as 1) age 18 to 85 years, 2) presence of heel pain, 3) tenderness at the insertion site of the plantar fascia on the anteromedial aspect of the calcaneal tubercle on palpation, and 4) nonresponse to conservative treatment for 3 months. The study exclusion criteria included 1) history of inflammatory rheumatic disease, 2) local dermatologic lesion or infection, 3) peripheral circulatory disorder, 4) neurologic disorders such as radiculopathy or polyneuropathy, 5) congenital or acquired foot deformity, 6) malignancy, 7) cardiac pacemaker, 8) metal implant at the application site, and 9) pregnancy.
The 51 participants (71 feet) who met the inclusion criteria were randomly separated into three groups using the sealed envelope method by an independent person who did not participate in the study. All of the groups received three sessions of ESWT (Masterpuls MP100; StorzMedical, Tägerwilen, Switzerland) with a frequency of 2,000 shocks per minute at 10 Hz with each session given once a week for 3 weeks. The ESWT target area was set as the area of maximum tenderness in the medial calcaneus, in the proximal one-fourth of the foot. No local anesthesia was administered. The ESWT was applied in a circular motion over the insertion site of the plantar fascia (1,000 shocks) and along the fascia (1,000 shocks). Group 1 received low-energy ESWT (n = 25; 2,000 shocks per session; energy density per shock, 0.09 mJ/mm2), group 2 received medium-energy ESWT (n = 25; 2,000 shocks per session; energy density per shock, 0.18 mJ/mm2), and group 3 received high-energy ESWT (n = 21; 2,000 shocks per session; energy density per shock, 0.38 mJ/mm2). All of the ESWT sessions were performed by a single orthopedist (H.B.S.).
During treatment, none of the participants received any additional treatment, such as physical therapy, acupuncture, corticosteroid injection, or anti-inflammatory drugs.
Outcome Measurements
All of the measurements before (at baseline) and after (at 1 month) treatment were evaluated by a physiatrist (H.B.S.). A visual analog scale (VAS) was used for the evaluation of pain. The score ranges from 0 to 10, where 0 indicates no pain and 10 indicates intolerable pain [
12]. The Foot Functional Index (FFI) was developed to measure the effect of foot pathology on function in terms of pain, disability, and activity restriction. The FFI is a self-administered index consisting of 23 items, including nine items in the pain subcategory, nine in the disability subcategory, and five in the activity restriction subcategory [
13].
Ultrasonographic Evaluations
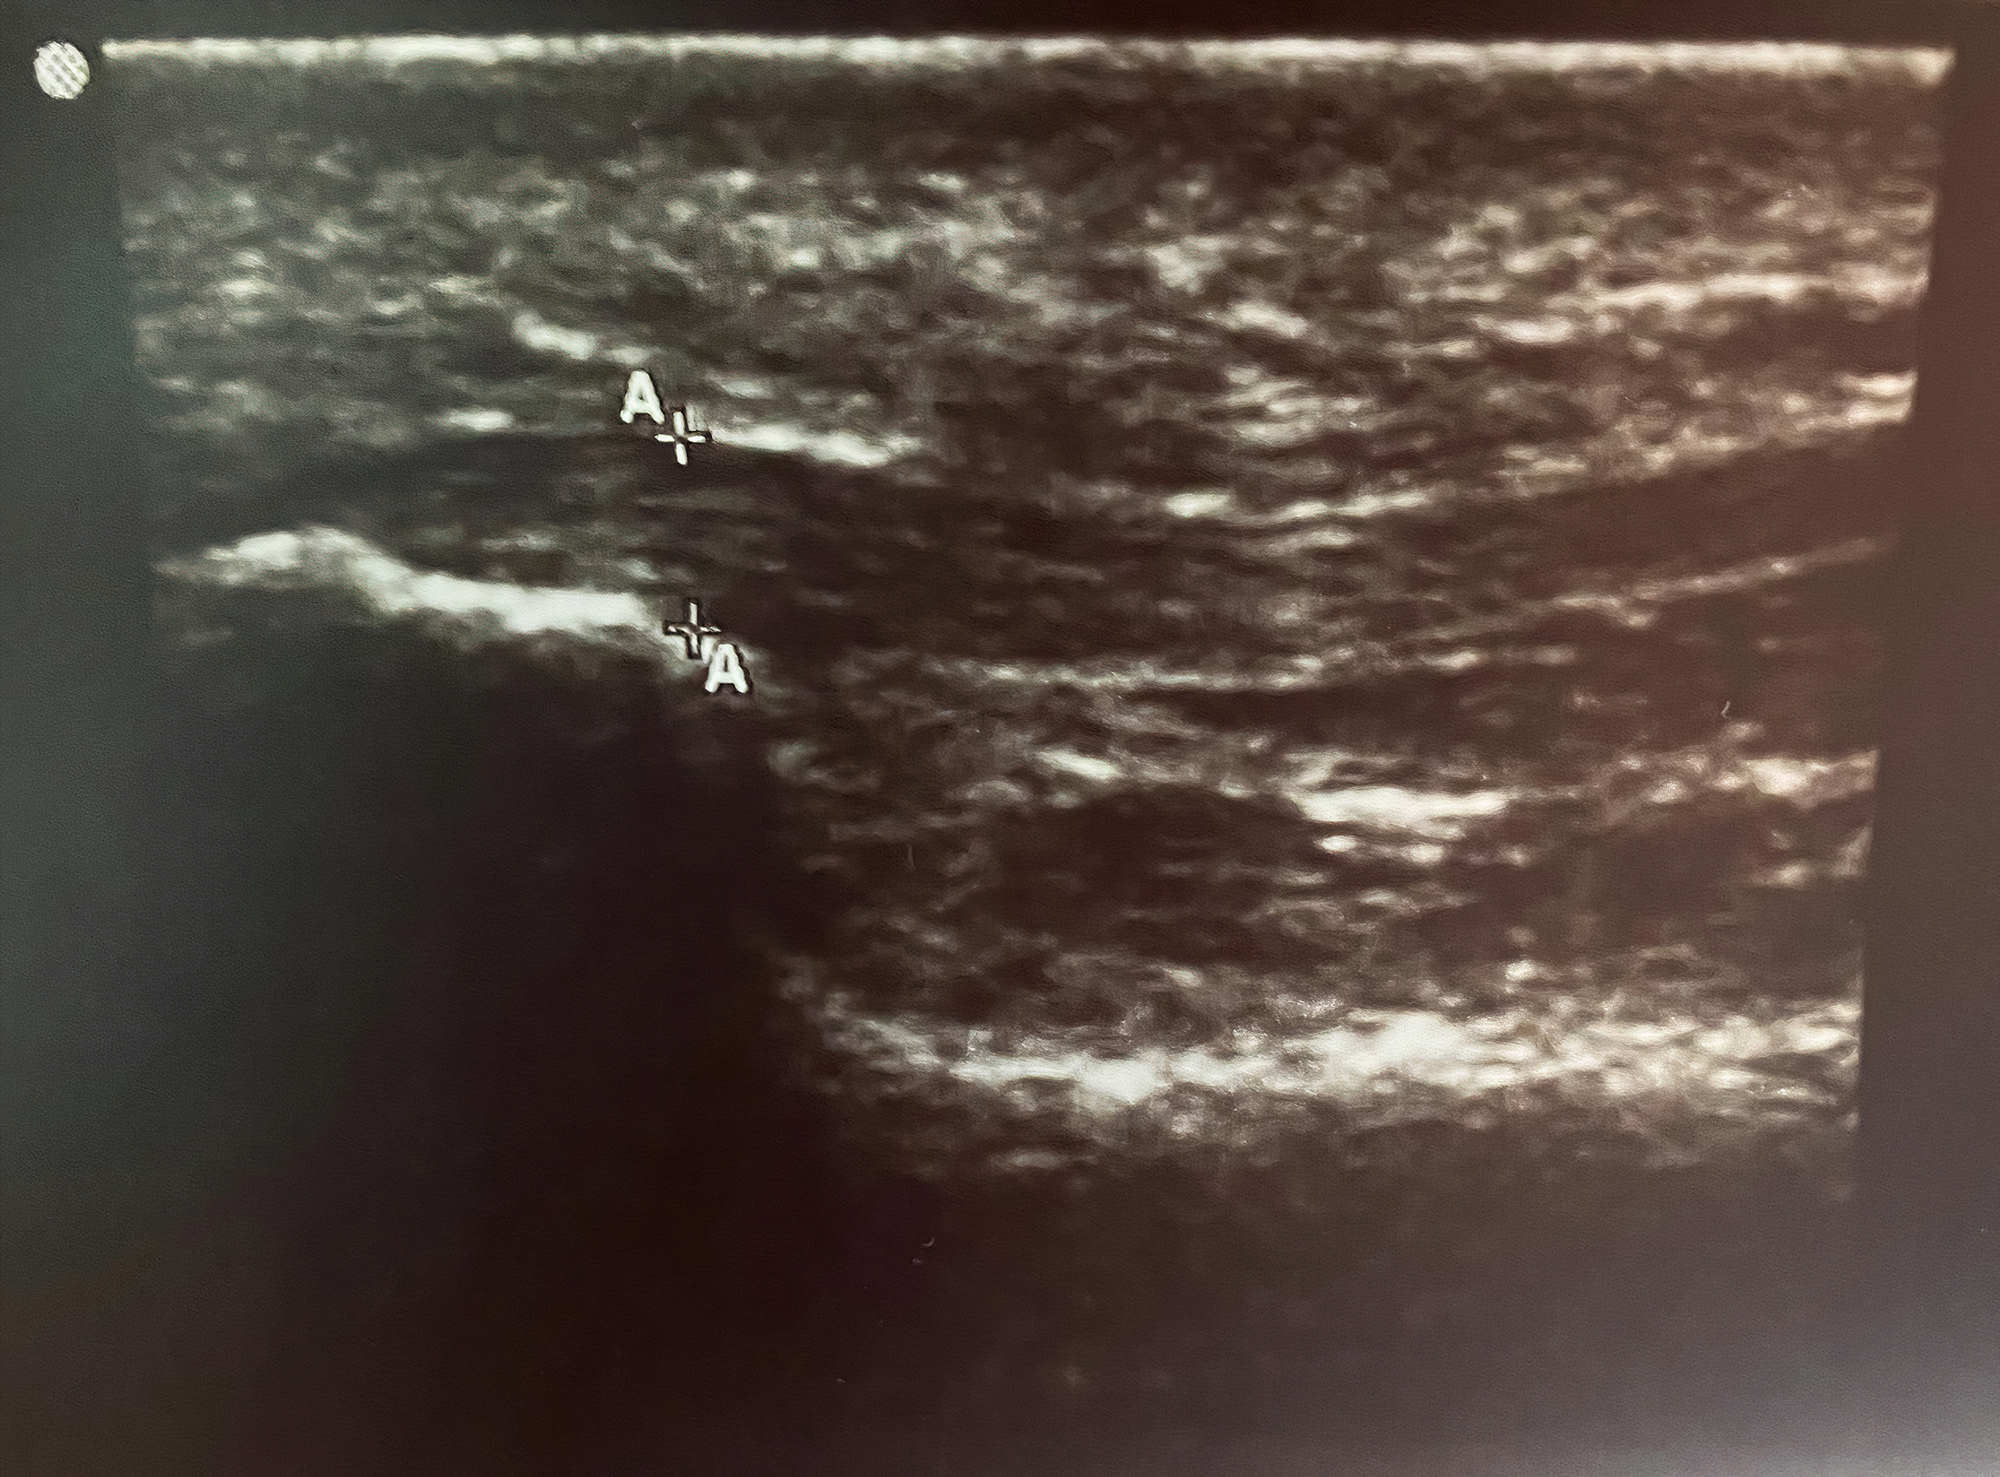
High-resolution ultrasound (frequency transducers: 13-6 MHz linear transducer; Sonosite Micromaxx, Bothell, Washington) was used to measure plantar fascia thickness. During the procedure, the participants were positioned prone with the knees fully extended and ankles in a neutral position. The thickness was measured vertically from the hyperechogenic border of the calcaneus bone to the inferior hyperechogenic rim of the plantar fascia in the longitudinal view (
Fig. 1). To minimize potential errors, an average of three measurements of plantar fascia thickness were taken at each assessment session.
Figure 1.
Ultrasound image of plantar fascia.
Figure 1.
Ultrasound image of plantar fascia.
The thickness of the plantar fascia was evaluated with ultrasonography before (at baseline) and after (at 1 month) ESWT by a physiatrist (H.S.B.) blinded to the treatment groups. The physiatrist also checked the hypoechogenicity, partial rupture, and calcification of the fascia.
Plantar Fascia Pressure
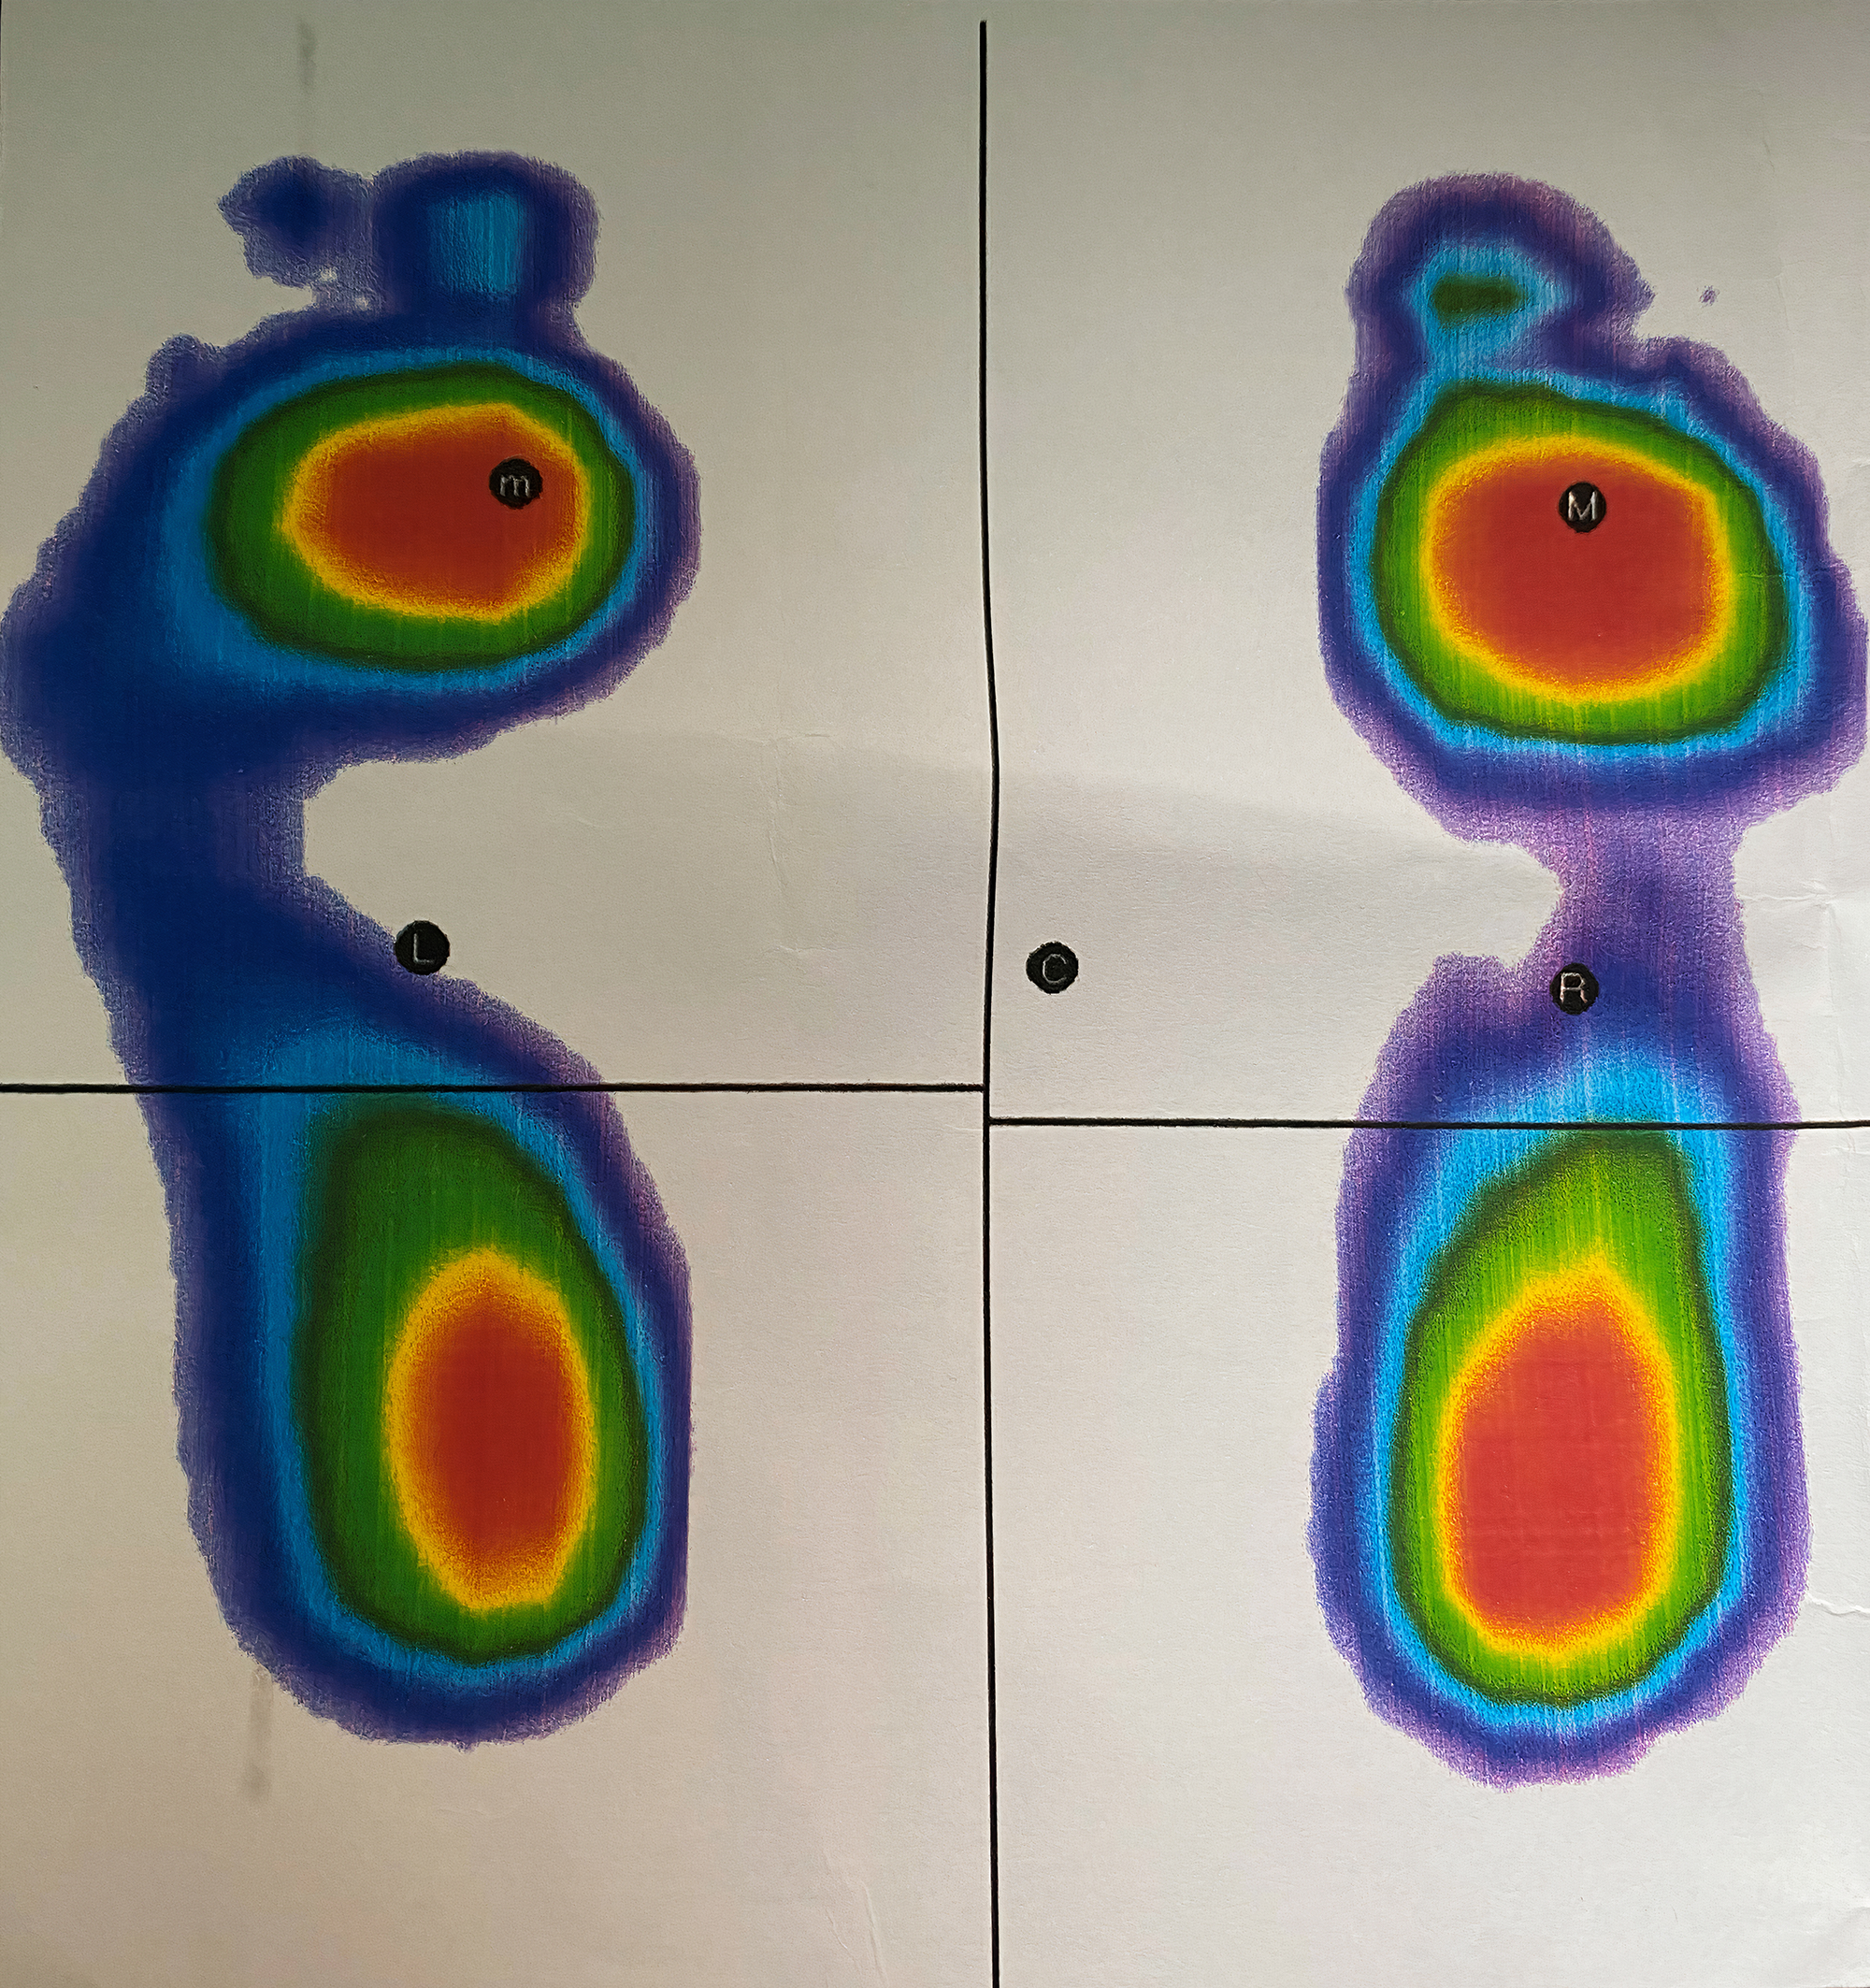
All of the participants underwent an assessment of plantar pressure distribution with static baropodometry. In the baropodometric test, each participant was in a standing position on the platform (FreeMed Base; Sensor Medica, Rome, Italy) for 5 sec, looking straight ahead, barefoot, with feet placed side by side and arms held along the trunk. The parameters examined were total plantar pressure, rearfoot plantar pressure, and forefoot plantar pressure. Physiologically, in the barometric test, the plantar pressure should be divided as 50% on the right foot and 50% on the left foot, and normal distribution of the plantar pressure percentage for each foot should be 60% on the rearfoot and 40% on the forefoot (
Fig. 2) [
14]. The plantar pressure distribution was evaluated before and after ESWT by a physiatrist (H.B.S.) who was blinded to the treatment groups.
Figure 2.
Pressure baropodometric analyses of plantar areas.
Figure 2.
Pressure baropodometric analyses of plantar areas.
Statistical Analysis
The power of the study was calculated using a statistical program (G*Power, Version 3.1.9.4; Universität Düsseldorf, Dusseldorf, Germany) based on the study by Ulusoy et al. [
15,
16] A total of 26 participants per group were deemed necessary for a study power of 80% with a 5% type 1 error and f = 0.36 effect size.
Continuous variables are expressed as mean ± SD or median (range) and categorical variables as number (percentage). The conformity of continuous variables to normal distribution was evaluated using the Kolmogorov-Smirnov test. Intergroup comparisons of normally distributed qualitative variables were performed using the one-way analysis of variance test (post hoc: least significant difference) and within-group analysis of normally distributed data using the paired-samples t test. Intergroup analysis of data not showing normal distribution was performed using the Kruskal-Wallis test (Bonferroni-corrected Mann-Whitney U test), and the Wilcoxon signed rank test was used in within-group analyses. The χ2 test was used in the comparisons of categorical data. Data were analyzed statistically using IBM SPSS Statistics for Windows, Version 22.0 (IBM Corp, Armonk, New York). A P < .05 was considered statistically significant.
Results
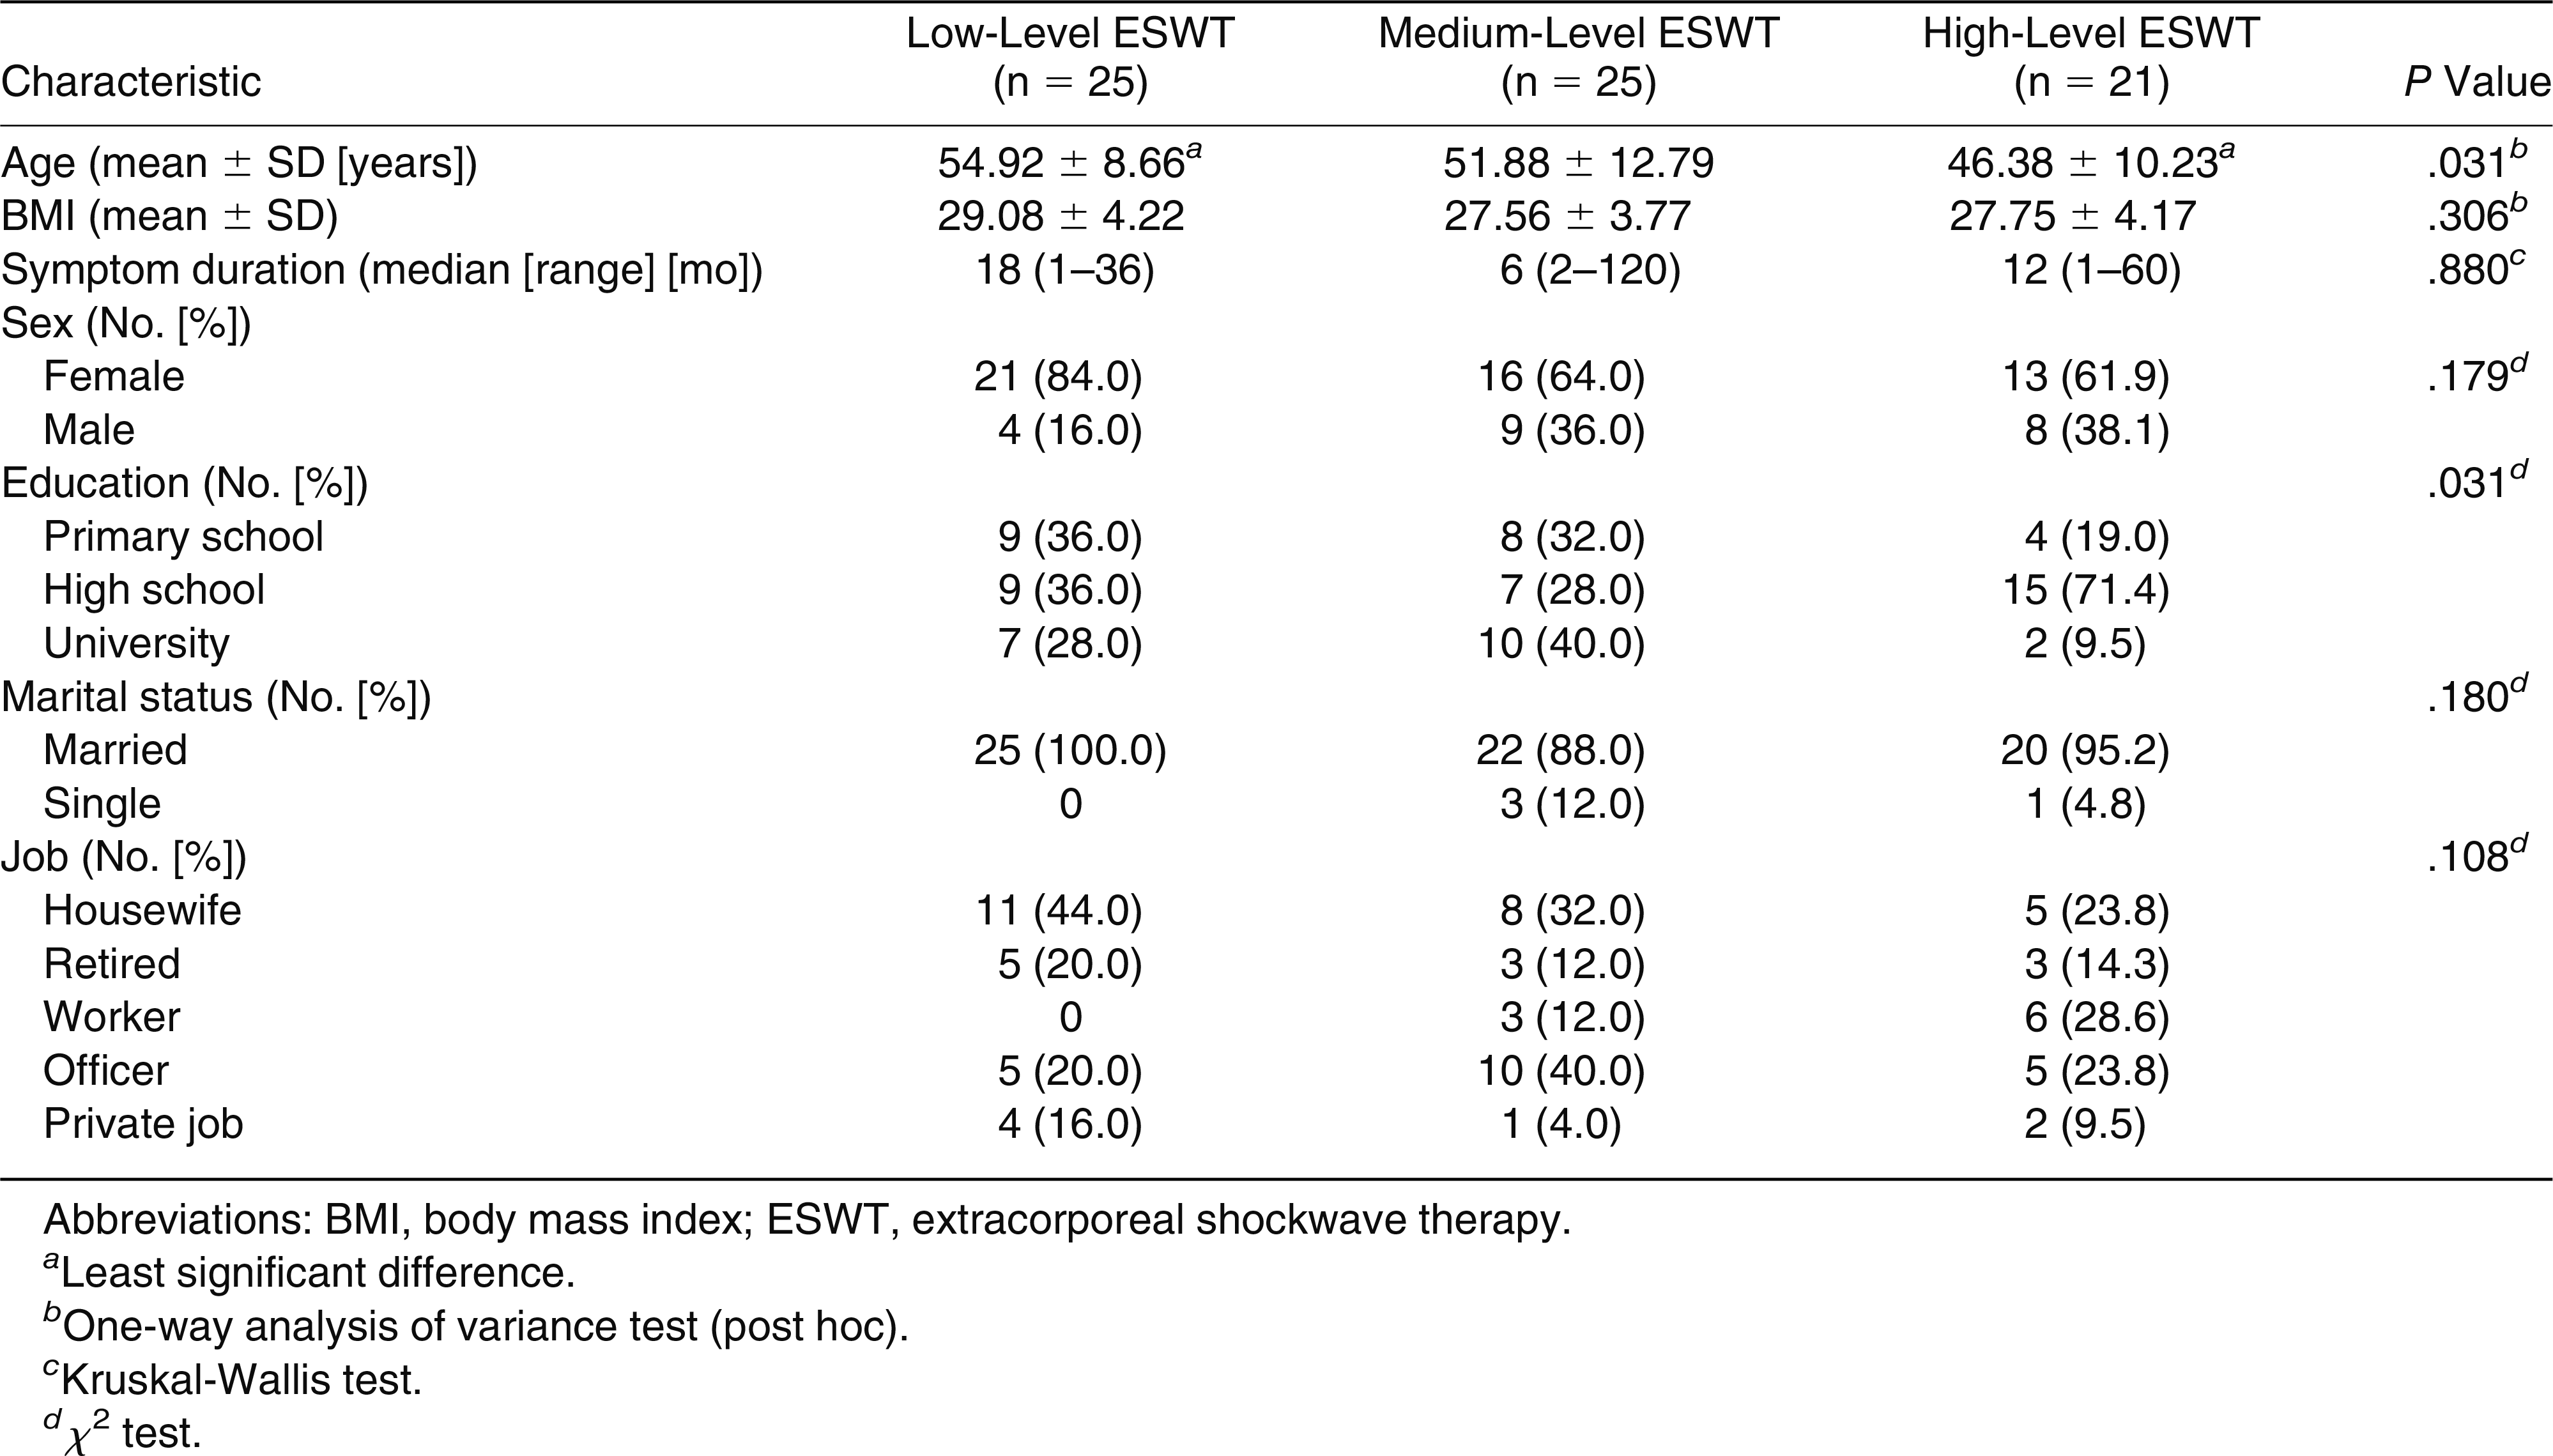
No statistically significant difference was found between the groups in terms of body mass index, sex, marital status, occupation, and duration of symptoms. Age and education level were seen to be different between the groups (
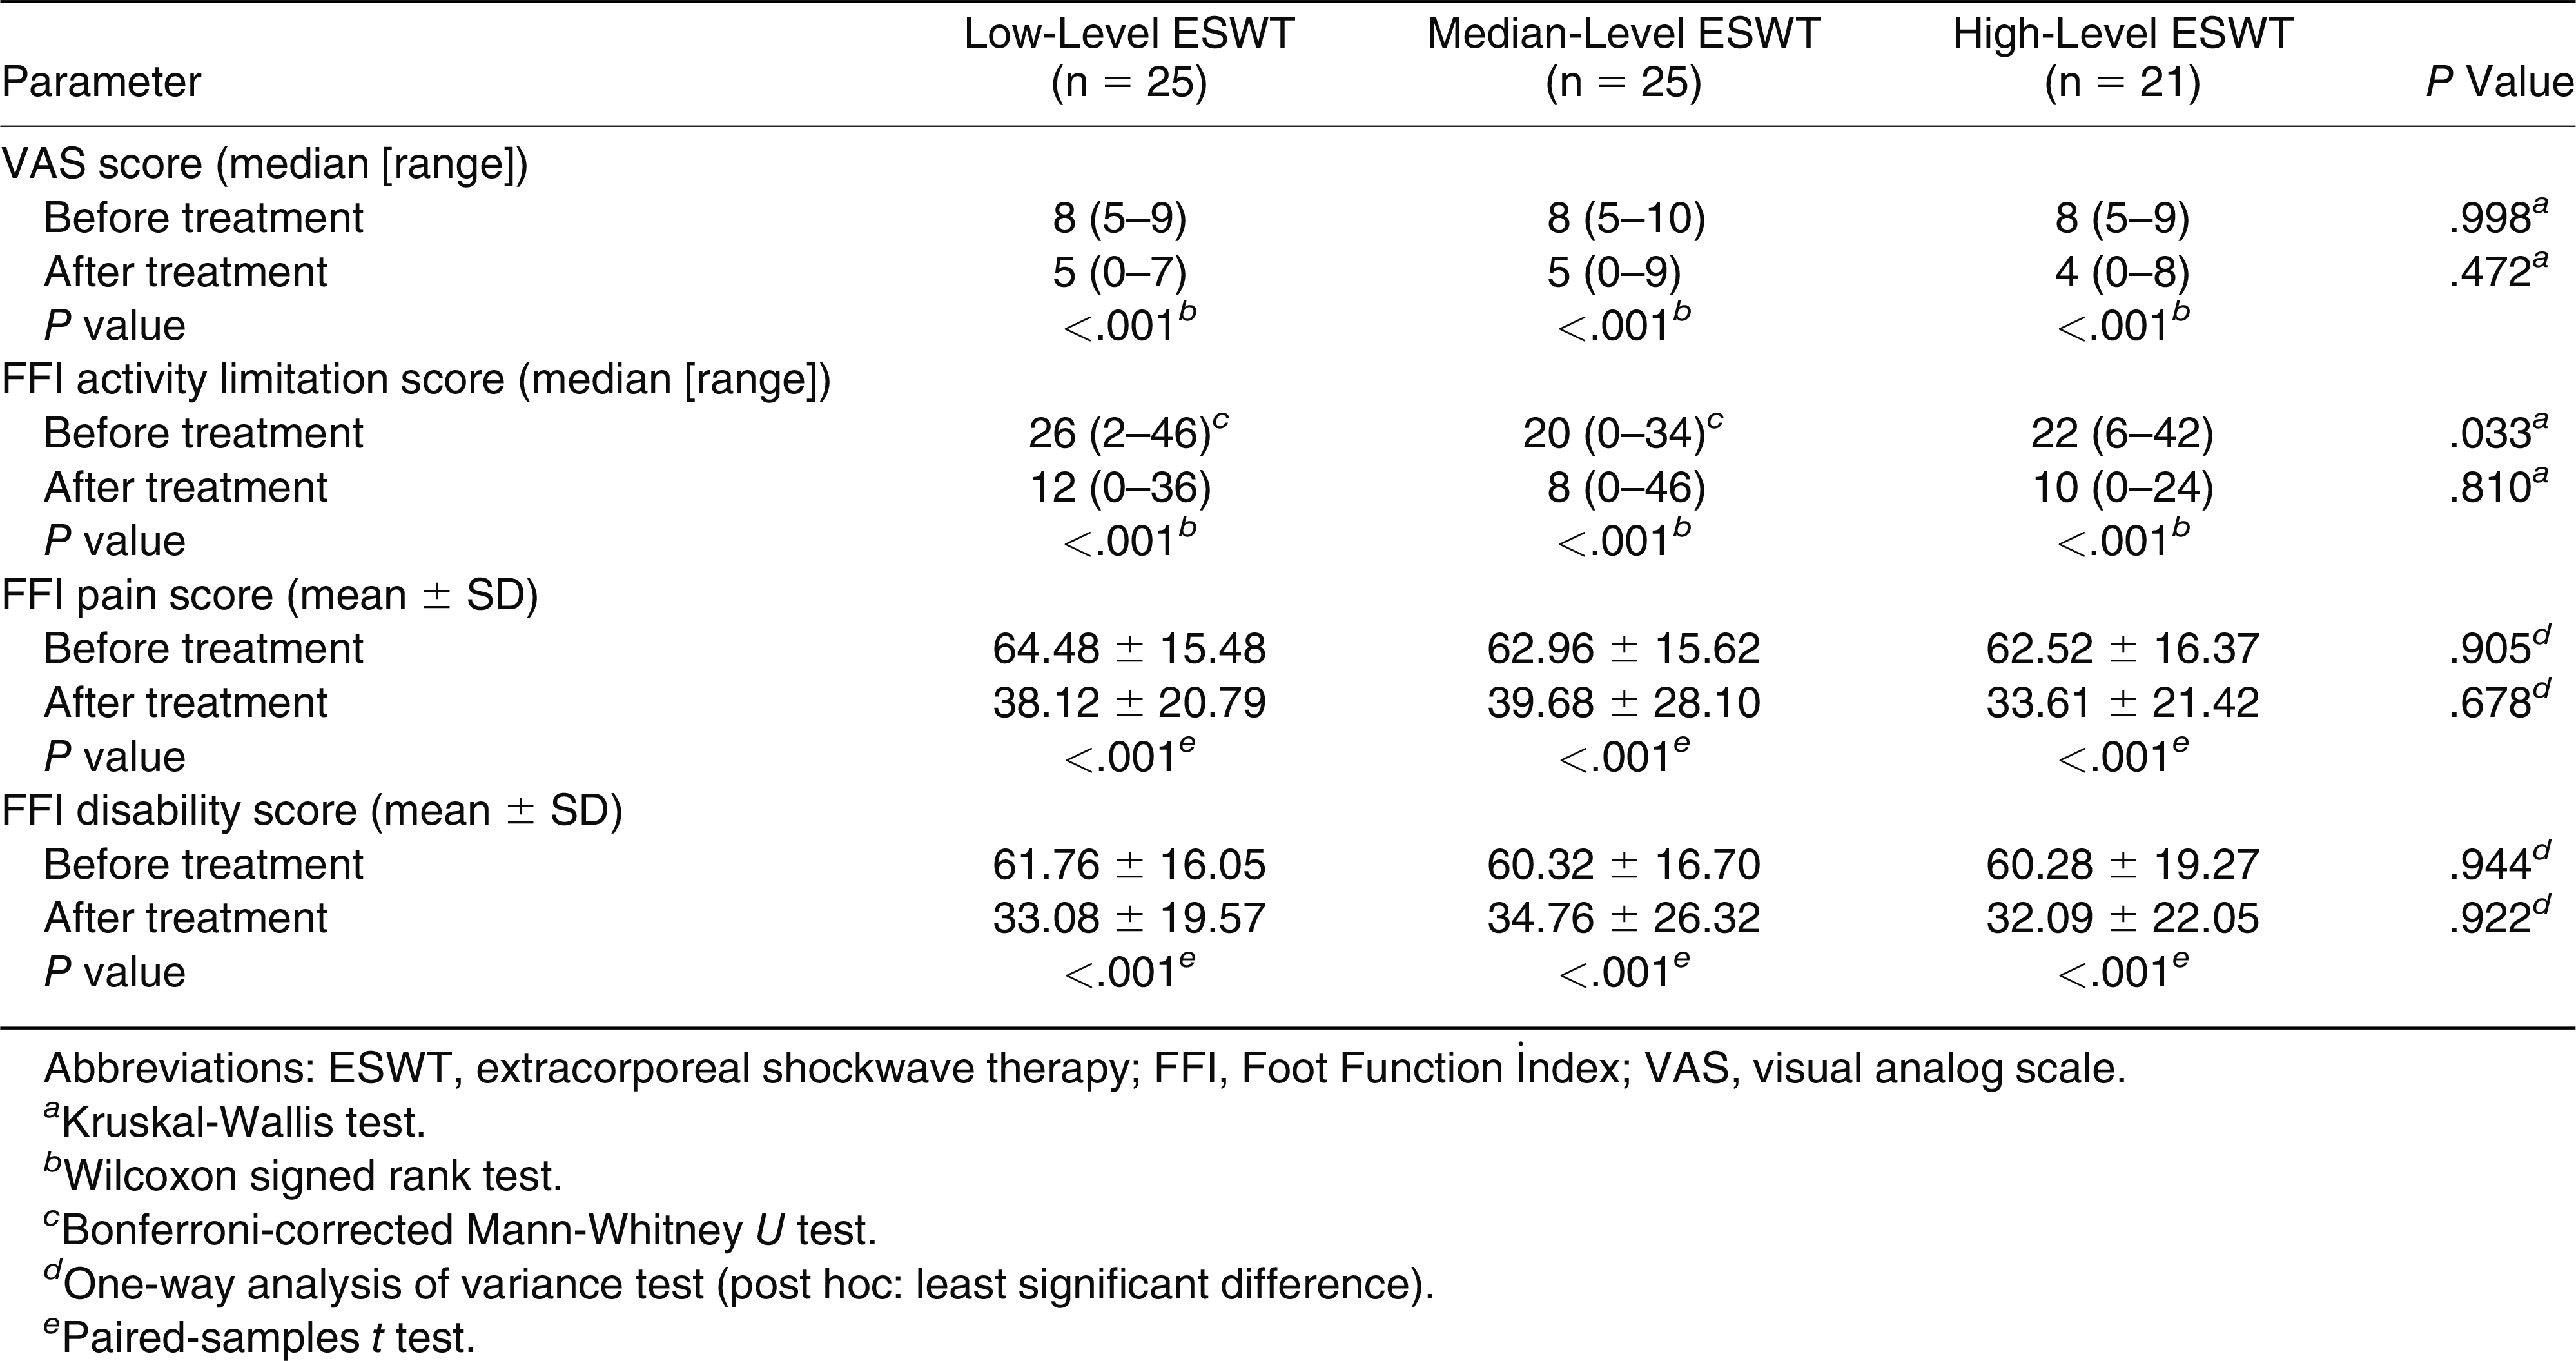
Table 1). The VAS scores and all of the FFI subgroup scores after treatment were determined to be significantly lower than the values before treatment in all three groups (
P < .001). There was no significant difference among the groups in terms of the pretreatment and posttreatment values of VAS and all of the FFI subgroups (
P > .05) (
Table 2).
Table 1.
Comparison of Sociodemographic and Clinical Characteristics
Table 1.
Comparison of Sociodemographic and Clinical Characteristics
Table 2.
Comparison of the Outcome Parameters of the Groups
Table 2.
Comparison of the Outcome Parameters of the Groups
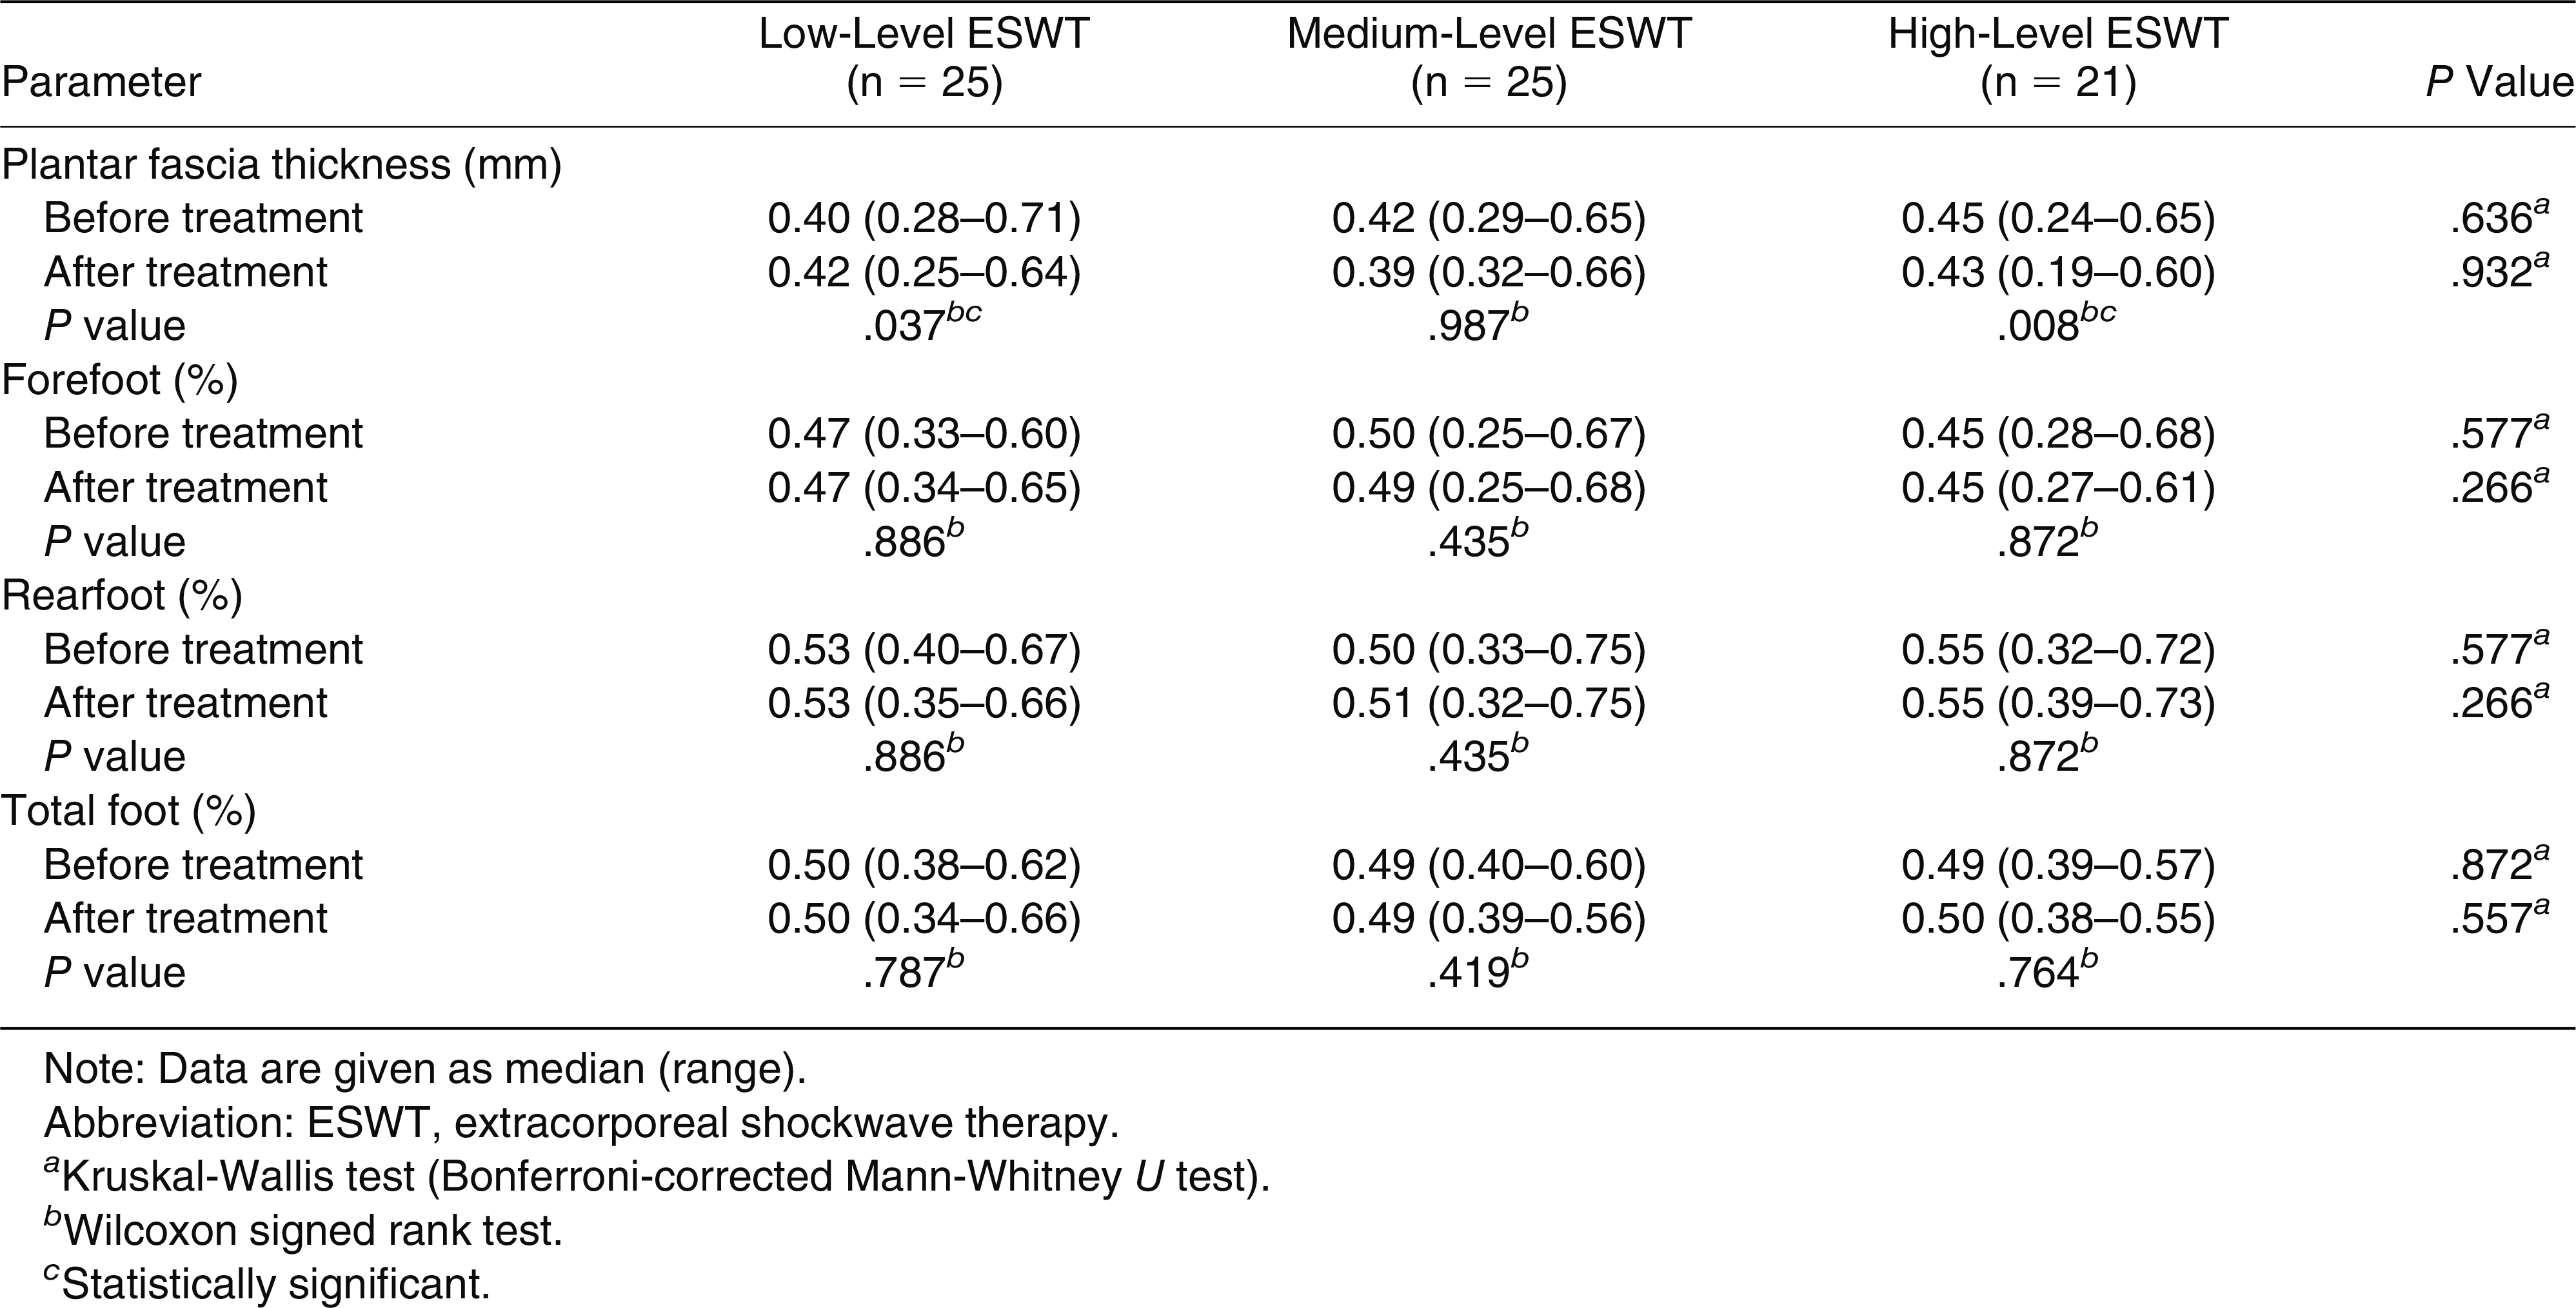
Posttreatment plantar fascia thickness values were significantly higher than the values before treatment in the low-level group (
P = .037). The posttreatment values were statistically significantly lower than the pretreatment values in the high-level group (
P = .008). There were no significant differences among the groups in terms of pretreatment and posttreatment median values of plantar fascia thickness and pressure distribution (
P > .05) (
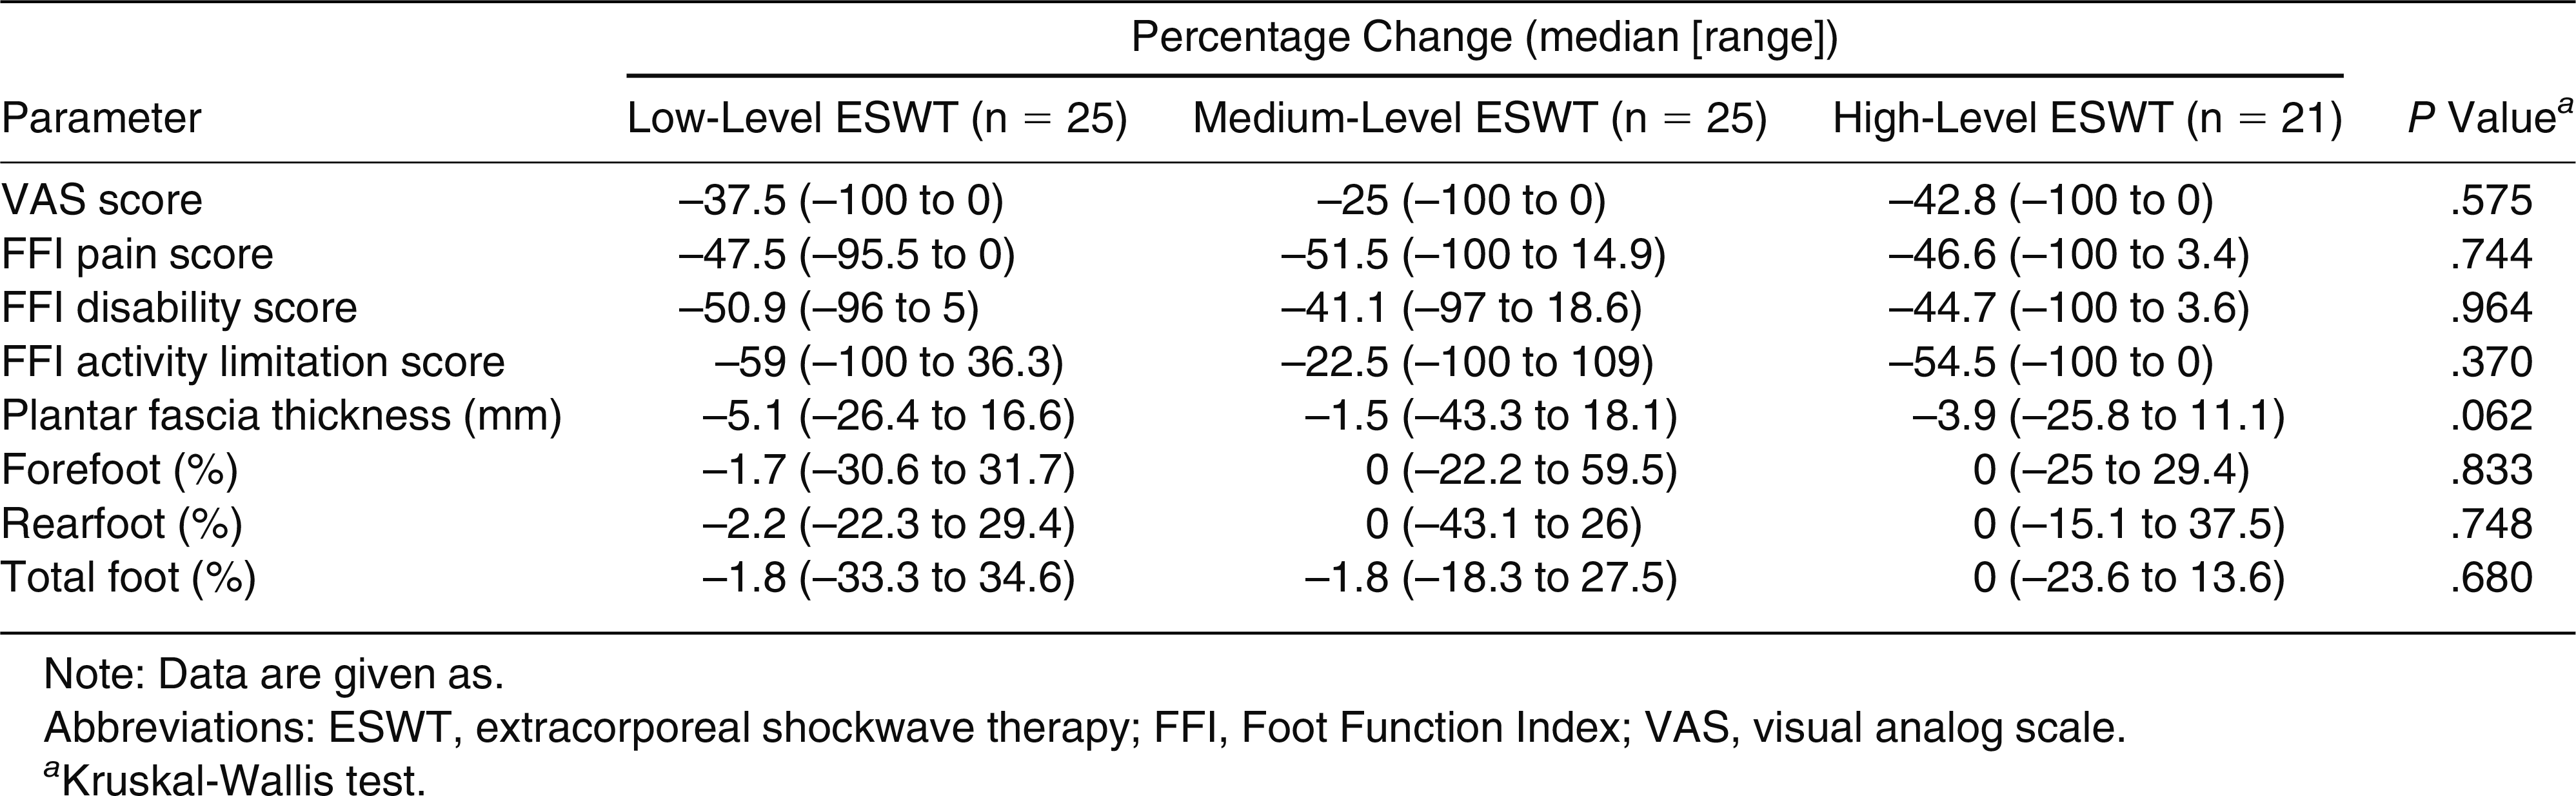
Table 3). No significant differences were found among the groups in terms of percentage changes in VAS score, FFI score (all of the subgroups), plantar fascia thickness, and pressure distribution (
P > .05) (
Table 4).
Table 3.
Plantar Fascia Thickness and Pressure Distribution of the Groups
Table 3.
Plantar Fascia Thickness and Pressure Distribution of the Groups
Table 4.
Percentage Changes of VAS Scores, FFI Scores, Plantar Fascia Thickness, and Pressure Distribution of the Groups
Table 4.
Percentage Changes of VAS Scores, FFI Scores, Plantar Fascia Thickness, and Pressure Distribution of the Groups
Discussion
In this study, evaluations were made of the efficacy of ESWT applied at different energy levels in the treatment of plantar fasciitis using the outcome measurements of plantar fascia thickness and pressure distribution. The study results demonstrated no superiority of the different ESWT energy levels over each other in the short-term VAS, FFI, and plantar pressure distribution values. In addition, although there was no significant difference among the groups in plantar fascia thickness, success was not obtained in the low- and medium-level ESWT groups after the treatment, but there was a significant improvement in the high-level ESWT group after the treatment. To our knowledge, this is the first study to have investigated the efficacy of different energy levels of ESWT in the treatment of plantar fasciitis using the outcome measures of plantar fascia thickness and plantar pressure distribution.
Although the effects of ESWT on plantar fasciitis have been reported, no treatment protocol for ESWT has been established. There is controversy in particular about the proper amount of energy to be applied. Previous studies have shown that high-energy ESWT reduced symptoms of painful heel in significantly more patients than a placebo [
17,
18]. The same result has been demonstrated using low-energy ESWT [
19,
20] and medium-energy ESWT [
21]. In the present study, all of the groups exhibited a statistically significant decline in pain and an improvement in functional status over time, consistent with the findings of previous studies.
A few meta-analyses have compared the efficacy of different energy levels used in ESWT in the treatment of plantar fasciitis. Yin et al [
22] stated that low-intensity ESWT was superior to high-intensity treatment for short-term pain relief and functional outcomes. These results contradict those of the systematic review conducted by Dizon et al [
23], in which it was shown that high- and moderate-intensity ESWT applications were more effective in pain and functional outcomes than was low-intensity ESWT in the management of chronic plantar fasciitis. Likewise, Chang et al [
24] suggested that setting the highest and most tolerable energy efflux densities in the range of medium intensity was the preferable option.
In another meta-analysis that investigated the efficacy of ESWT with different energy levels and follow-up durations in the treatment of plantar fasciitis, medium-energy ESWT was shown to be more effective in the long term compared with the control group. However, in that meta-analysis, the efficacy of low- and high-energy ESWTs with the control groups provided inconsistent results due to the limited number of articles in the subgroup analysis and the lack of longer follow-up periods [
25].
Except for these meta-analyses, there are no randomized controlled studies in the literature that have investigated three energy-level groups. In this respect, the present study is the first in the literature. Unlike the results of all of the meta-analyses mentioned previously herein, in the present study, no energy level was found to be superior to the others in terms of pain and functionality.
Plantar fasciitis has previously been evaluated mostly with outcome parameters such as pain and functionality, but recently, the measurement of plantar fascia thickness with ultrasonography has been used as an outcome parameter. There are very few studies in the literature that have evaluated the effectiveness of different energy levels of ESWT on plantar fascia thickness.
In a randomized controlled pilot study evaluating the effects of low-level versus high-level ESWT in patients with chronic plantar fasciitis, Liang et al [
26] reported no difference in plantar fascia thickness, pain, and function level between the two groups at 3 and 6 months. It was recommended that low-intensity ESWT be used because it was not associated with lower outcomes and caused less discomfort during treatment [
26].
Lee et al
27 found that medium-level energy was more efficient in terms of relieving pain and restoring functional activity and thickness of the plantar fascia than low-level energy applied in the same session. However, when the sessions were applied at different times to provide the same total energy influx, different therapeutic effects in the different energy groups no longer occurred. It was, therefore, suggested that the therapeutic effect might disclose a dose-related relationship, and the energy density and times of sessions are factors to be considered when treating with ESWT [
27].
In the present study, no difference was observed among the groups with respect to plantar fascia thickness before and after treatment. After treatment, plantar fascia thickness increased in the low-level ESWT group, no change was detected in the medium-level ESWT group, and only a significant improvement in plantar fascia thickness was observed in the high-level ESWT group. This result suggested that if total energy influx were provided as in the study by Lee et al [
27], similar effects on the plantar fascia thickness may be seen in all of the groups.
Similarly, Gollitzwer et al [
28] reported that the total energy applied significantly influences the final outcome, and it was suggested that lower-energy flux densities can be partly compensated by higher-impulse numbers and repeated treatment.
In contrast, in a study to investigate the effect of density and number of sessions of ESWT in patients with plantar fasciitis, three groups were formed (group 1: seven sessions of high-energy ESWT, group 2: three sessions of high-energy ESWT, and group 3: seven sessions of low-energy ESWT), and the results demonstrated that high energy has a more important role than the number of sessions in ESWT [
29].
Various reports have observed that plantar fasciitis alters the plantar load distribution. Patients with plantar fasciitis have been shown to have reduced force under the rearfoot and forefoot of the symptomatic and asymptomatic foot by approximately 8% and 6% bodyweight, respectively [
11]. Similarly, other studies have reported reduced loading of the rearfoot [
30,
31] or forefoot [
32,
33] in the symptomatic foot compared with a control groups.
A few studies have investigated the effects of ESWT on plantar pressure distribution in patients with plantar fasciitis. Brachman et al [
34] found that plantar pressure distribution, which had decreased before treatment, increased after ESWT. In contrast, Hsu et al [
35] stated that ESWT did not influence the rearfoot pressure, the pressure over the forefoot increased, and the total foot pressure decreased.
The present study is the first in the literature to compare the effects of different energy levels of ESWT on plantar pressure distribution. However, according to the results obtained, the distribution of total, forefoot, and rearfoot pressure did not change in any group after ESWT. Although the effect of ESWT on plantar pressure distribution is controversial, this result can be considered to be due to the short follow-up period and the evaluation of only static plantar pressure.
There were some limitations to this study, primarily the low number of patients and the short follow-up period. The lack of longer follow-up periods may have caused uncertainty about the efficacy of different energy levels of ESWT in this study. There is a need for further studies with larger samples and longer follow-up to compare these methods. Another limitation was that only static weightbearing biomechanical inferences were considered, and the forces in dynamic situations such as gait were not taken into account.
In conclusion, the results of this study demonstrate that the three different levels of ESWT significantly reduced the pain experienced with plantar fasciitis and provided functional improvement. However, when the success rates were evaluated, no level of ESWT was found to be superior to the others in terms of reducing pain and plantar fascia thickness and improving functional status and plantar pressure distribution. Further studies are required to confirm the efficacy of different energy levels of ESWT in longer follow-up periods.