When selecting a running shoe, different features including comfort [
1,
2], cushioning [
3], brand [
4], and color [
5] influence the decisions of shoe consumers. Some studies have determined that shoe mass also ranks as one of the main criteria in choosing running shoes among different levels of runners [
6,
7]. This might be because of the common perception that a lighter shoe will increase running efficiency, although recent research has produced mixed results in this respect [
8–14]. The perception of mass was first determined by Weber [
15], who in 1834 differentiated between static mass perception through touch, and active mass perception, which incorporates tactile and muscular components. In addition, he determined that the smallest difference in mass that can be detected is proportional to the mass of the object (Weber fraction = smallest difference:object mass). How the hand perceives changes in mass (based on touch and muscular components) has since been extensively studied. Modern experiments show that the Weber fraction ratio for hand touch alone is higher than when the object is lifted with the hand [
16,
17].
In contrast, relatively little is known about how the foot perceives mass. Some early studies of lower limb mass perception were performed with masses cantilevered away from the limb [
18,
19]. Recent findings show that when participants wore running shoes and were asked to evaluate their relative masses with movements while walking and jumping, the subjects were poor at perceiving mass across a range of common running shoe masses (∼220–360 g) [
20,
21]. Saxton et al. [
22] investigated the perceived mass of weighted running shoes while running. Their findings show that wear time and control shoes (CSs) may influence mass perception by the lower limb. In another study by Greenya et al [
23], the learning effect was measured in freely chosen actions such as walking, jumping, and standing over 60 sec. Participants were asked to repeat the task for the second time, but their perception of shoe mass did not appear to improve with practice. Because of the diversity of independent variables and their effects on somatosensory shoe mass perception, more studies are needed to improve our understanding of mass perception through the feet. Therefore, the aims of this study are, first, to assess how accurately subjects perceive additional shoe mass during running, and second, to investigate the potential learning effect of shoe mass discrimination during running.
Methods
Participants
Twenty-two male participants (aged 24.45 ± 3.20 years and weighing 77. 87 ± 8.6 kg) were recruited from the Munich University Sports Center in Germany. Six months before the time of testing, participants were required to be injury free. Before the experiment, they had to give written informed consent. The written informed consent form refers to the confidentiality of the objectives and study risks, and includes data privacy. Moreover, this form ensures that subjects are free at any time to stop participating in this research without providing any reasons and without incurring penalty. This research was conducted according to the ethical standards of the 1964 Declaration of Helsinki [
24].
Tools of Study: Shoes
Four sizes of running shoes ranging from 42 to 45 were selected (Victory Performance; Deichmann GmbH, Essen, Germany). Each shoe size was categorized as one CS (without additional mass) and shoes with four additional masses: +50 g (shoe I = 1.8 × CS), +150 g (shoe II = 1.55 × CS), +250 g (shoe III = 1.92 × CS), and +315 g (shoe IV = 2.16 × CS). The average weights of shoes in different sizes is 283 ± 21 g and the weight deviation for each shoe size is ±3 g.
To increase the shoe mass, lead tape was attached to the fore and rear parts of the shoes. However, the center of mass for each shoe was kept constant during this procedure. The experiment was conducted as a blind test by partially concealing the 20 shoes with black tape (
Fig. 1).
Figure 1.
Procedure of weighting shoe sample in the experiment. A, Indoor running shoe (control shoe). B, Lead tape added to fore and rear parts. C, Concealed with the black tape.
Figure 1.
Procedure of weighting shoe sample in the experiment. A, Indoor running shoe (control shoe). B, Lead tape added to fore and rear parts. C, Concealed with the black tape.
Study Procedure
Initially, participants warmed up with the CS on the treadmill for the first 10 min of the experiment. Subjects also defined their desired velocity for the experiment under blind test conditions aided by the experimenter. Next, participants ran on the treadmill for 2 min with CS, and then they continued for another 2 min with a random pair of weighted shoes. After that, they were allowed to take a rest for 1 min. For comparison, all possible pair tests with the CS were repeated according to this process. After completing all possible pair tests with CSs, subjects were given up to 1 hour until they felt ready to start the second session following the same procedure as in the first session. In session 2, participants ran with the preferred velocity selected in the first session. After completing the first session, subjects were given up to 1 hour until they felt ready to start the second session following the same procedure as in the first session.
Methods of Data Collection and Analysis
After each pair tests with CS, participants responded to a comparative question,“Is the second shoe perceived to be heavier?” The answer is binary, where yes means “the second shoe was perceived to be heavier” and no means “the second shoe was not perceived to be heavier.” For further statistical analysis, correct responses were converted to 1 and incorrect responses were converted to 0. A mixed effect logistic regression with and without interaction effect were used in SAS 9.4 (SAS Institute Inc, Cary, North Carolina). Several steps were taken to prevent participants from perceiving indirect information about the shoes. Participants were asked not to touch or handle the shoes at any stage during the test of mass perception through the feet. The experimenters put the shoes on subjects’ feet, laced them, and removed them after the test. Participants were not allowed to walk or jump in the shoes. They began running on the treadmill immediately after lacing. These procedures prevented the participants from gaining any perceptual information about shoe mass that could confound the perceptions from simply wearing the shoes. In addition, to minimize possible tactile cue differences, participants were provided with similar socks (45% polypropylene, 35% cotton, and 20% polyamide).
Results
The effect of two independent variables, mass and session, on perceived mass (dependent variable) among 22 subjects was investigated with mixed effect logistic regression with and without interaction. In the mixed effect logistic regression without interaction, mass had a significant effect on perceived mass (F4,193 = 10.66, P < .0001), whereas session did not (F1,193 = 1.06, P = .30). Moreover, the model with the interaction effect showed that session and interaction effect (mass × session) were not significant (P > .005).
In addition, a post hoc test (ie, Dunnett-Hsu test) was used to compare all weighted shoes with the CS. According to
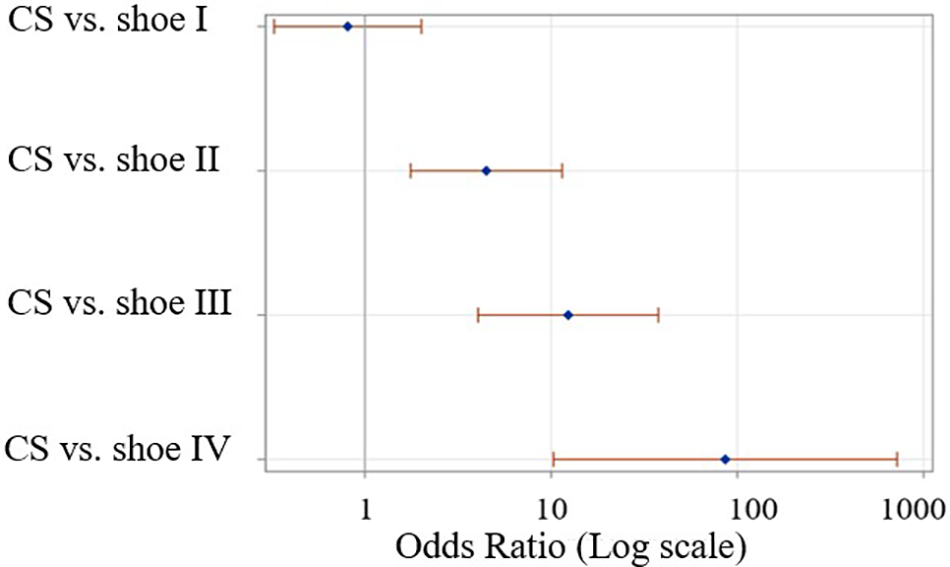
Table 1, the test comparisons between the CS and other weighted shoes show a significant difference (at an alpha level of 0.05), except for shoe I in comparison with the CS. The results show that the odds ratios when comparing the CS and weighted shoes are higher than 1 (
Fig. 2) except for the CS versus shoe I. Accordingly, there are significant differences between the CS and weighted shoes but not shoe I (
Table 1 and
Fig. 2).
Figure 2.
Odds ratio and all pair tests with control shoe.
Figure 2.
Odds ratio and all pair tests with control shoe.
Table 1.
Multiple Comparisons of All Weighted Shoes with the Control Shoe
Table 1.
Multiple Comparisons of All Weighted Shoes with the Control Shoe
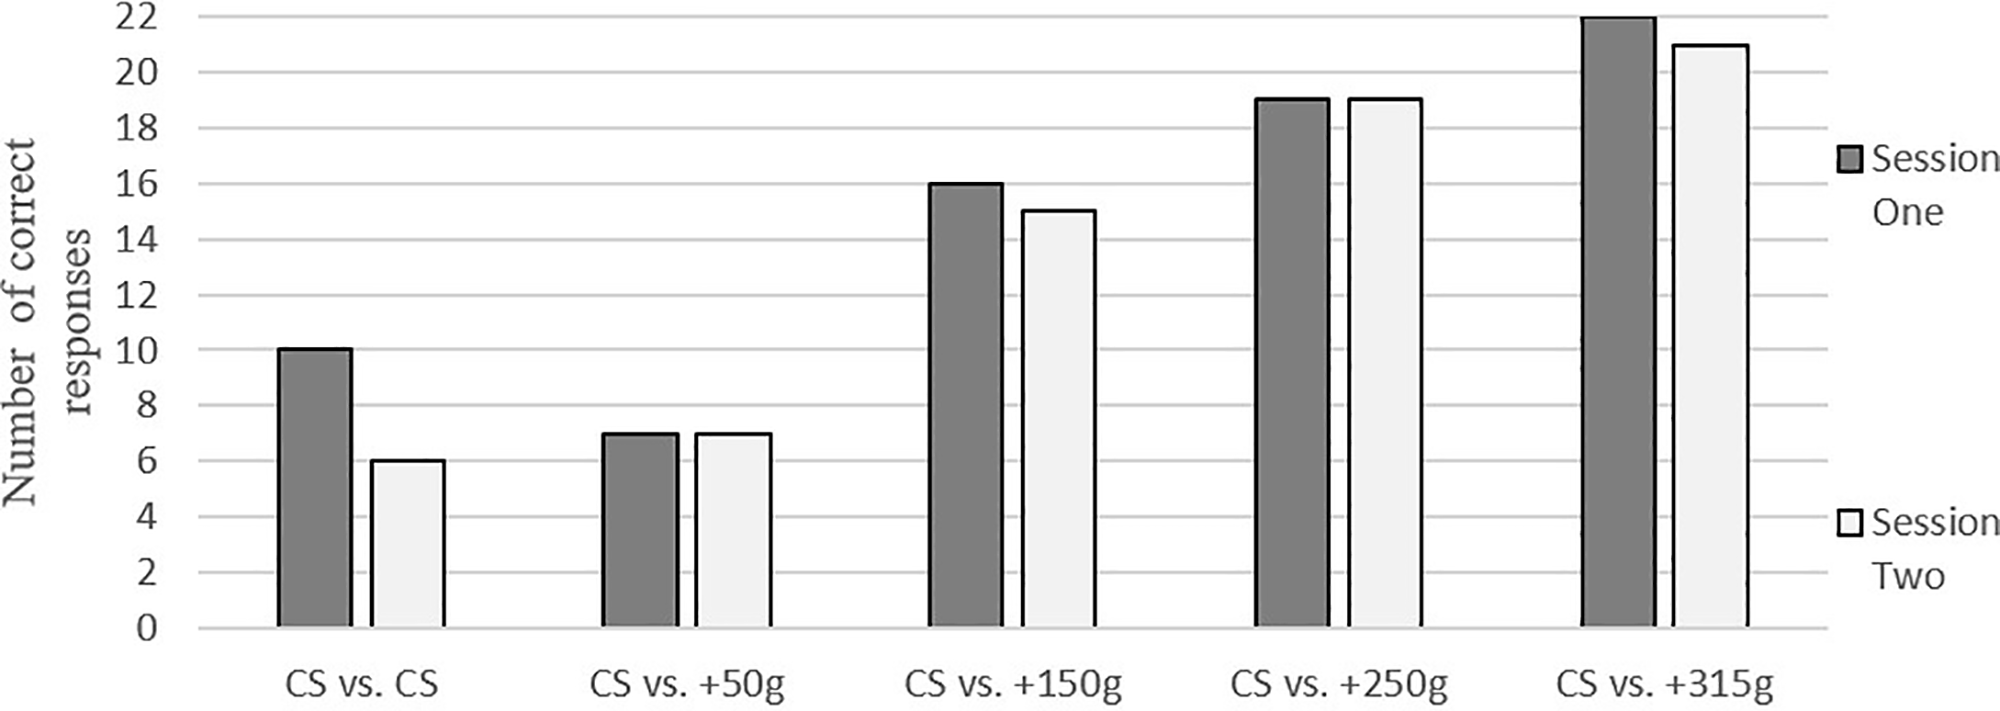
The accuracy in session 1 for shoes I, II, III, and IV in comparison with the CS are 31%,72%, 86%, and 100%, respectively, whereas in the second session, the values are 31%, 68%, 86%, and 95%. Repeating the task did not affect perception of shoe mass significantly. The total drop in accuracy from the first session to the second session across all five pair tests shows that there is no learning effect. The accuracy of shoe mass perception dropped 2% from session 1 (72%) to session 2 (70%). In addition, the insignificant
P = .30 determined that there is no effect of session on perceived shoe mass (
Fig. 3).
Figure 3.
Number of subjects correctly perceived additional mass in all possible pair tests with control shoe (n = 22).
Figure 3.
Number of subjects correctly perceived additional mass in all possible pair tests with control shoe (n = 22).
Discussion
In our study, the sensory threshold of perceived mass is distinguished by the additional weight of +150 g (
P < .05). An odds ratio higher than 1 only occurred when the additional shoe mass was greater and equal to +150 g. In our study—based on the Weber law—the just-noticeable difference (JND) is 150 g and the Weber fraction is equal to 0.53 (150:283). Several factors have to be considered when relating the JND and Weber fraction measurements to results presented in the literature. Slade et al. [
20] determined that an increase of 140 g is the sensory threshold (JND) and the Weber fraction is 0.64 (the initial shoe mass is 220 g). The difference in the JND may be attributable to the methodologic difference in the original shoe masses of both studies, which is approximately 63 g. This difference may have affected the subjective threshold, where the Weber fraction decreases when the mass increases up to 200 g [
26]. Findings of Hausler et al. [
21] determined that a JND of 100 g is required for the foot to consistently (and accurately) perceive differences between weighted running shoes. In addition to the methodologic difference of origin of shoe mass, a “sex-specific difference “may also have increased the foot’s activation threshold. Moreover, other factors that led to our results were the use of the CS and binary questionnaire. Runners are used to their own shoes; thus, using the CS for a pair comparison with weighted shoes can reduce all potential biases [
22]. The visual analog scale (VAS) was a main tool in past related studies [
20–22]. However, the complexity of this measure (ie,VAS) can influence the reliability of assessments [
27,
28]. In other words, the number of individuals who reliably assessed the footwear could be increased by reducing the complexity of the VAS measure to simple binary yes or no questions.
Another part of our findings determined that foot perception of shoe mass does not improve with practice. Our findings are in line with those of Greenya et al. [
23]. In our study, repeating the sessions does not show any effect on perceived mass. The accuracy, from 72% in session 1, dropped to 70% in session 2. Greenya et al. [
23] determined that accuracy was 93% in the first trial compared with 92% in the second trial for the hand test. They also showed that the accuracy with the feet did not differ significantly [
23].
The findings from some of the aforementioned studies [
20–23] also determined that hands have a higher sensitivity—with respect to the additional mass—than feet. While moving or holding mass by hand, both touch and muscle contribute to perception of mass. In our study, the weight of the shoe could probably not be perceived by the touch-sense in the skin of the feet. Thus, the shoe mass is mostly perceived with the degree of tension in the muscle when lifting weight [
29]. We speculate that acceleration of the feet in the swing phase of running influences the Golgi tendon organ and muscle spindle. By inserting up to 150 g additional mass, the Golgi tendon organ, which is a cluster of sensory receptors, will be stretched and depolarized significantly in the swing phase and send the signals through Ib-afferent synapses to the brain cerebellum and cerebral cortex [
30]. The sensitivity of tendon organ receptors to changes in muscle force suggests that the discharges arising from these receptors could provide the basis for judgments of force [
31,
32]. This judgment may be related not only to perceived heaviness, as reported by Brooks et al. [
33], but also to perceived mass.
In addition, we generated a running gait model using a multibody system simulation in the Simpack software to calculate the knee moment while running. The calculation of the knee joint moment in swing phase in the sagittal plane—and with a velocity of 2.6 m/sec—is increased by 7.5% when additional shoe mass is 150 g (in comparison to the CS). This increase of knee moment (product of moment of inertia and angular acceleration) could contribute to the threshold of mass perception in running in a major way. Future study is necessary to investigate the relationship between joint kinematics and kinetic variables of runners and their perception of mass with the CS and shoe II (150 g).
Conclusions
In our study, we developed a new methodologic framework for perceiving shoe mass. An increase of 150 g is the JND among other weighted shoes and the Weber fraction is equal to 0.53 (150:283 g). Learning effect did not improve by repeating the task in two sessions in the same day. The accuracy of mass perception while running drops 2% from session 1 to session 2. Future study is necessary to investigate the relationship between kinematics and kinetic variables and perception of mass while using the CS and shoe 2 (150 g).