The prevalence of peripheral artery disease (PAD) is unknown, with estimates varying widely from 4.3% to 57% depending on how it is assessed and the demographic characteristics and health status of particular subpopulations.[
1,
2] This disease is known for its association with risk of pedal ulceration and nonhealing,[
3,
4] but it is more important as an indicator of a person’s level of cardiovascular risk, which is markedly increased when PAD is pre-sent.[
1,
5,
6,
7] Accurate identification of PAD can con-tribute to determination of a person’s cardiovascular morbidity and mortality risk and for deciding whether pharmacotherapeutic or surgical interventions are indicated. Accurate measurement associated with PAD is also important for monitoring the effect of interventions.
Until recently, in addition to careful history-taking and physical examination, PAD has often been identified and monitored via ankle-brachial indices (ABIs). However, despite some findings to the contrary,[
8] there is mounting evidence that either toe systolic pressures (TSPs) or toe-brachial indices (TBIs) might be useful adjuncts to, or more valid than are, ABIs, especially when ABIs are elevated,[
9,
10,
11,
12,
13,
14] and that TSPs and TBIs are better predictors of postoperative healing for people with diabetes than are ABIs.[
15] In a structured review about the sensitivity and specificity of ABIs in the identification of PAD, Xu et al[
16] concluded that the ABI is useful in the general population as a screening test for PAD. However, they found that in populations with atherosclerotic risk factors, sensitivity of the ABI for PAD screening can be as low as 15%, particularly in elderly people and those with diabetes. Estimates suggest that as many as 30% to 35% of people with PAD are being missed using current algorithms relying on the ABI as the primary screening test.[
13,
17] In addition, Hyun et al[
18] reported that TBIs are more effective than are ABIs for predicting cardiovascular mortality in people with and without diabetes. Findings such as these indicate that both TSPs and TBIs may be of value in addition to the ABI for screening and monitoring purposes, and they are now referred to in several guidelines as indicators of vascular sufficiency to the feet, even if their use is often recommended only after the ABI has produced high or inconclusive readings.[
19,
20,
21,
22,
23,
24,
25,
26]
Unfortunately, there is little consistency (even within groups of researchers), and often a lack of information, about the procedures used to obtain TSPs and TBIs—whether or not screening for PAD is the primary focus. In early work with TBIs, Carter and Lezack[
27] took a single reading from the second toe using a 20-mm-wide cuff. Williams et al[
28] took an unspecified number of readings from the hallux, presumably from both feet, but neither that nor the cuff size is specified, and they averaged the readings. Varatharajan et al[
4] seem to have taken a single reading from the hallux of each foot, or the second toe if the hallux was unavailable, used a 19-mm cuff, and analyzed the readings from each foot separately. Bonham et al[
29,
30] recommended taking one reading from each foot and using 25-mm cuffs for large toes and 19-mm cuffs for second toes, but in practice, Bonham et al[
29] took two readings from each foot and presumably averaged all four readings, although that is not clear. Pe´rez-Martin et al,[
31] (p516) using an unspecified but ‘‘appropriately sized’’ cuff on either the hallux or the second toe, inflated the occlusion cuff once ‘‘to avoid or limit [unspecified] postischaemic effects’’ and then obtained four readings from each foot using two different devices and subsequently averaged some of the readings. Høyer et al[
32,
33] took up to five readings from each foot and for each foot averaged the first two readings that were within 10 mm Hg of each other, and Høyer et al[
34] adopted a similar approach but used the mean of three readings if three of five readings spanned no more than 20 mm Hg. Other researchers took only a single reading from one foot.[
35,
36,
37] In addition to the above, there are inconsistencies and information shortfalls concerning pretest rest times; whether feet were warmed before blood pressure measurements were taken; the arm(s) from which brachial pressures were obtained and whether brachial and toe pressures were obtained simultaneously, in the case of TBIs; the amount of time between readings if two or more readings were taken from the same site on a particular occasion; and the types of devices used. It is, therefore, likely that TSP and TBI values obtained by one set of researchers are not comparable with the values obtained by other researchers and that cutoff values for such things as PAD and ulceration risk differ from context to context.[
13]
Partial information exists concerning how some of the variables referred to earlier can affect TSPs and TBIs. For example, a decline in brachial blood pressure has been noted for the initial 10 min of sitting or lying, but, although recommendations about pretest rest times for toe pressure vary from 6 to 30 min, an evidence base for these recommendations is lacking.[
38] When reviewing seven publications in which TBIs had been obtained from eight discrete healthy samples, Høyer et al[
13] found that the average TBI value across five samples with pretest warming was 0.92, whereas the average in the three samples without pretest warming was 0.77—but warming might not have been the only variable contributing to the difference. There is a small amount of published evidence concerning the influence of cuff sizes on toe pressure. Pa˚ hlsson and colleagues[
39,
40] found that TSPs taken with a 15-mm cuff were consistently higher than were those taken with a 25-mm cuff, with a mean difference of 23.57 mm Hg. The extent of difference ranged widely from
6 to 35.5 mm Hg, however, indicating that toe pressures based on one cuff width could not be predicted with confidence from knowledge of the pressure obtained with a different cuff width. Reassuringly, Bhamidipaty et al[
41] compared TSP readings taken with a 25-mm-wide cuff on the hallux and a 15-mm-wide cuff on the second toe of the same foot and demonstrated that these readings were correlated within limits of clinical utility across a full range of pressures (approximately 20–160 mm Hg). It seems, therefore, that second-toe pressure readings from 15-mm cuffs may be regarded as valid substitutes for people who do not have halluces or whose halluces cannot be used to procure readings using 25-mm cuffs. There is also an implicit warning, however, that cuff sizes cannot be ignored when taking readings from different, as well as from the same, toes.
There seems to be no published evidence about a variety of other variables that might be intrinsic to the validity of toe pressure measurements. The strategy of inflating the occlusion cuff once initially, without taking a reading, seems not to have been tested. Neither have assumptions such as a single (initial) reading providing sufficient indication of a person’s toe pressure or that a reading from one foot would be similar to a reading from the contralateral foot. Some researchers compare the right and left feet, but if neither side is consistently higher than the other for all of the people tested, the differences between the feet will tend to cancel each other out and possibly conceal significant differences that exist between feet with higher versus lower pressure.
In the research reported in this article, the nature of TBIs in a sample of people arguably regarded as likely to have PAD on the basis of low initial TBI values on at least one foot (refer to the ‘‘Participants’’ subsection for details) was explored as part of a larger study assessing the effectiveness of glyceryl trinitrate for increasing blood supply to the feet of people with subnormal toe blood pressures. Three issues were addressed in the present study: 1) whether successive TBI readings taken on a single occasion differ noticeably from each other and, if so, by how much; 2) which reading, or readings, taken on a particular occasion might indicate a person’s TBI(s) most accurately; and 3) whether significant differences exist in TBIs between the two feet.
Data were collected over 22 months, during which each participant was asked to attend a clinic on seven occasions, with approximately 1 month between visits. The Allied Health Clinic at Charles Sturt University (Albury, NSW, Australia) provided the study setting. Ethics approval was granted by the university’s Human Research Ethics Committee, and the trial was registered with the Australian New Zealand Clinical Trials Registry (trial number ACTRN12612000883819). Prospective participants were given information about the research, and those who agreed to take part provided signed consent.
Methods
Participants
Participants were new or continuing clients attending the university’s health clinic, referrals from local general practitioners, members of the local diabetes support group, and members of the public who responded to invitations in newspaper and television coverage of the project. Although additional inclusion criteria applied to the larger study, the primary inclusion criterion relevant to this component of the research was that participants have at least one of three TBIs on either foot at baseline of 0.65 or less if a standard 25-mm-wide cuff was used or 0.85 or less if a 15-mm-wide cuff was used. The TBI cutoff value of 0.65 or less was selected because it is recommended as the cutoff point for suspecting PAD in the manufacturer information that accompanies the instrument used to obtain TBIs in this research (SysToe; Atys Medical, Soucieu en Jarrest, France), and it was also the midpoint of the TBI cutoff values for PAD in 12 studies listed in a comprehensive review by Høyer et al.[
13] The 0.20 TBI difference between 0.65 and 0.85 associated with the use of large or small cuffs was calculated based on the average difference of 23.57 mm Hg between toe systolic readings using 25-mm and 15-mm cuffs reported by Pa˚ hlsson et al.[
40] (The TBI value of 0.20 was obtained by dividing 23.57 by 120, regarded as an average brachial systolic blood pressure.) Additional inclusion criteria were age 18 years or older, both feet with either the hallux or the second toe capable of accommo-dating occlusion and sensor cuffs, and the ability to lie supine for approximately 20 minutes. People who had pedal manifestation of Raynaud’s disease were also included. The exclusion criteria were leg wounds above the ankle; brachial pressure greater than 160 mm Hg systolic or greater than 110 mm Hg diastolic; brachial pressure less than 100 mm Hg systolic; or heart failure associated with myocardial insufficiency due to obstruction, hypertrophic cardiomyopathy, aortic or mitral stenosis, or pericarditis.
To analyze measurements that were likely to be typical of those seen in routine clinical practice, no constraints were placed on, or records taken of, variables such as time since most recent food, caffeine, or alcohol consumption; most recent medication, cigarette(s), or exercise; nature of footwear; or time of day. Given the specific issues under investigation and the design of this research, as well as the anticipated analyses, those variables were unlikely to have confounded the results. Approximately 340 people were screened, from whom 119 were recruited based on the inclusion and exclusion criteria. Of these individuals, 22
(18.5%) were subsequently either lost to follow-up (n¼ 21) or not included in the final analyses because of noncompliance with treatment in the main study (n ¼ 1). Data from 97 participants were retained and therefore available for analysis. No analyses reported in this article were related to treatment or placebo effects in the main study.
Measurements and Instruments
Brachial systolic pressures (BSPs) were obtained from a single reading on the left arm with an automated sphygmomanometer (HEM-7221; Omron, Kyoto, Japan). Skin temperatures were assessed with a thermometer (Exergen Corp, Watertown, Massachusetts) at the apex of the hallux, the medial eminence of the first metatarsophalangeal joint, and the dorsomedial eminence of the cuneonavicular joint of the midfoot. A commercially available foot warmer (Homeart, Melbourne, Australia) was used if skin temperatures were less than 208C or if initial toe pressures were unprocurable. The TBIs were obtained with an automated photoplethysmography device, the SysToe, previously validated for toe pressure measurement.[
31] A 25-mm occlusion cuff on the hallux was used whenever possible because Pa˚ hlsson et al[
40] found that this cuff size was most likely to indicate toe blood pressures accurately. However, if toes were too small to accommodate both the 25-mm occlusion and sensor cuffs, a 15-mm occlusion cuff was used.
Procedure
Baseline TBIs were obtained during the first visit as part of determining participants’ eligibility for inclusion in the study. In an initial 10-min rest period during which each participant was placed in a supine position with one or two head pillows but with heart, arms, and feet on the same horizontal plane, skin temperatures were assessed and the foot warmer was applied if deemed necessary, which occurred on only four occasions. Brachial blood pressure was then obtained, and three TBIs were taken from each foot, with approximately 1 min between the readings on each foot, during which cuffs were left in position. All readings (ie, from both feet) on each occasion were obtained within a 15-min period. Occlusion cuffs were inflated to a maximum of 300 mm Hg before being deflated slowly. The systolic reading was automatically determined by the SysToe as the point at which the arterial waveform reappeared. All readings were obtained from halluces with one exception: a participant for whom the second toe was used on one foot because its hallux had been amputated. For each person, the foot with the lowest set of TBIs at baseline was identified as the lower baseline TBI (LbTBI) foot, and the other foot was identified as the higher baseline TBI (HbTBI) foot.
At a second visit, 4 to 6 weeks after the baseline visit, detailed demographic, medical status, and medical history information was collected. During that visit, TBI readings were not taken from members of the two intervention groups and most members of the placebo group in the larger study because of the additional time needed to explain how they were to comply with requirements for the remaining 5 months of that study (not of relevance in the research presented in this article). However, TBI readings were obtained from some members of the placebo and control groups if time was available. Visits 3 to 7 were routine repeat monitor-ing visits during which three TBI readings were obtained, if procurable, from each foot using the same procedures that had been used at baseline and visit 2.
All of the data, including TBIs, were collected by one of us (S.M.) with the exception of a small number of data collection episodes (,1%) during which final-year podiatric medical students were supervised. The temperatures of the test environment were always within the range of 218 to 258C.
Because the original intention was to take three TBI readings from each foot of the 97 participants at each of six visits, theoretically 3,492 TBI readings would have been obtained. As a result of the extraordinary TBI readings taken with some placebo and control group members at visit 2, more readings were obtained, but readings could not be procured on a small number of other occasions. The net result was a total of 3,542 TBI readings being available for analysis. Of the 97 participants, 56 (58%) had a 25-mm cuff on both feet and 39 (40%) a 15-mm cuff on both feet. Of the remaining two participants, one had a 25-mm cuff on the hallux of one foot and a 15-mm cuff on the hallux of the contralateral foot. The other was the person with whom readings were taken from the hallux of one foot with a 25-mm cuff and from the second toe of the other foot with a 15-cm cuff.
Data were analyzed using IBM SPSS Statistics for Windows, Version 20.0 (IBM Corp, Armonk, New York). Raw data, boxplots, frequency distributions, and histograms were inspected visually. Descriptive statistics were used to obtain means, standard deviations, minimum and maximum values, per-centages, absolute values, difference scores, per-centiles, and intraclass correlation coefficients (ICCs; all 3,1 [two-way random model, single measures], absolute agreement). The paired-samples t test was used, in which results were regarded as statistically significant when two-tailed P values were less than 0.05 or were altered to effect a Bonferroni adjustment in multiple comparisons, and confidence intervals (CIs) were set at 95%. Participants’ records were retrieved to enhance interpretation of some results.
Results
Participants
Participants’ ages ranged from 38 to 91 years (mean 6 SD, 70.4 6 9.5 years), and 59% (n ¼ 57) were men. Only 6% (n ¼ 6) were currently smoking, but 43% (n ¼ 42) had smoked at some time previously, and 60% (n ¼ 58) had diabetes. Apart from a low TBI reading on at least one foot (the primary inclusion criterion on the basis of which participants were regarded as likely to have PAD), 45% of participants had at least one additional vascular-related condition, and among them 21% had undergone cardiovascular surgery, 12% lower-limb vascular surgery, and 7% both kinds of surgery. Fourteen percent had experienced a myocardial infarction, and 9% a cerebrovascular accident. Most participants (78%; n ¼ 76) were taking at least one type of antihypertensive medication, 63% (n ¼ 61) were taking hypolipidemic medication, and 85% (n ¼ 82) were taking additional medications. The mean 6 SD body mass index (the weight in kilograms divided by the square of the height in meters) was 29.5 6 6.0 (range, 19–50).
Initial Description of TBI Values
Five of the 3,542 TBI readings were very high and regarded as spurious, ranging from 1.38 to 2.17. These outliers were removed from the data set. Differences among the first, second, and third TBI readings were then investigated to determine how these readings were related to each other and whether a single reading (and if so, which one), or a combination of readings, could subsequently be regarded as providing the most valid representation of a participant’s TBI.
Direction of Differences Between Readings. Initially, the direction of any differences among the three readings was explored by inspecting data from all of the visits—three sets of approximately 1,180 pairs of observations (there were some missing data in addition to the five extreme outliers already excluded).
The results revealed that none of the readings within each set of three was consistently either higher or lower than the other two. Depending on the comparison, 5% to 8% of paired readings were equal to each other. However, in 42.5% of cases the first reading was higher than the second, and in 44.0% of cases it was higher than the third; the second reading was higher than the third 44.3% of the time and lower 47.5% of the time. This lack of consistent direction in differences among the three readings is evident in
Table 1 where entries relate to the three successive readings on each foot at baseline. There the pattern of mean values on the two feet indicates that the location of a particular reading within the sequence of three readings was not associated with consistent differences in direc-tion relative to the other two readings.
Extent of Differences Between Readings. The extent to which the three readings differed from each other, although apparently minimal given the entries in
Table 1, was then examined in detail. Our interest in this arose from the expectation created by Pe´rez-Martin et al[
31] that the first reading would be different from subsequent readings and that the subsequent readings would be sufficiently similar to each other that they could be averaged to obtain a representative TBI value. The initial analyses involved paired-samples
t tests in which the three readings at baseline were compared with each other. These analyses were based on the data that are summarized in
Table 1. Because we were interested a priori in whether, for each foot, those three specific comparisons might yield different results, repeated-measures one-way analyses of variance were not conducted in advance of these
t tests because those analyses of variance would have been superfluous. Instead, a Bonferroni adjustment to protect against type 1 errors was applied, resulting in a critical
P , .017 for each set of three comparisons.
All six t tests yielded statistically nonsignificant results, with P . .021. The only comparison that was statistically significant according to the con-ventional criterion of P , .05 indicated that the second reading was significantly higher than the third on the HbTBI foot in the 95 participants from whom both of those readings could be obtained (t94 ¼ 2.32, P ¼ .022 [95% CI, .00–.04]). However, given that the respective means were similar at 0.70 and 0.68, and the 95% CI was narrow, this difference need not be regarded as clinically noteworthy—a conclusion that accords with this comparison not being statistically significant under the Bonferroni adjustment.
To explore the nature of the data differently, absolute values of differences across the trial period between readings 1 and 2, readings 1 and 3, and readings 2 and 3 were calculated—again approximately 1,180 comparisons in each case. The biggest discrepancies occurred between readings 1 and 3 (mean discrepancy, 0.09), followed closely by the discrepancies between readings 1 and 2 (mean discrepancy, 0.08) and the discrepancies between readings 2 and 3 (mean discrepancy, 0.07). Analysis of percentiles revealed that most pairs of readings were within 0.10 of each other, but an absolute difference greater than 0.10 occurred in 28% of the comparisons between readings 1 and 2, in 31% of the comparisons between readings 1 and 3, and in 18% of the comparisons between readings 2 and 3. An absolute difference of 0.20 or more occurred in 7% of the comparisons between readings 1 and 2, in 10% of the comparisons between readings 1 and 3, and in 5% of the comparisons between readings 2 and 3.
Together, these results indicate that there are no statistically significant differences among the three readings and that three TBI readings taken from a foot on a single occasion are usually, but by no means always, within 0.10 of each other. Therefore, as a general rule, any one of three readings from one foot might be as satisfactory as either of the other two because none of them seems to be particularly, or consistently, different from the others. However, conversely, and of importance, any one of those readings does, on occasions, differ noticeably from at least one of the other two.
This was demonstrated more clearly by examining the ICCs of TBIs from each foot separately at baseline. The ICCs between readings 1 and 2, readings 1 and 3, and readings 2 and 3 were 0.80, 0.75, and 0.86, respectively, for the LbTBI foot and 0.81, 0.80, and 0.88, respectively, for the HbTBI foot. These values all lie at or above the ICC value of 0.75 that Portney and Watkins[
42] regard as adequate to indicate the existence of a relationship between two variables, but they are all below the value of 0.90 that Portney and Watkins and Nunnally and Bernstein[
43] regard as demonstrating reasonable similarity for clinical situations. In this context, therefore, there is sufficient discrepancy between the readings for them not to be regarded as always interchangeable as well as for any single reading to be inaccurate or unrepresentative. A closer inspection of the TBI values seemed to be warranted.
Highly Inconsistent Participants
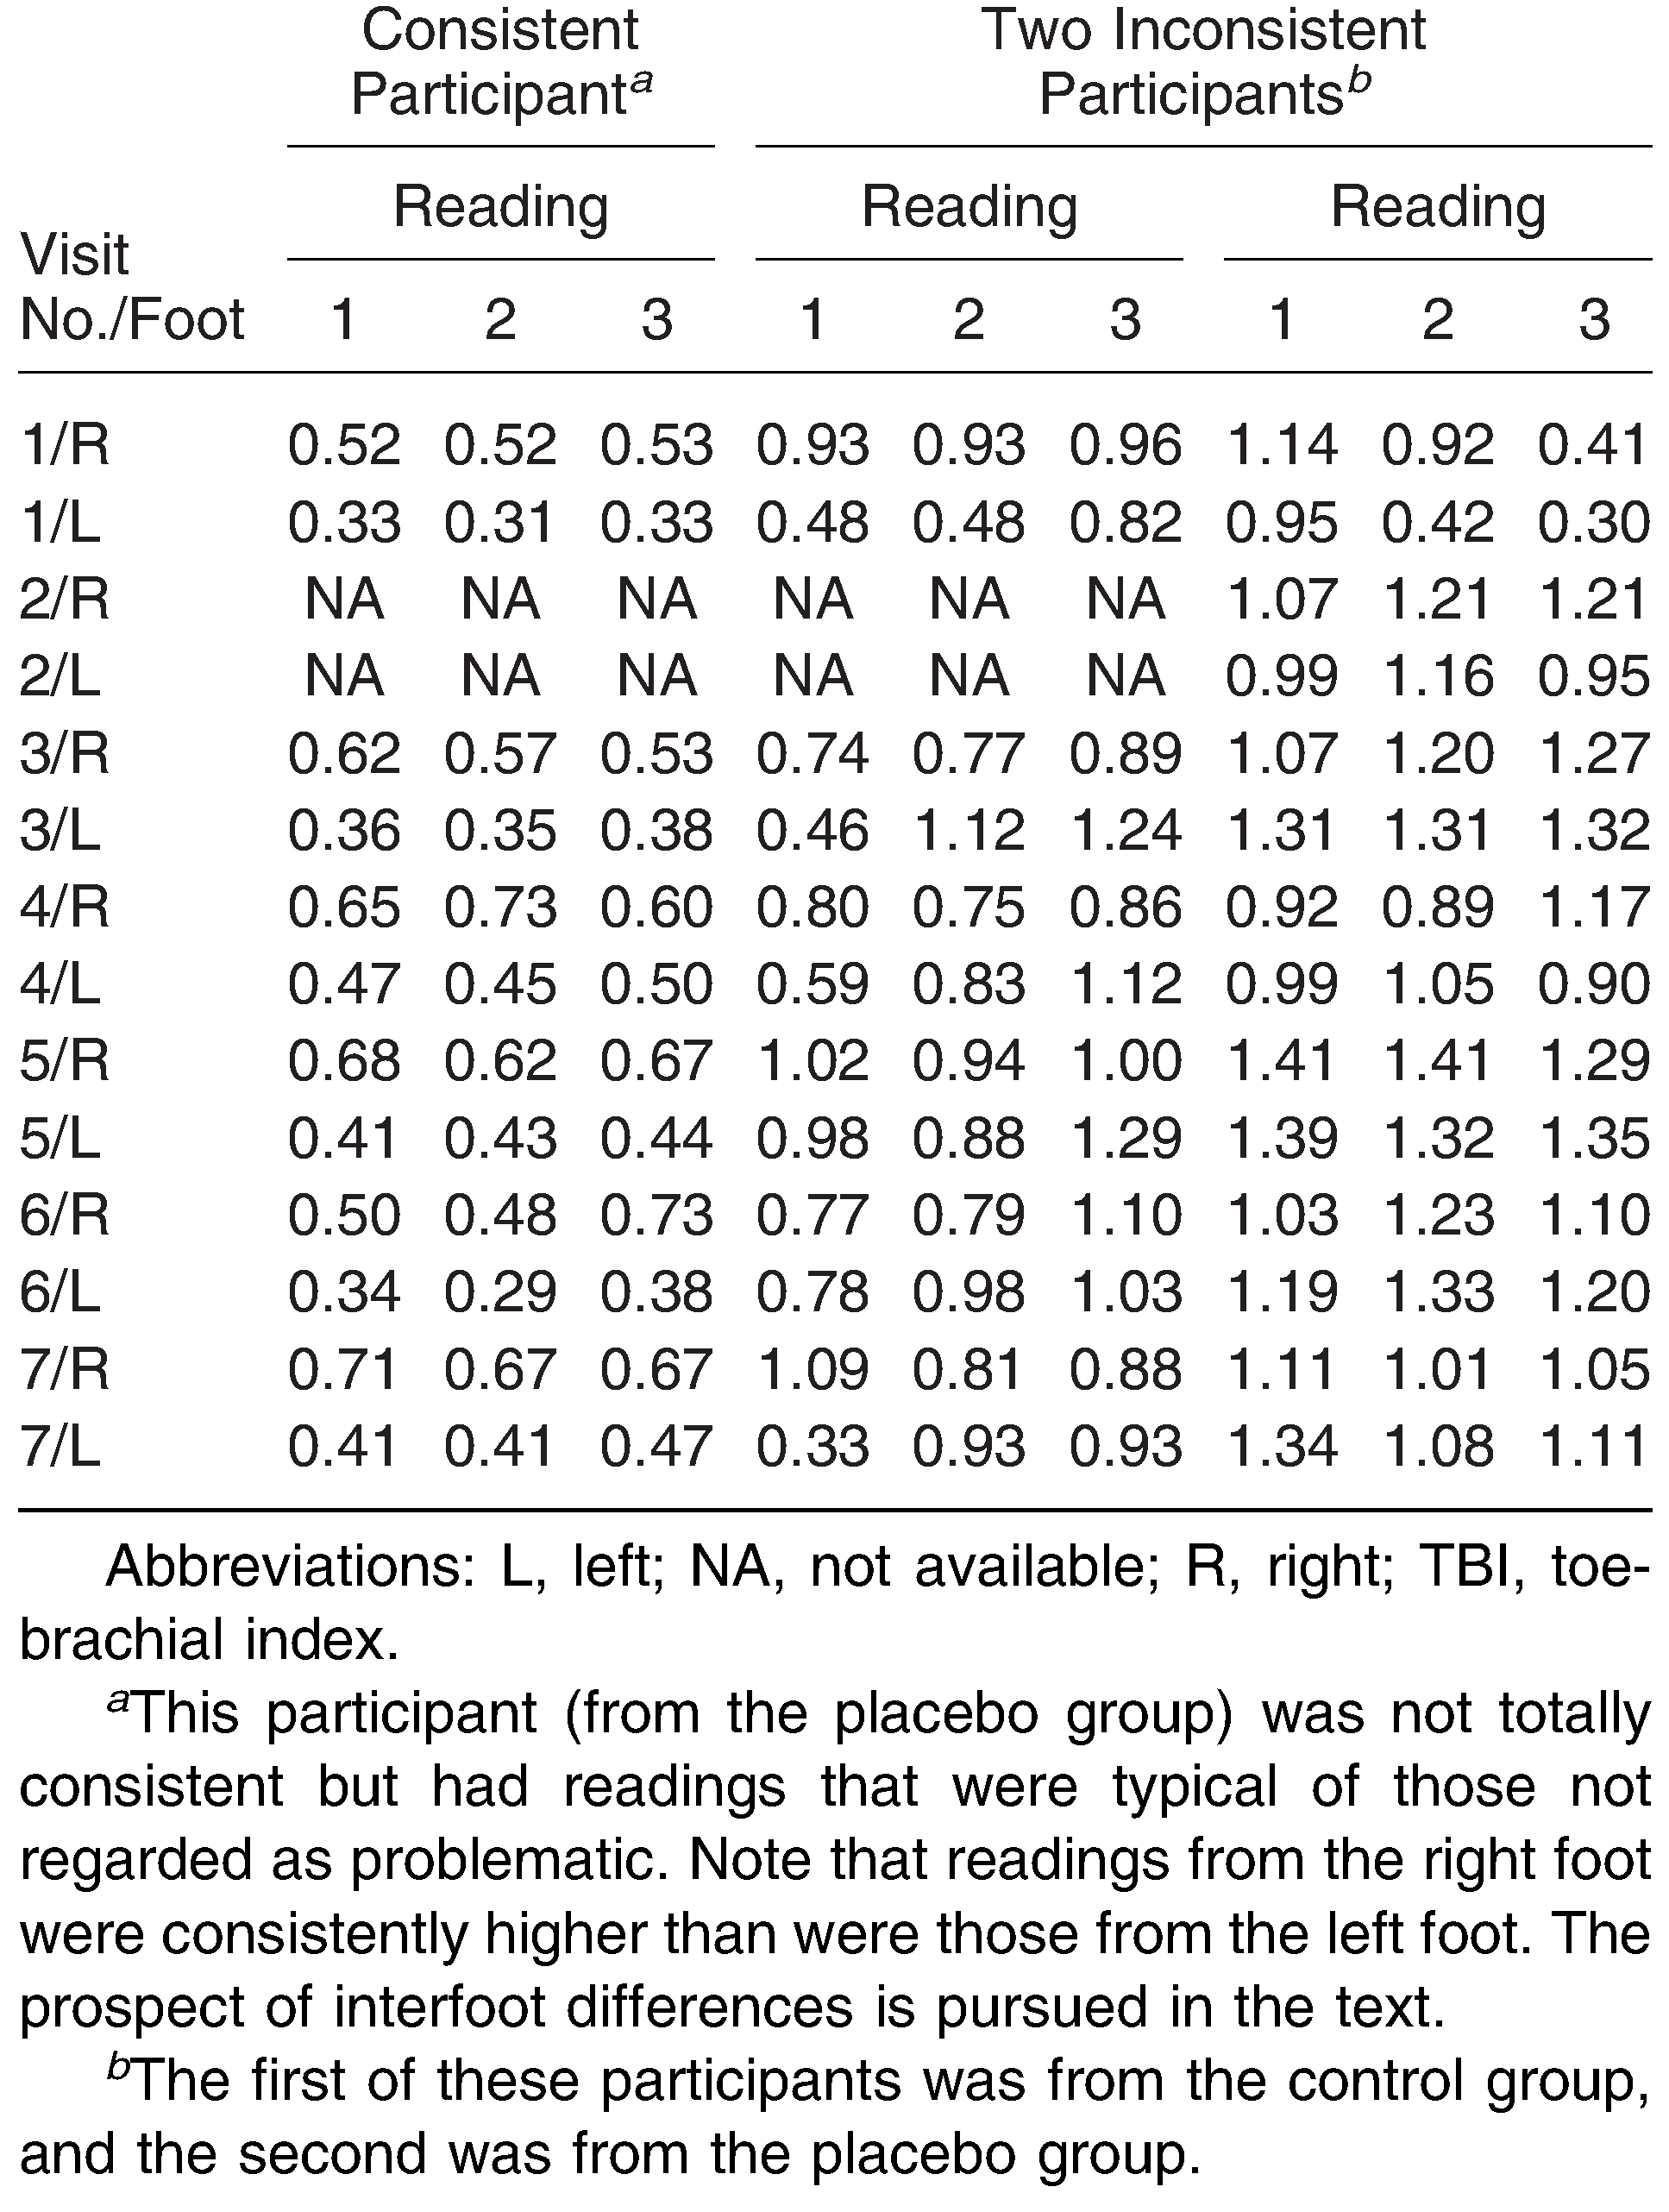
To obtain a more detailed sense of the TBI patterns and discrepancies in the data, all 3,542 readings were scanned visually and inspected using boxplots, frequency distributions, and histo-grams. This revealed that, as anticipated, for most participants there were no noticeable differences in the pattern of readings from either foot on the same day or between visits (although consistent differences between the two feet on successive visits were often apparent). However, the readings from some participants contained large discrepancies—often comprising data outliers, but some-times inliers—within the three readings from a particular foot on different visits or between the readings from contralateral feet on different visits. Fourteen of the 97 participants seemed particularly prone to these variations. For example, they had discrepancies of 0.20 or greater among the three readings on a particular foot on at least one-third of the visits at which TBI data were recorded, or on some visits all three readings for the LbTBI foot were much lower relative to the three readings on the HbTBI foot than they were for most other visits.
Table 2 has entries that illustrate how TBI readings from a relatively consistent participant compared with readings from two of the TBI-inconsistent participants. When the 14 TBI-inconsistent participants’ records were checked, probable reasons for high variations in blood pressure were found in most cases. For example, three of these people acknowledged irregularity in taking their prescribed antihypertensive medicine during the study, and four others were prescribed two or three antihypertensive medications, indicating more complex hypertensive disease. Four had also been diagnosed as having atrial fibrillation. Fifteen additional participants exhibited unusual, but less inconsistent, TBI patterns. Their records were consulted, and for at least some of them there were possible, and sometimes multiple, explanations for the TBI inconsistencies: Eight of them had a history of cardiac disease, seven had respiratory diseases, and three had severe chronic neuropathic pain.
Seeking a Valid TBI Measurement from Among Three Readings
The previous results did not indicate clearly which TBI reading, or readings, should be used to achieve a valid measurement. The Pe´ rez-Martin et al[
31] strategy of averaging the second and third readings was tested as an initial solution. This immediately revealed outcomes that were atypical for some participants, particularly if one of those readings was unusually high or low relative to the other two, thus demonstrating that it was not advisable to average the second and third TBI values regardless of any differences in their magnitude. Subsequent examination of the data indicated that simply averaging any two of the three values, or averaging all three values, could be misleading. Therefore, a different solution was sought. While taking the readings, despite attempts to maintain participants in a rested position, it had been apparent that even slight movement or perturbation on a participant’s part (including coughing or sneezing), a participant’s speaking, or engaging a participant in conversation sometimes produced inflated readings. In light of that, for each foot the single lowest reading of the set of three TBIs was determined as most likely to be valid because it seemed to have been least influenced by artifacts of measurement.
Although not related to the issues addressed in this research, descriptive statistics from those readings are provided in
Table 3 for each foot at baseline, with separate entries depending on the size of cuff that was used. The higher readings associated with small cuffs are inevitably a result of the higher TBI inclusion criterion cutoff of 0.85 vs 0.65 that had been set if the smaller cuffs were used when recruiting participants for the study (13 participants with small cuffs had TBI readings .0.65), but they could also result from higher toe blood pressures being produced by those cuffs.
Discussion
One of the strongest conclusions arising from this research is that neither accurate nor consistent measurement of TBIs can be assumed even when using automated devices. A small number of extreme outliers can occur, and there are also anomalous fluctuations both outside and within the range that might be regarded as typical for a specific population, in this case a population with subnormal toe pressures. Assuming that central blood pressure, as indicated by the BSP, is stable over 10 to 15 minutes and is associated with minimal instrumentation error, the TBI inconsistencies within each occasion in this research could arise from two sources. (Interrater consistency was of minimal concern because almost all of the readings were made by the same rater, and intrarater consistency was guaranteed by cuffs being left in position for each set of three readings.) The first source of inconsistency is instrumentation errors associated with the SysToe. These errors might occur because a device that is designed to obtain toe pressures needs to be sensitive for detecting blood supply in the small arterioles of the periphery and, as a consequence, it might be subject to subtle signals that could cause inaccuracies. Second, inconsistencies could occur because toe pressure readings fluctuate within short timespans due to actual variations in peripheral supply. Although temporary notable TBI increases seem to have been caused by perturbations of some participants, these perturbations had been avoided as much as possible, and, therefore, some of the variation is likely to have occurred naturally.
This research also demonstrates that taking a single reading from either foot courts too much uncertainty given the less than clinically acceptable ICCs obtained among the readings for each foot. Furthermore, the significant difference between the two feet indicates that taking readings from only one foot is inadequate for making assumptions about bilateral blood supply to a person’s lower periphery or status in relation to PAD.
Apart from the intrafoot and interfoot inconsistencies in readings, this research raises a variety of other issues about the validity of TBIs and how they might best be obtained. In this study, BSPs were determined on the basis of a single reading taken from only the left arm. In retrospect, better practice could have involved obtaining at least two BSP readings from each arm, averaging them for each arm, and using the higher of the averaged readings as a more accurate indication of central blood pressure. Furthermore, as acknowledged previously in this article, this research was predicated on the assumption that BSP is stable across a brief timespan. If that assumption is well founded, the TBI could provide an appropriate global adjustment for peripheral blood pressures—particularly when monitoring pedal blood pressure at different points in time—because, as the denominator of the TBI, BSP can reduce the confounding effect of temporal changes in systemic blood pressure. However, if BSPs vary even within a brief period, the TBI values that were recorded in each visit in this research, although mathematically akin to TBIs, are likely to be more an indication of TSPs than of TBIs because all readings on each particular occasion had a common denominator based on the single BSP reading. Furthermore, if BSPs are not only unstable over brief periods of time but are also unreliably related to peripheral blood pressure, their variability would seriously jeopardize the usefulness of TBIs, and TSPs might be more informative—a possibility that has been considered by other researchers.[
12,
36] The preference for TSPs over TBIs is supported by evidence of greater variability of BSPs compared with TSPs, particularly in people who have diabetes.[
35,
36,
44,
45]
The strategy adopted in this research of using the lowest of three readings was an uncomplicated attempt at achieving a valid TBI. However, more painstaking but definitive strategies are likely to be preferable. One of these might involve taking two readings of both BSPs and TSPs and, for each, averaging them if they are similar to each other, but if they differ by a specified amount to take additional readings and make a judicious decision about which ones should be averaged—and to do so for each foot separately and with BSPs and TSPs assessed simultaneously. To a large extent, this conforms with the procedures used by some researchers.[
32,
33,
34] Furthermore, the recommendations by some researchers[
3,
4,
12] that toe pressure measurements be taken on more than one occasion is supported by the fluctuant nature of TBIs found in 29% of the participants in this study.
The very small average differences that were typical between the first, second, and third readings in this research, as well as the inconsistent pattern of differences, indicate that postocclusive reactive hyperemia was not occurring in this study population and, therefore, that normal endothelial function was impaired. This concurs with the findings of Englund et al[
46] in which, compared with healthy controls, people with PAD had both a blunted and a delayed postocclusive hyperemic reaction. The inconsistent pattern of differences also indicates that vasospasticity was not occurring in this sample as a result of cuff occlusion.
The influence of cuff width on TSP, and therefore TBI, readings was not explored in this study but seems to have been underappreciated in the literature to date. This issue has become even more pertinent because some recently available automat-ed units have twin occlusion and sensor cuffs, and the default 25-mm occlusion cuff may be too wide for approximately 50% of the population if the sample used in this study is representative. Re-search is needed to determine the circumstances under which, and the extent to which, different cuff widths produce different outcomes, including whether the inherent magnitude of the TSP inter-acts with the cuff widths (small cuff widths might have greater effects on higher TSPs than on lower TSPs, or vice versa), whether variations in the anatomical structure of toes produce inconsistent differences in TSPs from different cuff widths, and even whether cuffs supplied with different instruments produce different outcomes. Compounding these uncertainties is the finding by Pa˚ hlsson and colleagues[
39] that toes with smaller circumferences have lower blood pressures, and the situation is made more complex because smaller occlusion cuffs are likely to be used with small toes, but those cuffs inflate the TSP readings. Without more knowledge about the effect of cuff sizes and the correlates of toe structure and size, use of TSPs and TBIs for fine-tuned screening and monitoring purposes will be hampered in terms of sensitivity and specificity, and normative TBI values will be difficult to establish. Whether it was appropriate in this research to add 0.20 as a uniform TBI adjustment in the inclusion criteria associated with use of 15-mm-wide cuffs is a matter of conjecture. A uniform adjustment might be acceptable on a group basis because overadjustments for some people in a group are likely to be counteracted by underadjustments for others. However, applying the same adjustment to all individuals might result in undesirable distortions and inappropriate decision making.
Issues of pretest warming were also not explored in this study and require further research. Although pretest warming is recommended to give the most accurate results,[
13] the decision not to use warming in this study except when skin temperatures were less than 208C or TSPs were unprocurable was made to duplicate the clinical situations in which TBIs would usually be taken and to give prominence to TBIs that were most likely to be typical of participants rather than to TBIs that would be produced under optimal, but artificial, circumstances.
The previously mentioned considerations demonstrate that the TBI values obtained in research and clinical situations are likely to be influenced by a range of variables. If these are not taken into account, or are not controlled for, they might produce invalid outcomes and could make a variety of comparisons unnecessarily speculative and pos-sibly pointless. At least standardization of some TBI procedures seems common, for example, the preparatory recumbency for approximately 10 min in an ambient temperature of 218 to 258C. However, a variety of other variables are not standardized, and more research is needed to determine which of these are of importance. The TBI could also depend on the status of a specific person’s vascular tree, particularly regarding location(s) and extent of any occlusions or stenoses, and there are issues concerning the hemodynamics of blood pressure versus blood flow for determining adequacy of peripheral perfusion. Referring to the ABI, Caruana et al[
47] commented that ‘‘there is more ... than first meets the eye and that its apparent simplicity may beguile the unwary.’’(p448) This also seems to be true of the TBI.
The significant interfoot TBI differences found in this study are important for two reasons. First, as already pointed out, they indicate that toe pressure readings should be obtained from both feet, and ideally on more than one occasion. Second, in people with PAD, the interfoot differences in TBIs might offer a stronger link to cardiovascular disease (CVD) risk status and mortality than has been found for interarm pressure differences. In a systematic review and meta-analysis, interarm differences in BSPs greater than 15 mm Hg were high in specificity but low in sensitivity in relation to cardiovascular mortality in people with preexisting CVD risk scores.[
48] Insufficient literature exists to determine whether a difference in vascular supply between feet is a sign of pathology or a normal occurrence, but interfoot differences in ABIs of 0.15 or greater have been associated with all-cause and cardiovascular mortality.[
49] Using only one arm’s systolic blood pressures could have missed important interarm differences in this cohort, but, in their absence, interfoot differences might have served as equally, or more, valuable markers of CVD risk and mortality.
Conclusions
This research raises issues more than it provides answers. Accurate and consistent TBI readings cannot be assumed for people with subnormal toe pressures, and taking only a single reading or indiscriminately averaging readings is inadvisable. At a minimum, two readings and, if they are discrepant by more than 10 mm Hg, additional readings, are recommended for each arm and foot, ideally on several occasions, and careful consideration should be given to determine the most representative reading for each arm and foot and whether simultaneous measurement of brachial and toe pressures is desirable. Brachial blood pressures, cuff sizes, and other prospective sources of inaccuracy or distortion should not be ignored, more research is needed to investigate their influence, and standardized protocols for obtaining TBIs are recommended. Interfoot TBI differences may pro-vide an indication of increased risk of cardiovascular mortality and the use of systolic toe pressures alone is a logical direction for concentration of future research concerning quantification of pedal vascular supply because it avoids the inherent variability associated with indices involving brachial blood pressure, shown to be particularly fluctuant in some people, notably those with diabetes.