Next Article in Journal
Transformative Learning. Empathy and Multicultural Awareness in Podiatric Medical Education
Previous Article in Journal
Influence of Turnout on Foot Posture and Its Relationship to Overuse Musculoskeletal Injury in Professional Contemporary Dancers. A Preliminary Investigation
 
 
Journal of the American Podiatric Medical Association is published by MDPI from Volume 116 Issue 1 (2026). Previous articles were published by another publisher in Open Access under a CC-BY (or CC-BY-NC-ND) licence, and they are hosted by MDPI on mdpi.com as a courtesy and upon agreement with American Podiatric Medical Association.
Article

Navicula Drop Test Ad Modum Brody. Does It Show How the Foot Moves Under Dynamic Conditions?

by
Michael Skovdal Rathleff
1,*,
Rasmus Gottschalk Nielsen
1 and
Uwe G. Kersting
2
1
Orthopaedic Surgery Research Unit, Aarhus University Hospital–Aalborg Hospital, Sdr Skovvej 15, Aalborg 9000, Denmark
2
Center for Sensory-Motor Interaction, Aalborg University, Aalborg, Denmark
*
Author to whom correspondence should be addressed.
J. Am. Podiatr. Med. Assoc. 2012, 102(1), 34-38; https://doi.org/10.7547/1020034
Published: 1 January 2012

Abstract

Background: Understanding foot motion and function during activity is essential for clinicians because different foot types may require different treatment or rehabilitation strategies. Brody introduced the static navicular drop (ND) test, which was meant as a quick clinical test to estimate foot pronation during dynamic conditions. However, how well static ND predicts dynamic ND during walking has never been investigated. The purpose of this study was to investigate how well static ND corresponds to dynamic measures of ND during treadmill walking. Methods: A custom video analysis system was used to assess dynamic ND during treadmill walking. The ND test ad modum Brody was used to evaluate static ND. Results: Static ND showed a significant correlation with dynamic ND (r = 0.357, r2 = 0.127, P < .001). Navicular height at heel strike demonstrated a significant correlation with navicular height at the start position of static ND (r = 0.756, r2 = 0.571 P < .001). Minimal navicular height during walking was significantly correlated with the end position of static ND (r = 0.951, r2 = 0.904, P < .001). Conclusions: This study of asymptomatic individuals did not confirm that static ND can be used to individually predict dynamic ND during treadmill walking. It was demonstrated that the start position of Brody’s test is not well correlated with navicular height at heel strike, with this being the main reason for the weak relationship between static and dynamic ND measures.

Understanding foot motion and function during activity is essential for clinicians because different foot types may require different treatment or rehabilitation strategies. However, environmental limitations in clinical settings often restrict clinicians to simple static testing without the use of time-consuming functional foot assessments.
Methods for evaluating foot posture based on foot morphologic features are divided into anthropometric tests and visual inspection. Visual assessments demonstrated high variability and limited agreement between different examiners. [1] Therefore, Razeghi and Batt [1] suggested the use of anthropometric tests as a reliable tool for assessing foot function. Simple anthropometric tests can be performed by measuring the change in relative position of a skeletal landmark or a marker on the skin representing such a landmark from one position to another, eg, from a neutral to a loaded condition or a maximum excursion of a joint. Brody [2] introduced the static navicular drop (ND) test. The static ND test was meant as a quick clinical test to estimate foot pronation during dynamic conditions. However, it has never been investigated how well static ND predicts dynamic ND during walking. The purpose of this study was to investigate how well static ND corresponds to dynamic measures of ND with participants walking on a treadmill.

Methods

Participants

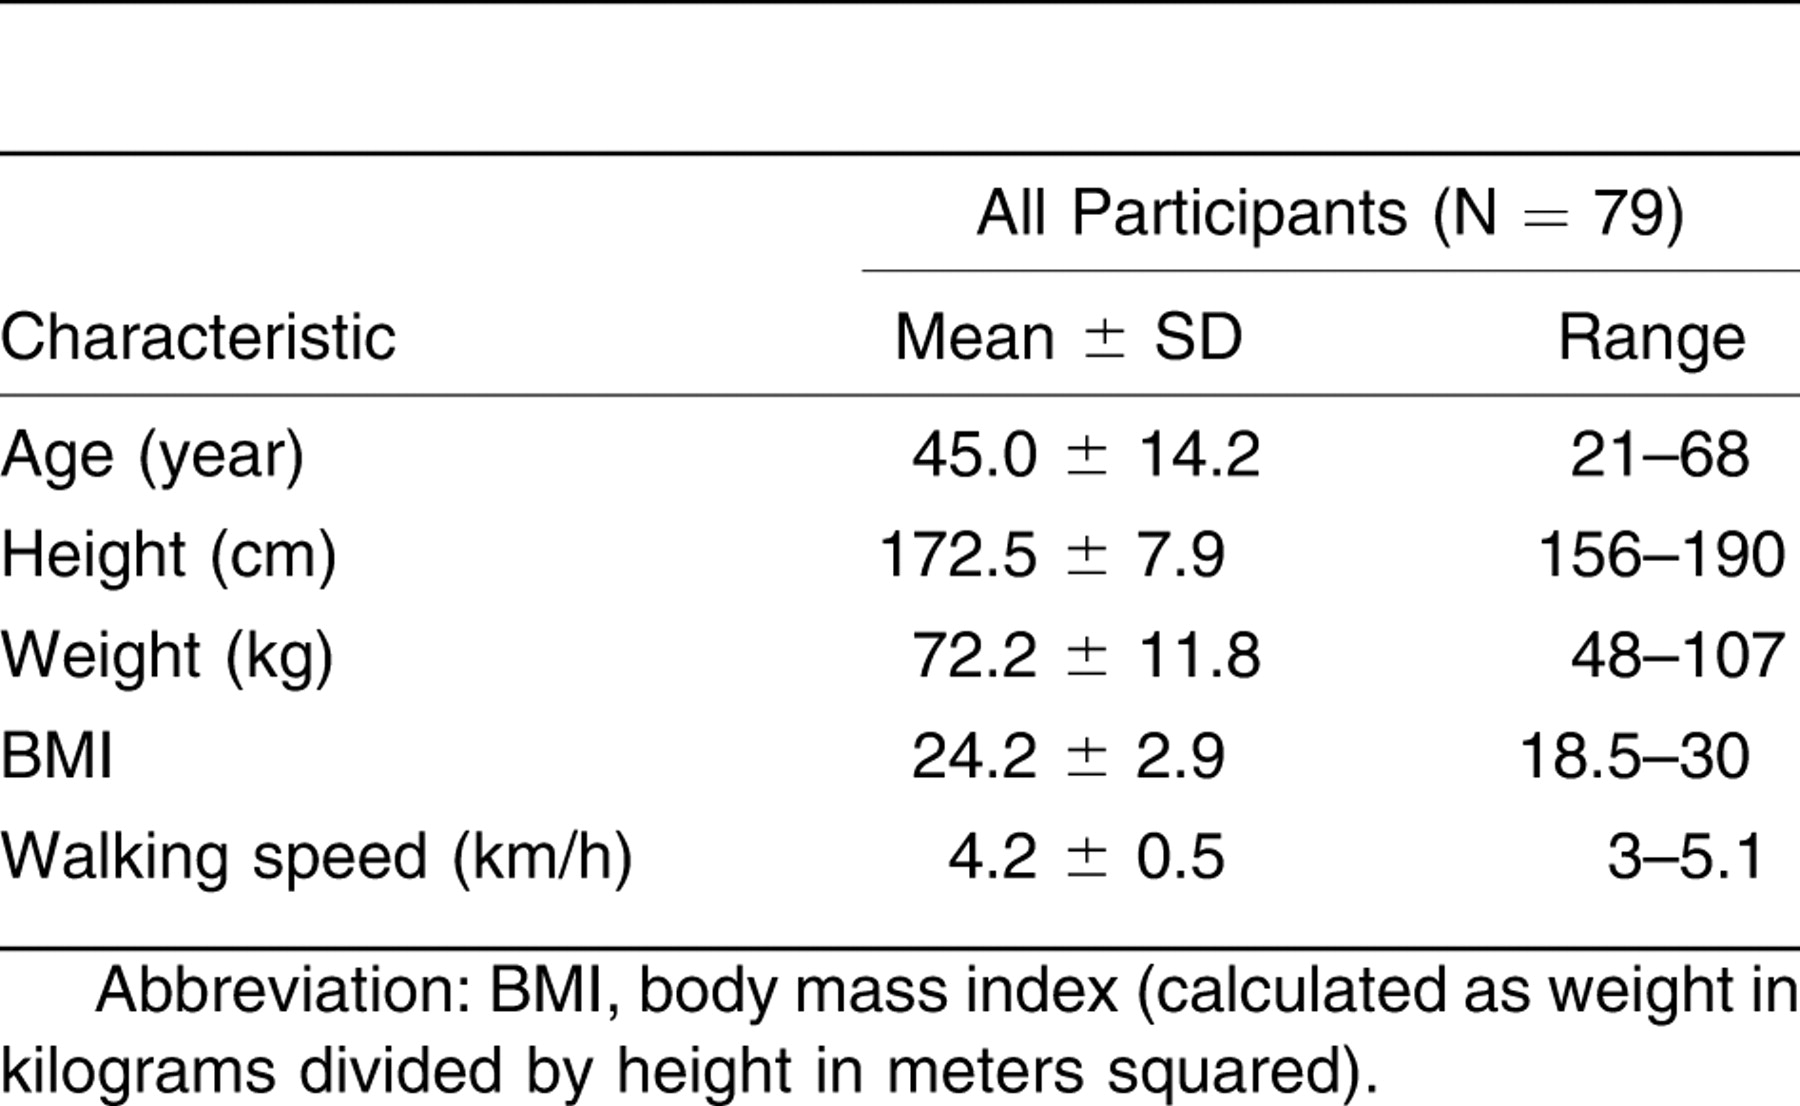
Seventy-nine healthy adults (42 women and 37 men) were randomly selected from the Danish Central Register. The anthropometric characteristics of the 79 individuals tested are presented in Table 1. The exclusion criteria were a body mass index greater than 30 (calculated as weight in kilograms divided by height in meters squared), neurologic and rheumatoid diseases, amputation, and inability to walk 10 min on a treadmill. The ethics committee in North Denmark Region approved the protocol for the study, and each participant signed an informed consent form before participating in the study.
Table 1. Characteristics of the 79 Study Participants
Japma 102 00034 g003

Instrumentation

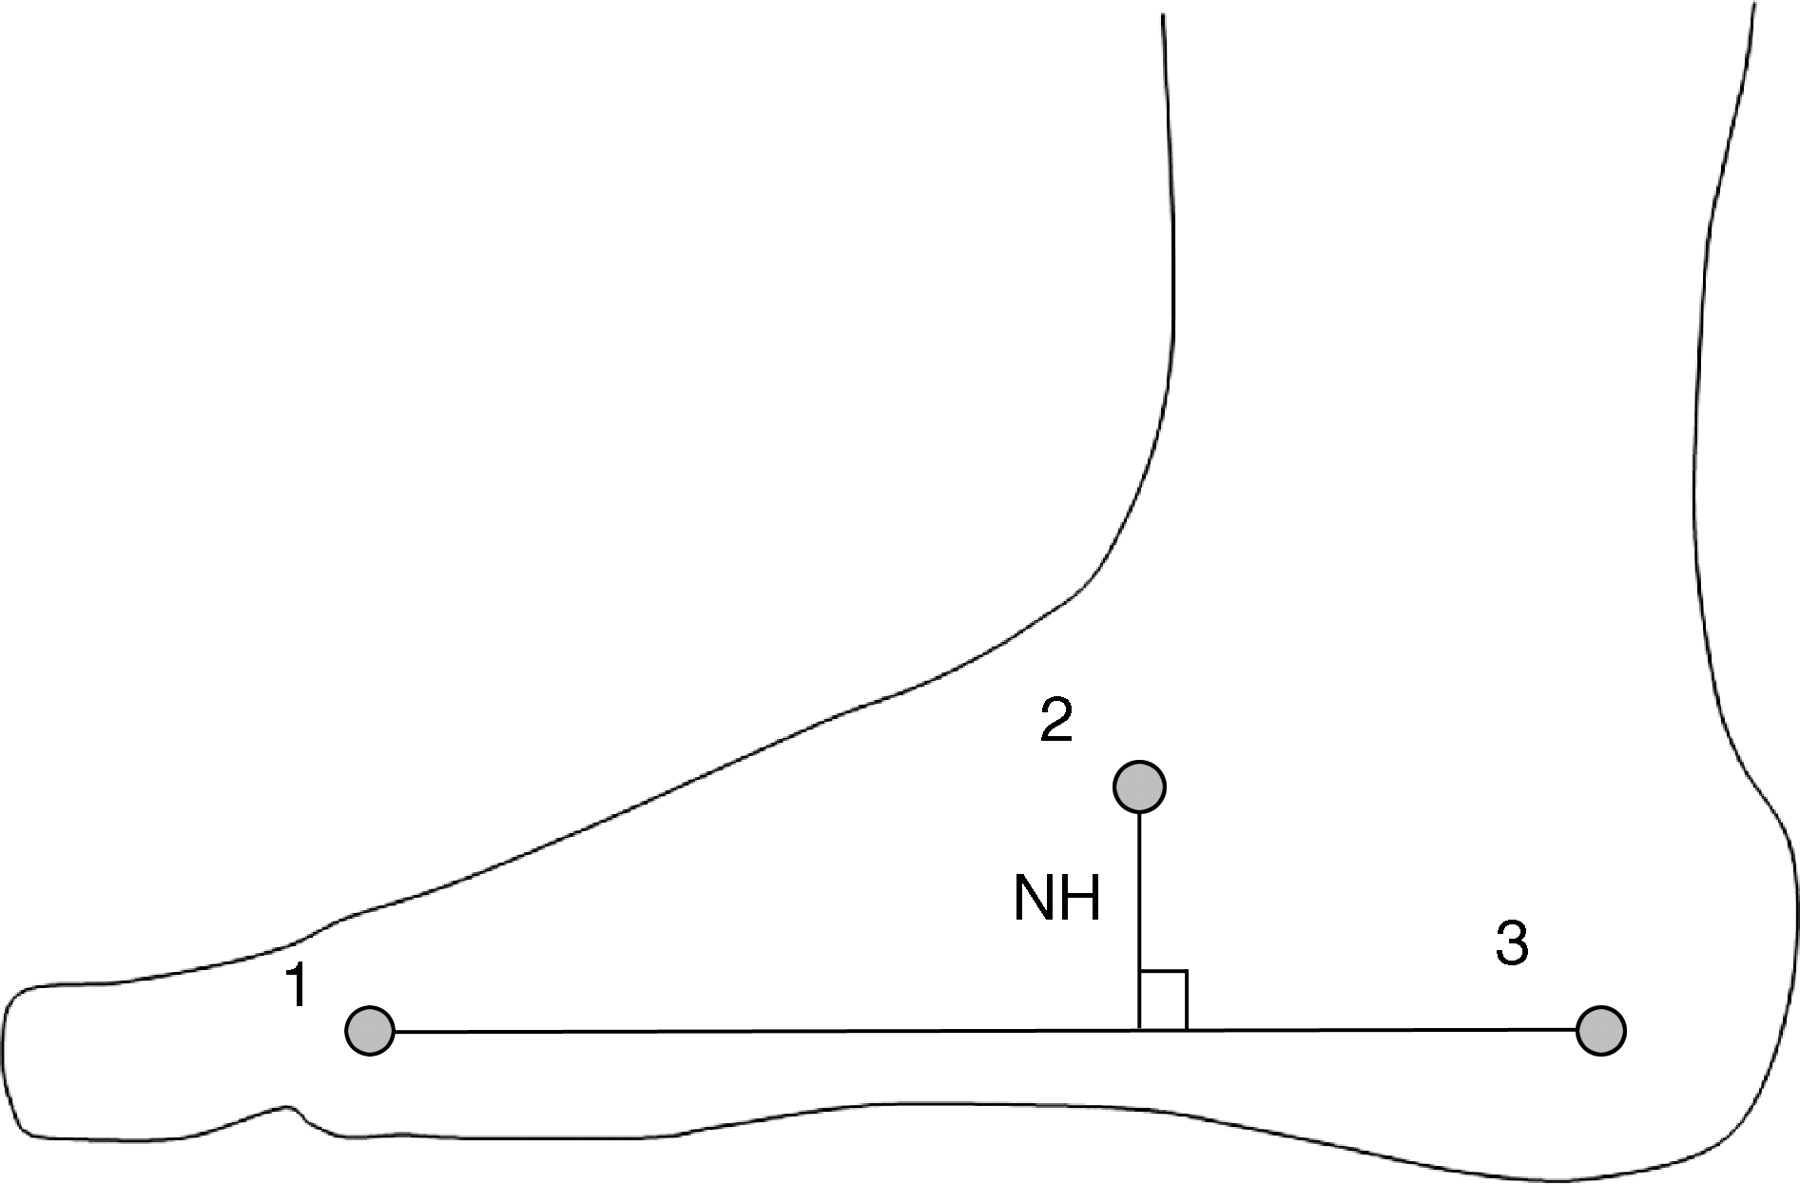
For marker attachment, participants were asked to stand in a relaxed position with straight knees and their weight distributed equally on both feet. The feet were placed with their medial borders parallel and 15 cm apart. Three flat retroreflective markers (13.5 mm in diameter) were placed on the left foot. Using a laser alignment device (Stanley Works, New Britain, Connecticut), marker 1 was placed on the center of the first metatarsal head and marker 3 was placed at the medial side of the calcaneus, both 19 mm above the floor. Marker 2 was placed on the navicular tuberosity (Figure 1). After marker attachment, the ND test ad modum Brody (static ND) was performed. This method has previously been described in detail by Brody. [2]
A video sequence analysis system was used to automatically identify the markers on the medial aspect of the foot during walking on a treadmill. The system consisted of a digital video camera (86-Hz, 12-mm lens) (Basler Scout; Basler Inc, Exton, Pennsylvania) and a powerful light. The camera was placed perpendicular to the orientation of the treadmill, 2.98 m from its center. Images were transferred to a computer via firewire interface (StreamPix; NorPix Inc, Montreal, Canada).
Participants were allowed at least 6 min of customization to the treadmill at a self-selected pace. [3] Recordings were taken for 20 consecutive strides. The center of the markers and their positions over time were determined using a MatLab routine (MatLab 7.0.4; The MathWorks, Nattick, Massachusetts). Precision and accuracy of marker position using the video sequence analysis system was previously determined to be less than 0.3 mm. [4]
Figure 1. Marker placement on the medial side of the foot. Marker 1: first metatarsal head. Marker 2: the navicular tuberosity. Marker 3: the medial side of the calcaneus, 1.9 cm above the floor. NH indicates navicular height.
Japma 102 00034 g001
On the basis of two-dimensional coordinates of the reflective markers on the medial aspect of the foot, the parameters were calculated. Navicular height was calculated as the perpendicular distance between the center of marker 3 and the line between the center of markers 1 and 2 (Figure 1). Dynamic ND was defined as the difference in navicular height at heel strike and the minimal navicular height during the stance phase. Heel strike and toe-off were manually determined in the video images of the first three steps. Subsequently, the MatLab routine applied a combination of distance and change over time criteria to automatically identify events for all steps in the video sequence.

Statistics

All of the data were normally distributed, and Pearson product moment correlations were used to determine the relationship between the different measurements. All of the statistical analyses were performed with Stata version 10.1 (StataCorp LP, College Station, Texas).

Results

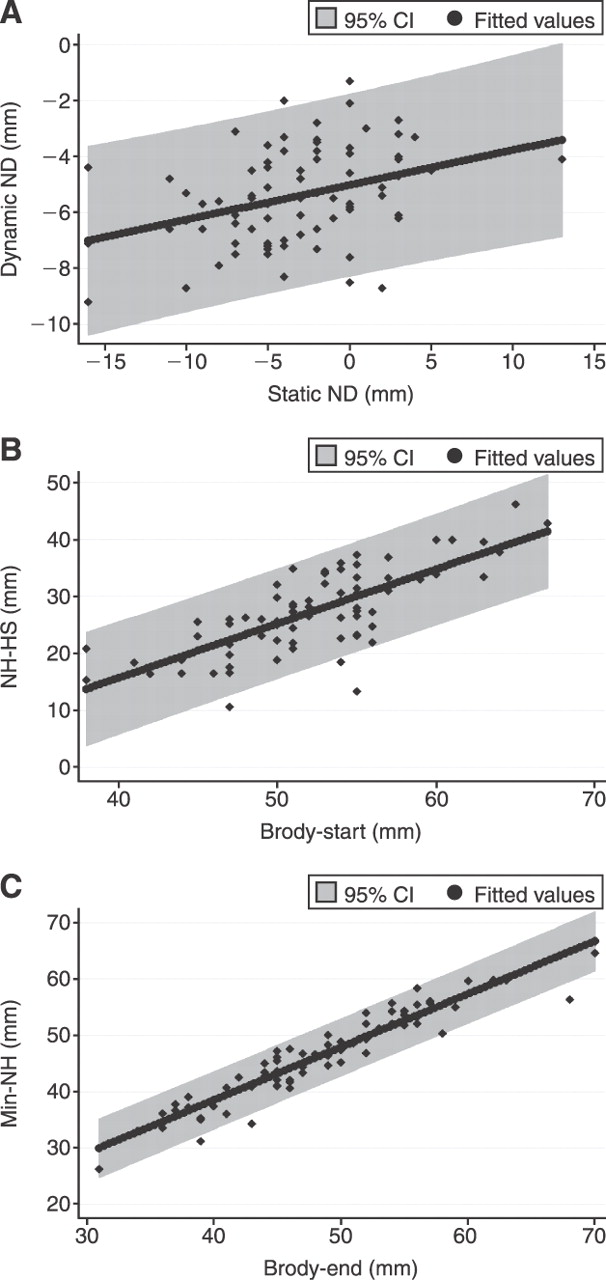
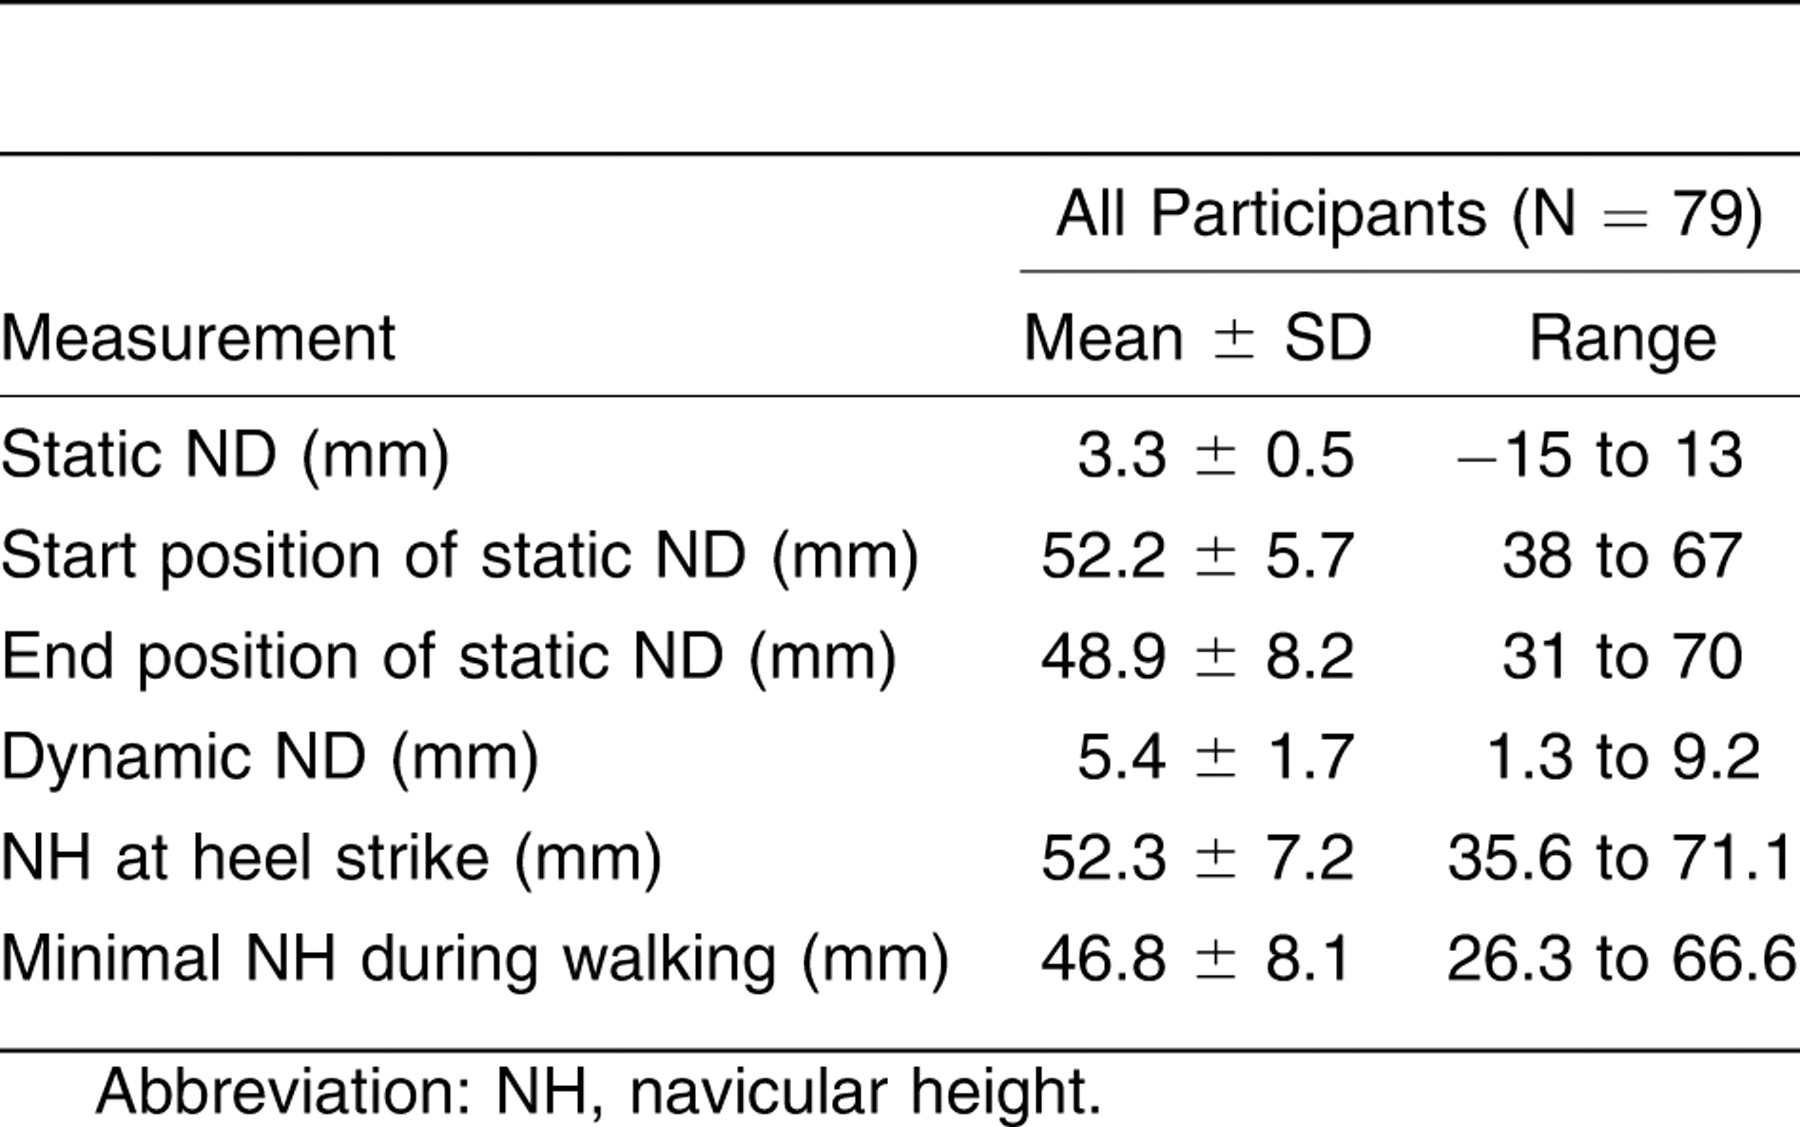
Static ND showed a significant correlation with dynamic ND (r = 0.357, r2 = 0.127, P < .001) (Table 2 and Figure 2A). Navicular height at heel strike demonstrated a significant correlation with navicular height at the start position of static ND (r = 0.756, r2 = 0.571, P < .001) (Figure 2B). Minimal navicular height was significantly correlated with the end position of static ND (r = 0.951, r2 = 0.904, P < .001) (Figure 2C).
Table 2. Results from Static and Dynamic Measurements of Navicular Position
Japma 102 00034 g004

Discussion

The purpose of this study was to investigate how well static ND correlates with dynamic ND. The results demonstrated significant relationships between static and dynamic measurements ranging from 0.357 to 0.951. The correlation between static and dynamic ND demonstrated that the static measurement can explain 12.7% of the variation in dynamic ND. Despite a significant correlation between static and dynamic ND, the two measurements are not equivalent. Figure 2A, with the corresponding 95% confidence intervals, shows a large variance around the line of best fit. When performing a clinical test, such as the static ND test, it is aimed at predicting dynamic function. Figure 2A illustrates that a static ND of 5 mm corresponds to 3 to 9 mm of dynamic ND in 95% of the participants examined. This reflects that an increase in static ND does not necessarily translate into an increase in dynamic ND.
To explain the low predictive value of static ND, the two components of this parameter were separately analyzed. We investigated whether Brody’s start position actually correlated to the height of the navicular bone at heel strike and, second, whether the navicular position during relaxed bilateral standing correlated to minimal navicular height during walking. Figure 2B contains a scatterplot with 95% confidence intervals of the correlation between navicular height at heel strike and navicular height at the start position of static ND according to Brody. Although there is a highly significant relationship between the two parameters, the static measurement can predict only 57.1% of the variation in navicular height at heel strike. In Figure 2C, the height of the navicular at the end position of Brody’s static test is plotted against the minimal height of the navicular marker during walking. The correlation between these two parameters is high (r = 0.951) and shows that the end position in Brody’s test can predict more than 90% of the variation in minimal navicular height during walking.
This finding corresponds to the results of studies by McPoil and Cornwall, [5,6] who used a different geometric expression for navicular position, the longitudinal arch angle. They identified a similarly high correlation between the longitudinal arch angle in static relaxed standing and the maximal longitudinal arch angle during walking [5] and slow running. [6] However, it may well be that the high correlation merely expresses a relationship between marker height in the static unloaded and dynamic loaded positions. [7] This relationship may just be caused by the fact that a marker that is, eg, placed lower in the static condition will also be lower in the loaded dynamic condition. It can be suspected that the high correlation between the end position in Brody’s test and the minimal navicular height during walking (r = 0.951) is a result of marker placement rather than a functional relationship between static and dynamic measures. [7]
The data from Figure 2B illustrate that the variation in navicular height at heel strike may partially explain the difference between static and dynamic ND. One possible explanation for this discrepancy is foot orientation at heel strike. If the foot is in a subtalar neutral position at heel strike, a high correlation is the result. However, McPoil et al [8] showed that there is a great deal of variation in the subtalar joint at heel strike among different participants. A static test predicting dynamic ND would require a start position that reflects navicular height at heel strike. However, this may be difficult because the muscle activity of extrinsic foot muscles may alter foot position just before heel strike and varies considerably between individuals. [8]
One possible limitation in this and similar studies is the use of superficial skin markers. We expect some error to be introduced by marker misplacement. A marker that is placed too low on the navicular bone would create a lower minimal navicular height during stance. This could mean that the observed navicular height measured in the static and dynamic situation could be affected by a marker placement issue. Because markers on the foot were not removed and repositioned during the static and dynamic measurements, we expect that marker misplacement would affect only height measurements (the start position of Brody’s test, the end position of Brody’s test, navicular height at heel strike, and minimal navicular height) and not measures of range of movement (static and dynamic ND).
Figure 2. Correlations between static and dynamic of navicular drop (ND) and navicular height (NH). A, Correlation between static and dynamic ND (r = 0.357, r2 = 0.127, P < .001). B, Correlation between NH at the start position of Brody’s test (Brody-start) and NH at heel strike (NH-HS), (r = 0.756, r 2 = 0.571, P < .001). C, Correlation between minimal NH during the stance phase (min-NH) and the end position of Brody’s test (Brody-end) (r = 0.951, r 2 = 0.904, P < .001). CI indicates confidence interval.
Japma 102 00034 g002
Another possible limitation of the present findings is that we were restricted to measuring movement of the midfoot in the sagittal plane. However, navicular height measures from a lateral view have been shown not to be sensitive to foot and camera alignment, [9] indicating that the findings in the study are not affected by the method used.

Conclusions

This study of asymptomatic individuals was unable to confirm that static ND (ad modum Brody) can be used to individually predict dynamic ND during treadmill walking. It was demonstrated that the start position of Brody’s test is not well correlated with the navicular height at heel strike, with this being the main reason for the weak relationship between static and dynamic ND measures. A high correlation was observed between the end position of Brody’s test and the minimal navicular height during treadmill walking, but it is likely that this high correlation has no functional relevance and is simply a result of variations in marker placement.

Financial Disclosure

None reported.

Conflicts of Interest

None reported.

References

  1. Razeghi, M and MEBatt. Foot type classification: a critical review of current methods. Gait Posture15:282, 2002.
  2. Brody, DM. Techniques in the evaluation and treatment of the injured runner. Orthop Clin North Am13:541, 1982.
  3. Matsas, A, NTaylor, and HMcBurney. Knee joint kinematics from familiarised treadmill walking can be generalised to overground walking in young unimpaired subjects. Gait Posture11:46, 2000.
  4. Jensen, K and JJuhl. Gait analysis by multi video sequence analysis. Photogramm J Finl21:2, 2009.
  5. McPoil, TG and MWCornwall. Use of the longitudinal arch angle to predict dynamic foot posture in walking. JAPMA95:114, 2005.
  6. McPoil, TG and MWCornwall. Prediction of dynamic foot posture during running using the longitudinal arch angle. JAPMA97:102, 2007.
  7. Rathleff, MS, RGNielsen, OSimonsen, et al. Perspectives for clinical measures of dynamic foot function: reference data and methodological considerations. Gait Posture31:191, 2010.
  8. McPoil, TG and MWCornwall. Relationship between three static angles of the rearfoot and the pattern of rearfoot motion during walking. J Orthop Sports Phys Ther23:370, 1996.
  9. Areblad, M, BMNigg, JEkstrand, et al. Three-dimensional measurement of rearfoot motion during running. J Biomech23:933, 1990.